The Role of ICT in Supporting Spent Coffee Grounds Collection and Valorization: A Quantitative Assessment


Department of Engineering and Architecture, University of Parma, Viale delle Scienze, 181/A–43124 Parma, Italy
*
Author to whom correspondence should be addressed.
Sustainability 2019, 11(23), 6572; https://doi.org/10.3390/su11236572
Submission received: 31 October 2019
/
Revised: 13 November 2019
/
Accepted: 18 November 2019
/
Published: 21 November 2019
(This article belongs to the Special Issue Sustainable Product Lifecycle: The Role of ICT)
Abstract
:As never before, there is nowadays the will to consider alternative energy sources from renewable and waste materials so as to preserve planet and society. One of the possible elements suitable for this purpose is every day in our houses: Coffee. Or rather, spent coffee grounds. Indeed, many studies in recent years have addressed its potential exploitation, especially for biodiesel production; recent works also pointed out its possible thermal valorization for industrial processes. In light of this, this paper proposes a new sustainable use of spent coffee grounds, converted into combustible pellets; this source can then be used not only for industrial heaters, but also for public or private buildings. To this end, a feasibility study of a pellet production plant fed by waste collected by vending companies operating in the North of Italy is developed, including the logistic model supported by an Information and Communication Technology (ICT) system to help gather spent coffee grounds from the different companies and collect them into the pellet production facility.
1. Introduction
Spent coffee ground (SCG), the most abundant coffee by-product (45%) [1], is a solid residue of fine particles with high moisture content (80%–85%) with organic content and acidity, achieved during the treatment of roasted coffee powder by steam or hot water for instant coffee preparation [2]. Many studies in recent years have addressed its potential exploitation, especially as a source for the extraction of bio-oils and for the production of biodiesel; recent works also pointed out the potential thermal valorization of SCGs for industrial processes, as emerged from different literature reviews [3,4]. Indeed, current production and consumption patterns generate large quantities of residues that need to be properly managed, in order to minimize their negative environmental impacts, as well as economic and social ones [5].
The reason of such interest in this special waste has to be found in its market volume: Just think that in 2017 the peak of worldwide production reached 9.6 million tons [6]. Moreover, Italy has a very diffused and appreciated culture for this drink: ICO (International Coffee Organization) data showed that the Italian coffee consumption in 2015 exceeded 340,000 tons of roasted beans [7]. Therefore, almost the same amount represents the limit for the Italian market in terms of SCG that could potentially be converted into energy, as an alternative to the usage of natural gas. Although it is a good fuel, during combustion, a substantial quantity of VOCs (volatile organic compounds) is generated [8,9].
In line with these considerations, the aim of this paper is to present a business plan of a project involving the gathering and collection of SCG from vending machines or other sources (logistics), processing and transforming them into combustible pellet (production), and technical consideration for combustion in domestic or industrial stoves (heating). On the basis of a previous study [10], the cost of the raw materials (i.e., SCG, pine sawdust) is almost neglectable when compared to the costs of the production plant; in particular, manpower and transportation (for SCG collection) are the most impacting costs to be deeply taken into account and analyzed. To this extent, the adoption of Information and Communication Technologies (ICTs) can dramatically improve the efficiency of the whole system, reducing production costs, and thus keeping the proposed thermal valorization economically feasible. Indeed, it was demonstrated in a recent study that the implementation of ICT has a positive effect on supply chain agility and economic performance in general [11], and on the efficiency of transport activities in particular; this is also the activity dealing with ICT in this study. To confirm this point, a case study has been carried out, evaluating four different scenarios (two including ICT system and two without an ICT system, considering two different pellet compositions, 50% SCG/50% pine sawdust and 98% SCG), to demonstrate that better results can be achieved with the deployment of ICT tools.
The reason for having chosen this specific product is that in the last year, the demand for biofuel pellets has significantly increased, causing a shortage of the traditional raw materials sawdust and wood shavings [12]. According to that, the contribution proposed here is multi-objective as it also provided a solution in this sense. Furthermore, as this study was carried out in Italy, results published from the United States Department of Agriculture in 2017 show that Italy leads the European consumption of wood pellets (approximately 3 million metric tons per year at the time of the research and expected to reach 5 million metric tons by 2020), and it turned out that this pellet is mostly imported from Austria, Croatia, Germany, Slovenia, France, and Czech Republic [13]. Considering this, we hope to encourage a local and alternative production so that numerous benefits could follow.
The remainder of the manuscript is as follows: In Section 2, a brief literature review on the current re-use of SCG is carried out, including both descriptive and qualitative aspects; Section 3 presents the methodology followed in the development of the research; the real feasibility analysis and its results are detailed in Section 4, followed by conclusions (Section 5), where future research directions are also provided.
2. Literature Review
This section provides a brief analysis of the published literature over the past years regarding the topic in question. Descriptive aspects were firstly investigated, followed by a general interpretation of contents, where the main usage of SCGs are highlighted.
To determine the sample of studies to be screened, two different queries were carried out on Scopus database on 16 October 2019 using two different combinations of keywords: In the first query, returning 23 papers, “coffee ground” and “pellet” were used as keywords; in the second, returning 178 papers, again “coffee ground” and the more general term “energy” were set. Fourteen manuscripts resulted in both queries and were considered just once; a paper referring to 2020 was also eliminated as, in terms of time, we restricted the sample to the current year; three papers were excluded as no information about the authors was provided. In light of these constraints, a final 183 writings were examined.
The first evidence we found in the literature concerning the possible re-use of SCG dates back to 1976, when Campbell et al. [14] presented their experiments on feeding steers and rats with rations in which coffee grounds replaced grain. From this moment to the 2000s, studies were rare and fluctuating, despite the introduction of terms like sustainability and sustainable development spreading from the 1970s and strongly affecting the direction of research of the following years, which may deal with a green valorization of coffee waste. It is then from 2015 that a significant increase of publications was observed, almost tripling in just four years, highlighting the relevance and the attention received by the topic, which is definitely expected to increase [15]. Figure 1 shows the trend in time of the number of publications.
Figure 2 instead reports the evolution in time of the documents in relation to their type, i.e., article (146), article in press (1), book chapter (5), conference paper (24), and review (7).
As can be seen from the above graph, most of the published works are journal articles; specifically, journals that turned out to be especially productive in numerical terms are Bioresource Technology and Journal of Cleaner Production, out of 115 journals recorded, overall. It is worth mentioning the seven literature reviews that were found, which were very helpful tools allowing one to identify scientific trends. For instance, by comparing the first literature review carried out in 2011 [2] and the last, published in the current year [15], both dealing with different utilization of SCGs, what emerges is that new methods for extracting oil from SCGs and producing biodiesel were developed, as well as the new biodiesel production bypassing the oil extraction or even the usage of SCGs for fighting cancer cells in the human body and other interesting and advanced issues not considered before, providing coffee waste as a raw material for other processes. The utility and diffusion that literature reviews provide are also demonstrated by the fact that results from the citation analysis on the sample of articles reveal that they are the most cited works, with an average of 10.7 citations per year, compared to an average of 3.8 citations for journal articles, 1.1 for conference papers, 1 for article in press, and 0.7 for book chapters. Again, concerning the quotation analysis, Table 1 shows the journal articles with an average value of more than 10 citations per year, and thus particularly relevant in this field.
As far as the content analysis, due to the high number of studies returned by the two queries, we carried out an investigation on the main keywords found (considering the first nine keyword listed in each document). First of all, we removed 25 papers from this step that have no keywords (specifically, 15 journal papers, 8 conference papers, 1 review, and 1 book chapter); according to that, the number of papers considered here is 158. Manual adjustments were also made on the keywords, for instance on singular vs. plural words, acronyms, main synonymous terms, or uppercase vs. lowercase letters to ensure uniformity and rigor, as well as to avoid redundancies and repetitions. A total of 386 keywords was identified, 79% of which occurs just once. By excluding, for obvious reasons, the nouns “spent coffee ground”, “coffee ground”, and “coffee”, which could distort results as they were used to run the original queries, we identified the frequency for each keyword, i.e., the total number of times it occurs, and the persistency, i.e., the number of years of presence in literature, computed by considering the first and the last appearance, in order to evaluate trends, according to suggestions of Fadlalla and Amani [27]. The resulting graph (shown in Figure 3) is included, to make the graph more effective.
Four main classes were identified, according to the frequency and persistence own by the keywords: (1) Trendy topics, (2) abandoned topics, (3) emerging topics, and (4) old trendy topics. The list of the keywords is shown below, according to their subdivision into classes.
Trendy keywords are those with high frequency and persistence, meaning the topic they represent is widespread and popular, as well as studied and well-established in literature. Among these, we in fact found terms like biodiesel or biomass, included in the wider class of biofuels, whose production turned out to be the favorite green usage of SCGs. Also, the production of activated carbon, which has strong adsorption properties, has been studied and deepened by many authors [28]. On the contrary, abandoned themes, which should have had lack of popularity for a short time (i.e., both frequency and persistency low), have emerged as being represented from keywords like adsorption, energy storage, fatty acid, and gasification. In this case, some clarifications are appropriate: The limited presence of the keyword adsorption is in conflict with what has just been written regarding the usage of the activated carbon; a possible justification for this fact is that SCGs can be directly used as adsorbents or through the activation of the carbon within. In light of the results provided by McNutt et al. [15], this second origin is more common, with the most appropriate keyword “activated carbon”. Fatty acid also owes its scarcity to being almost synonymous to biodiesel. This is the reason that while introducing the “abandoned” class, the verb has been conjugated in the conditional tense. In conclusion, this part of the graph turned out to be almost empty, and this is further evidence of the relevance of the topic. Old trendy keywords, namely waste management and combustion, are those that have gained particular attention in the past (high frequency) but their persistency is low; this is attributable to the fact they were replaced by other emerging concepts such as circular economy, recycling, or valorization for waste management, while combustion may deal with the bigger family of biofuels, and since nowadays it is desirable to focus on alternative sources not harmful for the environment and society, keywords recalling that are preferred. Another possible justification for the fact that the term “combustion” belongs to this section of the graph, is that SCG is a very poor material, whose cost for collection is significantly greater than the savings deriving from the combustion. According to this consideration, valorization options other than combustion, allowing the collection costs to be at least compensated, are preferable. Hence, we focus on this old trendy theme with the aim to show that the economic profit achievable through thermal valorization is tangible; consequently, an even higher return could be expected for solutions that already give profits and economic advantages. Finally, most of the keywords identified belong to the class of the emerging topics, started spreading in the last years. Emphasizing new developments, among these keywords we found, e.g., expressions such as antioxidant; in fact, it was demonstrated that natural antioxidants can be recovered from SCGs through solid–liquid extraction for biodiesel production [29] and also for human nutrition. SCGs are a source of antioxidant insoluble fiber as well as of essential amino acids and low glycemic sugars, resistant to thermal food processing and digestion [1]. Since 2015, the processing of carbon has been refined and carbon nanosheets were produced starting from SCGs, e.g., [24,30]; as a consequence of this, another new popular issue at the moment is the production of sustainable anodes for lithium-ion batteries, e.g., [31] or [32]. Finally, among these main outcomes, it should be emphasized that the term pellet, the fulcrum of this research, was found in the class of emerging topics.
To sum up, the results of the above analysis show that different ways for an alternative use of SCGs are considered and proposed in literature. Numerous studies promote re-use of SCGs in a non-energetic way: From geopolymers, to adsorption of pollutants for water treatments, to the aid of mushrooms growing, to ruminant feed [33,34,35,36]. All those reutilization options are interesting, but they do not consider energy exploitation for mass purposes. Despite that, bio-mass valorization, combustion, and oil production are trendy topics for SCGs recovery. Kondamudi et al. [19] proposed an energy re-use of SCGs through oil extraction by making pellets from the SCGs. The oil derived from the SCG and the solid residue after extraction can be used to produce biodiesel and electric energy using the system proposed by Allesina et al. [37]. In addition, the solid residue can be pelletized for being used as a more flexible fuel in a downdraft stratified gasifier [38,39].
As the focus of this paper is to evaluate the feasibility of the thermal valorization of SCGs converted into pellet, it is worth mentioning the work by Kondamudi et al. [19], which has already been introduced in the above paragraph and is also one of the most cited documents in literature. These authors first proposed the alternative use of SCGs as pellet; they demonstrated that SCGs can be a potential source for the production of biodiesel as well as fuel pellets resulting from solid waste: The proposed method consists of a preliminary extraction of oil from the spend material, followed by transesterification of triglycerides to fatty acid methyl esters. One of the main advantages that emerged is that biodiesel from coffee ensures better stability than biodiesel from other sources and turned out to be also cost-effective compared to other solutions available. At the time of the paper, if both biodiesel and pellets could be marketed, the profit was estimated to be more than $8 million/year starting from the waste generated by Starbucks stores in the United States. Four years later, Zuorro and Lavecchia [26] in their study, whose main aim was to investigate SCGs as a potential source of phenolic compounds, also considered the energy potential before and after the recovery of phenolics to determine their suitability for producing pellets, briquettes, or other agglomerates for heating purposes. They collected SCGs from coffee bars and spent coffee capsules around the city of Rome, which were then submitted to a solvent-extraction procedure aimed at assessing the amount of phenolics that could be recovered; subsequently, the solid residue remaining was assayed for its calorific value, either alone or in combination with different amounts of sawdust. Results show that from a solid waste of 9600 tons, adding 20% sawdust would lead to over 11,000 t of pellets with a heating value of about 22 MJ/kg. Finally, a very interesting and recent issue is proposed by Lisowski et al. [40], which goes beyond the simple production of pellets from coffee waste by studying the effects of SCGs compaction process on the strength properties of biofuels pellets; from their results, there is evidence that high-strength fuel pellets (i.e., pressure > 1.0 MPa) could be produced from SCGs at a suitable moisture (<20% w.b.) and die height (60–70 mm).
In conclusion, despite the literature reporting several studies about the thermal use of coffee residues through pellet production, no studies considered the integration of these ideas with a feasibility study. Nonetheless, the energy demand and the disposal of spent coffee could bring to the community a combined solution: The collection and the reuse of SCGs shaped into combustion pellets for heating private and public buildings. A logistics model supported by an ICT system for collecting them form vending companies, or other sources, and processing them into combustion pellets, shall be considered to evaluate the technical and economic feasibility of such solution. This transition to a renewable source leads to three main goals: Significant savings for the end users, reduction of CO2 emissions in the atmosphere, and valorization of a valued bio-waste.
With the model presented in this paper, we try to fill this gap by suggesting transforming SCGs, produced by vending machines and collected by operators dedicated to their refilling, into bio-pellets (agri-pellet) to satisfy the energy demand for heating, and by computing the resulting costs and the achievable revenues. Furthermore, the logistics model for SCGs collection can also be suitable for other possible ways of exploitations, and thus be seamlessly connected with the abovementioned research topics.
3. Material and Methods
3.1. Feasibility Study Procedure
The feasibility study for the SCG pellet production was structured according to the following steps, which will be detailed in the subsections that follows:
- Logistics model: As a first step, a logistic model was built to estimate the cost in order to collect the required SCG quantities from the different vending machines companies. Firstly, after having identified these companies, relevant data about the amount of SCG produced and the quantities collectable were retrieved thanks to direct contacts with these companies as well as from a questionnaire survey involving approximately 200 of them; further data useful to model the transport activities were retrieved from the Italian Ministry of Infrastructures and Transport. Second, thanks to the acquired information, the real logistics model was developed, and it was then applied to the case study in question both with the ICT tool support and without.
- Plant design: Details about pellet production plants were retrieved from Smartwood S.r.l. (www.smartwoodsrl.com), a leading Italian company in pellet production plant engineering. The number and location of the plants was defined according to the outcomes of the logistics model and, starting from them, it was possible to identify the pellet production amount, the total costs incurred, and the consequent revenue deriving from the whole process.
- Pellet usage: As far as the pellet destination is concerned, two possible scenarios were considered. In the first one, it is hypothesized to produce pellet composed of 50% SCG and 50% pine sawdust; the related usage is feeding of domestic stoves. In the second scenario, the alternative pellet composition (98% SCG and 2% corn starch) was considered. This kind of pellet cannot be used for domestic purposes but could be used for industrial or communitarian purposes.
3.2. Experimental Procedure
The third step of the feasibility study was supported by an evaluation of the heating value of the pellet that could be produced from SCGs. To this end, about 5 kg of SCG were collected from vending machines sited in the University of Parma. Once dried, the SCG is mixed, in different ratios, with pine sawdust in order to obtain pellets with different compositions. The resulting products are shown in Figure 4.
The lower heating value (LHV) of pellet increases proportionally with the quantity of SCG; hence, two different pellet compositions were studied:
- Pellet composed of 50% SCG and 50% pine sawdust. This kind of pellet is suitable for usage in feeding domestic stoves (with an LHV of 18.8 MJ/kg compared to 17.25 MJ/kg of pure pine sawdust pellets);
- Pellet composed of 98% SCG and 2% corn starch as ligand (having an LHV of 20.6 MJ/kg). This composition exploits the recycling potential of SCGs.
Both compositions can be certified in accordance to EN 17225-6 regulation about non-woody pellets; it should be mentioned that local restrictions in some Italian regions allow the usage of class A1 pellet in accordance to EN 17225-2 only in urban environment.
4. Feasibility Analysis
4.1. The Logistics Model
When looking at SCG as raw material, it must be immediately noticed that it is a highly distributed source, being a kind of waste that can be produced by end users, public bars, ho.re.ca. (hotel, restaurant, and catering) operators, and vending machine companies. These operators are listed in ascending order of SCGs production capability; in fact, end users are well spread over the territory and produce low per capita quantities, while vending machine companies cover a wide area (typically a city and connected hinterland) and gather the SCGs to their headquarters during the refilling process.
The following study analyzes the potential collection of SCG from vending machine companies in the North of Italy and the production of coffee pellets in four main production plants. Analyzing the distribution of vending machines companies over the Italian territory (Table 2—source: www.beverfood.com), the best possible scenario assumes four production plants located in the most densely populated regions of Northern Italy; the selected cities for the production plants are Bologna (Emilia Romagna), Milano (Lombardia), Torino (Piemonte), and Padova (Veneto). The choice of these cities was made considering the concentration of companies in the possible locations, with the major aim of minimizing the distances during the SCG collection process.
To develop an effective logistic model describing the SCG collection process, an estimate of the quantities of SCGs potentially collectable in each geographic region was made.
As already shown in Table 2, 913 companies are located in Italy, owning a total of 415,488 installed distributors, and selling more than 2.7 million coffees. It is assumed that each cup contains 7 g of coffee, equivalent to 14 g of coffee grounds (humidity at 50%–60%). These data were obtained from interviews with the management of one of the major Italian operators, for the sake of confidentiality anonymous, counting more than 800 in-field operators, 950 replenishment vans, and 23 logistics centers located in 16 regions.
To determine the number of distributors in each geographic area of Italy, as well as to compute the relative number of coffees sold, a weighted average was computed, taking into account the number of companies of each region (although the companies’ size was not taken into account). Results are detailed in Table 3; specifically, in the last column, the estimated tons of SCGs collectable are highlighted.
From the data in Table 3, the average amount of tons produced by a single company in a year can be easily deduced and accounts for 42.2 tons/year, corresponding to about 3.5 tons/month. Following a precautionary approach, it was assumed to collect 2.1 tons from each company only (ca. 60% of 3.5); this estimate results from a survey phase involving the companies associated with Confida (the Italian Association for Automatic Distribution), which declared to collect approximatively this amount of SCGs. More precisely, during this survey, a short questionnaire was sent by email to the targeted companies, to understand whether the companies were working in the cold or hot beverage sector and, in the second case, if they were collecting SCGs back to the local headquarters. Thanks to this survey, it was also possible to identify the real number of companies performing collection, namely 71% of them; the effective number of SCGs collected was adjusted accordingly. Table 4 reports the main indicators of the four main regions:
The logistics model has been built as follows. At first, for each region, the distribution of the companies over the main cities was considered; as an example, Table 5, referring to the case of Lombardia region, reports the overall number of companies, the companies collecting SCGs, the distance between the city and the main production plant, the distance between different companies in the same city, and the highway toll to cover the distance between the city and the main production plant (which, for the Lombardia region, is assumed to be sited in the capital city of Milano).
According to the different payloads of the transportation vehicles considered (2.5, 6.7, or 12.5 tons), for each city, the maximum numbers of visited companies daily was computed, recalling that each company provides about 2.1 tons/month of SCG, and it is visited once per month. A working time of one shift was assumed to this end. Finally, for the whole region considered and its pellet production plant, the number of required working days per month and the total transportation costs were computed. Note that distances and highway tolls were determined according to the websites www.viamichelin.it and www.autostrade.it.
The collection system must be done with heavy vehicles, running a typical journey, which consists of high-speed roads (i.e., highways) for 64% of the path and low-speed roads (i.e., urban areas) for the remaining 36%. In the model, three different types of heavy vehicle are considered, whose characteristics, obtained respectively from their parent companies’ websites, are summarized in Table 6; some main assumptions of the logistic model were derived from these characteristics and are summarized in Table 7.
The loading time of 20 minutes is justified by the method of collecting coffee grounds: The common practice is to handle them in big bags, which contain up to a ton of SCGs. With the information taken from Table 5, the total travel time T was estimated using the following formula and taking into account the kind of vehicle and the number of stops:
where = total distance traveled [km], = average speed of the vehicle [km/h], = loading time for each site/company (20 min), and = number of stops (i.e., the number of companies visited for an FTL, as per Table 6).
To apply Equation (1), the total traveled distance is needed; this can be easily calculated, according to some clarifications. First, as already recalled, although every company has a potential average production of about 3.5 tons of SCGs per month, the collection rate was assumed to be lower (60% of the total amount, corresponding to 2.1 tons/month). Second, according to data in Table 5, N2 Van must cover the total distance outward–stop–return for every roundtrip multiplied by the number of stops, N2 truck has to stop three times to saturate the vehicle, and N3 truck has to stop five times to complete the full load.
Using the total travel time formula and taking into account the full load limits of the vehicles (Table 6) and the maximum daily working hours (Table 7), the optimal number of stops per day and the distance traveled in a working day can be easily determined for every route (grouped by region). The resulting outcomes for each vehicle are collected in the following tables (Table 8, Table 9, Table 10 and Table 11).
For every vehicle considered and for every region, the main performance indicators were determined, namely the daily number of stops, the daily distance travelled, the daily working hours required to travel this distance, the monthly toll cost, the number of days per month required to collect SCG, and the monthly average distance needed to collect SCG (Table 12).
Outcomes reported in the previous table were computed as a sum of all the contributions of terms of working days, distances, and toll costs of every city; such data are useful to estimate the required monthly transportation capability, but it is not useful in the daily managing routine. The number of working days per month required to collect SCG was rounded to the upper half-day to take into account the manual management of trucks and routes, as well as a possible lack of efficiency in trip scheduling and load saturation.
As a partial result of the model, which is not reported in detail for the sake of brevity, for each city, the data in Table 13 are available (Brescia’s data are taken as an example).
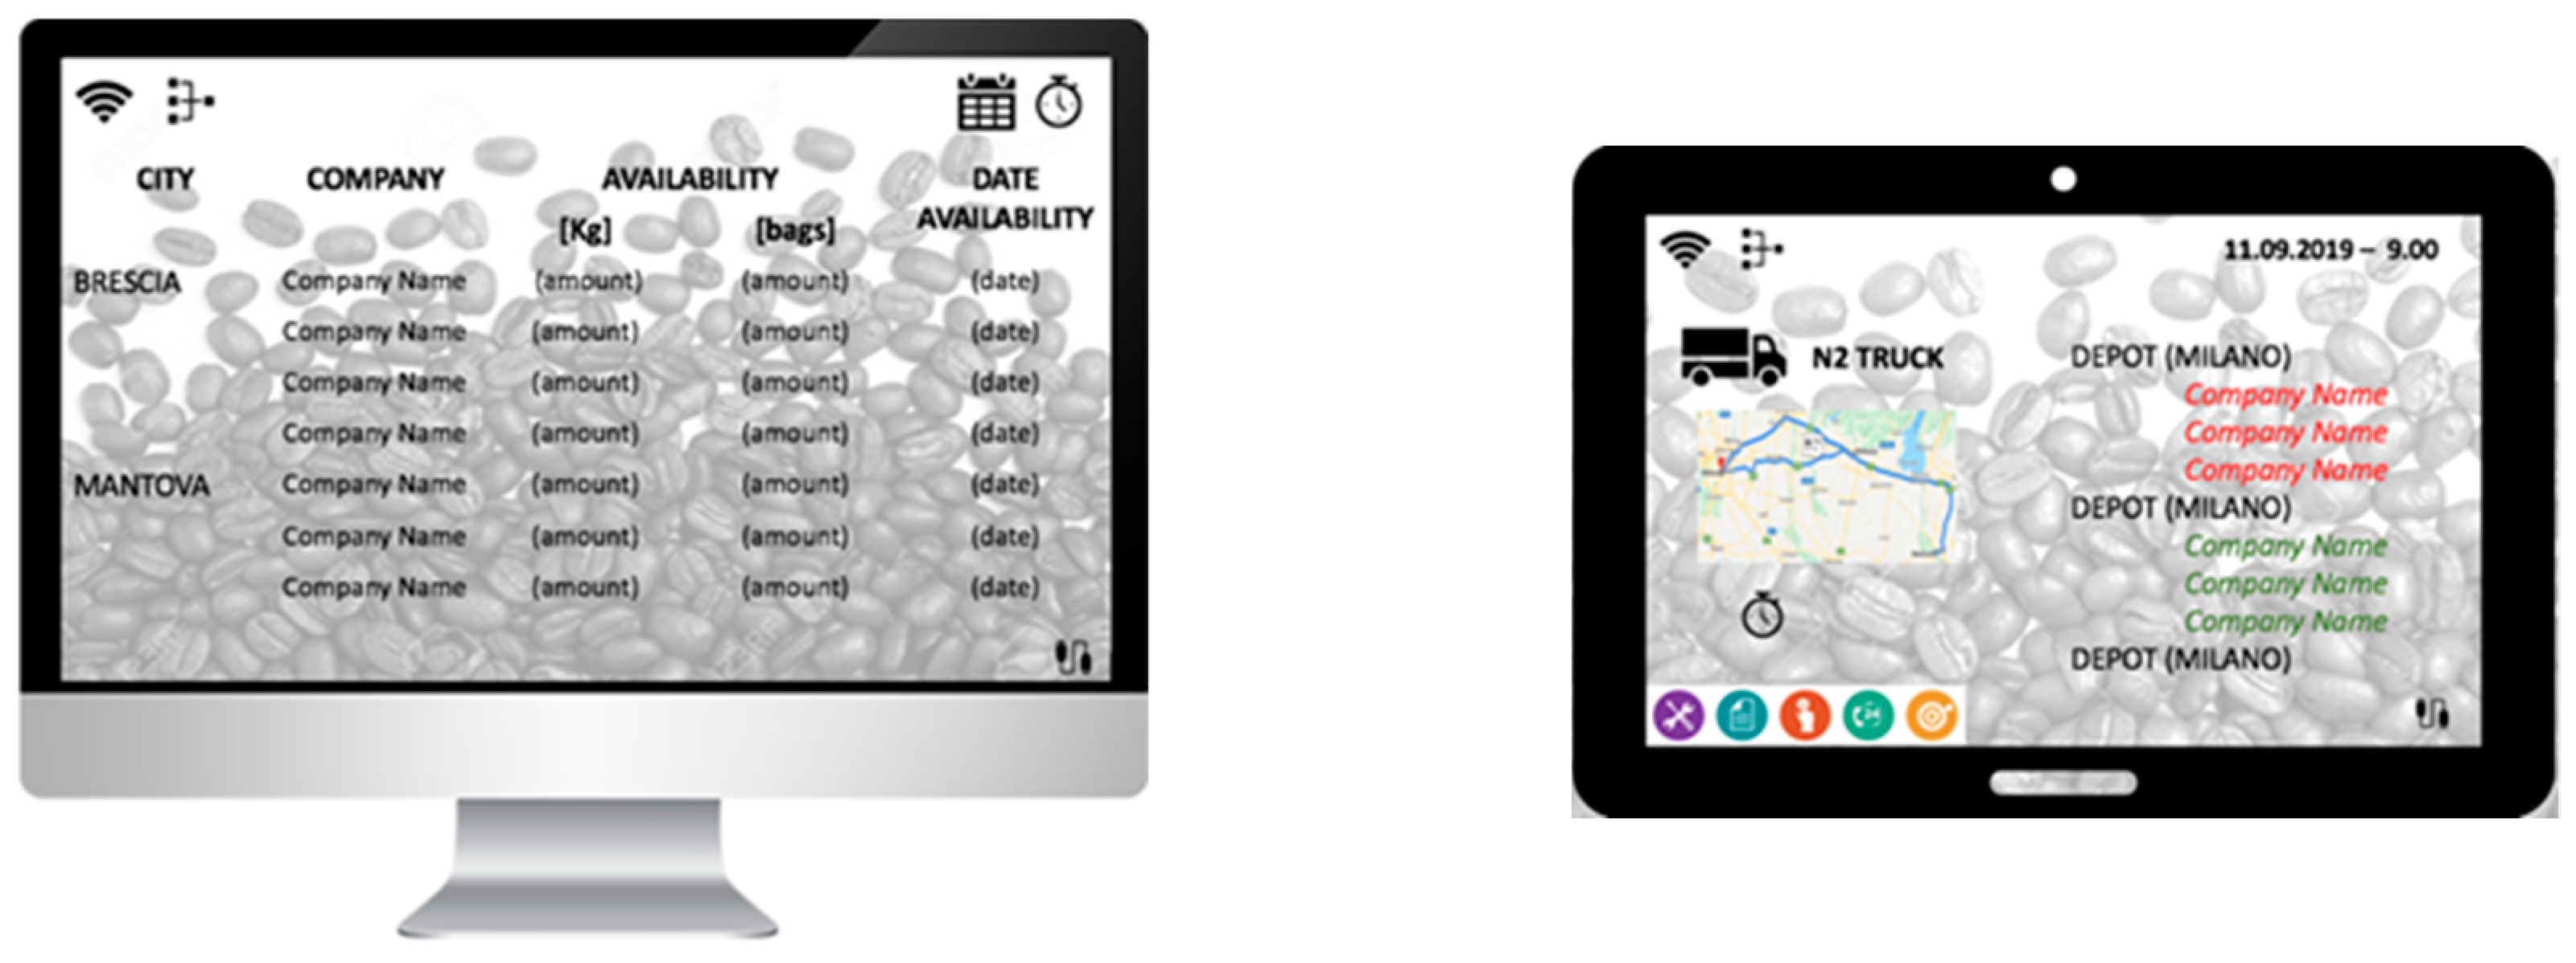
To effectively schedule the transportation of SCG from different cities and companies and to rise the efficiency of the vehicles, an ICT system is absolutely required. This could be in the form of a transportation management system (TMS), which can help enhancing route and mode planning, information transfer, tracking and tracing, and many other aspects related to the transport activities [41]. The main advantage of adopting an ICT system is that it is possible to use the raw data produced by the model, avoiding any rounding. If doing so, outcomes in Table 13 would be modified as shown in Table 14.
In fact, the logistics model indicates that the N2 Truck, in a day, can load SCGs from six companies (2 FLT); the missing information is the name of such companies. We know that a N2 Truck has to travel from Milano to Brescia two times per day (visiting six companies) for 3.3 days in a month (to visit 20 companies); it is not known, however, which companies have to be visited on which days of the month. ICT is required to schedule the transportation of SCGs: The system collects data from the different vending companies and automatically computes the best routes (cities and companies) for each working day, allowing the maximum SCGs collection and trying to reach a full truck load (FTL) transport. To this end, data relating to the availability of quantities to be collected should be shared between the companies and the system and could be managed via mobile networks and Internet. As an example, the best transport scheduling may encompass a trip to Brescia and one to Cremona in the same day, according to SCG availability and respecting one working shift and may not be taken into account without a tool of this kind. Detailed data have been provided in Appendix A, Appendix B, Appendix C, Appendix D, Appendix E, Appendix F, Appendix G, Appendix H, Appendix I and Appendix J.
Figure 5 shows the interfaces of the remote located monitor where data from the companies are collected, in terms of the available quantities and the date in which these quantities are ready to be collected. The second part of the figure shows the screen of the tablet in which the operator has at his disposal the route he has to cover in a given day to optimize the collection process.
By analyzing the obtained data, it can be seen that for all the considered production plants, a single N2 or N3 Truck vehicle is enough to ensure the operation of the pellet production plant on three work shifts, with a good saturation of the transportation system. For this reason, regarding the truck, only the purchase option has been considered, whose economic data are shown in Table 15; outsourcing has been neglected in order to reduce the costs. This table reports the operational costs for a third-party logistics (3PLs) in accordance to data provided by the Italian Ministry of Infrastructures and Transport.
The overall transportation costs for the four different production plants are summarized in Table 16 and Table 17.
As it can be noticed, when adopting ICT tools the best solution for SCG collection is represented by a N3 Truck, having the lowest costs for the four plants considered. The choice of N2 Truck is still feasible and could be supported by the need for a smaller and more agile vehicle according to the specific routes, although costs are a bit higher compared to the N3 Truck. No matter the considered region, the ICT adoption guarantees high savings in transportation, up to 26%, as shown in Table 18.
All the above considerations hold true when assuming that the pellet manufactured consists of 50% of spent coffee ground and 50% of sawdust, suitable for usage in feeding domestic stoves according to the previously mentioned classification. Instead, if the pellet has a different composition (98% SCG pellet), the amount of exhausted coffee needed is greater, almost doubled. For this scenario, an adjusted logistic model was developed assuming the collection of 4.1 tons/month in every company visited. In this situation, the number of stops needed for a full load truck are different from the previous ones and they are shown in Table 19; N2 Van is not suitable because of the low payload. The remaining assumptions are still valid in this scenario.
In the light of these new assumptions, an N2 Truck or an N3 Truck are needed to collect the necessary amount of SCGs. As for the previous scenario, by using the total travel time formula (Equation (1)), the optimal solution of number of stops per day and distances traveled in a working day (for every route and grouped by region) can be easily computed for this new scenario. Again, the approach is the same as described above taking into account two different options according to ICT application; the following table summarizes the resulting data.
The overall transportation costs in this case for the four different production plants are summarized in Table 20 and Table 21.
Again, it can be noticed that when adopting ICT tools, the best solution for SCG collection is the usage of an N3 Truck, which exhibits the lowest cost for the four plants considered. The choice of N2 Truck is no longer profitable, as the cost is much higher compared to the N3 Truck. Moreover, no matter the considered region, the ICT adoption guarantees relevant savings in transportation, up to almost 13%, as summarized in Table 22:
To sum up the development of the logistics model, the flowchart in Figure 6 reports the different steps of the procedure.
4.2. The Production Plant
Once the logistics model has been detailed and transportation cost estimated, a possible exploitation of the collected SCGs in a real production and transformation plant has been evaluated, considering the adoption of ICT for transportation to reduce the related costs. According to the literature analysis performed, the theme “combustion coffee” is categorized as an old trendy topic, meaning that it has been deeply investigated and reached a certain degree of maturity; it is thus suitable for a real case study. Moreover, the study of a production plant involving coffee pellet allows the comparison between transportation costs and other production costs in an average scenario, which is well-consolidated and not experimental, making the economic outcomes more tangible and realistic.
No matter the pellet composition and the related amount of SCG quantities, the general assumptions shown in Table 23 have been made for the production plants (the table refers to the case of Milano, which is taken as an example). The following tables, i.e. Table 24 and Table 25, represent respectively the tons and the bags of pellet which can be produced, depending on the work shfts emploied.
Concerning the pellet production plant sited in Milan, work schedule is hypothesized as follows: A single operator controls and manages the whole activity of the plant, including dryer and bagging station, for the plant highly automated and managed by ICT controls. Another person (e.g., an accountant) is a shared resource among the four plants and deals with administrative and commercial tasks. Related costs are summarized in Table 26, according to the number of shifts.
The hourly cost of the employees can change as a function of the number of shifts, as night work costs much more compared to the daytime work. Hence, when considering three shifts, the average employee cost changes as well.
Regarding the resale price of the 15 kg pellet bag, presented in Table 27 below, the price of a bag sold in a retail store is assumed as benchmark and a retail model is assumed for the pellet with 50% SCG and 50% pine sawdust.
The cost of the facilities needed to host each production plant was estimated assuming a unitary cost of 55.00 €/m2/year, derived from ISTAT (Italian Institute of Statistics) data on industrial facility rental in the Province of Milan; this is one of the most expensive cities of Italy, therefore the total cost (including the remaining three facilities) is probably overestimated, as a precaution.
As far as it concerns the SCG transformation into pellets, the production capability of 0.5 ton/h (as reported in Table 24) is a tradeoff between costs and size of the production line, as reported by one of the leading Italian manufacturers (Smartwood S.r.l). A typical wooden pellet production plant is described below.
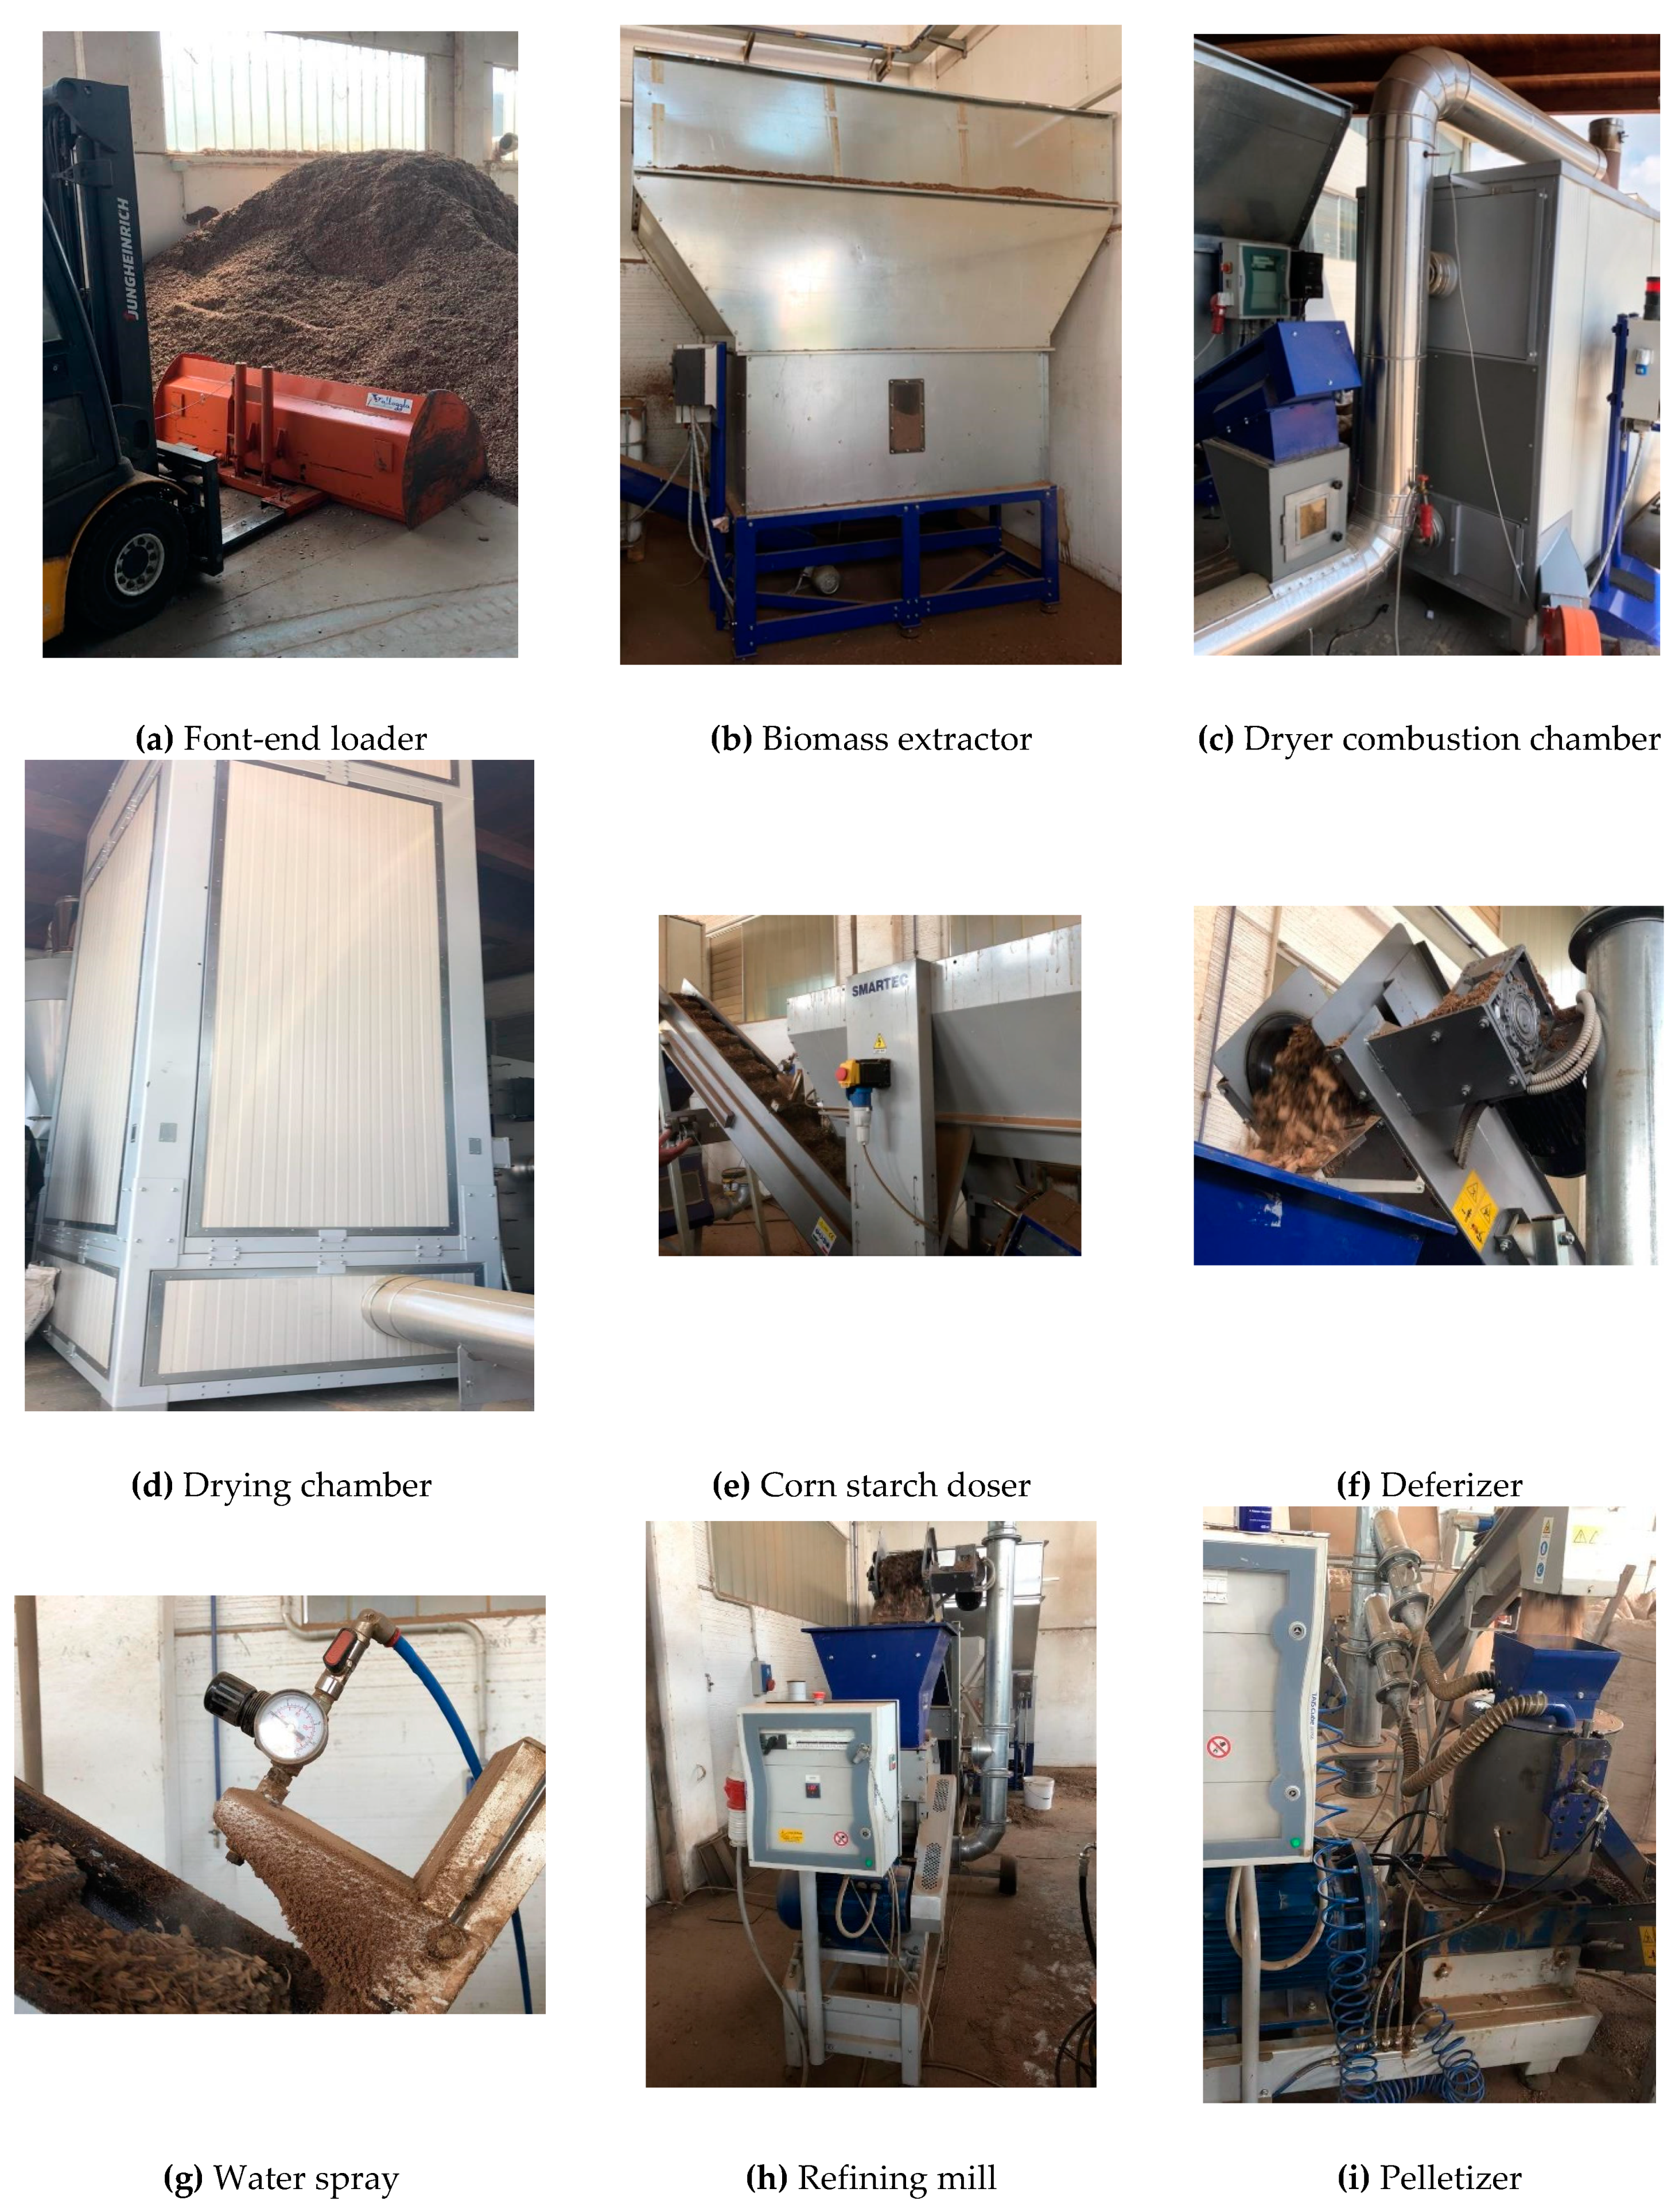
The production process starts with a wood shredder, in case the biomass supplier does not provide woodchips. After this preliminary operation, large wood splinters are stored in the warehouse waiting to feed the plant. The next transformation is a further size reduction and mixing: By means of a front-end loader, the splinters are placed inside a large container equipped with low speed rotary blades called biomass extractor. The wood chips are then placed into the dryer machine where the hot fumes produced by the combustion of a generic fuel (usually the same pellet) exchange heat with the wood chips, causing the evaporation of part of the water contained in the wood, and thus reducing the humidity.
At the end of the path inside the dryer, the wood chips are loaded onto a conveyor belt, on which three important operations take place: The first consists of adding corn starch as ligand and it is performed by a special dosing device; the second is to increase the humidity to the optimum value of about 10% by means of a nozzle spraying water; the third consists of removing metal materials by means of a deferizer mounted directly on the top of the belt. In the case of SCG pellet production, dry coffee powder should be added at this stage.
The wood chips are then sent to a refining mill equipped with a large number of high-speed rotary blades; the size of the chips is thus further reduced. After the mill, wooden material is handed to the pelleting machine loader. Inside the pelletizer, the last and final transformation of the wood takes place: The pellet is produced by compression and then sent to the cooler on a belt conveyor. The process ends with the last stage on a vibrating sieve that uniforms the flow of pellets to the conveyor belt feeding the bagging station.
Once the process steps of the production of wood pellets has been defined, it is necessary to provide some more details inherent in the machinery that carries out these transformations and passages in Figure 7 and Figure 8.
The layout and size of the plant, and thus the hosting building, have been provided by Smartwood S.r.l.; a possible scheme is proposed in Figure 9 and Figure 10.
The production system is quite compact, covering a total area of about 100 m2; this area must be increased because of storage areas (for SCGs and pine sawdust) and sales areas, thus assuming a total amount of 300 m2. Related costs are summarized in Table 28.
Table 29 reports the electrical power consumption of the equipment for the pellet production plant; the energy bill is then evaluated assuming this plant working at full power 24 hours/day and 235 days/year, with an energy cost of 0.17 €/kWh. The most heat-consuming machine, the dryer for SCGs, burns part of the produced pellets; in particular, its energy requirement is equal to 10% of the pellet production.
The overall economic data for a 50% SCG pellet are detailed in Table 30. From this table, it is immediately noticeable that the efficiency of the logistics system is an important aspect, as the transport activities affect the total cost of pellet production up to 20%. The purchase of pine sawdust and energy are further relevant cost components (accounting each for about 20% of the total cost). Manpower cost affects the total cost to the greatest extent (from 35% to 40%).
The overall economic data for a 98% SCG pellet are described in Table 31. Again, this table confirms that the efficiency of the logistics system plays an important role in the determination of the total cost, with a share greater than that observed in the previous scenario, because of the higher amount of SCG to be collected and transported. To be more precise, the transport activities affect the total cost of pellet production up to 36%. The purchase of pine sawdust is no longer required, while energy is still a relevant cost component (accounting for about 20% of the total cost). Manpower cost affects the total cost to the greatest extent (31% up to 42%).
The monthly cost of pellet production is about 30,000 € for every plant except Milan, with almost € 40,000; each cost item was rounded up to avoid too optimistic results.
Performing a net present value (NPV) assessment allows one to point out how each production plant can be profitable and, on the other side, to stress that the high sales incomes, due to the retail model assumed, should be better investigated in terms of its acceptance by the customers and real feasibility. Thus, to complete the analysis, the NPV of the investment over 10 years was also evaluated. To this end:
- An average increase in transportation cost of +0.5% per year was assumed, taking into account a possible increase in highways tolls and fuel cost;
- Similarly, the facility rental was increased by 0.5% every four years, taking into account the typical duration of leases in Italy;
- The manpower cost was updated yearly applying the salary adjustment suggested by ISTAT (0.3%);
- The amount of pellet produced from SCG was always assumed to be completely sold; however, the average selling price was varied from 0.10 €/kg (wholesale price—pessimistic scenario) to 0.23 €/kg (retail price—optimistic scenario) for 50% SCG pellet, and from 0.05 €/kg to 0.10 €/kg for 98% SCG pellet, considering a different mix of products sold;
- An interest rate of 0.96% was assumed.
Results of the NPV evaluation are proposed in Table 32 for the four production plants manufacturing 50% SCG and 50% pine sawdust pellet and assuming 2.1 tons of SCG collection per company per month; ICT tools adoption has been considered, thus having the maximum efficiency of the SCG collection with a N2 Truck. As this table shows, for all four production plants considered, the profitability of the investment is strictly depending on the selling price of the pellet bag, and thus the retail model adopted, with all the other costs being very similar among the considered plants. The bigger the quantity of pellet directly sold to end users (0.23 €/kg), the more profitable the investment. Accordingly, the choice of spreading the production capability over four plants located in four regions is meant, on one side, to minimize the overall transportation costs reducing the routes length, and on the other side, to enable the possibility to sell the 15 kg pellet bags to end users in a shop corner in the same facility. Labor is the greatest cost for all analyzed scenarios, approximately doubling transportation costs; thanks to the industrial automation of the production plant only one operator per working shift has been considered. The possible adoption of ICT technologies for supervising the plants may lead to some savings; in fact, an increase in the plant automation connected to ICT infrastructure could make feasible a “2 operators over 3 shifts” scenario. Operators working during the daytime shifts can manage the plant and prepare it for the night shift, which will be unattended but remotely supervised; in another hypothesis, only one plant operator could be involved for both daytime shifts thanks to the integration of his work with the truck driver, who may supervise the production and check the plant every time the vehicle is unloaded.
Table 33 instead reports the NPV calculation for four production plants manufacturing 98% SCG pellet and 4.1 tons of SCG collection per company monthly; again, ICT tools adoption has been considered, thus having the maximum efficiency of the SCG collection with a N3 Truck.
As it can be noticed, increasing the quantity of SCG to 98% into the pellet does not lead to any significant cost reduction; in fact, the higher transportation cost is almost balanced by the reduction of purchased raw materials. Moreover, the produced pellet has more restrictions, as it can be burnt only in industrial boilers; as a consequence, the selling price is significantly lower, causing the unprofitability of the investment in any scenario.
5. Conclusions
This study has provided an economic evaluation of the production of pellets from SCGs and its potential usage for domestic or industrial purposes. The evaluation has dealt, in particular, with the determination of the logistics cost required to collect the SCGs from vending machines companies and with the design of the pellet production plant. Specifically, as far as the logistics aspect, a transportation management system, namely an ICT tool, was implemented to optimize the routes vehicles have to travel to collect the SCGs from the different companies in different cities.
This study contributes to the literature in different ways. First, an exhaustive analysis of the studies dealing with the SCGs valorization has been proposed, identifying the “trendy” topics, the “new” ones, and the topics that were investigated years ago and have reached a good level of maturity. Second, a detailed logistics model has been developed to evaluate the total cost associated with the collection and valorization of SCGs. Such a model is the starting point for any profitability evaluation of SCGs reuse, as collection activities are of fundamental importance to this end. Moreover, it can easily be implemented in other fields involving the mere activity of collection. Looking at the results, the model demonstrates the economic advantage of collecting SCGs and using them for producing pellet that can be sold on the market. In this respect, the proposed model can be adapted and implemented in other fields, to evaluate alternative SCGs valorizations systems. Other ways of exploitations and the relating profits could also be evaluated. This represents an interesting future research direction, whose results could be compared to those reported in this study.
As a third point, the impact of adopting an ICT tool (in the form of a transportation management system) for the optimal management of collection and transport activities was evaluated. As the results clearly show, the adoption of the ITC tool brings significant savings in terms of costs, thus confirming the effectiveness of this tool for an optimal scheduling of collection and transport activities.
Thanks to these brilliant results, we also wish to encourage the 29% of companies still not performing collection; all the stakeholders involved could benefit both in economic terms and in the sustainability direction.
In general, every vending company may evaluate the possibility to process the collected SCG (for pellet production or other purposes according to Figure 3) in a centralized plant or even in smaller distributed plants. Thanks to precise assessment of transportation costs, for every specific SCG usage scenario, it is possible to determine the best-performing solution, i.e., a centralized transformation plant in every region or, otherwise, a small and compact SCG processing solution to be installed in each vending company’s facility.
The success of this proposal is highly dependent on the consumers’ behavior: In this sense, a good starting point for future research is the framework presented by Russo et al. [42] in order to assess the perception and the willingness to buy this bio-pellet. The main problem regarding this topic is probably the lack of information; companies themselves could promote awareness campaigns to provide appropriate knowledge and, as well, extend the collection directly in our homes.
Author Contributions
Conceptualization: A.V.; methodology: A.V., E.B., and L.T.; writing—original draft preparation: L.T. and A.V.; writing—review and editing: E.B.; supervision: A.V. and E.B.
Funding
This research received no external funding.
Conflicts of Interest
The authors declare no conflict of interest.
Appendix A

Table A1.
Detailed data obtained by the proposed logistics model for Emilia Romagna region (pellet composition: 50% SCG and 50% pine sawdust; 2.1 tons of SCG collected per company monthly; ICT optimization).
Table A1.
Detailed data obtained by the proposed logistics model for Emilia Romagna region (pellet composition: 50% SCG and 50% pine sawdust; 2.1 tons of SCG collected per company monthly; ICT optimization).
| EMILIA ROMAGNA | ||||||||||
|---|---|---|---|---|---|---|---|---|---|---|
| N2 Van | N2 Truck | N3 Truck | ||||||||
| Route | Companies which collect SCG | Number of stop/day | Distance (km) | Time (h) | Number of stop/day | Distance (km) | Time (h) | Number of stop/day | Distance (km) | Time (h) |
| Bologna - Bologna | 18 | 16 | 320 | 9.0 | 14 | 370 | 8.9 | 12 | 330 | 8.5 |
| Bologna - Modena | 13 | 6 | 540 | 8.2 | 10 | 480 | 8.8 | 10 | 340 | 8 |
| Bologna - Parma | 7 | 3 | 594 | 7.8 | 6 | 456 | 7.2 | 7 | 471 | 8.8 |
| Bologna - Forlì | 6 | 4 | 624 | 8.5 | 8 | 518 | 8.6 | 10 | 392 | 8.7 |
| Bologna - Ravenna | 5 | 3 | 510 | 6.8 | 7 | 550 | 8.6 | 9 | 410 | 8.6 |
| Bologna - Piacenza | 4 | 2 | 616 | 7.7 | 4 | 646 | 8.7 | 5 | 368 | 6.7 |
| Bologna - Reggio Emilia | 4 | 4 | 584 | 8 | 8 | 513 | 8.5 | 10 | 412 | 9 |
| Bologna - Rimini | 4 | 2 | 492 | 6.3 | 6 | 532 | 8.1 | 5 | 286 | 5.6 |
| Bologna - Ferrara | 2 | 6 | 600 | 8.9 | 10 | 490 | 8.9 | 10 | 320 | 7.7 |
| Bologna-Bologna | Bologna-Modena | Bologna-Parma | ||||||||
| N2 Van | N2 Truck | N3 Truck | N2 Van | N2 Truck | N3 Truck | N2 Van | N2 Truck | N3 Truck | ||
| Day/month to collect SCG | 1.1 | 1.3 | 1.5 | 2.2 | 1.3 | 1.3 | 2.3 | 1.2 | 1.0 | |
| Number of stop/day | 16 | 14 | 12 | 6 | 10 | 10 | 3 | 6 | 7 | |
| Distance (km/day) | 320 | 370 | 330 | 540 | 480 | 340 | 594 | 456 | 471 | |
| Total toll/day | - | - | - | € 64.80 | € 36.00 | € 21.60 | € 60.00 | € 40.00 | € 28.00 | |
| Distance (km/month) | 360 | 476 | 495 | 1170 | 624 | 442 | 1386 | 532 | 471 | |
| Total toll/month | - | - | - | € 140.40 | € 46.80 | € 28.08 | € 140.00 | € 46.67 | € 28.00 | |
| Bologna-Bologna | Bologna-Modena | Bologna-Parma | ||||||||
| N2 Van | N2 Truck | N3 Truck | N2 Van | N2 Truck | N3 Truck | N2 Van | N2 Truck | N3 Truck | ||
| Day/month to collect SCG | 1.5 | 0.8 | 0.6 | 1.7 | 0.7 | 0.6 | 2.0 | 1.0 | 0.8 | |
| Number of stop/day | 4 | 8 | 10 | 3 | 7 | 9 | 2 | 4 | 5 | |
| Distance (km/day) | 624 | 518 | 392 | 510 | 550 | 410 | 616 | 646 | 368 | |
| Total toll/day | € 52.80 | € 35.20 | € 26.40 | € 42.60 | € 33.13 | € 25.56 | € 60.80 | € 40.53 | € 30.40 | |
| Distance (km/month) | 936 | 389 | 235 | 850 | 393 | 228 | 1232 | 646 | 294 | |
| Total toll/month | € 79.20 | € 26.40 | € 15.84 | € 71.00 | € 23.67 | € 14.20 | € 121.60 | € 40.53 | € 24.32 | |
| Bologna-Reggio Emilia | Bologna-Rimini | Bologna-Ferrara | ||||||||
| N2 Van | N2 Truck | N3 Truck | N2 Van | N2 Truck | N3 Truck | N2 Van | N2 Truck | N3 Truck | ||
| Day/month to collect SCG | 1.0 | 0.5 | 0.4 | 2.0 | 0.7 | 0.8 | 0.3 | 0.2 | 0.2 | |
| Number of stop/day | 4 | 8 | 10 | 2 | 6 | 5 | 6 | 10 | 10 | |
| Distance (km/day) | 584 | 513 | 412 | 492 | 532 | 286 | 600 | 490 | 320 | |
| Total toll/day | € 59.20 | € 39.47 | € 29.60 | € 44.40 | € 44.40 | € 22.20 | € 46.80 | € 26.00 | € 15.60 | |
| Distance (km/month) | 584 | 257 | 165 | 984 | 355 | 229 | 200 | 98 | 64 | |
| Total toll/month | € 59.20 | € 19.73 | € 11.84 | € 88.80 | € 29.60 | € 17.76 | € 15.60 | € 5.20 | € 3.12 | |
Appendix B
Table A2.
Detailed data obtained by the proposed logistics model for Lombardia region (pellet composition: 50% SCG and 50% pine sawdust; 2.1 tons of SCG collected per company monthly; ICT optimization).
Table A2.
Detailed data obtained by the proposed logistics model for Lombardia region (pellet composition: 50% SCG and 50% pine sawdust; 2.1 tons of SCG collected per company monthly; ICT optimization).
| LOMBARDIA | ||||||||||
|---|---|---|---|---|---|---|---|---|---|---|
| N2 Van | N2 Truck | N3 Truck | ||||||||
| Route | Companies which collect SCG | Number of stop/day | Distance (km) | Time (h) | Number of stop/day | Distance (km) | Time (h) | Number of stop | Distance (km) | Time (h) |
| Milano - Milano | 45 | 16 | 320 | 9.0 | 12 | 400 | 8.6 | 11 | 380 | 8.9 |
| Milano - Brescia | 20 | 3 | 552 | 7.3 | 6 | 448 | 7.1 | 7 | 468 | 8.8 |
| Milano - Varese | 18 | 5 | 580 | 8.3 | 9 | 468 | 8.3 | 10 | 392 | 8.7 |
| Milano - Monza e Brianza | 11 | 9 | 486 | 8.6 | 12 | 376 | 8.3 | 12 | 342 | 8.7 |
| Milano - Bergamo | 10 | 5 | 530 | 7.7 | 9 | 438 | 8.0 | 10 | 372 | 8.4 |
| Milano - Como | 7 | 6 | 612 | 9.0 | 9 | 426 | 7.9 | 10 | 364 | 8.3 |
| Milano - Pavia | 6 | 6 | 516 | 7.9 | 10 | 464 | 8.6 | 10 | 332 | 7.9 |
| Milano - Mantova | 6 | 2 | 636 | 7.9 | 3 | 358 | 5.1 | 5 | 398 | 7.1 |
| Milano - Lecco | 5 | 5 | 640 | 9.0 | 9 | 504 | 8.8 | 9 | 396 | 8.4 |
| Milano - Lodi | 4 | 7 | 518 | 8.3 | 11 | 436 | 8.6 | 11 | 382 | 8.9 |
| Milano - Cremona | 1 | 3 | 576 | 7.6 | 6 | 464 | 7.3 | 7 | 484 | 9.0 |
| Milano - Sondrio | 1 | 2 | 560 | 7.1 | 5 | 620 | 8.8 | 5 | 360 | 6.6 |
| Milano-Milano | Milano-Brescia | Milano-Varese | ||||||||
| N2 Van | N2 Truck | N3 Truck | N2 Van | N2 Truck | N3 Truck | N2 Van | N2 Truck | N3 Truck | ||
| Day/month to collect SCG | 2.8 | 3.8 | 4.1 | 6.7 | 3.3 | 2.9 | 3.6 | 2.0 | 1.8 | |
| Number of stop/day | 16 | 12 | 11 | 3 | 6 | 7 | 5 | 9 | 10 | |
| Distance (km/day) | 320 | 400 | 380 | 552 | 448 | 468 | 580 | 468 | 392 | |
| Total toll/day | € 57.60 | € 14.40 | € 7.92 | € 139.80 | € 93.20 | € 65.24 | € 45.00 | € 27.00 | € 18.00 | |
| Distance (km/month) | 900 | 1500 | 1555 | 3,680 | 1493 | 1337 | 2088 | 936 | 706 | |
| Total toll/month | € 162.00 | € 54.00 | € 32.40 | € 932.00 | € 310.67 | € 186.40 | € 162.00 | € 4.00 | € 32.40 | |
| Milano-Monza e Brianza | Milano-Bergamo | Milano-Como | ||||||||
| N2 Van | N2 Truck | N3 Truck | N2 Van | N2 Truck | N3 Truck | N2 Van | N2 Truck | N3 Truck | ||
| Day/month to collect SCG | 1.2 | 0.9 | 0.9 | 2.0 | 1.1 | 1.0 | 1.2 | 0.8 | 0.7 | |
| Number of stop/day | 9 | 12 | 12 | 5 | 9 | 10 | 6 | 9 | 10 | |
| Distance (km/day) | 486 | 376 | 342 | 530 | 438 | 372 | 612 | 426 | 364 | |
| Total toll/day | € 50.40 | € 22.40 | € 13.44 | € 53.00 | € 31.80 | € 21.20 | € 28.80 | € 14.40 | € 9.60 | |
| Distance (km/month) | 594 | 345 | 314 | 1060 | 487 | 372 | 714 | 331 | 255 | |
| Total toll/month | € 61.60 | € 20.53 | € 12.32 | € 106.00 | € 35.33 | € 21.20 | € 33.60 | € 11.20 | € 6.72 | |
| Milano-Pavia | Milano-Mantova | Milano-Lecco | ||||||||
| N2 Van | N2 Truck | N3 Truck | N2 Van | N2 Truck | N3 Truck | N2 Van | N2 Truck | N3 Truck | ||
| Day/month to collect SCG | 1.0 | 0.6 | 0.6 | 3.0 | 2.0 | 1.2 | 1.0 | 0.6 | 0.6 | |
| Number of stop/day | 6 | 10 | 10 | 2 | 3 | 5 | 5 | 9 | 9 | |
| Distance (km/day) | 516 | 464 | 332 | 636 | 358 | 398 | 640 | 504 | 396 | |
| Total toll/day | € 44.40 | € 24.67 | € 14.80 | € 93.20 | € 46.60 | € 46.60 | - | - | - | |
| Distance (km/month) | 516 | 278 | 199 | 1908 | 716 | 478 | 640 | 280 | 220 | |
| Total toll/month | € 44.40 | € 14.80 | € 8.88 | € 279.60 | € 93.20 | € 55.92 | - | - | - | |
| Milano-Lodi | Milano-Cremona | Milano-Sondrio | ||||||||
| N2 Van | N2 Truck | N3 Truck | N2 Van | N2 Truck | N3 Truck | N2 Van | N2 Truck | N3 Truck | ||
| Day/month to collect SCG | 0.6 | 0.4 | 0.4 | 0.3 | 0.2 | 0.1 | 0.5 | 0.2 | 0.2 | |
| Number of stop/day | 7 | 11 | 11 | 3 | 6 | 7 | 2 | 5 | 5 | |
| Distance (km/day) | 518 | 436 | 382 | 576 | 464 | 484 | 560 | 620 | 360 | |
| Total toll/day | € 44.80 | € 23.47 | € 14.08 | € 57.00 | € 38.00 | € 26.60 | - | - | - | |
| Distance (km/month) | 296 | 159 | 139 | 192 | 77 | 69 | 280 | 124 | 72 | |
| Total toll/month | € 25.60 | € 8.53 | € 5.12 | € 19.00 | € 6.33 | € 3.80 | - | - | - | |
Appendix C
Table A3.
Detailed data obtained by the proposed logistics model for Piemonte region (pellet composition: 50% SCG and 50% pine sawdust; 2.1 tons of SCG collected per company monthly; ICT optimization).
Table A3.
Detailed data obtained by the proposed logistics model for Piemonte region (pellet composition: 50% SCG and 50% pine sawdust; 2.1 tons of SCG collected per company monthly; ICT optimization).
| PIEMONTE | ||||||||||
|---|---|---|---|---|---|---|---|---|---|---|
| N2 Van | N2 Truck | N3 Truck | ||||||||
| Route | Companies which collect SCG | Number of stop/day | Distance (km) | Time (h) | Number of stop/day | Distance (km) | Time (h) | Number of stop/day | Distance (km) | Time (h) |
| Torino - Torino | 35 | 16 | 320 | 9.0 | 14 | 370 | 4.9 | 12 | 330 | 8.5 |
| Torino - Cuneo | 11 | 4 | 584 | 8.0 | 8 | 538 | 8.8 | 9 | 432 | 8.9 |
| Torino - Alessandria | 5 | 3 | 546 | 7.2 | 6 | 444 | 7.1 | 7 | 464 | 8.7 |
| Torino - Vercelli | 5 | 4 | 616 | 8.4 | 7 | 542 | 8.5 | 8 | 428 | 8.5 |
| Torino - Biella | 3 | 4 | 608 | 8.3 | 8 | 531 | 8.7 | 9 | 409 | 8.6 |
| Torino - Novara | 1 | 3 | 582 | 7.7 | 6 | 448 | 7.1 | 7 | 463 | 8.7 |
| Torino - Asti | 1 | 5 | 560 | 8.1 | 9 | 426 | 7.9 | 10 | 344 | 8.1 |
| Torino-Torino | Torino-Cuneo | Torino-Alessandria | ||||||||
| N2 Van | N2 Truck | N3 Truck | N2 Van | N2 Truck | N3 Truck | N2 Van | N2 Truck | N3 Truck | ||
| Day/month to collect SCG | 2.2 | 2.5 | 2.9 | 2.8 | 1.4 | 1.2 | 1.7 | 0.8 | 0.7 | |
| Number of stop/day | 16 | 14 | 12 | 4 | 8 | 9 | 3 | 6 | 7 | |
| Distance (km/day) | 320 | 370 | 330 | 584 | 538 | 432 | 546 | 444 | 464 | |
| Total toll/day | € 64.00 | € 18.67 | € 9.60 | € 128.00 | € 85.33 | € 57.60 | € 68.40 | € 45.60 | € 31.92 | |
| Distance (km/month) | 700 | 925 | 963 | 1,606 | 740 | 528 | 910 | 370 | 331 | |
| Total toll/month | € 140.00 | € 46.67 | € 28.00 | € 352.00 | € 117.33 | € 70.40 | € 114.00 | € 38.00 | € 22.80 | |
| Torino-Vercelli | Torino-Biella | Torino-Novara | ||||||||
| N2 Van | N2 Truck | N3 Truck | N2 Van | N2 Truck | N3 Truck | N2 Van | N2 Truck | N3 Truck | ||
| Day/month to collect SCG | 1.3 | 0.7 | 0.6 | 0.8 | 0.4 | 0.3 | 0.3 | 0.2 | 0.1 | |
| Number of stop/day | 4 | 7 | 8 | 4 | 8 | 9 | 3 | 6 | 7 | |
| Distance (km/day) | 616 | 542 | 428 | 608 | 531 | 409 | 582 | 448 | 463 | |
| Total toll/day | € 76.00 | € 44.33 | € 30.40 | € 73.60 | € 49.07 | € 33.12 | € 82.20 | € 54.80 | € 38.36 | |
| Distance (km/month) | 770 | 387 | 268 | 456 | 199 | 136 | 194 | 75 | 66 | |
| Total toll/month | € 95.00 | € 31.67 | € 19.00 | € 55.20 | € 18.40 | € 11.04 | € 27.40 | € 9.13 | € 5.48 | |
| Torino-Asti | ||||||||||
| N2 Van | N2 Truck | N3 Truck | ||||||||
| Day/month to collect SCG | 0.2 | 0.1 | 0.1 | |||||||
| Number of stop/day | 5 | 9 | 10 | |||||||
| Distance (km/day) | 560 | 426 | 344 | |||||||
| Total toll/day | € 71.00 | € 42.60 | € 28.40 | |||||||
| Distance (km/month) | 112 | 47 | 34 | |||||||
| Total toll/month | € 14.20 | € 4.73 | € 2.84 | |||||||
Appendix D
Table A4.
Detailed data obtained by the proposed logistics model for Veneto region (pellet composition: 50% SCG and 50% pine sawdust; 2.1 tons of SCG collected per company monthly; ICT optimization).
Table A4.
Detailed data obtained by the proposed logistics model for Veneto region (pellet composition: 50% SCG and 50% pine sawdust; 2.1 tons of SCG collected per company monthly; ICT optimization).
| VENETO | |||||||||||
|---|---|---|---|---|---|---|---|---|---|---|---|
| N2 Van | N2 Truck | N3 Truck | |||||||||
| Route | Companies which collect SCG | Number of stop/day | Distance (km) | Time (h) | Number of stop/day | Distance (km) | Time (h) | Number of stop/day | Distance (km) | Time (h) | |
| Padova - Padova | 16 | 16 | 320 | 9.0 | 16 | 320 | 9.0 | 14 | 280 | 8.5 | |
| Padova - Vicenza | 16 | 6 | 504 | 7.8 | 10 | 456 | 8.5 | 10 | 328 | 7.8 | |
| Padova - Verona | 13 | 4 | 664 | 8.9 | 7 | 578 | 8.9 | 8 | 452 | 8.9 | |
| Padova - Treviso | 9 | 5 | 540 | 7.8 | 9 | 414 | 7.7 | 10 | 336 | 7.9 | |
| Padova - Venezia | 7 | 7 | 546 | 8.6 | 12 | 432 | 8.9 | 11 | 354 | 8.5 | |
| Padova - Belluno | 3 | 2 | 520 | 6.6 | 6 | 580 | 8.6 | 5 | 320 | 6.1 | |
| Padova - Rovigo | 1 | 6 | 576 | 8.6 | 10 | 474 | 8.8 | 10 | 312 | 7.6 | |
| Padova-Verona | Padova-Verona | Padova-Verona | |||||||||
| N2 Van | N2 Truck | N3 Truck | N2 Van | N2 Truck | N3 Truck | N2 Van | N2 Truck | N3 Truck | |||
| Day/month to collect SCG | 1.0 | 1.0 | 1.1 | 2.7 | 1.6 | 1.6 | 3.3 | 1.9 | 1.6 | ||
| Number of stop/day | 16 | 16 | 14 | 6 | 10 | 10 | 4 | 7 | 8 | ||
| Distance (km/day) | 320 | 320 | 280 | 504 | 456 | 328 | 664 | 578 | 452 | ||
| Total toll/day | - | - | - | € 32.40 | € 18.00 | € 10.80 | € 61.60 | € 35.93 | € 24.64 | ||
| Distance (km/month) | 320 | 320 | 320 | 1344 | 730 | 525 | 2158 | 1073 | 735 | ||
| Total toll/month | - | - | - | € 86.40 | € 28.80 | € 17.28 | € 200.20 | € 66.73 | € 40.04 | ||
| Padova-Treviso | Padova-Venezia | Padova-Belluno | |||||||||
| N2 Van | N2 Truck | N3 Truck | N2 Van | N2 Truck | N3 Truck | N2 Van | N2 Truck | N3 Truck | |||
| Day/month to collect SCG | 1.8 | 1.0 | 0.9 | 1.0 | 0.6 | 0.6 | 1.5 | 0.5 | 0.6 | ||
| Number of stop/day | 5 | 9 | 10 | 7 | 12 | 11 | 2 | 6 | 5 | ||
| Distance (km/day) | 540 | 414 | 336 | 546 | 432 | 354 | 520 | 580 | 320 | ||
| Total toll/day | € 64.00 | € 38.40 | € 25.60 | € 53.20 | € 30.40 | € 16.72 | €56.00 | € 56.00 | € 28.00 | ||
| Distance (km/month) | 972 | 414 | 302 | 546 | 252 | 225 | 780 | 290 | 192 | ||
| Total toll/month | € 115.20 | € 38.40 | € 23.04 | € 53.20 | € 17.73 | € 10.64 | € 84.00 | € 28.00 | € 16.80 | ||
| Padova-Rovigo | |||||||||||
| N2 Van | N2 Truck | N3 Truck | |||||||||
| Day/month to collect SCG | 0.2 | 0.1 | 0.1 | ||||||||
| Number of stop/day | 6 | 10 | 10 | ||||||||
| Distance (km/day) | 576 | 474 | 312 | ||||||||
| Total toll/day | € 43.20 | € 24.00 | € 14.40 | ||||||||
| Distance (km/month) | 96 | 47 | 31 | ||||||||
| Total toll/month | € 7.20 | € 2.40 | € 1.44 | ||||||||
Appendix E
Table A5.
Summary regional data obtained by the proposed logistics model (pellet composition: 50% SCG and 50% pine sawdust; 2.1 tons of SCG collected per company monthly; ICT optimization).
Table A5.
Summary regional data obtained by the proposed logistics model (pellet composition: 50% SCG and 50% pine sawdust; 2.1 tons of SCG collected per company monthly; ICT optimization).
| REGIONS SUMMARY | |||
|---|---|---|---|
| Total toll/month | |||
| N2 Van | N2 Truck | N3 Truck | |
| Emilia-Romagna | € 715.80 | € 238.60 | € 143.16 |
| Lombardia | € 1,825.80 | € 608.60 | € 365.16 |
| Piemonte | € 797.80 | € 265.93 | € 159.56 |
| Veneto | € 546.20 | € 182.07 | € 109.24 |
| Day/month to collect SCG | |||
| N2 Van | N2 Truck | N3 Truck | |
| Emilia-Romagna | 14.1 | 7.6 | 7.2 |
| Lombardia | 23.9 | 15.8 | 14.4 |
| Piemonte | 9.1 | 6.1 | 6.1 |
| Veneto | 11.4 | 6.6 | 6.6 |
| Distance (km/month) | |||
| N2 Van | N2 Truck | N3 Truck | |
| Emilia-Romagna | 7,702 | 3,768 | 2,623 |
| Lombardia | 12,868 | 6,726 | 5,714 |
| Piemonte | 4,748 | 2,743 | 2,326 |
| Veneto | 6,216 | 3,126 | 2,330 |
| Average distance [km/day] | |||
| N2 Van | N2 Truck | N3 Truck | |
| Emilia-Romagna | 542 | 506 | 370 |
| Lombardia | 544 | 450 | 389 |
| Piemonte | 545 | 471 | 410 |
| Veneto | 524 | 465 | 340 |
Appendix F
Table A6.
Detailed data obtained by the proposed logistics model for Emilia Romagna region (pellet composition: 98% SCG and 2% corn starch; 4.1 tons of SCG collected per company monthly; ICT optimization).
Table A6.
Detailed data obtained by the proposed logistics model for Emilia Romagna region (pellet composition: 98% SCG and 2% corn starch; 4.1 tons of SCG collected per company monthly; ICT optimization).
| EMILIA ROMAGNA | ||||||||||
|---|---|---|---|---|---|---|---|---|---|---|
| N2 Van | N2 Truck | N3 Truck | ||||||||
| Route | Companies which collect SCG | Number of stop/day | Distance (km) | Time (h) | Number of stop/day | Distance (km) | Time (h) | Number of stop/day | Distance (km) | Time (h) |
| Bologna - Bologna | 18 | 0 | 0 | 0 | 7 | 350 | 8.7 | 7 | 290 | 8.6 |
| Bologna - Modena | 13 | 0 | 0 | 0 | 5 | 450 | 8.5 | 6 | 330 | 8.5 |
| Bologna - Parma | 7 | 0 | 0 | 0 | 3 | 594 | 8.8 | 4 | 426 | 8.5 |
| Bologna - Forlì | 6 | 0 | 0 | 0 | 3 | 468 | 7.3 | 4 | 332 | 7.2 |
| Bologna - Ravenna | 5 | 0 | 0 | 0 | 3 | 510 | 7.8 | 4 | 360 | 7.6 |
| Bologna - Piacenza | 4 | 0 | 0 | 0 | 2 | 616 | 8.4 | 2 | 323 | 5.8 |
| Bologna - Reggio Emilia | 4 | 0 | 0 | 0 | 3 | 438 | 7.0 | 4 | 322 | 7.1 |
| Bologna - Rimini | 4 | 0 | 0 | 0 | 2 | 492 | 7 | 3 | 502 | 8.9 |
| Bologna - Ferrara | 2 | 0 | 0 | 0 | 4 | 400 | 7.2 | 6 | 345 | 8.7 |
| Bologna-Bologna | Bologna-Modena | Bologna-Parma | ||||||||
| N2 Van | N2 Truck | N3 Truck | N2 Van | N2 Truck | N3 Truck | N2 Van | N2 Truck | N3 Truck | ||
| Day/month to collect SCG | 2.6 | 2.6 | 2.6 | 2.2 | 2.3 | 1.8 | ||||
| Number of stop/day | 7 | 7 | 5 | 6 | 3 | 4 | ||||
| Distance (km/day) | 350 | 290 | 450 | 330 | 594 | 426 | ||||
| Total toll/day | - | - | € 54.00 | € 21.60 | € 60.00 | € 26.67 | ||||
| Distance (km/month) | 900 | 746 | 1170 | 715 | 1386 | 746 | ||||
| Total toll/month | - | - | € 140.40 | € 46.80 | € 140.00 | €46.67 | ||||
| Bologna-Forlì | Bologna-Ravenna | Bologn -Piacenza | ||||||||
| N2 Van | N2 Truck | N3 Truck | N2 Van | N2 Truck | N3 Truck | N2 Van | N2 Truck | N3 Truck | ||
| Day/month to collect SCG | 2.0 | 1.5 | 1.7 | 1.3 | 2.0 | 2.0 | ||||
| Number of stop/day | 3 | 4 | 3 | 4 | 2 | 2 | ||||
| Distance (km/day) | 468 | 332 | 510 | 360 | 616 | 323 | ||||
| Total toll/day | € 39.60 | € 17.60 | € 42.60 | € 18.93 | € 60.80 | € 20.27 | ||||
| Distance (km/month) | 936 | 498 | 850 | 450 | 1,232 | 646 | ||||
| Total toll/month | € 79.20 | € 26.40 | € 71.00 | € 23.67 | € 121.60 | € 40.53 | ||||
| Bologna-Reggio Emilia | Bologna-Rimini | Bologna-Ferrara | ||||||||
| N2 Van | N2 Truck | N3 Truck | N2 Van | N2 Truck | N3 Truck | N2 Van | N2 Truck | N3 Truck | ||
| Day/month to collect SCG | 1.3 | 1.0 | 2.0 | 1.3 | 0.5 | 0.3 | ||||
| Number of stop/day | 3 | 4 | 2 | 3 | 4 | 6 | ||||
| Distance (km/day) | 438 | 322 | 492 | 502 | 400 | 345 | ||||
| Total toll/day | € 44.40 | € 19.73 | € 44.40 | € 22.20 | € 31.20 | € 15.60 | ||||
| Distance (km/month) | 584 | 322 | 984 | 669 | 200 | 115 | ||||
| Total toll/month | € 59.20 | € 19.73 | € 88.80 | € 29.60 | € 15.60 | € 5.20 | ||||
Appendix G
Table A7.
Detailed data obtained by the proposed logistics model for Lombardia region (pellet composition: 98% SCG and 2% corn starch; 4.1 tons of SCG collected per company monthly; ICT optimization).
Table A7.
Detailed data obtained by the proposed logistics model for Lombardia region (pellet composition: 98% SCG and 2% corn starch; 4.1 tons of SCG collected per company monthly; ICT optimization).
| LOMBARDIA | ||||||||||
|---|---|---|---|---|---|---|---|---|---|---|
| N2 Van | N2 Truck | N3 Truck | ||||||||
| Route | Companies which collect SCG | Number of stop/day | Distance (km) | Time (h) | Number of stop/day | Distance (km) | Time (h) | Number of stop/day | Distance (km) | Time (h) |
| Milano - Milano | 45 | 0 | 0 | 0 | 5 | 300 | 7.6 | 5 | 260 | 7.7 |
| Milano - Brescia | 20 | 0 | 0 | 0 | 2 | 408 | 6.3 | 3 | 428 | 8.4 |
| Milano - Varese | 18 | 0 | 0 | 0 | 3 | 408 | 7.2 | 4 | 312 | 7.6 |
| Milano - Monza e Brianza | 11 | 0 | 0 | 0 | 5 | 370 | 8.4 | 6 | 282 | 8.9 |
| Milano - Bergamo | 10 | 0 | 0 | 0 | 3 | 378 | 6.8 | 4 | 292 | 7.3 |
| Milano - Como | 7 | 0 | 0 | 0 | 4 | 488 | 8.9 | 4 | 284 | 7.2 |
| Milano - Pavia | 6 | 0 | 0 | 0 | 4 | 424 | 8.2 | 4 | 252 | 6.8 |
| Milano - Mantova | 6 | 0 | 0 | 0 | 1 | 338 | 4.7 | 2 | 358 | 6.6 |
| Milano - Lecco | 5 | 0 | 0 | 0 | 3 | 444 | 7.6 | 4 | 336 | 7.9 |
| Milano - Lodi | 4 | 0 | 0 | 0 | 4 | 376 | 7.6 | 5 | 322 | 8.6 |
| Milano - Cremona | 1 | 0 | 0 | 0 | 2 | 424 | 6.5 | 3 | 444 | 8.6 |
| Milano - Sondrio | 1 | 0 | 0 | 0 | 2 | 600 | 8.5 | 2 | 320 | 6.1 |
| Milano-Milano | Milano-Brescia | Milano-Varese | ||||||||
| N2 Van | N2 Truck | N3 Truck | N2 Van | N2 Truck | N3 Truck | N2 Van | N2 Truck | N3 Truck | ||
| Day/month to collect SCG | 9.0 | 9.0 | 10.0 | 6.7 | 6.0 | 4.5 | ||||
| Number of stop/day | 5 | 5 | 2 | 3 | 3 | 4 | ||||
| Distance (km/day) | 300 | 260 | 408 | 428 | 408 | 312 | ||||
| Total toll/day | € 18.00 | € 6.00 | € 93.20 | € 46.60 | € 27.00 | € 12.00 | ||||
| Distance (km/month) | 2700 | 2340 | 4080 | 2,853 | 2448 | 1404 | ||||
| Total toll/month | € 162.00 | € 54.00 | € 932.00 | € 310.67 | € 162.00 | € 54.00 | ||||
| Milano-Monza e Brianza | Milano-Bergamo | Milano-Como | ||||||||
| N2 Van | N2 Truck | N3 Truck | N2 Van | N2 Truck | N3 Truck | N2 Van | N2 Truck | N3 Truck | ||
| Day/month to collect SCG | 2.2 | 1.8 | 3.3 | 2.5 | 1.8 | 1.8 | ||||
| Number of stop/day | 5 | 6 | 3 | 4 | 4 | 4 | ||||
| Distance (km/day) | 370 | 282 | 378 | 292 | 488 | 284 | ||||
| Total toll/day | € 28.00 | € 11.20 | € 31.80 | € 14.13 | € 19.20 | € 6.40 | ||||
| Distance (km/month) | 814 | 517 | 1,260 | 730 | 854 | 497 | ||||
| Total toll/month | € 61.60 | € 20.53 | € 106.00 | € 35.33 | € 33.60 | € 11.20 | ||||
| Milano-Pavia | Milano-Mantova | Milano-Lecco | ||||||||
| N2 Van | N2 Truck | N3 Truck | N2 Van | N2 Truck | N3 Truck | N2 Van | N2 Truck | N3 Truck | ||
| Day/month to collect SCG | 1.5 | 1.5 | 6.0 | 3.0 | 1.7 | 1.3 | ||||
| Number of stop/day | 4 | 4 | 1 | 2 | 3 | 4 | ||||
| Distance (km/day) | 424 | 252 | 338 | 358 | 444 | 336 | ||||
| Total toll/day | €29.60 | € 9.87 | € 46.60 | € 31.07 | - | - | ||||
| Distance (km/month) | 636 | 378 | 2028 | 1074 | 740 | 420 | ||||
| Total toll/month | € 44.40 | € 14.80 | € 279.60 | € 93.20 | - | - | ||||
| Milano-Lodi | Milano-Cremona | Milano-Sondrio | ||||||||
| N2 Van | N2 Truck | N3 Truck | N2 Van | N2 Truck | N3 Truck | N2 Van | N2 Truck | N3 Truck | ||
| Day/month to collect SCG | 1.0 | 0.8 | 0.5 | 0.3 | 0.5 | 0.5 | ||||
| Number of stop/day | 4 | 5 | 2 | 3 | 2 | 2 | ||||
| Distance (km/day) | 376 | 322 | 424 | 444 | 600 | 320 | ||||
| Total toll/day | € 25.60 | € 10.67 | € 38.00 | € 19.00 | - | - | ||||
| Distance (km/month) | 376 | 258 | 212 | 148 | 300 | 160 | ||||
| Total toll/month | € 25.60 | € 8.53 | € 19.00 | € 6.33 | - | - | ||||
Appendix H
Table A8.
Detailed data obtained by the proposed logistics model for Piemonte region (pellet composition: 98% SCG and 2% corn starch; 4.1 tons of SCG collected per company monthly; ICT optimization).
Table A8.
Detailed data obtained by the proposed logistics model for Piemonte region (pellet composition: 98% SCG and 2% corn starch; 4.1 tons of SCG collected per company monthly; ICT optimization).
| PIEMONTE | ||||||||||
|---|---|---|---|---|---|---|---|---|---|---|
| N2 Van | N2 Truck | N3 Truck | ||||||||
| Route | Companies which collect SCG | Number of stop/day | Distance (km) | Time (h) | Number of stop/day | Distance (km) | Time (h) | Number of stop/day | Distance (km) | Time (h) |
| Torino - Torino | 35 | 0 | 0 | 0 | 6 | 300 | 8.4 | 6 | 240 | 8.3 |
| Torino - Cuneo | 11 | 0 | 0 | 0 | 3 | 498 | 8.2 | 4 | 372 | 8.4 |
| Torino - Alessandria | 5 | 0 | 0 | 0 | 2 | 404 | 6.3 | 3 | 424 | 8.3 |
| Torino - Vercelli | 5 | 0 | 0 | 0 | 3 | 522 | 8.5 | 4 | 388 | 8.7 |
| Torino - Biella | 3 | 0 | 0 | 0 | 3 | 501 | 8.2 | 4 | 364 | 8.3 |
| Torino - Novara | 1 | 0 | 0 | 0 | 2 | 418 | 6.4 | 3 | 433 | 8.4 |
| Torino - Asti | 1 | 0 | 0 | 0 | 3 | 381 | 6.9 | 4 | 284 | 7.2 |
| Torino-Torino | Torino-Cuneo | Torino-Alessandria | ||||||||
| N2 Van | N2 Truck | N3 Truck | N2 Van | N2 Truck | N3 Truck | N2 Van | N2 Truck | N3 Truck | ||
| Day/month to collect SCG | 5.8 | 5.8 | 3.7 | 2.8 | 2.5 | 1.7 | ||||
| Number of stop/day | 6 | 6 | 3 | 4 | 2 | 3 | ||||
| Distance (km/day) | 300 | 240 | 498 | 372 | 404 | 424 | ||||
| Total toll/day | € 24.00 | € 8.00 | € 96.00 | € 42.67 | € 45.60 | € 22.80 | ||||
| Distance (km/month) | 1750 | 1400 | 1826 | 1,023 | 1010 | 707 | ||||
| Total toll/month | € 140.00 | € 46.67 | € 352.00 | € 117.33 | € 114.00 | € 38.00 | ||||
| Torino-Vercelli | Torino-Biella | Torino-Novara | ||||||||
| N2 Van | N2 Truck | N3 Truck | N2 Van | N2 Truck | N3 Truck | N2 Van | N2 Truck | N3 Truck | ||
| Day/month to collect SCG | 1.7 | 1.3 | 1.0 | 0.8 | 0.5 | 0.3 | ||||
| Number of stop/day | 3 | 4 | 3 | 4 | 2 | 3 | ||||
| Distance (km/day) | 522 | 388 | 501 | 364 | 418 | 433 | ||||
| Total toll/day | € 57.00 | € 25.33 | € 55.20 | € 24.53 | € 54.80 | € 27.40 | ||||
| Distance (km/month) | 870 | 485 | 501 | 273 | 209 | 144 | ||||
| Total toll/month | € 95.00 | € 31.67 | € 55.20 | € 18.40 | € 27.40 | € 9.13 | ||||
| Torino-Asti | ||||||||||
| N2 Van | N2 Truck | N3 Truck | ||||||||
| Day/month to collect SCG | 0.3 | 0.3 | ||||||||
| Number of stop/day | 3 | 4 | ||||||||
| Distance (km/day) | 381 | 284 | ||||||||
| Total toll/day | €42.60 | € 18.93 | ||||||||
| Distance (km/month) | 127 | 71 | ||||||||
| Total toll/month | € 14.20 | € 4.73 | ||||||||
Appendix I
Table A9.
Detailed data obtained by the proposed logistics model for Veneto region (pellet composition: 98% SCG and 2% corn starch; 4.1 tons of SCG collected per company monthly; ICT optimization).
Table A9.
Detailed data obtained by the proposed logistics model for Veneto region (pellet composition: 98% SCG and 2% corn starch; 4.1 tons of SCG collected per company monthly; ICT optimization).
| VENETO | ||||||||||
|---|---|---|---|---|---|---|---|---|---|---|
| N2 Van | N2 Truck | N3 Truck | ||||||||
| Route | Companies which collect SCG | Number of stop/day | Distance (km) | Time (h) | Number of stop/day | Distance (km) | Time (h) | Number of stop/day | Distance (km) | Time (h) |
| Padova - Padova | 16 | 0 | 0 | 0 | 6 | 240 | 7.7 | 6 | 240 | 8.3 |
| Padova - Vicenza | 16 | 0 | 0 | 0 | 4 | 416 | 8.1 | 5 | 352 | 9.0 |
| Padova - Verona | 13 | 0 | 0 | 0 | 3 | 558 | 8.9 | 4 | 412 | 9.0 |
| Padova - Treviso | 9 | 0 | 0 | 0 | 4 | 492 | 9 | 4 | 276 | 7.1 |
| Padova - Venezia | 7 | 0 | 0 | 0 | 4 | 372 | 7.6 | 5 | 309 | 8.4 |
| Padova - Belluno | 3 | 0 | 0 | 0 | 2 | 550 | 8 | 2 | 290 | 5.6 |
| Padova - Rovigo | 1 | 0 | 0 | 0 | 4 | 429 | 8.2 | 5 | 348 | 8.9 |
| Padova-Padova | Padova-Vicenza | Padova-Verona | ||||||||
| N2 Van | N2 Truck | N3 Truck | N2 Van | N2 Truck | N3 Truck | N2 Van | N2 Truck | N3 Truck | ||
| Day/month to collect SCG | 2.7 | 2.7 | 4.0 | 3.2 | 4.3 | 3.3 | ||||
| Number of stop/day | 6 | 6 | 4 | 5 | 3 | 4 | ||||
| Distance (km/day) | 240 | 240 | 416 | 352 | 558 | 412 | ||||
| Total toll/day | - | - | € 21.60 | € 9.00 | € 46.20 | € 20.53 | ||||
| Distance (km/month) | 640 | 640 | 1664 | 1126 | 2418 | 1339 | ||||
| Total toll/month | - | - | € 86.40 | € 28.80 | € 200.20 | € 66.73 | ||||
| Padova-Treviso | Padova-Venezia | Padova-Belluno | ||||||||
| N2 Van | N2 Truck | N3 Truck | N2 Van | N2 Truck | N3 Truck | N2 Van | N2 Truck | N3 Truck | ||
| Day/month to collect SCG | 2.3 | 2.3 | 1.8 | 1.4 | 1.5 | 1.5 | ||||
| Number of stop/day | 4 | 4 | 4 | 5 | 2 | 2 | ||||
| Distance (km/day) | 492 | 276 | 372 | 309 | 550 | 290 | ||||
| Total toll/day | € 51.20 | € 17.07 | € 30.40 | € 12.67 | € 56.00 | € 18.67 | ||||
| Distance (km/month) | 1,107 | 621 | 651 | 432 | 825 | 435 | ||||
| Total toll/month | € 115.20 | € 38.40 | € 53.20 | € 17.73 | € 84.00 | € 28.00 | ||||
| Padova-Rovigo | ||||||||||
| N2 Van | N2 Truck | N3 Truck | ||||||||
| Day/month to collect SCG | 0.3 | 0.2 | ||||||||
| Number of stop/day | 4 | 5 | ||||||||
| Distance (km/day) | 429 | 348 | ||||||||
| Total toll/day | € 28.80 | € 12.00 | ||||||||
| Distance (km/month) | 107.25 | 69.6 | ||||||||
| Total toll/month | € 7.20 | € 2.40 | ||||||||
Appendix J
Table A10.
Summary regional data obtained by the proposed logistics model (pellet composition: 98% SCG and 2% corn starch; 4.1 tons of SCG collected per company monthly; ICT optimization).
Table A10.
Summary regional data obtained by the proposed logistics model (pellet composition: 98% SCG and 2% corn starch; 4.1 tons of SCG collected per company monthly; ICT optimization).
| REGIONS SUMMARY | |||
|---|---|---|---|
| Total toll/month | |||
| N2 Van | N2 Truck | N3 Truck | |
| Emilia-Romagna | € 715.80 | € 238.60 | |
| Lombardia | € 1,825.80 | € 608.60 | |
| Piemonte | € 797.80 | € 265.93 | |
| Veneto | € 546.20 | € 182.07 | |
| Day/month to collect SCG | |||
| N2 Van | N2 Truck | N3 Truck | |
| Emilia-Romagna | 17.0 | 13.9 | |
| Lombardia | 43.5 | 33.6 | |
| Piemonte | 15.5 | 12.8 | |
| Veneto | 16.8 | 14.5 | |
| Distance (km/month) | |||
| N2 Van | N2 Truck | N3 Truck | |
| Emilia-Romagna | 8242 | 4907 | |
| Lombardia | 16,448 | 10,779 | |
| Piemonte | 6293 | 4103 | |
| Veneto | 7412 | 4664 | |
| Average distance [km/day] | |||
| N2 Van | N2 Truck | N3 Truck | |
| Emilia-Romagna | 480 | 359 | |
| Lombardia | 413 | 324 | |
| Piemonte | 432 | 358 | |
| Veneto | 437 | 318 | |
References
- Martinez-Saez, N.; García, A.T.; Pérez, I.D.; Rebollo-Hernanz, M.; Mesías, M.; Morales, F.J.; Martín-Cabrejas, M.A.; del Castillo, M.D. Use of spent coffee grounds as food ingredient in bakery products. Food Chem. 2017, 216, 114–122. [Google Scholar] [CrossRef] [PubMed]
- Mussatto, S.I.; Machado, E.M.S.; Martins, S.; Teixeira, A. Production, composition, and application of coffee and its industrial residues. Food Bioprocess Technol. 2011, 4, 661–672. [Google Scholar] [CrossRef]
- Zabaniotou, A.; Kamaterou, P. Food waste valorization advocating Circular Bioeconomy—A critical review of potentialities and perspectives of spent coffee grounds biorefinery. J. Clean. Prod. 2019, 211, 1553–1566. [Google Scholar] [CrossRef]
- Patra, C.J.; Kumaran, P.; Praveen, R.; Senthil Kumar, A. Production of biodiesel from spent coffee grounds by transertification and its byproducts as fuel additives. Int. J. Chem. Sci. 2016, 14, 590–596. [Google Scholar]
- Mata, M.T.; Martins, A.A.; Caetano, N.S. Bio-refinery approach for spent coffee grounds valorization. Biores. Tech. 2018, 247, 1077–1084. [Google Scholar] [CrossRef] [PubMed]
- International Coffee Organization (ICO). Total Production by all Exporting Countries. 2018. Available online: http://www.ico.org (accessed on 20 March 2019).
- International Coffee Organization (ICO). 2017. Available online: http://www.ico.org (accessed on 13 March 2019).
- Bianchi, F.; Barmet, P.; Stirnweis, L.; El Haddad, I.; Platt, S.M.; Saurer, M.; Lötscher, C.; Siegwolf, R.; Bigi, A.; Hoyle, C.R.; et al. Contribution of methane to aerosol carbon mass. Atmos. Environ. 2016, 141, 41–47. [Google Scholar] [CrossRef]
- Ghermandi, G.; Teggi, S.; Fabbi, S.; Bigi, A.; Zaccanti, M.M. Tri-generation power plant and conventional boilers: Pollutant flow rate and atmospheric impact of stack emissions. Int. J. Environ. Sci. Technol. 2015, 12, 693–704. [Google Scholar] [CrossRef]
- Volpi, A.; Bottani, E.; Montanari, R.; Rizzi, A.; Bonanzinga, C. Assessing the feasibility of the thermal valorization of spent coffee grounds converted into pellet. In Proceedings of the XXIV Summer School Francesco Turco, Brescia, Italy, 11–13 September 2019. [Google Scholar]
- García-Alcaraz, J.L.; Maldonado-Macías, A.A.; Alor-Hernández, G.; Sánchez-Remírez, C. The impact of information and communication technologies (ICT) on agility, operating, and economical performance of supply chain. Adv. Prod. Eng. Manag. 2017, 12, 29–40. [Google Scholar] [CrossRef]
- Nilsson, D.; Bernesson, S.; Hansson, P.-A. Pellet production from agricultural raw materials—A system study. Biomass Bioenerg. 2011, 35, 679–689. [Google Scholar] [CrossRef]
- United States Department of Agriculture. Italy: Italian Wood Pellets Overview. 2017. Available online: https://www.fas.usda.gov/data/italy-italian-wood-pellets-overview (accessed on 8 November 2019).
- Campbell, T.W.; Bartley, E.E.; Bechtle, R.M.; Dayton, A.D. Coffee Grounds. I. Effects of Coffee Grounds on Ration Digestibility and Diuresis in Cattle, on In Vitro Rumen Fermentation, and on Rat Growth. J. Dairy Sci. 1976, 59, 1452–1460. [Google Scholar] [CrossRef]
- McNutt, J.; He, Q. Spent coffee grounds: A review on current utilization. J. Ind. Eng. Chem. 2019, 71, 78–88. [Google Scholar] [CrossRef]
- Chen, N.N.; Chen, M.Q.; Fu, B.A.; Song, J.J. Far-infrared irradiation drying behavior of typical biomass briquettes. Energy 2017, 121, 726–738. [Google Scholar] [CrossRef]
- Choi, J.-H.; Lee, C.; Cho, S.; Moon, G.D.; Kim, B.-S.; Chang, H.; Jang, H.D. High capacitance and energy density supercapacitor based on biomass-derived activated carbons with reduced graphene oxide binder. Carbon 2018, 132, 16–24. [Google Scholar] [CrossRef]
- Huang, Y.-F.; Chiueh, P.-T.; Kuan, W.-H.; Lo, S.-L. Microwave pyrolysis of lignocellulosic biomass: Heating performance and reaction kinetics. Energy 2016, 100, 137–144. [Google Scholar] [CrossRef]
- Kondamudi, N.; Mohapatra, S.K.; Misra, M. Spent coffee grounds as a versatile source of green energy. J. Agr. Food Chem. 2008, 56, 11757–11760. [Google Scholar] [CrossRef]
- Laksaci, H.; Khelifi, A.; Trari, M.; Addoun, A. Synthesis and characterization of microporous activated carbon from coffee grounds using potassium hydroxides. J. Clean. Prod. 2017, 147, 254–262. [Google Scholar] [CrossRef]
- Park, J.; Kim, B.; Lee, J.W. In-situ transesterification of wet spent coffee grounds for sustainable biodiesel production. Bioresource Technol. 2016, 221, 55–60. [Google Scholar] [CrossRef]
- Rufford, T.E.; Hulicova-Jurcakova, D.; Zhu, Z.; Lu, G.Q. Nanoporous carbon electrode from waste coffee beans for high performance supercapacitors. Electrochem. Commun. 2008, 10, 1594–1597. [Google Scholar] [CrossRef]
- Vardon, D.R.; Moser, B.R.; Zheng, W.; Witkin, K.; Evangelista, R.L.; Strathmann, T.J.; Rajagopalan, K.; Sharma, B.K. Complete utilization of spent coffee grounds to produce biodiesel, bio-oil, and biochar. ACS Sustain. Chem. Eng. 2013, 1, 1286–1294. [Google Scholar] [CrossRef]
- Yun, Y.S.; Park, M.H.; Hong, S.J.; Lee, M.E.; Park, Y.W.; Jin, H.-J. Hierarchically porous carbon nanosheets from waste coffee grounds for supercapacitors. ACS Appl. Mater. Inter. 2015, 7, 3684–3690. [Google Scholar] [CrossRef]
- Zhang, C.; Ho, S.-H.; Chen, W.-H.; Xie, Y.; Liu, Z.; Chang, J.-S. Torrefaction performance and energy usage of biomass wastes and their correlations with torrefaction severity index. Appl. Energ. 2018, 220, 598–604. [Google Scholar] [CrossRef]
- Zuorro, A.; Lavecchia, R. Spent coffee grounds as a valuable source of phenolic compounds and bioenergy. J. Clean. Prod. 2012, 34, 49–56. [Google Scholar] [CrossRef]
- Fadlalla, A.; Amani, F. A keyword-based organizing framework for ERP intellectual contributions. J. Enterp. Inf. Manag. 2015, 28, 637–657. [Google Scholar] [CrossRef]
- Ma, X.; Ouyang, F. Adsorption properties of biomass-based activated carbon prepared with spent coffee grounds and pomelo skin by phosphoric acid activation. Appl. Surf. Sci. 2013, 268, 566–570. [Google Scholar] [CrossRef]
- Tongcumpou, C.; Usapein, P.; Tuntiwiwattanapun, N. Complete utilization of wet spent coffee grounds waste as a novel feedstock for antioxidant, biodiesel, and bio-char production. In. Crop Prod. 2019, 138, 111484. [Google Scholar] [CrossRef]
- Song, M.Y.; Kim, N.R.; Cho, S.Y.; Jin, H.-J.; Yun, Y.S. Asymmetric energy storage devices based on surface-driven sodium-ion storage. ACS Sustain. Chem. Eng. 2017, 5, 616–624. [Google Scholar] [CrossRef]
- Luna-Lama, N.; Rodríguez-Padrón, D.; Puente-Santiago, A.R.; Munõz-Batista, M.J.; Caballero, A.; Balu, A.M.; Romero, A.A.; Luque, R. Non-porous carbonaceous materials derived from coffee waste grounds as highly sustainable anodes for lithium-ion batteries. J. Clean. Prod. 2019, 207, 411–417. [Google Scholar] [CrossRef]
- Tsai, S.-Y.; Muruganantham, R.; Tai, S.-H.; Chang, B.K.; Wu, S.-C.; Chueh, Y.-L.; Liu, W.-R. Coffee grounds-derived carbon as high performance anode materials for energy storage applications. J. Taiwan Inst. Chem. E. 2019, 97, 178–188. [Google Scholar] [CrossRef]
- Kua, T.; Arulrajah, A.; Horpibulsuk, S.; Du, Y.; Shen, S. Strength assessment of spent coffee grounds- geopolymer cement utilizing slag and fly ash precursors. Constr. Build. Mater. 2016, 115, 565–575. [Google Scholar] [CrossRef]
- Franca, A.S.; Oliveira, L.S.; Ferreira, M.E. Kinetics and equilibrium studies of methylene blue adsorption by spent coffee grounds. Desalination 2009, 249, 267–272. [Google Scholar] [CrossRef]
- Murthy, P.S.; Naidu, M.M. Sustainable management of coffee industry by- products and value addition—A review. Resour. Conserv. Recycl. 2012, 66, 45–58. [Google Scholar] [CrossRef]
- Givens, D.L.; Barber, W.P. In vivo evaluation of spent coffee grounds as a ruminant feed. Agric. Wastes 1986, 18, 69–72. [Google Scholar] [CrossRef]
- Allesina, G.; Pedrazzi, S.; Tebianian, S.; Tartarini, P. Biodiesel and electrical power production through vegetable oil extraction and byproducts gasification: Modeling of the system. Biores. Technol. 2014, 170, 278–285. [Google Scholar] [CrossRef] [PubMed]
- Pedrazzi, S.; Allesina, G.; Tartarini, P. A kinetic model for a stratified downdraft gasifier. Int. J. Heat Technol. 2012, 30, 41–44. [Google Scholar]
- Allesina, G.; Pedrazzi, S.; Tartarini, P. Modeling and investigation of the channeling phenomenon in downdraft stratified gasifiers. Biores. Technol. 2013, 146, 704–712. [Google Scholar] [CrossRef]
- Lisowski, A.; Olendzki, D.; Świętochowski, A.; Dabrowska, M.; Mieszkalski, L.; Ostrowska-Ligęza, E.; Stasiak, M.; Klonowski, J.; Piatek, M. Spent coffee grounds compaction process: Its effects on the strength properties of biofuel pellets. Renew. Energ. 2019, 142, 173–183. [Google Scholar] [CrossRef]
- Pokharel, S. Perception of information and communication technology perspectives in logistics. A syudy on transportation and warehouses sector in Singapore. J. Enterp. Inf. Manag. 2005, 18, 136–149. [Google Scholar] [CrossRef]
- Russo, I.; Confente, I.; Scarpi, D.; Hazen, B.T. From trash to treasure: The impact of consumer perception of bio-waste products in closed-loop supply chains. J. Clean. Prod. 2019, 218, 966–974. [Google Scholar] [CrossRef]
Figure 1.
The evolution in time of the number of reviewed studies.

Figure 2.
The evolution in time of the number of reviewed studies according to the document type.

Figure 3.
Frequency–persistency diagram resulting for the keywords analyzed.

Figure 4.
(a) Spent coffee grounds (SCG) (50%) and pine sawdust (50%) pellet; (b) SCG (98%) and corn starch (2%) pellet.
Figure 4.
(a) Spent coffee grounds (SCG) (50%) and pine sawdust (50%) pellet; (b) SCG (98%) and corn starch (2%) pellet.

Figure 5.
Interfaces of the ICT tool (remote monitor on the left, tablet on the right).

Figure 6.
Operational stages for developing logistics model.

Figure 7.
Pellet production stages (photos).


Figure 8.
Pellet production stages (flowchart).

Figure 9.
Plant 3D rendering.

Figure 10.
Plant general layout.

Table 1.
Most cited documents of the sample analyzed (in alphabetic order of the first author).
| Authors and Year | Citations Per Year (Average) | Citations Overall | Reference |
|---|---|---|---|
| Chen J. et al., (2017) | 13.67 | 41 | [16] |
| Choi J.-H. et al., (2018) | 14.50 | 29 | [17] |
| Huang Y.-F. et al., (2016) | 15.00 | 60 | [18] |
| Kondamudi N. et al., (2008) | 17.92 | 215 | [19] |
| Laksaci H. et al., (2017) | 14.00 | 42 | [20] |
| Martinez-Saez N. et al., (2017) | 14.00 | 42 | [1] |
| Park J. et al., (2016) | 11.50 | 46 | [21] |
| Rufford T.E. et al., (2008) | 23.25 | 279 | [22] |
| Vardon D.R. et al., (2013) | 13.14 | 92 | [23] |
| Yun Y.S. et al., (2015) | 25.20 | 126 | [24] |
| Zhang C. et al., (2018) | 10.00 | 20 | [25] |
| Zuorro et al., (2012) | 12.75 | 102 | [26] |
Table 2.
Vending companies’ distribution in Italy, according to the geographic subdivision.
| Region | Number of Vending Companies | % of Italy |
|---|---|---|
| Emilia-Romagna | 88 | 9.64 |
| Friuli-Venezia Giulia | 24 | 2.63 |
| Liguria | 21 | 2.30 |
| Lombardia | 190 | 20.81 |
| Piemonte | 88 | 9.64 |
| Trentino Alto-Adige | 10 | 1.10 |
| Valle d’Aosta | 3 | 0.33 |
| Veneto | 92 | 10.08 |
| Total—North of Italy | 516 | 56.52 |
| Abruzzo | 16 | 1.75 |
| Lazio | 82 | 8.98 |
| Marche | 22 | 2.41 |
| Molise | 0 | 0.00 |
| Sardegna | 10 | 1.10 |
| Toscana | 70 | 7.67 |
| Umbria | 18 | 1.97 |
| Total—Center of Italy | 218 | 23.88 |
| Basilicata | 6 | 0.66 |
| Calabria | 23 | 2.52 |
| Campania | 35 | 3.83 |
| Puglia | 48 | 5.26 |
| Sicilia | 67 | 7.34 |
| Total—South of Italy | 179 | 19.61 |
| TOTAL—ITALY | 913 | 100.00 |
Table 3.
Total tons of spent coffee grounds estimated to be collected.
| Geographic Area | Number of Distributors (Average) | Number of Coffees Sold (Average) | Coffee Quantities [Tons/Year] | SCGs Quantities [Tons/Year] |
|---|---|---|---|---|
| North | 235,019 | 1,556,553,422 | 10,896 | 21,792 |
| Centre | 99,099 | 656,341,675 | 4594 | 9189 |
| South | 81,370 | 538,922,751 | 3772 | 7545 |
| Total—Italy | 415,488 | 2,751,817,848 | 19,263 | 38,525 |
Table 4.
Collectable tons of SCGs in each of the four regions, according to the number of companies performing collection.
Table 4.
Collectable tons of SCGs in each of the four regions, according to the number of companies performing collection.
| Regions | Number of Companies | Number of Companies Performing Collection | SCGs Quantities Collected [Tons/Month] |
|---|---|---|---|
| Lombardia | 190 | 135 | 297 |
| Veneto | 92 | 65 | 143 |
| Emilia-Romagna | 88 | 62 | 136 |
| Piemonte | 89 | 63 | 139 |
Table 5.
Number of companies, companies performing collection, kilometric distances, and highway tolls for the Lombardia region.
Table 5.
Number of companies, companies performing collection, kilometric distances, and highway tolls for the Lombardia region.
| City | Number of Companies | Companies Performing SCG Collection | Plant to City [km] | Company to Company Distance [km] | Highway Toll [€] |
|---|---|---|---|---|---|
| Milano | 64 | 45 | 10 | 40 | 2.00 |
| Brescia | 28 | 20 | 92 | 20 | 18.50 |
| Varese | 25 | 18 | 58 | 20 | 2.40 |
| Monza-Brianza | 15 | 11 | 27 | 20 | 1.00 |
| Bergamo | 14 | 10 | 53 | 20 | 4.70 |
| Como | 10 | 7 | 51 | 20 | 5.50 |
| Pavia | 9 | 6 | 43 | 20 | 3.70 |
| Mantova | 8 | 6 | 159 | 20 | 17.20 |
| Lecco | 7 | 5 | 64 | 20 | 2.50 |
| Lodi | 6 | 4 | 37 | 20 | 3.70 |
| Cremona | 2 | 1 | 96 | 20 | 1.50 |
| Sondrio | 2 | 1 | 140 | 20 | 2.00 |
| TOTAL | 190 | 134 |
Table 6.
Heavy vehicles characteristics.
| Category & Type | N2 Van | N2 Truck | N3 Truck |
|---|---|---|---|
| Reference example | FCA Ducato 4035 XL | Iveco Eurocargo 110 | Iveco Eurocargo 180 |
| Gross weight range [ton] | 3.5–7.5 | 7.5–11.5 | 11.5–26 |
| Gross weight [kg] | 4250 | 11,000 | 18,000 |
| Maximum payload [ton] | 2.5 | 6.7 | 12.5 |
| Companies visited for an FTL | 1 | 3 | 5 |
| Highways average speed [km/h] | 100 | 100 | 80 |
| Urban and suburban average speed [km/h] | 65 | 65 | 60 |
| Weighted average speed [km/h] | 88 | 88 | 73 |
Table 7.
Assumptions of the logistic model.
| Variables | Value |
|---|---|
| Loading time [min] | 20 |
| Loading time [hours] | 0.33 |
| Working hours/shift | 8 ± 1 |
| Working day/month | 22 |
| Working day/years | 235 |
Table 8.
Optimal solution for Emilia Romagna’s routes (production plant based in Bologna).
| EMILIA ROMAGNA | ||||||||||
|---|---|---|---|---|---|---|---|---|---|---|
| N2 VAN | N2 TRUCK | N3 TRUCK | ||||||||
| ROUTE | COMPANIES COLLECTING SCG | N° of STOPS PER DAY | DISTANCE [km] | TIME [h] | N° of STOPS PER DAY | DISTANCE [km] | TIME [h] | N° of STOPS PER DAY | DISTANCE [km] | TIME [h] |
| Bologna-Bologna | 18 | 16 | 320 | 9.0 | 14 | 370 | 8.9 | 12 | 330 | 8.5 |
| Bologna-Modena | 13 | 6 | 540 | 8.2 | 10 | 480 | 8.8 | 10 | 340 | 8 |
| Bologna-Parma | 7 | 3 | 594 | 7.8 | 6 | 456 | 7.2 | 7 | 471 | 8.8 |
| Bologna-Forlì | 6 | 4 | 624 | 8.5 | 8 | 518 | 8.6 | 10 | 392 | 8.7 |
| Bologna-Ravenna | 5 | 3 | 510 | 6.8 | 7 | 550 | 8.6 | 9 | 410 | 8.6 |
| Bologna-Piacenza | 4 | 2 | 616 | 7.7 | 4 | 646 | 8.7 | 5 | 368 | 6.7 |
| Bologna-Reggio Emilia | 4 | 4 | 584 | 8.0 | 8 | 513 | 8.5 | 10 | 412 | 9 |
| Bologna-Rimini | 4 | 2 | 492 | 6.3 | 6 | 532 | 8.1 | 5 | 286 | 5.6 |
| Bologna-Ferrara | 2 | 6 | 600 | 8.9 | 10 | 490 | 8.9 | 10 | 320 | 7.7 |
Table 9.
Optimal solution for Lombardia’s routes (production plant based in Milano).
| LOMBARDIA | ||||||||||
|---|---|---|---|---|---|---|---|---|---|---|
| N2 VAN | N2 TRUCK | N3 TRUCK | ||||||||
| ROUTE | COMPANIES COLLECTING SCG | N° of STOPS PER DAY | DISTANCE [km] | TIME [h] | N° of STOPS PER DAY | DISTANCE [km] | TIME [h] | N° of STOPS PER DAY | DISTANCE [km] | TIME [h] |
| Milano-Milano | 45 | 16 | 320 | 9.0 | 12 | 400 | 8.6 | 11 | 380 | 8.9 |
| Milano-Brescia | 20 | 3 | 552 | 7.3 | 6 | 448 | 7.1 | 7 | 468 | 8.8 |
| Milano-Varese | 18 | 5 | 580 | 8.3 | 9 | 468 | 8.3 | 10 | 392 | 8.7 |
| Milano-Monza e Brianza | 11 | 9 | 486 | 8.6 | 12 | 376 | 8.3 | 12 | 342 | 8.7 |
| Milano-Bergamo | 10 | 5 | 530 | 7.7 | 9 | 438 | 8.0 | 10 | 372 | 8.4 |
| Milano-Como | 7 | 6 | 612 | 9.0 | 9 | 426 | 7.9 | 10 | 364 | 8.3 |
| Milano-Pavia | 6 | 6 | 516 | 7.9 | 10 | 464 | 8.6 | 10 | 332 | 7.9 |
| Milano-Mantova | 6 | 2 | 636 | 7.9 | 3 | 358 | 5.1 | 5 | 398 | 7.1 |
| Milano-Lecco | 5 | 5 | 640 | 9.0 | 9 | 504 | 8.8 | 9 | 396 | 8.4 |
| Milano-Lodi | 4 | 7 | 518 | 8.3 | 11 | 436 | 8.6 | 11 | 382 | 8.9 |
| Milano-Cremona | 1 | 3 | 576 | 7.6 | 6 | 464 | 7.3 | 7 | 484 | 9.0 |
| Milano-Sondrio | 1 | 2 | 560 | 7.1 | 5 | 620 | 8.8 | 5 | 360 | 6.6 |
Table 10.
Optimal solution for Piemonte’s routes (production plant based in Torino).
| PIEMONTE | ||||||||||
|---|---|---|---|---|---|---|---|---|---|---|
| N2 VAN | N2 TRUCK | N3 TRUCK | ||||||||
| ROUTE | COMPANIES COLLECTING SCG | N° of STOPS PER DAY | DISTANCE [km] | TIME [h] | N° of STOPS PER DAY | DISTANCE [km] | TIME [h] | N° of STOPS PER DAY | DISTANCE [km] | TIME [h] |
| Torino-Torino | 35 | 16 | 320 | 9.0 | 14 | 370 | 4.9 | 12 | 330 | 8.5 |
| Torino-Cuneo | 11 | 4 | 584 | 8.0 | 8 | 538 | 8.8 | 9 | 432 | 8.9 |
| Torino-Alessandria | 5 | 3 | 546 | 7.2 | 6 | 444 | 7.1 | 7 | 464 | 8.7 |
| Torino-Vercelli | 5 | 4 | 616 | 8.4 | 7 | 542 | 8.5 | 8 | 428 | 8.5 |
| Torino-Biella | 3 | 4 | 608 | 8.3 | 8 | 531 | 8.7 | 9 | 409 | 8.6 |
| Torino-Novara | 1 | 3 | 582 | 7.7 | 6 | 448 | 7.1 | 7 | 463 | 8.7 |
| Torino-Asti | 1 | 5 | 560 | 8.1 | 9 | 426 | 7.9 | 10 | 344 | 8.1 |
Table 11.
Optimal solution for Veneto’s routes (production plant based in Padova).
| VENETO | ||||||||||
|---|---|---|---|---|---|---|---|---|---|---|
| N2 VAN | N2 TRUCK | N3 TRUCK | ||||||||
| ROUTE | COMPANIES COLLECTING SCG | N° of STOPS PER DAY | DISTANCE [km] | TIME [h] | N° of STOPS PER DAY | DISTANCE [km] | TIME [h] | N° of STOPS PER DAY | DISTANCE [km] | TIME [h] |
| Padova-Padova | 16 | 16 | 320 | 9.0 | 16 | 320 | 9.0 | 14 | 280 | 8.5 |
| Padova-Vicenza | 16 | 6 | 504 | 7.8 | 10 | 456 | 8.5 | 10 | 328 | 7.8 |
| Padova-Verona | 13 | 4 | 664 | 8.9 | 7 | 578 | 8.9 | 8 | 452 | 8.9 |
| Padova-Treviso | 9 | 5 | 540 | 7.8 | 9 | 414 | 7.7 | 10 | 336 | 7.9 |
| Padova-Venezia | 7 | 7 | 546 | 8.6 | 12 | 432 | 8.9 | 11 | 354 | 8.5 |
| Padova-Belluno | 3 | 2 | 520 | 6.6 | 6 | 580 | 8.6 | 5 | 320 | 6.1 |
| Padova-Rovigo | 1 | 6 | 576 | 8.6 | 10 | 474 | 8.8 | 10 | 312 | 7.6 |
Table 12.
Total toll per month, number of days per month to collect SCGs, and distances regarding the four regions.
Table 12.
Total toll per month, number of days per month to collect SCGs, and distances regarding the four regions.
| Total toll/month [€] | Day/month to Collect SCG | Distance [km/month] | Average Distance [km/day] | |||||||||
|---|---|---|---|---|---|---|---|---|---|---|---|---|
| REGION | N2 Van | N2 Truck | N3 Truck | N2 Van | N2 Truck | N3 Truck | N2 Van | N2 Truck | N3 Truck | N2 Van | N2 Truck | N3 Truck |
| Emilia-Romagna | 769.40 | 300 | 187.56 | 15.5 | 9.5 | 9 | 8371 | 4706.50 | 329 | 542 | 506 | 370 |
| Lombardia | 1953.50 | 670.90 | 416.64 | 26 | 18.5 | 17.5 | 14,001 | 8007 | 6914 | 544 | 450 | 389 |
| Piemonte | 945 | 337.83 | 227.46 | 11 | 7.5 | 8 | 5747 | 3420.50 | 3138 | 545 | 471 | 410 |
| Veneto | 599.60 | 216.67 | 148.40 | 12.5 | 8 | 9 | 6850 | 3761 | 314 | 524 | 465 | 340 |
Table 13.
Results for the city of Brescia.
| N2 Van | N2 Truck | N3 Truck | |
|---|---|---|---|
| Days/month | 7.0 | 3.5 | 3.0 |
| Companies/day | 3 | 6 | 7 |
| Daily distance (km) | 552 | 448 | 468 |
| Daily toll | € 139.80 | € 93.20 | € 65.24 |
| Distance (km/month) | 3864 | 1568 | 1404 |
| Total toll/month | € 978.60 | € 326.20 | € 195.72 |
Table 14.
Results for the city of Brescia, with the implementation of the ICT system.
| N2 Van | N2 Truck | N3 Truck | |
|---|---|---|---|
| Days/month | 6.7 | 3.3 | 2.9 |
| Companies/day | 3 | 6 | 7 |
| Daily distance (km) | 552 | 448 | 468 |
| Daily toll | € 139.80 | € 93.20 | € 65.24 |
| Distance (km/month) | 3680 | 1493 | 1337 |
| Total toll/month | € 932.00 | € 310.67 | € 186.40 |
Table 15.
Minimum cost for third-party logistics (3PLs) according to the Italian Ministry.
| Type of Vehicle/Distance Range | N2 Van [€/km] | N2 Truck [€/km] | N3 Truck [€/km] |
|---|---|---|---|
| 101–150 km | 1.24 | 1.37 | 1.57 |
| 151–250 km | 1.03 | 1.14 | 1.31 |
| 251–350 km | 0.94 | 1.03 | 1.20 |
| 351–500 km | 0.81 | 0.89 | 1.05 |
| >500 km | 0.73 | 0.82 | 0.97 |
Table 16.
Overall transportation costs (rounding up half-day).
| N2 VAN | N2 TRUCK | N3 TRUCK | ||||
|---|---|---|---|---|---|---|
| REGION | Monthly Cost [€] | Annual Cost [€] | Monthly Cost [€] | Annual Cost [€] | Monthly Cost [€] | Annual Cost [€] |
| Emilia Romagna | 6908.62 | 82,903.41 | 4152.11 | 49,825.26 | 3651.08 | 43,812.94 |
| Lombardia | 12,221.71 | 146,660.52 | 7808.86 | 93,706.32 | 7677.64 | 92,131.63 |
| Piemonte | 5159.80 | 61,917.59 | 3387.09 | 40,645.07 | 3522.95 | 42,275.38 |
| Veneto | 5623.33 | 67,479.95 | 3569.47 | 42,833.59 | 3914.75 | 46,977.02 |
Table 17.
Overall transportation costs (without rounding).
| N2 VAN | N2 TRUCK | N3 TRUCK | ||||
|---|---|---|---|---|---|---|
| REGION | Monthly Cost [€] | Annual Cost [€] | Monthly Cost [€] | Annual Cost [€] | Monthly Cost [€] | Annual Cost [€] |
| Emilia Romagna | 6364.38 | 76,372.55 | 3322.77 | 39,873.25 | 2897.78 | 34,773.34 |
| Lombardia | 11,263.08 | 135,156.93 | 6604.84 | 79,258.10 | 6366.39 | 76,396.72 |
| Piemonte | 4279.94 | 51,359.30 | 2711.24 | 32,534.85 | 2602.62 | 31,231,39 |
| Veneto | 5104.96 | 61,259.51 | 2969.17 | 35,630.02 | 2898.89 | 34,786.72 |
Table 18.
Savings rising with the adoption of ICT tools.
| N2 Van | N2 Truck | N3 Truck | |
|---|---|---|---|
| Emilia Romagna | 7.9% | 20.0% | 20.6% |
| Lombardia | 7.8% | 15.4% | 17.1% |
| Piemonte | 17.1% | 20.0% | 26.1% |
| Veneto | 9.2% | 16.8% | 25.9% |
Table 19.
Stops required as a function of the different vehicles (pellet composition: 98% SCG).
| Category & Type | N2 Van | N2 Truck | N3 Truck |
|---|---|---|---|
| Companies visited for a full load truck | - | 1 | 3 |
Table 20.
Overall transportation costs (rounding up half-day).
| N2 Truck | N3 Truck | |||
|---|---|---|---|---|
| Region | Monthly Cost [€] | Annual Cost [€] | Monthly Cost [€] | Annual Cost [€] |
| Emilia Romagna | 8715.52 | 104,586.22 | 6016.95 | 72,203.42 |
| Lombardia | 16,902.93 | 202,835.10 | 14,115.62 | 169,387.49 |
| Piemonte | 6874.17 | 82,490.02 | 5252.11 | 63,025.29 |
| Veneto | 7631.65 | 91,579.80 | 6372.33 | 76,467.96 |
Table 21.
Overall transportation costs (without rounding).
| N2 Truck | N3 Truck | |||
|---|---|---|---|---|
| Region | Monthly Cost [€] | Annual Cost [€] | Monthly Cost [€] | Annual Cost [€] |
| Emilia Romagna | 8063.25 | 96,759.05 | 5391.39 | 64,696.73 |
| Lombardia | 16,488.61 | 197,863.38 | 13,513.00 | 162,156.04 |
| Piemonte | 6407.79 | 76,893.46 | 4574.85 | 54,898.23 |
| Veneto | 7153.96 | 85,847.53 | 5765.27 | 69,183.24 |
Table 22.
Savings from the adoption of ICT tools (pellet composition: 98% SCG).
| Region | N2 Truck | N3 Truck |
|---|---|---|
| Emilia Romagna | 7.5% | 10.4% |
| Lombardia | 2.5% | 4.3% |
| Piemonte | 6.8% | 12.9% |
| Veneto | 6.3% | 9.5% |
Table 23.
Assumptions made when considering the production plants sited in Milano.
| General Assumptions | |
|---|---|
| Number of Plants | 1 |
| Number of work shifts | 3 |
| Hours/shift | 8 |
| Working day/months | 22 |
| Working days/year | 235 |
Table 24.
Pellet production (tons) as a function of the number of work shifts.
| Number of Work Shifts | |||
|---|---|---|---|
| 1 | 2 | 3 | |
| Working hours | 8 | 16 | 24 |
| Tons of pellet produced/hour | 0.5 | 0.5 | 0.5 |
| Tons of pellet produced/day | 4 | 8 | 12 |
| Tons of pellet produced/month | 88 | 176 | 264 |
| Tons of pellet produced/year | 940 | 1880 | 2820 |
Table 25.
Bags production as a function of the number of work shifts.
| Number of Work Shifts | |||
|---|---|---|---|
| 1 | 2 | 3 | |
| Bags of pellet produced/day | 267 | 534 | 800 |
| Bags of pellet produced/month | 5874 | 11,748 | 17,600 |
| Bags of pellet produced/year | 62,745 | 125,490 | 188,000 |
Table 26.
Costs for the operators as a function of the number of work shifts.
| Number of work shifts | |||
|---|---|---|---|
| 1 | 2 | 3 | |
| Hourly cost for 1 operator | 15.00 € | 17.00 € | 21.00 € |
| Daily cost for 1 operator | 120.00 € | 136.00 € | 168.00 € |
| Monthly cost for 1 operator | 2640.00 € | 2992.00 € | 3696.00 € |
| Annual cost for 1 operator | 28,200.00 € | 31,960.00 € | 39,480.00 € |
Table 27.
Resale process of pellet, according to the two different scenarios taken into account.
| Sales General Assumptions | |||
|---|---|---|---|
| Retail scenario (50% SCG) | Wholesale scenario (50% SCG) | ||
| kg/bag | 15 | kg/bag | 15 |
| price/kg | 0.23 | price/kg | 0.10 |
| Price of bag | € 3.50 | Price of bag | € 1.50 |
| Wholesale scenario (98% SCG) | |||
| Min price/kg | 0.05 | Max price/kg | 0.10 |
Table 28.
Facility costs in each region.
| FACILITY COST (300 m2) | |||
|---|---|---|---|
| Region | Monthly Cost | Annual Cost | Unitary Cost [€/m2] |
| Bologna (Emilia Romagna) | € 1395.00 | € 16,740.00 | € 4.65 |
| Milano (Lombardia) | € 1770.00 | € 21,240.00 | € 5.90 |
| Torino (Piemonte) | € 1128.00 | € 13,536.00 | € 3.76 |
| Padova (Veneto) | € 1278.00 | € 15,336.00 | € 4.26 |
| Total | € 5571.00 | € 66,852.00 | |
Table 29.
Electrical power consumption of the equipment.
| Machine | Installed Power [kW] | Monthly Cost | Annual Cost |
|---|---|---|---|
| Pellet machine | 45.00 | € 4039.20 | € 43,146.00 |
| Dryer | pellet powered | ||
| Doser | 0.25 | € 22.44 | € 239.70 |
| Feeder | 0.80 | € 71.81 | € 767.04 |
| Extruder | 5.20 | € 466.75 | € 4985.76 |
| Grinder | 18.50 | € 1660.56 | € 17,737.80 |
| Conveyors | 3.00 | € 269.28 | € 2876.40 |
| Bags filler | 1.55 | € 139.13 | € 1486.14 |
| Cooler | 2.95 | € 264.79 | € 2828.46 |
| Total | 77.25 | € 6933.96 | € 74,067.30 |
Table 30.
Total cost of the four different plants (pellet composition: 50% SCG and 50% sawdust).
| 9 | ||||||
|---|---|---|---|---|---|---|
| Milano Production Plant | Padova Production Plant | |||||
| €/month | €/year | Percentage | €/month | €/year | Percentage | |
| TRASPORTATION | 6605 | 79,258 | 20.3% | 2969 | 35,630 | 10.4% |
| FACILITY | 1770 | 21,240 | 5.4% | 1278 | 15,336 | 4.5% |
| MANPOWER | 12,848 | 137,240 | 35.1% | 12,848 | 137,240 | 40.2% |
| ENERGY | 6934 | 74,067 | 18.9% | 6934 | 74,067 | 21.7% |
| RAW MATERIAL | 6072 | 64,860 | 16.6% | 6072 | 64,860 | 19.0% |
| AMORTISATION | 1187 | 14,244 | 3.6% | 1187 | 14,244 | 4.2% |
| TOTAL | 35,416 | 390,909 | 31,288 | 341,377 | ||
| Bologna Production Plant | Torino Production Plant | |||||
| €/month | €/year | Percentage | €/month | €/year | Percentage | |
| TRASPORTATION | 3323 | 39,873 | 11.5% | 2711 | 32,535 | 9.7% |
| FACILITY | 1395 | 16,740 | 4.8% | 1128 | 13,536 | 4.0% |
| MANPOWER | 12,848 | 137,240 | 39.5% | 12,848 | 137,240 | 40.8% |
| ENERGY | 6934 | 74,067 | 21.3% | 6934 | 74,067 | 22.0% |
| RAW MATERIAL | 6072 | 64,860.00 | 18.7% | 6072 | 64,860 | 19.3% |
| AMORTISATION | 1187 | 14,244 | 4.1% | 1187 | 14,244 | 4.2% |
| TOTAL | 31,759 | 347,025 | 30,880 | 336,482 | ||
Table 31.
Total cost of the four different plants (pellet composition: 98% SCG).
| TOTAL COST | ||||||
|---|---|---|---|---|---|---|
| Milano Production Plant | Padova Production Plant | |||||
| €/month | €/year | Percentage | €/month | €/year | Percentage | |
| TRASPORTATION | 13,513 | 162,156 | 36.7% | 5765 | 69,183 | 20.2% |
| FACILITY | 1770 | 21,240 | 4.8% | 1278 | 15,336 | 4.5% |
| MANPOWER | 12,848 | 137,240 | 31.0% | 12,848 | 137,240 | 40.0% |
| ENERGY | 6934 | 74,067 | 16.8% | 6934 | 74,067 | 21.6% |
| RAW MATERIAL | 3105 | 33,163 | 7.5% | 3105 | 33,163 | 9.7% |
| AMORTISATION | 1187 | 14,244 | 3.2% | 1187 | 14,244 | 4.1% |
| TOTAL | 39,357 | 442,111 | 31,117 | 343,234 | ||
| Bologna Production Plant | Torino Production Plant | |||||
| €/month | €/year | Percentage | €/month | €/year | Percentage | |
| TRASPORTATION | 5391 | 64,697 | 19.0% | 4,575 | 54,898 | 16.8% |
| FACILITY | 1395 | 16,740 | 4.9% | 1128 | 13,536 | 4.1% |
| MANPOWER | 12,848 | 137,240 | 40,.3% | 12,848 | 137,240 | 42.0% |
| ENERGY | 6934 | 74,067 | 21.8% | 6934 | 74,067 | 2.6% |
| RAW MATERIAL | 3105 | 33,163 | 9.7% | 3105 | 33,163 | 10.1% |
| AMORTISATION | 1187 | 14,244 | 4.2% | 1187 | 14,244 | 4.4% |
| TOTAL | 30,860 | 340,151 | 29,776 | 327,149 | ||
Table 32.
Results of the investment evaluation (pellet composition: 50% SCG and 50% pine sawdust; 2.1 tons of SCG collected per company monthly).
Table 32.
Results of the investment evaluation (pellet composition: 50% SCG and 50% pine sawdust; 2.1 tons of SCG collected per company monthly).
| NPV Bologna Production Plant (all values in €) | |||||||||||
| Year | 0 | 1 | 2 | 3 | 4 | 5 | 6 | 7 | 8 | 9 | 10 |
| Production Plant | 110,000 | ||||||||||
| Transportation | 39,873 | 40,072 | 40,272 | 40,474 | 40,676 | 40,880 | 41,084 | 41,289 | 41,496 | 41,703 | |
| Facility | 16,740 | 16,740 | 16,740 | 16,740 | 16,823 | 16,823 | 16,823 | 16,823 | 16,907 | 16,907 | |
| Labor | 137,240 | 137,651 | 138,064 | 138,478 | 138,894 | 139,310 | 139,728 | 140,148 | 140,568 | 140,990 | |
| Energy | 74,067 | 74,067 | 74,067 | 74,067 | 74,067 | 74,067 | 74,067 | 74,067 | 74,067 | 74,067 | |
| Raw Materials | 64,860 | 64,860 | 64,860 | 64,860 | 64,860 | 64,860 | 64,860 | 64,860 | 64,860 | 64,860 | |
| TOTAL COSTS | 332,780 | 333,391 | 334,004 | 334,620 | 335,322 | 335,942 | 336,564 | 337,189 | 337,900 | 338,529 | |
| Selling Price | 0.23 | 0.20 | 0.19 | 0.16 | 0.10 | 0.15 | 0.15 | 0.10 | 0.16 | 0.17 | |
| Sales | 648,600 | 564,000 | 535,800 | 451,200 | 282,000 | 423,000 | 423,000 | 282,000 | 451,200 | 479,400 | |
| Profit/Loss | 315,819 | 230,608 | 201,795 | 116,579 | (53,322) | 87,057 | 86,435 | (55,189) | 113,299 | 140,870 | |
| Discounted Profit/ Loss | 110,000 | 205,819 | 120,608 | 91,795 | 6579 | (163,322) | (22,942) | (23,564) | (165,189) | 3299 | 30,870 |
| NPV Milano Production Plant (all values in €) | |||||||||||
| Year | 0 | 1 | 2 | 3 | 4 | 5 | 6 | 7 | 8 | 9 | 10 |
| Production Plant | 110,000 | ||||||||||
| Transportation | 79,258 | 79,654 | 80,052 | 80,452 | 80,855 | 81,259 | 81,665 | 82,074 | 82,484 | 82,896 | |
| Facility | 21,240 | 21,240 | 21,240 | 21,240 | 21,346 | 21,346 | 21,346 | 21,346 | 21,452 | 21,452 | |
| Labor | 137,240 | 137,651 | 138,064 | 138,478 | 138,894 | 139,310 | 139,728 | 140,148 | 140,568 | 140,990 | |
| Energy | 74,067 | 74,067 | 74,067 | 74,067 | 74,067 | 74,067 | 74,067 | 74,067 | 74,067 | 74,067 | |
| Raw Materials | 64,860 | 64,860 | 64,860 | 64,860 | 64,860 | 64,860 | 64,860 | 64,860 | 64,860 | 64,860 | |
| TOTAL COSTS | 376,665 | 377,473 | 378,284 | 379,099 | 380,023 | 380,844 | 381,668 | 382,495 | 383,433 | 384,267 | |
| Selling Price | 0.23 | 0.20 | 0.19 | 0.16 | 0.10 | 0.15 | 0.15 | 0.10 | 0.16 | 0.17 | |
| Sales | 648,600 | 564,000 | 535,800 | 451,200 | 282,000 | 423,000 | 423,000 | 282,000 | 451,200 | 479,400 | |
| Profit/Loss | 271,934 | 186,526 | 157,515 | 72,100 | (98,023) | 42,156 | 41,331 | (100,495) | 67,766 | 95,132 | |
| Discounted Profit/ Loss | 110,000 | 161,934 | 76,526 | 47,515 | (37,899) | (208,023) | (67,843) | (68,668) | (210,495) | (42,233) | (14,867) |
| NPV Torino Production Plant (all values in €) | |||||||||||
| Year | 0 | 1 | 2 | 3 | 4 | 5 | 6 | 7 | 8 | 9 | 10 |
| Production Plant | 110,000 | ||||||||||
| Transportation | 32,534 | 32,697 | 32,861 | 33,025 | 33,190 | 33,356 | 33,523 | 33,690 | 33,859 | 34,028 | |
| Facility | 13,536 | 13,536 | 13,536 | 13,536 | 13,603 | 13,603 | 13,603 | 13,603 | 13,671 | 13,671 | |
| Labor | 137,240 | 137,651 | 138,064 | 138,478 | 138,894 | 139,310 | 139,728 | 140,148 | 140,568 | 140,990 | |
| Energy | 74,067 | 74,067 | 74,067 | 74,067 | 74,067 | 74,067 | 74,067 | 74,067 | 74,067 | 74,067 | |
| Raw Materials | 64,860 | 64,860 | 64,860 | 64,860 | 64,860 | 64,860 | 64,860 | 64,860 | 64,860 | 64,860 | |
| TOTAL COSTS | 322,238 | 322,812 | 323,388 | 323,967 | 324,615 | 325,198 | 325,783 | 326,369 | 327,026 | 327,617 | |
| Selling Price | 0.23 | 0.20 | 0.19 | 0.16 | 0.10 | 0.15 | 0.15 | 0.10 | 0.16 | 0.17 | |
| Sales | 648,600 | 564,000 | 535,800 | 451,200 | 282,000 | 423,000 | 423,000 | 282,000 | 451,200 | 479,400 | |
| Profit/Loss | 326,361 | 241,187 | 212,411 | 127,232 | (42,615) | 97,801 | 97,216 | (44,369) | 124,173 | 151,782 | |
| Discounted Profit/ Loss | 110,000 | 216,361 | 131,187 | 102,411 | 17,232 | (152,615) | (12,198) | (12,783) | (154,369) | 14,173 | 41,782 |
| NPV Padova Production Plant (all values in €) | |||||||||||
| Year | 0 | 1 | 2 | 3 | 4 | 5 | 6 | 7 | 8 | 9 | 10 |
| Production Plant | 110,000 | ||||||||||
| Transportation | 35,630 | 35,808 | 35,987 | 36,167 | 36,347 | 36,529 | 36,712 | 36,895 | 37,080 | 37,265 | |
| Facility | 15,336 | 15,336 | 15,336 | 15,336 | 15,412 | 15,412 | 15,412 | 15,412 | 15,489 | 15,489 | |
| Labor | 137,240 | 137,651 | 138,064 | 138,478 | 138,894 | 139,310 | 139,728 | 140,148 | 140,568 | 140,990 | |
| Energy | 74,067 | 74,067 | 74,067 | 74,067 | 74,067 | 74,067 | 74,067 | 74,067 | 74,067 | 74,067 | |
| Raw Materials | 64,860 | 64,860 | 64,860 | 64,860 | 64,860 | 64,860 | 64,860 | 64,860 | 64,860 | 64,860 | |
| TOTAL COSTS | 327,133 | 327,723 | 328,315 | 328,909 | 329,582 | 330,180 | 330,781 | 331,384 | 332,066 | 332,673 | |
| Selling Price | 0.23 | 0.20 | 0.19 | 0.16 | 0.10 | 0.15 | 0.15 | 0.10 | 0.16 | 0.17 | |
| Sales | 648,600 | 564,000 | 535,800 | 451,200 | 282,000 | 423,000 | 423,000 | 282,000 | 451,200 | 479,400 | |
| Profit/Loss | 321,466 | 236,276 | 207,484 | 122,290 | (42,582) | 92,819 | 92,218 | (49,384) | 119,133 | 146,726 | |
| Discounted Profit/ Loss | 110,000 | 211,466 | 126,276 | 97,484 | 12,290 | (157,582) | (17,180) | (17,781) | (159,384) | 9133 | 36,726 |
Table 33.
Results of the investment evaluation (pellet composition: 98% SCG; 4.1 tons of SCG collected per company monthly).
Table 33.
Results of the investment evaluation (pellet composition: 98% SCG; 4.1 tons of SCG collected per company monthly).
| NPV Bologna Production Plant (all values in €) | |||||||||||
| Year | 0 | 1 | 2 | 3 | 4 | 5 | 6 | 7 | 8 | 9 | 10 |
| Production Plant | 110,000 | ||||||||||
| Transportation | 64,697 | 65,020 | 65,345 | 65,672 | 66,000 | 66,330 | 66,662 | 66,995 | 67,330 | 67.667 | |
| Facility | 16,740 | 16,740 | 16,740 | 16,740 | 16,823 | 16,823 | 16,823 | 16,823 | 16,907 | 16,907 | |
| Labor | 137,240 | 137,651 | 138,064 | 138,478 | 138,894 | 139,310 | 139,728 | 140,148 | 140,568 | 140,990 | |
| Energy | 74,067 | 74,067 | 74,067 | 74,067 | 74,067 | 74,067 | 74,067 | 74,067 | 74,067 | 74,067 | |
| Raw Materials | 33,163 | 33,163 | 33,163 | 33,163 | 33,163 | 33,163 | 33,163 | 33,163 | 33,163 | 33,163 | |
| TOTAL COSTS | 325,907 | 326,642 | 327,380 | 328,121 | 328,948 | 329,695 | 330,445 | 331,197 | 332,037 | 332,795 | |
| Selling Price | 0.10 | 0.09 | 0.08 | 0.07 | 0.06 | 0.05 | 0.06 | 0.09 | 0.10 | 0.07 | |
| Sales | 282,000 | 253,800 | 225,600 | 197,400 | 169,200 | 141,000 | 169,200 | 253,800 | 282,000 | 197,400 | |
| Profit/Loss | (43,907) | (72,842) | (101,780) | (130,721) | (159,748) | (188,695) | (161,245) | (77,397) | (50,037) | (135,395) | |
| Discounted Profit/ Loss | 110,000 | (153,907) | (182,842) | (211,780) | (240,721) | (269,748) | (298,695) | (271,245) | (187,397) | (160,037) | (245,395) |
| NPV Milano Production Plant (all values in €) | |||||||||||
| Year | 0 | 1 | 2 | 3 | 4 | 5 | 6 | 7 | 8 | 9 | 10 |
| Production Plant | 110,000 | ||||||||||
| Transportation | 162,156 | 162,966 | 163,781 | 164,600 | 165,423 | 166,250 | 167,081 | 167,917 | 168,756 | 169,600 | |
| Facility | 21,240 | 21,240 | 21,240 | 21,240 | 21,346 | 21,346 | 21,346 | 21,346 | 21,452 | 21,452 | |
| Labor | 137,240 | 137,651 | 138,064 | 138,478 | 138,894 | 139,310 | 139,728 | 140,148 | 140,568 | 140,990 | |
| Energy | 74,067 | 74,067 | 74,067 | 74,067 | 74,067 | 74,067 | 74,067 | 74,067 | 74,067 | 74,067 | |
| Raw Materials | 33,163 | 33,163 | 33,163 | 33,163 | 33,163 | 33,163 | 33,163 | 33,163 | 33,163 | 33,163 | |
| TOTAL COSTS | 427,866 | 429,089 | 430,316 | 431,549 | 432,894 | 434,138 | 435,387 | 436,642 | 438,008 | 439,274 | |
| Selling Price | 0.10 | 0.09 | 0.08 | 0.07 | 0.06 | 0.05 | 0.06 | 0.09 | 0.10 | 0.07 | |
| Sales | 282,000 | 253,800 | 225,600 | 197,400 | 169,200 | 141,000 | 169,200 | 253,800 | 282,000 | 197,400 | |
| Profit/Loss | (145,866) | (175,289) | (204,716) | (234,149) | (263,694) | (293,138) | (266,187) | (182,842) | (156,008) | (241,874) | |
| Discounted Profit/ Loss | 110,000 | (255,866) | (282,289) | (314,716) | (344,149) | (373,694) | (403,138) | (376,187) | (292,842) | (266,008) | (351,874) |
| NPV Torino Production Plant (all values in €) | |||||||||||
| Year | 0 | 1 | 2 | 3 | 4 | 5 | 6 | 7 | 8 | 9 | 10 |
| Production Plant | 110,000 | ||||||||||
| Transportation | 54,898 | 55,172 | 55,448 | 55,725 | 56,004 | 56,284 | 56,565 | 56,848 | 57,132 | 57,418 | |
| Facility | 13,536 | 13,536 | 13,536 | 13,536 | 13,603 | 13,603 | 13,603 | 13,603 | 13,671 | 13,671 | |
| Labor | 137,240 | 137,651 | 138,064 | 138,478 | 138,894 | 139,310 | 139,728 | 140,148 | 140,568 | 140,990 | |
| Energy | 74,067 | 74,067 | 74,067 | 74,067 | 74,067 | 74,067 | 74,067 | 74,067 | 74,067 | 74,067 | |
| Raw Materials | 33,163 | 33,163 | 33,163 | 33,163 | 33,163 | 33,163 | 33,163 | 33,163 | 33,163 | 33,163 | |
| TOTAL COSTS | 312,904 | 313,590 | 314,279 | 314,971 | 315,732 | 316,429 | 317,129 | 317,831 | 318,603 | 319,311 | |
| Selling Price | 0.10 | 0.09 | 0.08 | 0.07 | 0.06 | 0.05 | 0.06 | 0.09 | 0.10 | 0.07 | |
| Sales | 282,000 | 253,800 | 225,600 | 197,400 | 169,200 | 141,000 | 169,200 | 253,800 | 282,000 | 197,400 | |
| Profit/Loss | (30,904) | (59,790) | (88,679) | (117,571) | (146,532) | (175,429) | (147,929) | (64,031) | (36,603) | (121,911) | |
| Discounted Profit/ Loss | 110,000 | 54,898 | 55,172 | 55,448 | 55,725 | 56,004 | 56,284 | 56,565 | 56,848 | 57,132 | 57,418 |
| NPV Padova Production Plant (all values in €) | |||||||||||
| Year | 0 | 1 | 2 | 3 | 4 | 5 | 6 | 7 | 8 | 9 | 10 |
| Production Plant | 110,000 | ||||||||||
| Transportation | 69,183 | 69,529 | 69,876 | 70,226 | 70,577 | 70,930 | 71,284 | 71,641 | 71,999 | 72,359 | |
| Facility | 15,336 | 15,336 | 15,336 | 15,336 | 15,412 | 15,412 | 15,412 | 15,412 | 15,489 | 15,489 | |
| Labor | 137,240 | 137,651 | 138,064 | 138,478 | 138,894 | 139,310 | 139,728 | 140,148 | 140,568 | 140,990 | |
| Energy | 74,067 | 74,067 | 74,067 | 74,067 | 74,067 | 74,067 | 74,067 | 74,067 | 74,067 | 74,067 | |
| Raw Materials | 33,163 | 33,163 | 33,163 | 33,163 | 33,163 | 33,163 | 33,163 | 33,163 | 33,163 | 33,163 | |
| TOTAL COSTS | 328,989 | 329,747 | 330,507 | 331,271 | 332,114 | 332,884 | 333,656 | 334,432 | 335,288 | 336,069 | |
| Selling Price | 0.10 | 0.09 | 0.08 | 0.07 | 0.06 | 0.05 | 0.06 | 0.09 | 0.10 | 0.07 | |
| Sales | 282,000 | 253,800 | 225,600 | 197,400 | 169,200 | 141,000 | 169,200 | 253,800 | 282,000 | 197,400 | |
| Profit/Loss | (46,989) | (75,947) | (104,907) | (133,871) | (162,914) | (191,884) | (164,456) | (80,632) | (53,288) | (138,669) | |
| Discounted Profit/ Loss | 110,000 | (156,989) | (185,947) | (214,907) | (243,871) | (272,914) | (301,884) | (274,456) | (190,632) | (163,288) | (248,669) |
© 2019 by the authors. Licensee MDPI, Basel, Switzerland. This article is an open access article distributed under the terms and conditions of the Creative Commons Attribution (CC BY) license (http://creativecommons.org/licenses/by/4.0/).
Share and Cite
MDPI and ACS Style
Bottani, E.; Tebaldi, L.; Volpi, A. The Role of ICT in Supporting Spent Coffee Grounds Collection and Valorization: A Quantitative Assessment. Sustainability 2019, 11, 6572. https://doi.org/10.3390/su11236572
AMA Style
Bottani E, Tebaldi L, Volpi A. The Role of ICT in Supporting Spent Coffee Grounds Collection and Valorization: A Quantitative Assessment. Sustainability. 2019; 11(23):6572. https://doi.org/10.3390/su11236572
Chicago/Turabian StyleBottani, Eleonora, Letizia Tebaldi, and Andrea Volpi. 2019. "The Role of ICT in Supporting Spent Coffee Grounds Collection and Valorization: A Quantitative Assessment" Sustainability 11, no. 23: 6572. https://doi.org/10.3390/su11236572
Note that from the first issue of 2016, this journal uses article numbers instead of page numbers. See further details here.