Consumer Habits of Local Food: Perspectives from Northern Sweden
by
 , ,
, ,
Agata Nicolosi
1,* ,
,
Valentina Rosa Laganà
1,* ,
,
Daniel Laven
2, 
Claudio Marcianò
1 and
Wilhelm Skoglund
2 1
Department of Agriculture, Mediterranean University of Reggio Calabria, 89100 Reggio Calabria, Italy
2
Department of Economics, Geography, Law and Tourism, Mid Sweden University, 831 25 Östersund, Sweden
*
Authors to whom correspondence should be addressed.
Sustainability 2019, 11(23), 6715; https://doi.org/10.3390/su11236715
Submission received: 27 September 2019
/
Revised: 31 October 2019
/
Accepted: 22 November 2019
/
Published: 27 November 2019
(This article belongs to the Special Issue Sustainability in Food Choice and Consumer Preferences)
Abstract
:International studies are dealing with the promotion of sustainable food systems more frequently. Additionally, places of purchase and sharing in the choice of food to be consumed have become a network system for families. The aim of this work is to analyse the preferences of Swedish consumers for local/artisanal cheeses and the purchase motivations that guide their choices. We also studied the role played by consumers’ favourite shopping locations (retail store, hypermarket, city market, supply chain). On the one hand, we examined the attractiveness and the power exercised by the various stores and on the other hand, we viewed the consumer in relation to the frequency of purchase, and the confidence with the sales points. We interviewed 200 people in the city of Östersund, highlighting habits, consumption preferences and reasons for purchasing. A multiple correspondence analysis explores the reasons behind the purchase preferences of the local ‘Källarlagrad getost’ artisan cheese from the Slow Food brand. The representations of social network analysis are used to show the complex articulations that influence the choices of consumers in terms of type of cheese purchased/consumed and places of purchase/consumption. The results showed that Swedish consumers, in the purchase of cheeses, have a loyalty point at the point of sale, follow the advice of the seller and are attentive to the reputation of the product. Those who buy Källarlagrad getost are sensitive to safety, appreciate artisan cheeses and choose them for their versatility, have a strong connection with the territory and wish to contribute to supporting the local economy. Knowing these characteristics and preferences of Swedish consumers living in a city in the north of the country is important for marketing activities and for promoting tourism and sustainable gastronomy.
1. Introduction
The European and international debate on the reforms of agrifood policies [1,2,3,4,5,6] clearly indicate the need to promote sustainable food systems and consequently adequate sustainable food policies capable of responding to the challenge of climate change, curbing the loss of biodiversity, reducing the rate of obesity and making agriculture sustainable for future generations.
Many authors support the need for changes in the way priorities are set and policies implemented. The need for a transition towards the sustainability of food systems is urgently required, which also takes into account the structural and functional characteristics of the systems of relations that exist between the actors of the supply chains.
In fact, within the food supply chain, there is market concentration, mechanisms of power, control and influence in the market of a subject compared to other subjects who are at a different level of the same channel. These aspects generate informative asymmetries and distortions in the transmission chain of prices, distribution and conditioning (in the choices and decisions) to the detriment of small agricultural producers and consumers and in favour of other figures along the chain [5,7,8,9,10,11,12].
An increasing number of cities and regions around the world are developing policies to build food security, promote sustainable and resilient food systems, and to stimulate a transition to sustainability and to the necessary changes in the way priorities are set and policies implemented.
When it comes to examining consistency and composition of food consumption, we highlight the different strategies implemented by consumers in response to variables of an economic nature (income and prices), sociodemographic and cultural. The recent economic crises, the lack of transparency in the prices of agricultural and food products do not guarantee the maintenance of the purchasing power of many European citizens; thus, contributing to determining new consumption behaviours and influencing the standard of living of the population. However, a fringe of the population that has lower spending levels, turns its preference to channels that offer the greatest opportunities for saving money and time (hard discount stores and hypermarkets). Furthermore from another perspective, many consumers tend to organise their buying habits in a critical and ethical way: they are attentive to sustainable production systems, to the place of origin, to the quality, to the typicality and to safeguarding local productions at risk of extinction [8,12,13,14,15,16,17,18].
The research on critical and ethical food consumption involves broader aspects of social life. The quality sought in agrifood productions has consequently taken on different and broader connotations: a direct relationship is established between producers and consumers, oriented to provide reassurance on the origin, quality and control of food products and on the reliability of the producer [15,19,20,21]. The producer allies strongly with the consumer, who directs the market and becomes a key image for the dissemination of the concept of quality [22].
New food trends show a greater attention to the local/ethnic dimension, to the conviviality, and to the skills and gastronomic peculiarities of a territory. The kitchen, the wines and in general, the typical products, are considered as expressions of a culture, repositories of traditions and of group identity. On the other hand, for many consumers the cultural aspect remains fundamental in the definition of behavioural models deriving from greater information/awareness, from the relationship that exists between food and health/well-being and between healthy nutrition and both environmental and social sustainability [23,24,25,26,27,28,29,30,31,32].
Tradition (as well as genuineness and regional food) is a social construct that involves social actors and can be a site of clashes and criticisms [33]. Traditional food is frequently consumed or connected to particular holidays and/or seasons, transfer from one generation to another, are manufactured in a particular way in accordance with the culinary heritage, processed in a selected manner, stand out, is recognised due to their sensory properties, and related to a particular local territory, region or country [34,35]. Brands of regional food products are based on tradition, enclosing habits of manufacturing and consumption, and are based on the localisation of production processes and the origin of raw materials [36]. Niche and quality productions are disseminated through commercial catering services, fuelling consumption channels such as restaurants, wine bars, wineries and farmhouses, increasingly confirming growing links between food, land and tourism.
In the choice of purchase, consumers are influenced by cultural, social, psychological motivations, etc., and from attitudes and food choices that may be conscious/rational and/or emotional/spontaneous, such as food safety, organoleptic quality (taste, smell, etc.), range of choice, brand, price, reputation, possibility of buying online, link with the territory, 0-Km purchase, helping farmers and environmental sustainability [25,26,27,28,29,30].
Even places of purchase, frequency and sharing in the choice of food can become a network system for families, evoking the recognition of the “place of purchase’ as a space of community and sharing [37,38]. Places of purchase and consumption considered as ‘networks’ favour new constructions of knowledge and planning, new and old relationships that can also exert a greater or lesser capacity of attraction. New consumer behaviour paradigms are advancing and consolidating day by day, stimulated by young people who are increasingly paying attention to sustainable growth models [39]. In this context, new forms and organisational systems are growing all over the world, such as the Food Community Networks that envisage a direct sales/purchase relationship between producer and consumer, resulting in clear advantages for consumers, producers and the community [40].
Furthermore, if on the one side consumers are inclined to discover the link between the territory and the quality of food products (in terms of diversified products and high historical and cultural content), making choices due to social media and sharing, also by those who make the purchase, on the other side, rural communities are reorganising themselves in an attempt to raise the value of their products, developing a network system and alternative food communities, such as CSA (Community Supported Agriculture), short supply chains, e-commerce, organic production, PDO (protected designation of origin), and PGI (protected geographical indication), etc.
From the point of view of social networks, studies are emerging that examine the relationships that look at the social interaction between consumers and social/cultural capital that are created in the market; precious resources such as the reputation of food production in terms of typicality and identity, food security, links with their territory and attractiveness for tourists [41,42,43].
This involves deepening the food supply chain and local production systems in which the level of shared knowledge, history and food culture determines the nature of the relations between producers and consumers. Consumer loyalty and purchasing decisions are based on the reputation of the product (and local producers), on social, territorial, cultural factors, on food safety, on biological products, and on those that respect the environment.
In this context, looking at points of sale through a social network analysis (SNA) is interesting to examine the relationships and the type of (strong or weak) links between buyers and sellers, whether they are points of sale in the city, or whether the consumer is interested in researching the produce in restaurants, sales points on farms, fairs and other places where they look for unconventional food production. Furthermore, knowing the type of links present in the network and their characteristics can allow an improvement in marketing to increase or maintain a competitive advantage and an adequate market positioning [42,44,45,46].
These aspects will be examined in this document. In particular, we will study how the relationship between consumers and products works and we use a SNA to identify the form of relations between consumers and suppliers based on consumer choices to understand and explain the nature of these social interactions and to understand the kind of strategies that retail outlets use to maintain their relationships with their consumers. In fact, it is through relationships and social capital enclosed in local ‘artisanal food’ that two main resources are formed: relations between buyer and seller and reputation (both ‘artisanal food’ and point of sale).
The most significant element in our study is the attempt to integrate the network analysis with multivariate analysis techniques.
Recent studies analyse some economic aspects of wholesale, the behaviour of buyers and sellers. From a social network perspective, they debate how asymmetrical flows of information organise the market and how markets are created by the production and circulation of cultural and social capital as well as goods, services and financial assets [7,38,41,47]. Network theory is starting to be used by scholars and marketers in multidisciplinary research, yet only a few scholars seem to have used it. This study utilizes SNA to discover the shape of the relations taking place in the market and the resources built on consumer behaviour to understand and describe the nature of these social interactions [37,38,41,46]. In some studies examining consumer preferences, MCA (Multiple Correspondence Analysis) was used.
2. Local Artisan Cheeses in Sweden: A Case Study
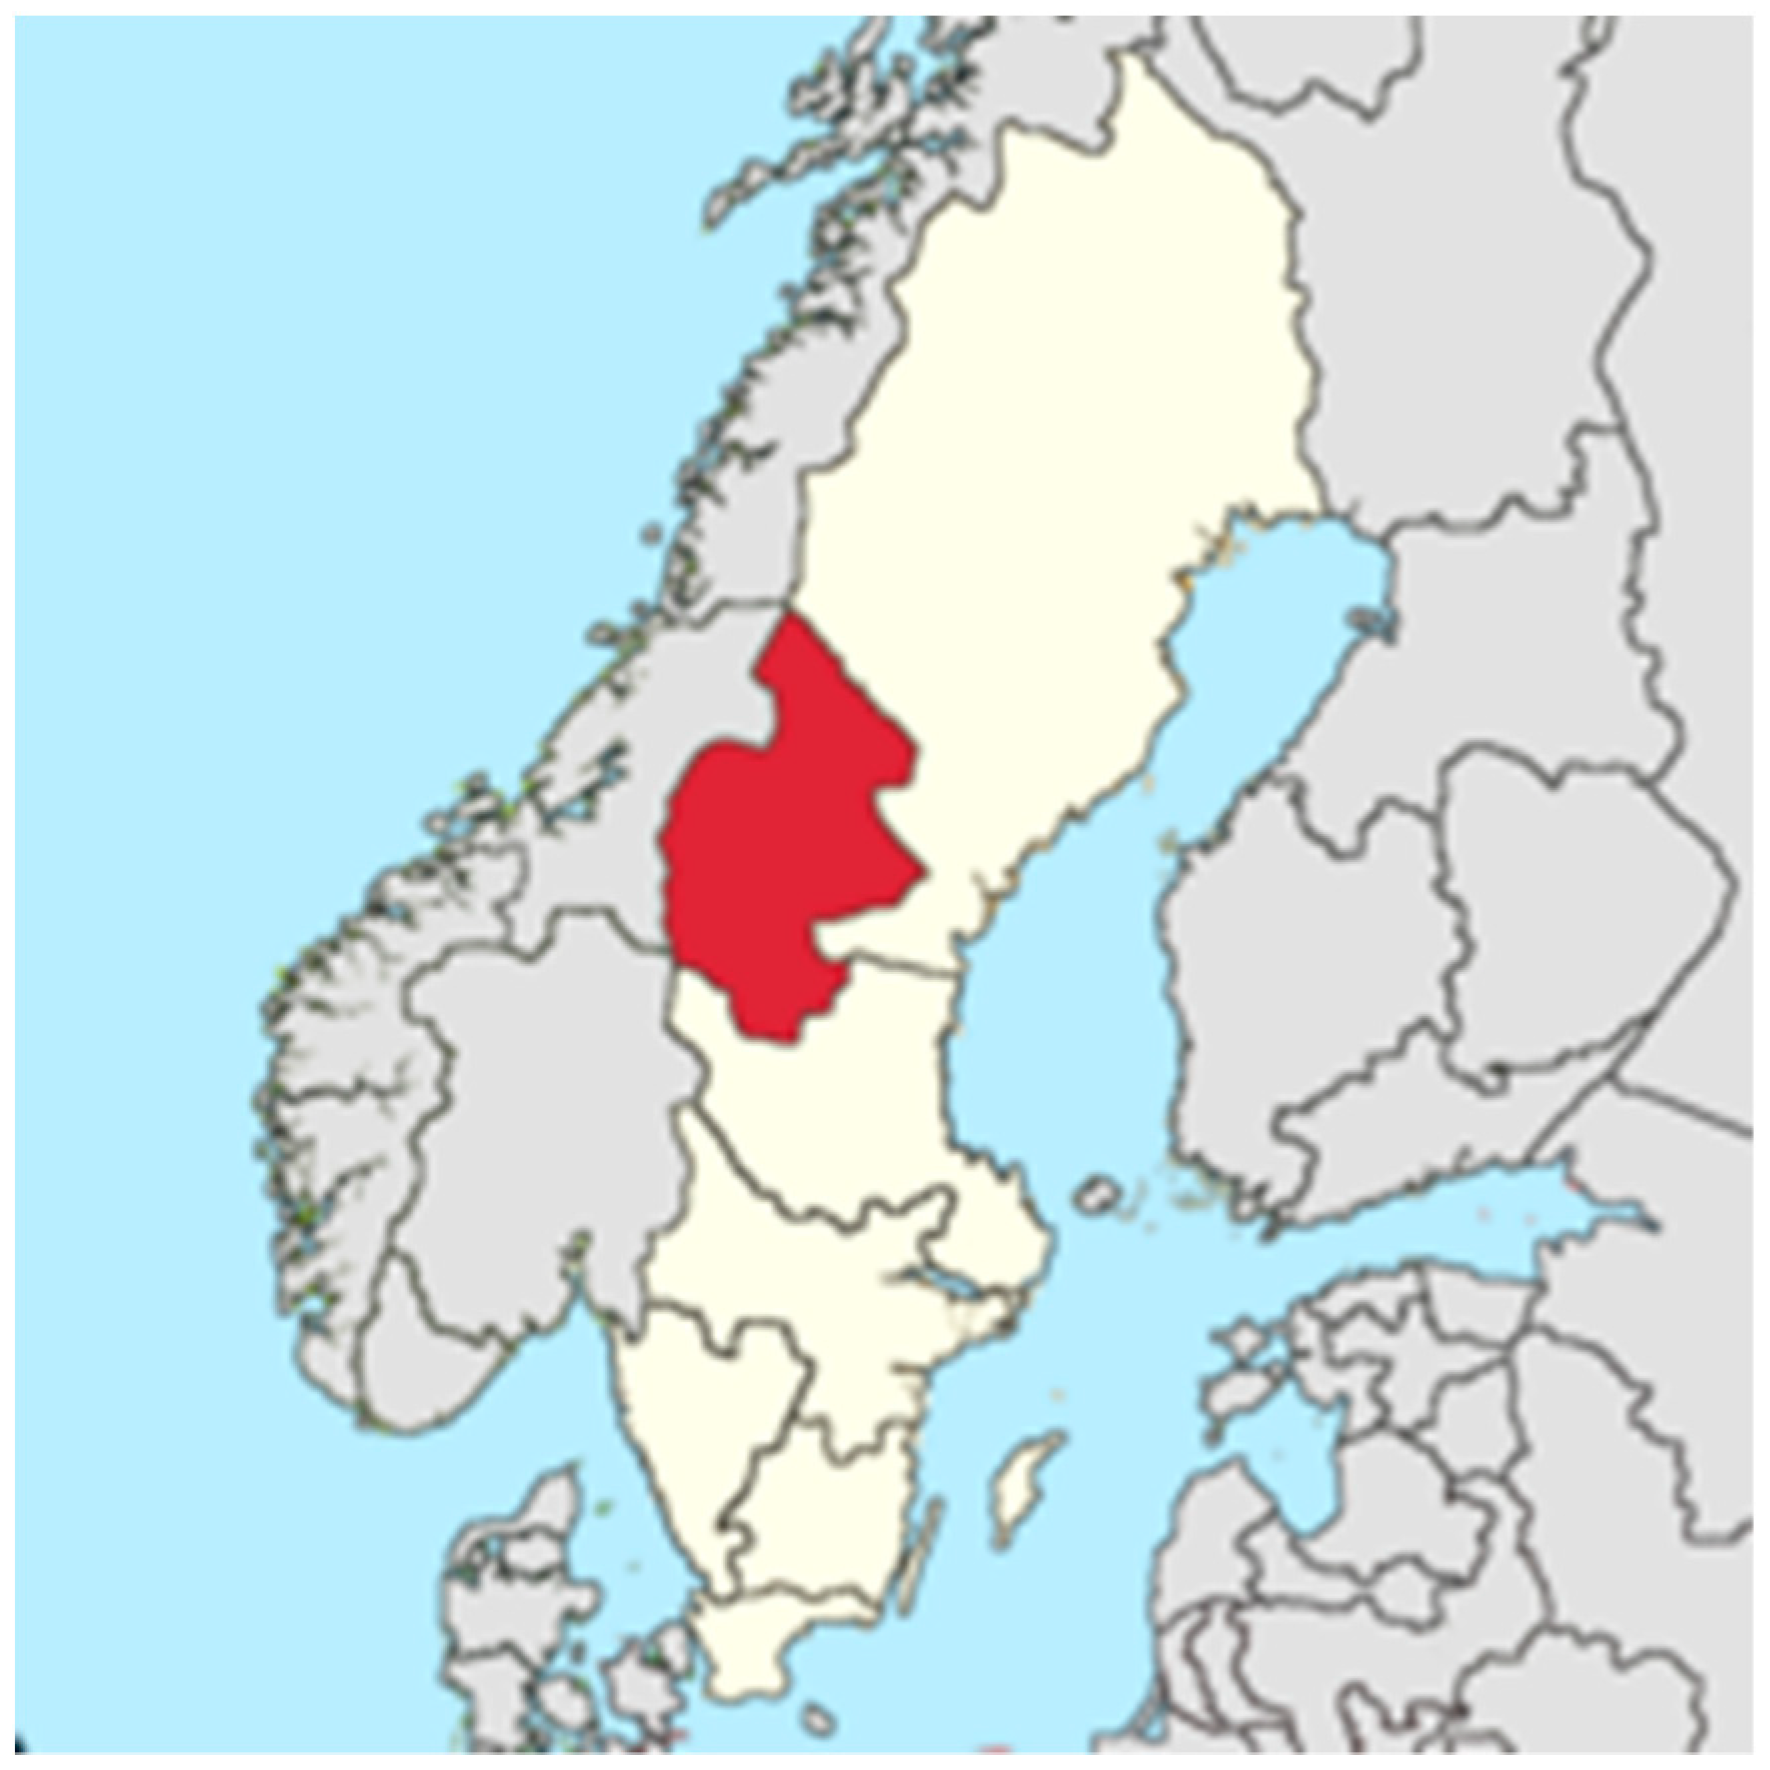
The Jämtland region is located in the centre of the Scandinavian Peninsula (Figure 1) in northern Europe, near the Norwegian border. The natural resources are the pillar of economic activity. Agriculture, forestry, and tourism are important economic activities in Jämtland.
Jämtland is a centre of Swedish gastronomy of this Nordic territory includes a wide range of typical agricultural and agrifood products, made by small agricultural and agrifood production units. This explains why Östersund, in Jämtland, was designated as a UNESCO ‘Creative City of Gastronomy’ in July 2010 [48,49,50].
Among the most well-known products are Källarlagrad getost, a mature goat cheese designated as a Jämtland Slow Food Presidium; cold meats; sausages and dried meats, such as Reindeer Suovas (salted and smoked lean fillet), another Jämtland Slow Food Praesidium product; smoked herring; and freshwater salmon and trout. These, and many others, are among the dishes that characterise the cookery of the Sami people.
According with some data, updated to 2017 (Figure 2), we can see that with the passing of time, cheese production has decreased, at the same time its consumption has almost doubled, so it does not cover consumers’ demand.
In Sweden, the deep industrialisation of the agrifood system has created an agrifood economy that, for a long time, was export-oriented and based principally on large-scale distribution. Therefore, consumers typically buy all of their food in large supermarkets, where there are often not any local cheeses or other artisan food products available [43].
The re-emergence of interest in local food in Sweden is relatively recent; since the 1970s, the Swedish government has paid great attention to agricultural activities, favouring the creation of agrifood cooperatives and the diffusion of modern production technologies and bringing consumers closer to the local food market [51].
According to recent studies [52,53] on buying habits, 60% of Swedes are willing to pay more to support sustainable production and to buy quality products The demand for top-quality products and local artisanal products is growing, in particular the demand for certified products, organic products and transparency is constantly increasing: the Swedes want know where and how the production of organic products and local artisanal products takes place.
Many Swedes are looking for food that respects their values, in particular they are very worried that in the production process there is respect for animals and for nature but two-thirds of purchasing decisions are made inside the shops relying on the seller’s advice [52,53,54].
In general, in Sweden the largest consumers of organic products are women (they buy organic products more frequently than men), families with young children, but also singles and graduates are above average. The Swedes are among the world’s largest consumers of cheese (they rank 11th with around 20 kg per capita/year) [52].
Profiles of Källarlagrad Getost goat cheese consumer groups were carried out by Rytkönen et al. in 2013 and 2018 [43,55]. In their research, the authors interviewed consumers from the rural areas surrounding the production area, highlighting a strong connection with the local goat cheese determined by the personal and emotional connection of the interviewees with the historical, cultural and territorially incorporated values with the Jämtland. Our research explored the variables that drive consumers that live in the city, in Östersund, to buy local/artisan cheeses, the purchasing motivations that guide their choices, and place where they prefer to buy them.
In the last decade, the Great distribution-organized (GDO) chain has gained great market share even after having introduced numerous private labels, which have gained significant weight in the Swedish food consumption basket [53]. However, the distribution channels are varied and range from organic bazaars to small retail stores, from supermarkets to online direct sales [54].
The increase in service offered by food sharing has also created a new trend in Swedish habits, namely that of shopping online, buying ready-to-deliver dishes at home, devotion to food sharing, becoming “foodies”, etc.
These trends are significantly changing the distribution channels of the agrifood sector: online shopping and purchase of ready-made meals gained a market share of 15%–18% in volume in 2018.
With particular reference to artisan cheeses, the studies by Filipović [56], Silvestri [57], Ribeiro et al. [58], Giraud et al. [59], Adanacioglu and Albayram [60], Paxson [61] and Brunori [26] highlighted consumer trends towards the search for cheeses produced in specific areas. The local artisanal cheese is recognised and appreciated by consumers for its qualitative aspects and for its economic, social, environmental and ethical values. Particular attention is paid to the health aspects, research has emerged relating to the practical implications for the role of labelling in cheese consumption as highlighted in the study by Schouteten et al. [62], in which the labels have influenced the intensity perceived by consumers with respect to the attributes of the product/cheese (e.g., salt intensity, for a reduced salt label).
In other cases, the different consumer perceptions of artisanal cheese produced in different areas of the same country can provide information on the cultural differences of consumers and also provide suitable guidelines for producers to develop marketing strategies that take into account the differences between cultural events [63].
3. Materials and Methods
3.1. Research Hypothesis and Methodological Approach
3.1.1. Research Hypothesis
To examine the appreciation by consumers intercepted in the city of Östersund (Sweden) for local/artisan cheeses, we have identified the following research hypotheses that relate consumers to their purchasing choices and consequently the desire to buy and pay local artisan cheeses:
Hypothesis 1 (H1).
Consumer perceives and buys local/artisan cheese for its quality and intrinsic characteristics.
Hypothesis 1a (H1a).
Consumer perceives local/artisan cheese Källarlagrad getost Slow Food as a particularly fine cheese.
Hypothesis 2 (H2).
Consumer buys local/artisan cheese because they want to support the local economy.
Hypothesis 3 (H3).
The purchase of local cheese by the consumer is linked also to specific extrinsic attributes of the product (advertising, price etc.).
Hypothesis 4 (H4).
When I buy cheese, I prefer local artisan cheese when possible, Källarlagrad getos.
Hypothesis 5 (H5).
The choice of the place of purchase is conditioned by the attractiveness and the loyalty of the point of sale and by the connection that the consumer has with it (strong or weak).
Hypothesis 6 (H6).
The choice of buying local artisan cheese is conditioned by the loyalty towards the sale point and by the advice of the seller.
Hypothesis 7 (H7).
The consumer who perceives the quality of the local artisan cheese buys it more frequently.
The core of our hypothesis therefore relates consumers’ perceptions of the quality of local/artisan cheeses; their attitude towards supporting the local economy; and their attitude towards extrinsic attributes. We also investigated the role of consumers’ favourite places of purchase (specialised shop, city market or super/hypermarket) in order to examine the attractiveness and power exercised by the various sale points. In this case, we also focused on the type of links (strong or weak) of the consumer with the store in relation to the frequency of purchase, to the advice of the seller, means of transport used to reach them and the stimulating factor that drive people to choose one or other of the different sale points. The research hypotheses are presented in Table 1. In particular, we addressed the following main research questions regarding perceptions/representations, impacts and motivations regarding cheese consumption and if for respondents each of the variables indicated has influenced “not at all”, “slightly” or “a lot” their purchase decision:
- Food safety, quality and health benefits
- Taste and Organoleptic qualities (flavour, colour, odour, freshness, crunchiness, etc.)
- Versatility (different uses)
- Attractive packaging
- Wide range of choice
- Craftmanship, Information about production and production process techniques
- Ethical trade and social responsibility
- Careful with source and brand
- Price
- Advertising
- The possibility of online purchase
- Organic food
- Traditional cheese of my area
- The advice of the retailer
- Helping farmers/ranchers
The preferences for the place of purchase can be motivated by loyalty to the point of sale, to the brand, to the seller. It can be a choice of comfort (it is near the house, it has parking, meeting friends etc.).
3.1.2. Methodological Approach
The SNA was used to obtain measurements of the relationships between consumers, type of cheese purchased and points of sale. According to this approach, the network is a set of vertices (nodes), edges (links) and the way in which the elements are connected. In our case, the links were detected by using incidence matrices and then adjacency matrices were created.
In the affiliation matrix we created, the lines indicate the actors/consumers and the columns what they buy/consume (local artisan cheese, industrial cheese and Slow Food cheese) and which are the different points of sale/places of consumption (retail shop/specialised shop, city market, super/hypermarket, short supply chain). We also considered the possible advice of the seller, the frequency of purchase (several times a week, once or twice a month, once every two or three months) and finally, if the consumption takes place at a restaurant or at a friend’s house).
Each relationship is indicated with dichotomous values (one, if the consumer buys/consumes the cheese at the point of sale and zero, if he/she does not buy/consume). The matrix is formally indicated as: A = {aij}, where aij = 1 if the actor row i has ‘purchased/consumed that type of cheese in that place’ indicated in column j or aij = 0 in the opposite case.
The choice of favourite type of cheese allowed us to examine the link between the consumer and the point of sale and/or place of consumption in terms of loyalty to the product and to the seller.
The incidence matrix has been realised (inserting the 200 consumers in the rows and the 10 modalities chosen in the columns).
The next step was to modify the incidence matrices into adjacency matrices (10 × 10) to observe the network relationships based on the choice of consumption and purchase. For the processing of the data, UCINET 6.0 version 6.631 was used, while for graphic representation, NETDRAW version 2.161 was used.
As for the indicators to examine the network analysis, some measures of network cohesion have been developed; in particular, the density that represents one of the main indicators of the degree of cohesion of a network [64] and the centrality, which measures how much a node is an important actor on the network. The centrality indicators used in this study are: degree and betweenness. A clique analysis was also conducted to examine the network in the breakdown into ‘cohesive subgroups’ called cliques.
To examine the ways in which consumers organise their food purchases, the survey used MCA. From a technical point of view, MCA is used to analyse a set of observations described by a set of nominal variables. We refer to the literature for more detailed information on the properties and objectives of MCA [22,65,66,67,68,69,70]. MCA attributes factor scores to each observation and to each category in order to express relative frequencies in terms of the distances between individual rows and/or columns in a low-dimensional space.
Further in-depth studies were carried out to examine the factors that influence the choices of cheese purchases of the interviewees and those that intervene, in particular, in the eventual purchase of Källarlagrad getost cheese. We used factor analysis in the first case, while we used the MCA to observe the characteristics and profiles of Källarlagrad cheese consumers.
This technique is widely used by researchers to observe the variables that characterise consumer behaviour [65,71,72,73,74,75,76,77,78,79,80,81,82].
To do this, we used the questions asked in the questionnaire coded as binary variables: one for the answer ‘a lot’ and two for the answer ‘slightly’.
After performing MCA, a hierarchical cluster analysis (HCA) was conducted for validation [69,70]. In the HCA, a hierarchical grouping was performed then optimised with K-means clustering [76,78]. The analyses were performed using IBM SPSS Statistics (version 20).
Consumer profiles were identified through representation in a low-dimensional space, planned on the basis of the components. The MCA is obtained using a standard correspondence analysis on a matrix of indicators (X). This is a J × M matrix in which Jk is the level vector for each nominal variable K (with ΣJk = J) and M is the number of observations. The execution of MCA on X will provide two series of factorial scores. These factor scores are, in general, scaled down so that their variance is equal to their corresponding eigenvalue.
In our case, the number of observed variables (k) is six, to which four additional variables were added (sex, age, level of education and cluster); the number of observations was from 58 consumers who buy Källarlagrad cheese. This analysis has identified some variables to distinguish the main characteristics that influence consumers’ purchasing choices.
Since our general objective is to collaborate to a greater comprehension of the psychosocial processes that contribute to the food selection process, we have drawn and used qualitative data from questionnaires given to consumers. The data set, appropriately organised and structured, was used for the analysis of the SNA, for factorial analysis and the MCA, which allowed us to identify the key issues to perform/raise/propose hypotheses based on the data and to be tested in further research.
3.2. Data Collection
In order to observe the ways in which consumers organise their purchases, the survey used direct interviews with consumers through face-to-face administration (to people available for interview) of a semi-structured questionnaire with open and/or preprepared answers. The questionnaire was administered in Östersund in the period from April to June 2017. Respondents were intercepted in particularly crowded places where a sample with differing characteristics could be found, such as main roads, bus terminals, areas near retail outlets, university areas, etc.
We also investigated the role that consumers’ favourite places of purchase have (specialised shop, city market or super/hyper market) in order to examine the attractiveness and power exercised by the various sale points. In this case, we also focused on the type of links (strong or weak) of the consumer with the store in relation to the frequency of purchase, to the advice of the seller, means of transport used to reach them and the stimulating factor that drive people to choose one or other of the different sale points.
The study first examined the analyses between artisanal products and industries and applied a network analysis to observe the appearance of the various sales points chosen for the purchase. It considered the point of sale and the frequency of purchase.
The links between actors were considered through binary measures: one, indicating that there is a bond; zero, the bond is absent.
Moving on to the applied multivariate analysis techniques, we developed a factor analysis to look at the habits in cheese purchases of the consumers interviewed, the variables used are indicated in Table 1 in particular those indicated for the motivations of consume.
Subsequently with reference to the Slow Food brand cheese, the study shared the operational choices from the variable analyses with the analysis of multiple correspondences.
The study looked at the main qualitative variables with a multiple correspondence analysis (MCA) in order to identify consumer profiles according to their choices (Table 2).
The questionnaire also detected the socio-demographic characteristics of the interviewed consumers. This allowed segmentation of the sample to check the consumption of Slow Food cheese.
Based on the collected responses collected, two databases were developed, one with the help of SPSS software (version 20) and the other with UCINET 6 software, the first to analyse consumers’ preferences and the reasons for their choices, the second one to look through the networks of the attractiveness of the various sale points in relation to some indicators such as the means of transport used for food shopping.
The collected data were processed, analysed and at first interpreted through descriptive analysis to highlight the principal characteristics, and we applied the two techniques of multivariate analysis, factor analysis and MCA. SNA was used to measure the relationships between consumers and markets. This method allowed us to study a relational system in a dual perspective: that of the consumers and that of the markets.
In the analysis, the consumers were grouped according to whether they buy cheese (local or industrial), if they buy Källarlagrad cheese, where they buy cheese, how often and why, and with what transport they go to make their purchases. Consumer preferences were grouped according to the places of purchase in order to identify the part they play in the choice/participation to buy in those places.
According to this approach, a network is a set of vertices (nodes), edges (links) and the way in which both elements are connected, while the borders represent the commercial relations between these agents. In our context, the nodes are represented by the choices of consumers: consumers who prefer to buy local cheese; consumers who prefer to buy industrial cheese; those who also buy Källarlagrad.
SNA provides some metrics at the node and network level of the structure and performance of social networks and has been widely used to analyse the relational characteristics in the social sciences.
In the SNA, we used the variables indicated in Figure 3 this choice allowed us to see the buying habits of the interviewees through the ‘graphs’, ‘network cohesion measures’ and ‘cliques’ for the decomposition of the reticle into ‘cohesive subgroups’.
We examined how they organise their purchases and/or consumption of cheese during the year, where they buy, how often, if they accept the advice of the seller, whether the store is close to home or not. We asked why they buy it. This data was collected to circumscribe the relevant social context with the object of study in which to identify a system of social actors and the set of ties that connect them in relation to a specific social relationship.
As for consumption and possible purchase of Källarlagrad getost Slow Food, the following questions were asked:
Have you heard of cellar matured goat cheese from Jämtland? (In Swedish: Källarlagrad getost)Have you ever tried it? If yes, where?Have you or do you ever purchase it? If yes, is the product easily found?
We continued with the questions to identify the measures indicated in Table 1.
The MCA analysis was applied to examine, in particular, the preferences and profiles of those among the respondents who buy Källarlagrad getost Slow Food cheese. Fifty-eight consumers were asked specific questions.
After several checks, we saw that the variables shown in Table 2 were those that, based on the questions asked, provided the highest level of variance explained.
4. Results
4.1. Characteristics of the Sample
The consumers interviewed are aged between 19 and 80 years old. From Table 3, it emerges that most of the consumers interviewed in Östersund have an age ranging from 18 to 30 years (48%), with a slight prevalence of women (53.5%). Forty-nine percent of the respondents are graduates. There are various occupations of respondents, in particular, we note the highest percentages relative to students (37%) and employees (25%). Family income is mainly medium–high (56.5%). Regarding family composition, we have 42.5% composed of 1–2 members, while 26% is composed of five members and over.
As shown in Table 4, consumers who prefer to buy artisan local cheese are 45.5% (91 respondents); consumers who prefer to buy industrial cheese are 47.5% (95 respondents); those who also buy Källarlagrad are 29% (58 respondents). Seven per cent of the respondents say they never buy cheese because they do not like it, because the price is high or for other reasons. Consumers buy cheeses at the specialised shop/retail shop (51), at the hypermarket (81), at the city market and through the short supply chain (45). About 7% of respondents buy in more stores depending on the occasion (supermarket + city market and/or short supply chain). In addition, local artisan cheeses, such as the Källarlagrad, are enjoyed at restaurants or friends’ homes (37 respondents). Many follow ‘in part or a lot’ the advice of the seller (157). The cheeses are bought regularly, several times a week (41), several times a month (98) or once every two or three months or on some occasions (33).
4.2. Results of the Network Analysis
Let us examine the results of the SNA. With the use of the UCINET 6 program, some descriptive measures of the considered network were taken into consideration: for an analysis of the cohesion level of the network, the density, distance and centrality (Table 5) have been elaborated. For the centrality measurements, the degree and between indices were considered. An analysis of the cliques was carried out for the breakdown of the reticle into ‘cohesive subgroups’.
One of the main descriptive measures used to investigate the degree of network cohesion is density. This index is given by the quantity of the relationships and corresponds to the ratio between the number of links actually present in the network and those that can be potentially activated.
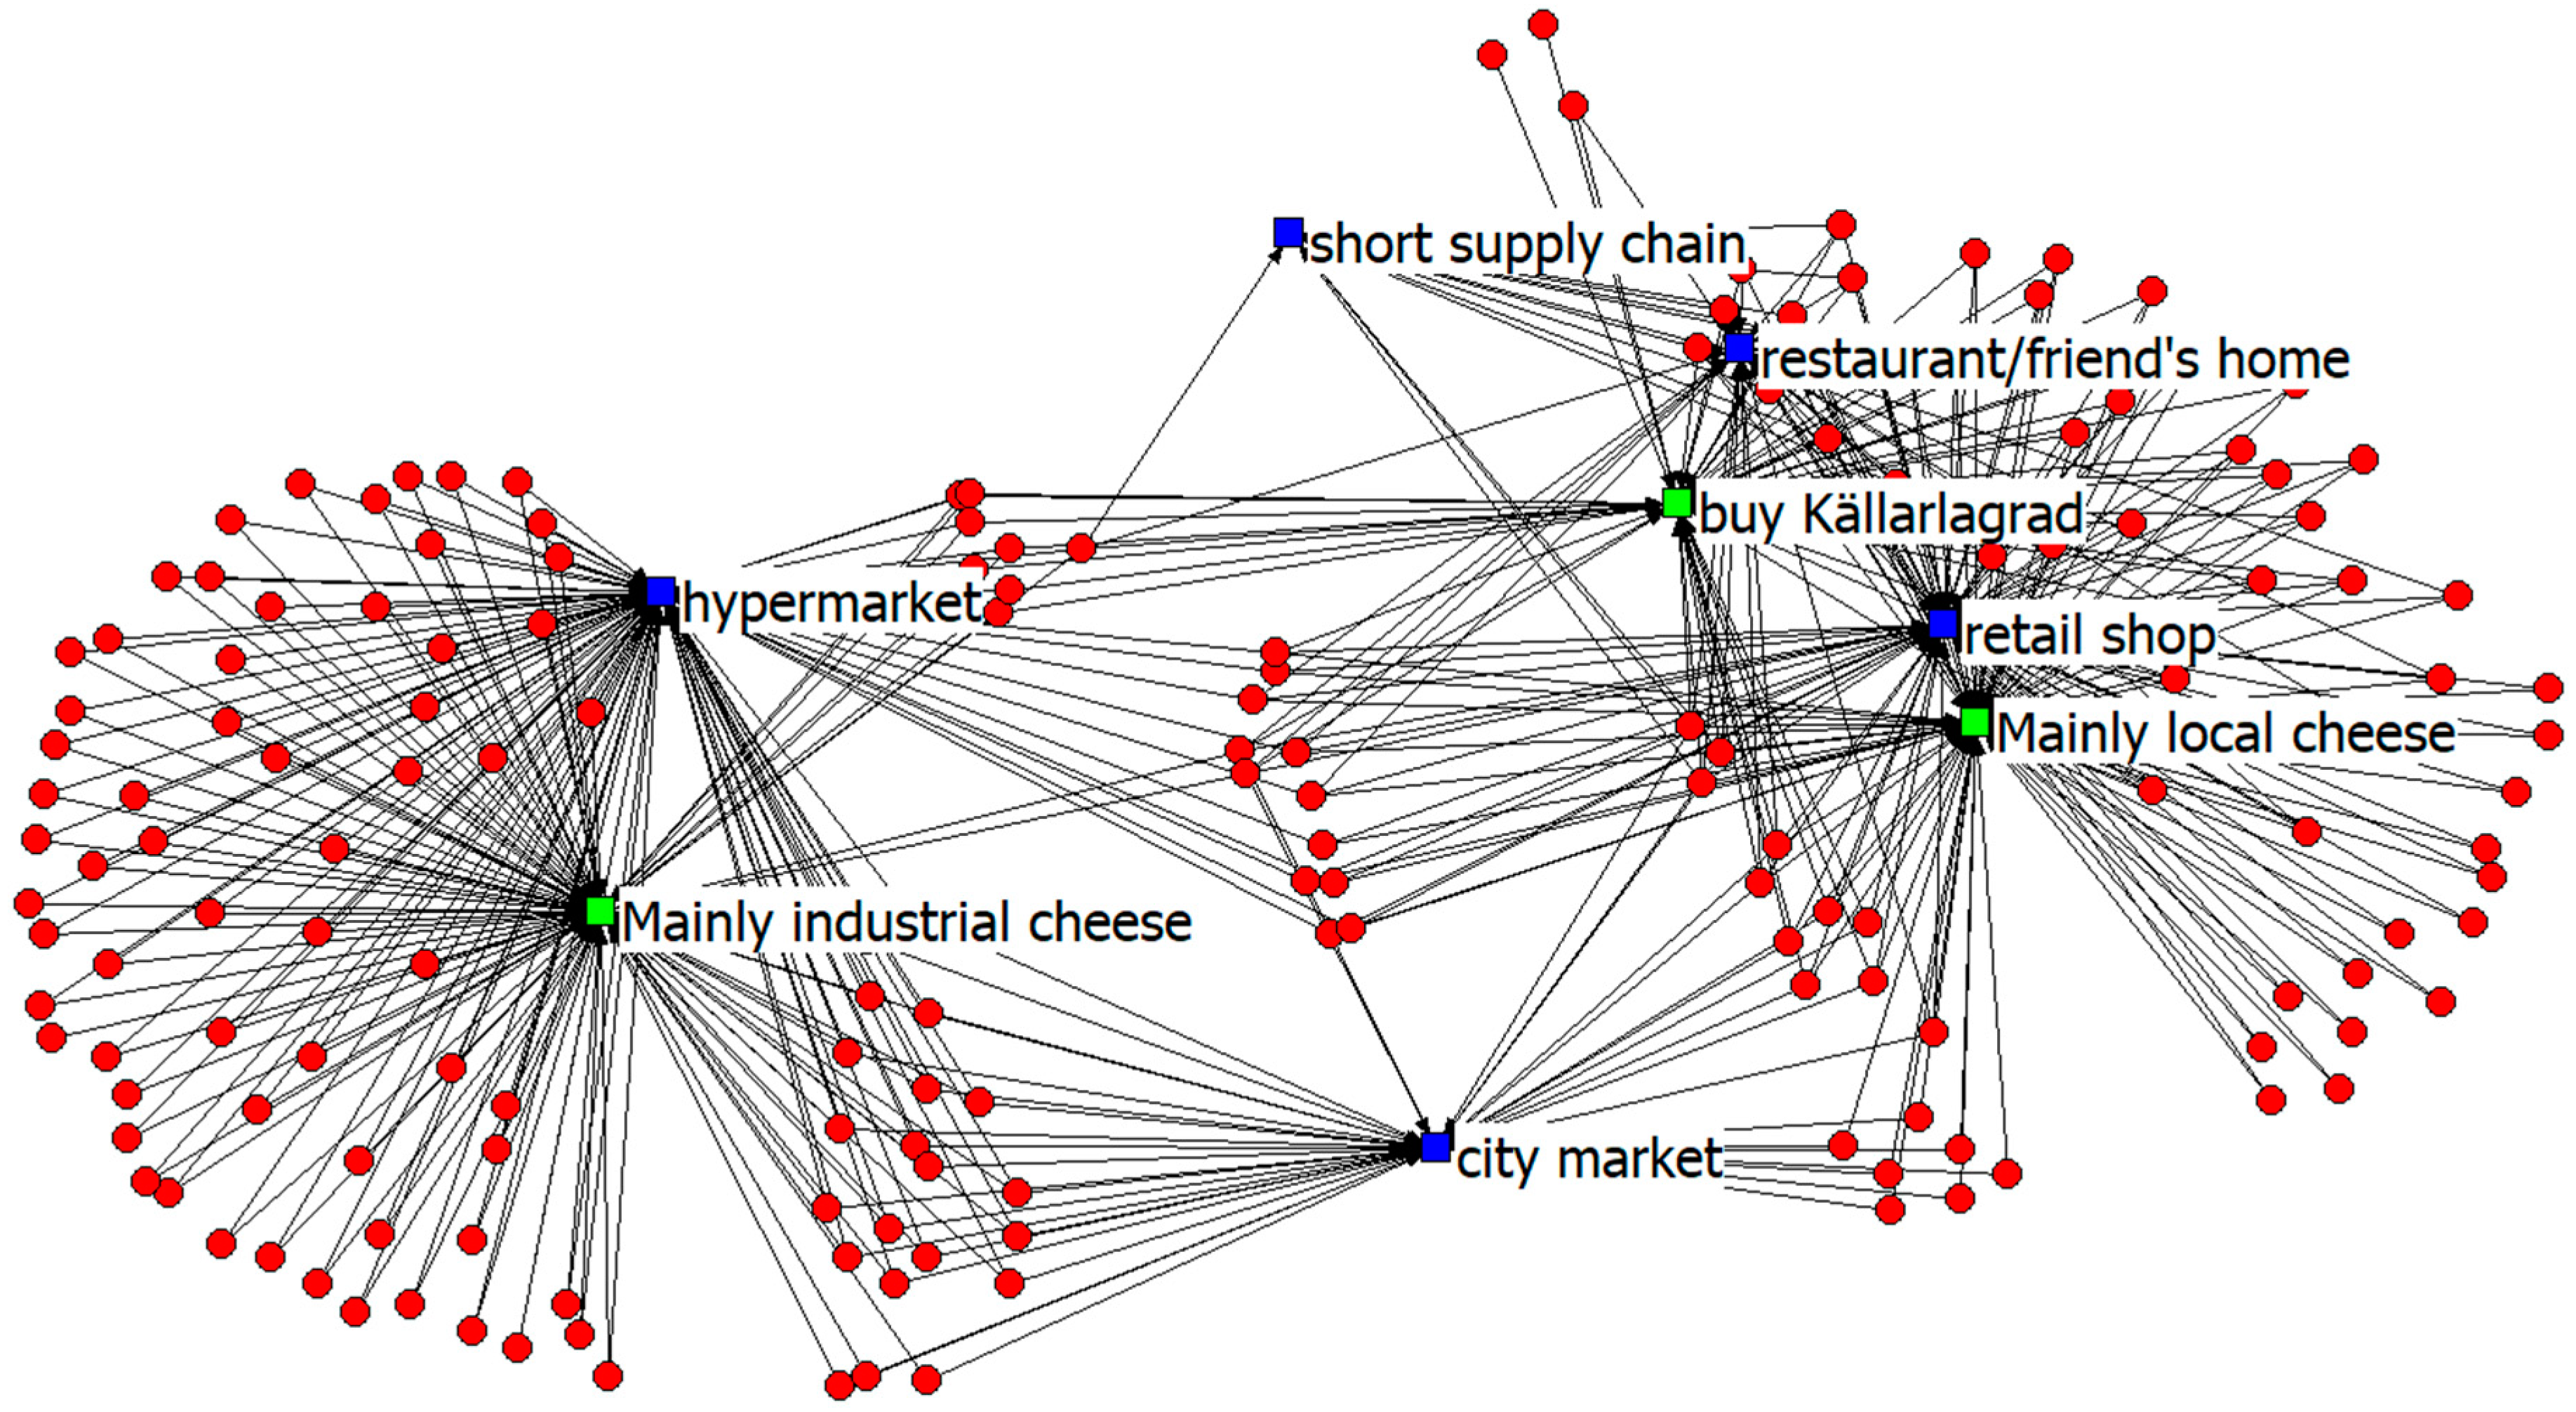
Figure 3 shows the graph relating to the preference of consumers interviewed towards the three types of cheese (What is the purchase of local cheese, industrial and Källarlagrad) and the point of sale preferences.
In our example, we took consumer preferences into consideration in relation to the ‘What’, ‘Where’, ‘Retailer advice’ and ‘When’ categories. These preferences represent the modalities that we want to measure within the investigated reality. The SNA allows us to see the links between the preferences expressed by consumers in order to grasp those modalities that more or less strongly characterise their choices.
Figure 4 shows the graph relating to the preference of consumers interviewed towards the three types of cheese (What is the purchase of local cheese, industrial and Källarlagrad); the point of sale preferences (Where?); the influence exercised by the ‘advice of the seller’ (aware of the reputation of the product, and trust in the seller); and finally, the purchase frequency (When?). In the following graph, the sociometric network represents the relationships between consumers and the categories ‘What’, ‘Where’, ‘Retailer advice’ and ‘When’.
Density is one of the main descriptive statistics and is often used as the main index of the degree of network cohesion (Table 5). The average density of the network is equal to 0.5111 and, given that the index varies from zero to one, it is a good level of network cohesion; which means that 51.11% of all possible links are present. The value of the standard deviation is equal to 0.4999, which indicates the dispersion in the network and a high variability in the bonds. The standard deviation measures how much variation exists between the values of the matrix. The density measurement allows us to define a cohesive network in which there are many links.
However, the cohesion of a network can be calculated in different ways. One of the main techniques of network analysis that make the concept of cohesion operational, is based on distance measurement. This procedure elaborates three important cohesion measures:
- The average distance (average of the geodetic distances): the values contained in the distance matrix represent the shortest path connecting each pair of actors. In this case, the average of the geodetic distances between all the pairs of nodes is represented by a value equal to 1.531. Therefore, the pairs of actors are fairly close together and the network is averagely connected.
- The distance-based cohesion index, ranging from zero to one, the closer the value to one, the greater the cohesion of the network. In our case, this cohesion index, equal to 0.691, indicates good cohesion.
- The third measure, distance-weighted fragmentation, derives from the fragmentation measure ‘F’ of the network, which indicates the proportion of pairs of nodes that cannot be reached by any other. It is an index that ranges between zero and one: if all the nodes are reachable from each other (for example, in the case of a single component), then F = 0; if all the nodes are isolated then F = 1. Distance-weighted fragmentation is calculated on the reciprocal of the distance (1/d). This index also ranges between zero and one; when the value is zero, it means that each pair of nodes is adjacent to each other; when the value is one, the nodes are all isolated. This indicates the proportion of nodes that cannot be reached by any other. In our case, we have an average value of 0.309, which indicates that each pair of nodes is close to each other.
The categories are as follows: green ‘What’; blue ‘Where’; light blue ‘Retailer’s Advice’; orange ‘When’. Own elaboration. Source: The authors.
The centrality measures (network centrality) allows defining the positioning of an actor in his own network in relational terms, in our case the Östersund cheese trade studied in this article. It is a question of examining the consumer’s social network in relation to the presence of a link between consumer and purchase and consumption methods that indicate the existence of a product flow from a seller to a consumer. The quantity is unknown; however, a strong bond is established when the seller regularly supplies the products to the buyer and a weak link if the commercial relations are casual or sporadic.
Centrality can be expressed in three ways and therefore, the actor is more central according to the situation. In our case, it is useful to look at the degree centrality and the betweenness centrality, examining the proximity of a node to any other point in the graph and consequently, the efficiency with which it can reach all the other nodes of the network.
As can be seen from Table 6, as regards the Freeman’s degree centrality measures, we have indicated the standardised Indegree values expressed as a percentage (i.e. divided by n-1 and multiplied by 100). In our case, it is a question of highlighting the choices received from the ‘What’, ‘Where’, ‘When’ and ‘Retailer advice’ from consumers in the network. That is, the popularity of the products, of the places of consumption/sale, the ability and reputation of the seller and the frequency of purchase. The centrality indicator calculates the share of actual connections over the total of potential ones, measuring the relevance of the activity. High values of the indicators should also correspond to a greater ability to relate to consumers. As indicated, the ability to advise the customer is the one most favoured by consumers (100%), followed by the possibility of tasting cheese at a restaurant or at a friend’s house (88.88%) and the preference for local cheeses (66.67%). The ‘Indegree’ network centralisation records a total of 54.32%.
The ‘betweenness’ indicator (also a centrality indicator) indicates the frequency with which each single node is in the shortest path that connects each other pair of nodes. In other words, it reflects the relevance of nodes in terms of ‘intermediation’ in exchanges: the more the node in question constitutes an obligatory passage in transactions between two nodes (which therefore do not exchange directly between them). In this way, the presence of nodes with high betweenness can strengthen the transmission mechanisms of the bond. In fact, the nodes with the highest centrality value are the ‘Mainly for local cheese’ (20.950) and the ‘Retailer advice’ (7.950) with a standard deviation of 6.182 and a network centralisation index of 25.69%.
4.3. Clique Analysis
A strategy to examine the network in the breakdown into ‘cohesive subgroups’ is called cliques. After having transformed the dichotomic matrix into a symmetric matrix with the UCINET programme procedures, we obtained a hierarchical structure of the clusters represented through the tree diagram in Figure 5.
This method examines groupings of cliques according to the sharing of pairs of actors. The distance between the categories belonging to the same group is expressed by the length of the branching that connects them. The diagram is based on the amount of activities chosen by consumers. As can be seen, two groups and an isolated case can be considered. A first cohesive group is represented by five modalities (2, 1, 5, 7 and 9): those with the greatest dynamism are the purchase of cheeses (both local and industrial), followed by the type of frequency ‘once or twice a month’, from the advice of the seller and from the place of purchase to the supermarket.
In the other group (4, 6, 3 and 8), the Källarlagrad purchase and the ‘retail shop’ store represent a cohesive subgroup, as well as the two types of purchase frequency ‘several a week’ and ‘once every two or three months’.
Mode 10 ‘other shop/restaurant/friend’s home’ is isolated to show that, if removed, the network does not disconnect. This aspect seems to underline the power exercised by sales outlets and the traditional purchase of cheeses with respect to consumption in restaurants and/or in friends’ homes and with respect to short supply chains.
4.4. Factor Analysis and MCA Results
As shown in Table 7, the factor analysis identifies four components that represent 52.3% of the total variance (The processing followed the traditional procedures for identifying common factors. After verifying the statistical significance of the data, the criterion of variance explained by the factors and the screen test (Fabbris, 1997) was used to determine the number of factors necessary to explain the correlation between the variables. An orthogonal rotation was applied with the varimax method, which allowed a simpler reading of the matrix of the extracted components). The first component represents 15.2% of the overall variance; these the are reasons that relate to the possibility of the consumer having a wide range of choices and adequate packaging so that the production is ethical and respectful in terms of social responsibility and an aid to farmers. Furthermore, the consumer appreciates the versatility of the food purchased. This component represents consumers’ social attention.
The second component represents 14.5% of the explained variance and represents the local identity of the consumers who are attentive to the production technique, the origin and the label (careful with source and brand), buy organic products and respect their area.
The third component represents 12.6%. The characteristics of this group of motivations pertain to the characteristics of trust and reputation attributed to alimentary goods by consumers; in fact, we find that in this component, the influence of advertising, the possibility of online purchase and the influence of seller advice are significant factors.
Finally, the fourth component represents 10.1% of the variance and concerns the attention paid to quality attributes because they appreciate food safety, intrinsic characteristics such as taste, and are attentive to the prices of food products.
It therefore appears that it can be said that in the city of Östersund in Sweden, consumer preference for the product is probably also influenced by local culture and tradition. The product is therefore chosen on the basis of a cognitive relationship between the consumer and the product connected to the knowledge of the food purchased, of the family tradition and of eating habits.
In Östersund, six dichotomous variables were selected to implement the MCA, identified among those that indicated greater quality attributes and with purchase motivations connected to social and cultural factors and with strong buying habits.
Based on the results obtained, consumers of Källarlagrad getost are particularly attentive to safety, craftsmanship, links with the territory and support of the local economy.
As shown in Figure 6 and Figure 7, the first results of the MCA analysis conducted between the consumers of Östersund show the four main variables (security, craftsmanship, links with the territory and support of the local economy) in the semi-negative axis for dimension 1, while from Figure 6 we identify how these six variables represent the main discrimination measures for consumers interviewed.
The choice of doing the MCA analysis on six of the identified variables was used after carrying out various tests and finding that the choice had the highest level (percentage) of variance explained. For each dimension, the analysis measures inertia and eigenvalues, expressing the amount of total data variability explained. Compatibility with the study carried out was assigned to the two-dimensional solution as being more effective. In the MCA, in the first dimension, the inertia is 0.365 (36.5% of the explained variance); in the second dimension, the inertia is 0.206 (20.6% of the explained variance). In total, this gives an eigenvalue of 3.424 and inertia of 0.571 (57.1% of the explained variance), as shown in the model summary (Table 8).
For the first two dimensions, as explained in Table 9, we see the distribution of discrimination measures of the studied variables and the resulting centroid coordinates of the MCA.
For the formation of each axis, dimension reference is made to the discrimination measures that indicate the most important variables and the coordinates of the centroid (Table 10) that serve the reader to identify each category in the diagram.
As shown in Figure 7, the results of the MCA analysis conducted among Östersund consumers show the following variables in the semi-positive axis for dimension 1: they are safety-conscious, prefer artisan cheeses and choose them for their versatility; they have a strong connection with the territory and wish to contribute to supporting the local economy.
These variables are all clustered in cluster 2: they are female; two age groups are included, that of ‘31–50 years’ and that of aged ‘over 50 years’; as for the level of education in this cluster, consumers are graduates. The profile of these Källarlagrad consumers can be defined as ‘careful and aware’ consumers.
In the negative half-axis for size two, we find consumers who buy Källarlagrad mainly for taste, while they are not particularly attentive to the other variables we have selected. These consumers belong to cluster 1: they are male; the age class is the youngest ‘18–30 years’; the educational qualification of the falling ones in this cluster is ‘middle-high school’. These are consumers whose profile can be called ‘young gourmets’.
5. Discussion
Sweden is going through a period of transformation and there is an increase in interest in local food. Families articulate their consumption basket in an increasingly diversified way. They also choose according to the places where they go to shop. Our research was concentrated in the Jämtland region, which is a centre of Swedish gastronomy, and in particular in Östersund, which in July 2010 was designated a ‘Creative City of Gastronomy’ by UNESCO.
For this reason, Sweden has represented an interesting reality to explore because it is only recently showing a renewed interest in the purchase of local artisan food.
The results analysed in this study show that the consumers interviewed are divided into two large groups among which are those who prefer to continue buying industrial cheeses and another emergent group that purchase local artisan cheeses. We have also identified the people who buy Slow Food-branded ‘Källarlagrad getost’ cheese. In particular, the observed cases capture useful elements to highlight the complexity of the choices and motivations made by Swedish families, indeed, it is highlighted that the characteristics of the network are conditioned by the actions of consumers in choosing what, where and when to buy cheese.
From the analysis of the data, we can say that the most significant element in our study is the attempt to integrate network analysis with multivariate analysis techniques. We wanted to observe the phenomenon from two different points of view. SNA has allowed us to see the attraction of retail outlets and consumer buying habits. We used factor analysis to highlight their main motivations and MCA to observe the profiles of respondents who buy ‘Källarlagrad getost’. We identified two profiles the ‘careful and aware’ consumers and the ‘young gourmets’.
Thanks to the network analysis, we were able to compare the attractiveness of the various points of sale in the city of Östersund, which has both particular and peculiar characteristics from the point of view of the objectives of this study. The key concepts around which the network analysis is developed in addition to those of actors or nodes and the links established between them, refer to the social relationship, to the group or set, to the subgroup, to the social network. As part of this study, it was decided to use a particular type of analysis that is well suited to the study of consumer choices "as an innovative approach to assessing the composition and breadth of local consumption habits in order to document the processes of choice and of purchase determination in order to outline the essential characteristics/peculiarities and the reasons for their choices.” A network of system actors was created and the network elements were identified.
The affiliation network has some properties that distinguish it: it is made up of a set of actors and a set of groups in which the actors fit in with their purchasing choices, allowing them to study a relational system in a dual perspective. This system, as it has been developed, can represent a behavioral indicator that unites the actors and therefore gives rise to the links that we have grouped into what, where and when.
The analysis of the cliques also shows that two main cohesive subgroups are formed based on these choices: in the first group, the purchase of cheese (both industrial and artisanal) and linked to the advice of the seller, supermarkets and frequency of purchase of one twice a month are included; in the second group, we find those who buy ‘Källarlagrad getost’ cheese at retail stores with frequencies that vary from several times a week to once every two three months. A third isolated group concerns those who buy at short supply chains, at the city market or who consume artisanal cheeses in restaurants or at friends’ homes.
We are seeing more studies in the literature that are examining the relationships between buyers and sellers [41,45]. The aspects concerning the relationships between the reputation of the sales points and the buying behavior of the sellers are becoming increasingly central in the literature on local artisan products. The reputation that the local artisan product can enjoy is a central resource for building a social capital that also gives space to market transactions.
Knowing the buying habits and the reasons for choosing to buy local food products is, in fact, useful for developing appropriate policies and implementing marketing strategies that can stimulate healthier and more sustainable food choices [36,83,84,85,86]. According to Alkon and Guthman [87], food becomes the vehicle through which the sense of intellectual and psychosocial connection with the environment is realised—it becomes a part of people’s daily lives.
6. Conclusions
The study offers an original and yet not sufficiently explored contribution on the complex consumer–seller relationship. The actor-network approach we proposed in this study allows us to learn about consumption habits and trends and can help identify the key factors that influence the value of local brand handicrafts. It can help agricultural producers make decisions and formulate strategies suited to their products, find spaces for maneuver that can be realized in the short chain to attract consumers, increasing the visibility of their product, for brand recognition and to expand the target of customers.
In global agrifood systems, concentration and consolidation in production, distribution and retailing have reduced the diversity of food distribution channels. Against this, new challenges and new priorities are highlighted which involve trade flows, sector structure, competitiveness, social well-being and the environment and which can be far-reaching, but have not yet been well understood. Transformations are increasingly involving food standards, and new trends are highlighted in relation to new forms of vertical coordination, the introduction of new technologies and the modification of consumer preferences [5,6,83,85,86].
Sustainability has become a key concept for both local communities and marketers. To support and promote the development of rural areas and their potential to differentiate food products, an improvement in supply chain efficiency is needed. It can contribute to economic sustainability, can help and support producers, increase consumer choice and strengthen tourism growth in the local area.
Food is an experience that each of us encounters on a daily basis, in the sense of building society around food choices. The products of the food and wine supply chain are considered elements that are capable of offering the tourist a direct expression of a culture, and can be capable of generating tourist flow. From a marketing point of view, the product can be promoted and used as a means of tourist and gastronomic attraction [88,89,90].
Some limitations of the present study must also be recognised because there is an awareness that the analyses conducted are exploratory. They require further detailed discussion, seeking to observe the behavioural differences of consumers, also considering the educational and cultural levels that play an important role in conditioning people’s choices and behaviour.
Certainly, the results are to be taken with caution, both for the limited number of observations and for the new methodological approach introduced which uses the SNA, looking at the choices of consumers as groups of the network, which must be further verified with future research.
In light of the above considerations, we can state that the demand for knowledge about excellent food products is constantly growing. The choice to consume local products reflects the need of the modern consumer to satisfy their requirements regarding the search for quality (in its various meanings), subjective well-being and respect for socioenvironmental balance. Local products, therefore, take on a communicative–economic value able to convey the identity and essence of a territory, the community that lives there, as well as its customs, habits and traditions.
Author Contributions
Conceptualization, A.N. and W.S.; Methodology, A.N. and V.R.L.; Formal Analysis, A.N., W.S. and V.R.L.; Investigation V.R.L. and W.S.; Data curation, V.R.L. and A.N; Writing—Original Draft Preparation, A.N., V.R.L, D.L, C.M, W.S, Funding acquisition, D.L. and C.M., W.S.; Writing—Review & Editing, all the authors.
Acknowledgments
This study has been supported by GASTROCERT, a Project on Gastronomy and Creative Entrepreneurship in Rural Tourism, funded by JPI Cultural Heritage and Global Change - Heritage Plus, ERA-NET Plus and by Erasmus Placement program with "Mediterranea” University of Reggio Calabria (Italy) and Mid Sweden University of Östersund (Sweden) which, have supported the realization of this study. The authors are grateful to the anonymous reviewers for suggestions given to improve this work.
Conflicts of Interest
The authors declare no conflicts of interest.
References
- European Commission. Improving Market Outcomes Enhancing, the Position of Farmers in the Supply Chain; Report of the Agricultural Markets Task Force; European Commission: Brussels, Belgium, 2016 November. [Google Scholar]
- European Commission. The Common Agricultural Policy: Separating Fact from Fiction; European Commission, Directorate General for Agriculture and Rural Development: Brussels, Belgium, 2019. [Google Scholar]
- IPES FOOD. Towards a Common Food Policy for the EU. Breaking Away from Industrial Food and Farming System. Report. 2019. Available online: http://www.ipes-food.org/reports/ (accessed on 22 March 2019).
- IPES FOOD. Towards a Common Food Policy for the European Union. The Policy Reform and Realignment that is Required to Build Sustainable Food Systems in Europe. Report. 2018. Available online: http://www.ipes-food.org/reports/ (accessed on 22 March 2019).
- Gliessman, S. Transforming our food systems. Agroecol. Sustain. Food Syst. 2018, 42, 475–476. [Google Scholar] [CrossRef]
- Vandermeer, J.; Aga, A.; Allgeier, J.; Badgley, C.; Baucom, R.; Blesh, J.; Shapiro, L.F.; Jones, A.D.; Hoey, L.; Jain, M.; et al. Feeding Prometheus: An Interdisciplinary Approach for Solving the Global Food Crisis. Front. Sustain. Food Syst. 2018, 2, 39. [Google Scholar] [CrossRef]
- Madau, F.A.; Furesi, R.; Pulina, P. The existence of buyer power in the Italian fresh milk supply chain. Br. Food J. 2016, 118, 70–82. [Google Scholar] [CrossRef]
- Rinaldi, C. Food and Gastronomy for Sustainable Place Development: A Multidisciplinary Analysis of Different Theoretical Approaches. Sustainability 2017, 9, 1748. [Google Scholar] [CrossRef]
- Sexton, R.J.; Xia, T. Increasing Concentration in the Agricultural Supply Chain: Implications for Market Power and Sector Performance. Annu. Rev. Resour. Econ. 2018, 10, 229–251. [Google Scholar] [CrossRef]
- Goodman, D. The quality ‘turn’ and alternative food practices. Reflections and agenda. J. Rural Stud. 2003, 19, 1–7. [Google Scholar] [CrossRef]
- Aragrande, M.; Canali, M. Animal health and price transmission along livestock supply chains. Rev. Sci. Tech. Off. Int. Epiz. 2017, 36, 87–96. [Google Scholar] [CrossRef]
- Ghosh, R.; Eriksson, M. Food waste due to retail power in supply chains: Evidence from Sweden. Glob. Food Secur. 2018, 20, 1–8. [Google Scholar] [CrossRef]
- Cavicchi, A.; Ciampi Stancova, K. Food and Gastronomy as Elements of Regional Innovation Strategies; European Commission, Joint Research Centre, Institute for Prospective Technological Studies: Seville, Spain, 2016; EUR 27757 EN. [Google Scholar] [CrossRef]
- Tälle, M.; Wiréhn, L.; Ellström, D.; Hjerpe, M.; Huge-Brodin, M.; Jensen, P.; Lindström, T.; Neset, T.-S.; Wennergren, U.; Metson, G. Synergies and Trade-Offs for Sustainable Food Production in Sweden: An Integrated Approach. Sustainability 2019, 11, 601. [Google Scholar] [CrossRef]
- Zamagni, S. Public happiness in today’s economics. Int. Rev. Econ. 2014, 61, 191–196. [Google Scholar] [CrossRef]
- Migliore, G.; Schifani, G.; Guccione, G.D.; Cembalo, L. Food Community Networks as Leverage for Social Embeddedness. J. Agric. Environ. Ethics 2014, 27, 549–567. [Google Scholar] [CrossRef]
- Pascucci, S. Governance Structure, Perception and Innovation in Credence Food Transactions: The Role of Food Community Networks. Int. J. Food Syst. Dyn. 2010, 1, 224–236. [Google Scholar] [CrossRef]
- Annunziata, A.; Agovino, M.; Mariani, A. Sustainability of Italian families’ food practices: Mediterranean diet adherence combined with organic and local food consumption. J. Clean. Prod. 2019, 206, 86–96. [Google Scholar] [CrossRef]
- Pascucci, S.; Lombardi, A.; Cembalo, L.; Dentoni, D. Governance mechanisms in food community networks. Ital. J. Food Sci. 2013, 25, 98–104. [Google Scholar]
- Hankins, J.; Grasseni, C. Collective food purchasing networks in Italy as a case study of responsible innovation. Glocalism J. Cult. Politics Innov. Issue 2014, 2. [Google Scholar]
- Tregear, A. Progressing knowledge in alternative and local food networks: Critical reflections and a research agenda. J. Rural Stud. 2011, 27, 419–430. [Google Scholar] [CrossRef]
- Nicolosi, A.; Pulina PLaganà, V.R. A methodology for mapping consumer preferences for local products: The case of the Capicollo Azze Anca Grecanico Slow Food-Calabria. Riv. Econ. Agrar. 2016, 2, 127–151. [Google Scholar] [CrossRef]
- Sajdakowska, M.; Gębski, J.; Żakowska-Biemans, S.; Jeżewska-Zychowicz, M. Willingness to eat bread with health benefits: Habits, taste and health in bread choice. Public Health 2019, 167, 78–87. [Google Scholar] [CrossRef]
- Droli, M.; Bassi, I.; Iseppi, L. Improving eu environmental policy in the afolu complex through the application of rasch and weber models. Qual. Access Success 2019, 20, 240–248. [Google Scholar]
- Apaolaza, V.; Hartmann, P.; D’Souza, C.; López, C.M. Eat organic—Feel good? The relationship between organic food consumption, health concern and subjective wellbeing. Food Qual. Prefer. 2018, 63, 51–62. [Google Scholar] [CrossRef]
- Brunori, G.; Galli, F.; Barjolle, D.; van Broekhuizen, R.; Colombo, L.; Giampietro, M.; Kirwan, J.; Lang, T.; Mathijs, E.; Maye, D.; et al. Are local food chains more sustainable than global food chains? Considerations for Assessment, Sustainability 2016, 8, 1–27. [Google Scholar] [CrossRef]
- Marcoz, E.M.; Melewar, T.C.; Dennis, C. The Value of Region of Origin, Producer and Protected Designation of Origin Label for Visitors and Locals: The Case of Fontina Cheese in Italy. Int. J. Tour. Res. 2016, 18, 236–250. [Google Scholar] [CrossRef]
- Smith, J.; Lang, T.; Vorley, B.; Barling, D. Addressing Policy Challenges for More Sustainable Local–Global Food Chains: Policy Frameworks and Possible Food “Futures”. Sustainability 2016, 8, 299. [Google Scholar] [CrossRef]
- Schmitt, E.; Keech, D.; Maye, D.; Barjolle, D.; Kirwan, J. Comparing the Sustainability of Local and Global Food Chains: A Case Study of Cheese Products in Switzerland and the UK. Sustainability 2016, 8, 419. [Google Scholar] [CrossRef]
- Grunert, K.G. Food quality and safety: Consumer perception and demand. Eur. Rev. Agric. Econ. 2005, 32, 369–391. [Google Scholar] [CrossRef]
- Coppola, A.; Verneau, F. An empirical analysis on technophobia/technophilia in consumer market segmentation. Agric. Food Econ. 2014, 2, 2. Available online: http://www.agrifoodecon.com/content/2/1/2 (accessed on 24 May 2018 ). [CrossRef]
- Cicia, G.; Cembalo, L.; Del Giudice, T.; Verneau, F. Agrifood system and the postmodern consumer: New challenges for research and for markets. Econ. Agro Aliment. 2012, 14, 117–142. [Google Scholar]
- Fernández-Ferrín, P.; Calvo-Turrientes, A.; Bande, B.; Artaraz-Miñón, M.; Galán-Ladero, M. The valuation and purchase of food products that combine local, regional and traditional features: The influence of consumer ethnocentrism. Food Qual. Prefer. 2018, 64, 138–147. [Google Scholar] [CrossRef]
- Oostindie, H.; van Broekhuizen, R.; de Roest, K.; Belletti, G.; Arfini, F.; Menozzi, D.; Hees, E. Sense and Non-Sense of Local–Global Food Chain Comparison, Empirical Evidence from Dutch and Italian Pork Case Studies. Sustainability 2016, 8, 319. [Google Scholar] [CrossRef]
- Guerrero, L.; Guardia, M.; Xicola, J.; Verbeke, W.; Vanhonacker, F.; Akowska-Biemans, S. Consumer-driven definition of traditional food products and innovation in traditional foods. A qualitative cross-cultural study. Appetite 2009, 52, 345–354. [Google Scholar] [CrossRef]
- Bryła, P. The development of organic food market as an element of sustainable development concept implementation. Probl. Ekorozw. 2015, 10, 79–88. [Google Scholar]
- Wasserman, S.; Faust, K. Social Network Analysis Methods and Applications (Vol.8) Part of Structural Analysis in the Social Sciences; Cambridge University Press: Cambridge, UK, 1994. [Google Scholar]
- Scott, J. Social Network Analysis, 4th ed.; Sage: Saunders Oaks, CA, USA, 2017. [Google Scholar]
- Privitera, D.; Nicolosi, A. Comunità, Luoghi e Condivisione. Esplorazione di Modelli Alternative di Consumo; FrancoAngeli: Milano, Italy, 2017. [Google Scholar]
- Aguglia, L.; De Santis, F.; Salvioni, C. Direct Selling: A Marketing Strategy to Shorten Distances between Production and Consumption. Paper prepared at the 113th EAAE Seminar A resilient European food industry and food chain in a challenging world, Chania, Crete, Greece, 3–6 September 2009; Available online: http://ageconsearch.umn.edu/bitstream/57657/2/Aguglia.pdf (accessed on 11 January 2016).
- Pedroza-Gutiërrez, C.; Hernändez, J.M. Social networks, market transactions, and reputation as a central resource. The Mercado del Mar, a fish market in central Mexico. PLoS ONE 2017, 12, e0186063. [Google Scholar] [CrossRef]
- Kvam, G.; Bjørkhaug, H.; Pedersen, A.C. How relationships can influence an organic firm’s network identity. Eur. Plan. Stud. 2017, 25, 11471165. [Google Scholar] [CrossRef]
- Rytkönen, P. Bringing the Consumer Back in—The Motives, Perceptions, and Values behind Consumers and Rural Tourists’ Decision to Buy Local and Localized Artisan Food—A Swedish Example. Agriculture 2018, 8, 58. [Google Scholar] [CrossRef]
- Ding, H.; Cao, L.; Ren, Y.; Choo, K.-K.R.; Shi, B. Reputation-Based Investment Helps to Optimize Group Behaviors in Spatial Lattice Networks. PLoS ONE 2016, 11, e0162781. [Google Scholar] [CrossRef]
- Tang, J.-W.; Chen, M.-L.; Chiu, T.-H. An Exploratory Study on Local Brand Value Development for Outlying Island Agriculture: Local Food System and Actor–Network Theory Perspectives. Sustainability 2018, 10, 4186. [Google Scholar] [CrossRef] [Green Version]
- Palladino, M.; Cafiero, C.; Marcianò, C. The Role of Social Relations in Promoting Effective Policies to Support Diversification Within a Fishing Community in Southern Italy. In New Metropolitan Perspectives. ISHT 2019. Smart Innovation, Systems and Technologies; Calabrò, F., Della Spina, L., Bevilacqua, C., Eds.; Springer: Cham, Switzerland, 2019; Volume 101. [Google Scholar]
- Kim, Y.; Choi, T.Y.; Yan, T.; Dooley, K. Structural investigation of supply networks: A social network analysis approach. J. Oper. Manag. 2011, 29, 194–211. [Google Scholar] [CrossRef]
- Skoglund, W.; Laven, D. Utilizing Culture and Creativity for Sustainable Development: Reflections on the City of Östersund’s Membership in the UNESCO Creative Cities Network. In New Metropolitan Perspectives. ISHT 2019. Smart Innovation, Systems and Technologies; Calabrò, F., Della Spina, L., Bevilacqua, C., Eds.; Springer: Cham, Switzerland, 2019; Volume 101. [Google Scholar]
- Sjölander-Lindqvist, A.; Cinque, S. Locality management through cultural diversity: The case of the La Majella National Park. Food Cult. Soc. 2014, 17, 143–160. [Google Scholar] [CrossRef]
- Sjölander-Lindqvist, A.; Skoglund, W.; Laven, D. Regional Foodscape and Gastronomy Development. The way forward to rural development in the Swedish periphery? In Proceedings of the VEC Conference, Östersund, Sweden, 11–14 September 2016; Available online: https://www.miun.se/contentassets/3e8e9d091ec14b9fad83ef28ce89dfba/vec2016-proceedings-webb.pdf (accessed on 22 January 2017).
- Fonte, M. A Way of Producing, a Way of Knowing. Sociol. Rural. 2008, 48. [Google Scholar] [CrossRef] [Green Version]
- SCB, Statistics Sweden. A Government Agency that Brings Official Statistics to the Public. 2019. Available online: www.scb.se (accessed on 21 August 2019).
- Italian Trade Agency. Available online: www.ice.it (accessed on 21 August 2019).
- Jordbruks Verket. Consumer. 2019. Available online: www.jordbruksverket.se (accessed on 21 August 2019).
- Rytkönen, P. Local resources, foreign influences, value creation, tradition and modernity. The case of a Local Agro-food System in Jämtland, Sweden. Cult. Hist. Digit. J. 2016, 5, e009. [Google Scholar] [CrossRef]
- Filipović, J. Market-Oriented Sustainability of Sjenica Sheep Cheese. Sustainability 2019, 11, 834. [Google Scholar] [CrossRef] [Green Version]
- Silvestri, C.; Aquilani, B.; Piccarozzi, M.; Ruggieri, A. Consumer Quality Perception in Traditional Food: Parmigiano Reggiano Cheese. J. Int. Food Agribus. Mark. 2019. [Google Scholar] [CrossRef]
- Ribeiro, A.P.L.; Carneiro, J.D.S.; De Melo Ramos, T.; Patterson, L.; Pinto, S.M. Determining how packaging and labeling of Requeijão cheese affects the purchase behavior of consumers of different age groups. Br. Food J. 2018, 120, 1183–1194. [Google Scholar] [CrossRef]
- Giraud, G.; Amblard, C.; Thiel, E.; Zaouche-Laniau, M.; Stojanović, Ž.; Pohar, J.; Butigan, R.; Cvetković, M.; Mugosa, B.; Kendrovski, V.; et al. A cross-cultural segmentation of western Balkan consumers: Focus on preferences toward traditional fresh cow cheese. J. Sci. Food Agric. 2013, 93, 3464–3472. [Google Scholar] [CrossRef] [PubMed]
- Adanacioglu, H.; Albayram, Z. A conjoint analysis of consumer preferences for traditional cheeses in Turkey: A case study on Tulum cheese. Korean J. Food Sci. Anim. Resour. 2012, 32, 458–466. [Google Scholar] [CrossRef] [Green Version]
- Paxson, H. Locating Value in Artisan Cheese: Reverse Engineering Terroir for New-World Landscapes. Am. Anthropol. 2010, 112, 444–457. [Google Scholar] [CrossRef]
- Schouteten, J.; De Steur, H.; De Pelsmaeker, S.; Lagast, S.; De Bourdeaudhuij, I.; Gellynck, X. Impact of Health Labels on Flavor Perception and Emotional Profiling: A Consumer Study on Cheese. Nutrients 2015, 7, 10251–10268. [Google Scholar] [CrossRef] [Green Version]
- Soares, E.K.B.; Esmerino, E.A.; Ferreira, M.V.S.; de Silva, A.A.P.; Freitas, M.Q.; Cruz, A.G. What are the cultural effects on consumers’ perceptions? A case study covering Coalho cheese in the Brazilian northeast and southeast area using word association. Food Res. Int. 2017, 102, 553–558. [Google Scholar] [CrossRef]
- Cordaz, D. Le Misure Dell’analisi di Rete e le Procedure per la Loro Elaborazione Mediante UCINET V; Appendice al volume Salvini A., L’analisi delle reti sociali, risorse e meccanismi, Eds.; Pisa University Press: Plus, Pisa, 2005. [Google Scholar]
- Idda, L.; Madau, F.; Pulina, P. The Motivational Profile of Organic Food Consumers: A Survey of Specialized Stores Customers in Italy. In Proceedings of the 12th Congress EAAE, Ghent, Belgium, 26–29 August 2008; Available online: http://ageconsearch.umn.edu/bitstream/43946/2/152.pdf (accessed on 30 January 2018).
- Greenacre, M.J. Theory and Applications of Correspondence Analysis; Academic Press: London, UK, 1984. [Google Scholar]
- Abdi, H.; Valentin, D. Multiple Correspondence Analysis. In Encyclopedia of Measurement and Statistics; Salkind, N., Ed.; SAGE: Thousand Oaks, CA, USA, 2007; pp. 137–155. [Google Scholar]
- Greenacre, M.J. Correspondence Analysis in Practice; Chapman and Hall: Boca Raton, FL, USA, 2007. [Google Scholar]
- Graca, J.; Oliveira, A.; Calheiros, M.M. Meat, beyond the plate. Data-driven hypotheses for understanding consumer willingness to adopt a more plant-based diet. Appetite 2015, 90, 80–90. [Google Scholar] [CrossRef]
- Greenacre, M.J. Correspondence Analysis in Practice, 3rd ed.; CRC Press Taylor & Francis Group Chapman and Hall: Boca Raton, FL, USA, 2017. [Google Scholar]
- Cox, D.N.; Evans, G. Construction and validation of a psychometric scale to measure consumer’s fears on novel food technologies: The food technology neophobia scale. Food Qual. Prefer. 2008, 19, 704–710. [Google Scholar] [CrossRef]
- Ruggeri, G.; Mazzocchi, C.; Corsi, S. Urban Gardeners’ Motivations in a Metropolitan City: The Case of Milan. Sustainability 2016, 8, 1099. [Google Scholar] [CrossRef] [Green Version]
- Nicolosi, A.; Laganà, V.R.; Cortese, L.; Privitera, D. Using the Network and MCA on Tourist Attractions. The Case of Aeolian Islands, Italy. Sustainability 2018, 10, 4169. [Google Scholar] [CrossRef] [Green Version]
- Nicolosi, A.; Fava, N.; Marcianò, C. Consumers’ Preferences for Local Fish Products in Catalonia, Calabria and Sicily. In New Metropolitan Perspectives. ISHT 2018. Smart Innovation, Systems and Technologie; Calabrò, F., Della Spina, L., Bevilacqua, C., Eds.; Springer: Cham, Switzerland, 2019; Volume 101. [Google Scholar]
- Costa, P.S.; Santos, N.C.; Cunha, P.; Cotter, J.; Sousa, N. The use of multiple correspondence analysis to explore associations between categories of qualitative variables in healthy ageing. J. Aging Res. 2013, 2013, 1–12. [Google Scholar] [CrossRef] [PubMed]
- Guinot, C.; Latreille, J.; Malvy, D.; Preziosi, P.; Galan, P.; Hercberg, S.; Tenenhaus, M. Use of multiple correspondence analysis and cluster analysis to study dietary behaviour: Food consumption questionnaire in the SU.VI.MAX. Eur. J. Epidemiol. 2001, 17, 505–516. [Google Scholar] [CrossRef] [PubMed]
- Hair, J.F.; Black, W.C.; Babin, J.B.; Anderson, R.E.; Tatham, R.L. Multivariate Data Analysis, 7th ed.; Prentice-Hall: New Jersey, NJ, USA, 2009. [Google Scholar]
- Wenzig, J.; Gruchmann, T. Consumer Preferences for Local Food: Testing an Extended Norm Taxonomy. Sustainability 2018, 10, 1313. [Google Scholar] [CrossRef] [Green Version]
- Akturk, D.; Gun, S.; Kumuk, T. Multiple Correspondence Analysis Technique Used in Analyzing the Categorical Data in Social Sciences. J. Appl. Sci. 2007, 7, 585–588. [Google Scholar]
- Tabassum, S.; Pereira, F.S.F.; Fernandes, S.; Gama, J. Social network analysis: An overview. Wiley Interdiscip. Rev. Data Min. Knowl. Discov. 2018, 8, e1256. [Google Scholar] [CrossRef]
- D’Enza, A.I.; Greenacre, M. Multiple Correspondence Analysis for the Quantification and Visualization of Large Categorical Data Sets. In Advanced Statistical Methods for the Analysis of Large Data-Sets; Di Ciaccio, A., Coli, M., Angulo Ibanez, J., Eds.; Studies in Theoretical and Applied Statistics Series; Springer: Berlin, Germany, 2012; pp. 81–97. [Google Scholar]
- Trivette, S.A. The importance of food retailers: Applying network analysis techniques to the study of local food systems. Agric. Hum. 2019, 36, 77. [Google Scholar] [CrossRef]
- Crivits, M.; Prové, C.; Block, T.; Dessein, J. Four Perspectives of Sustainability Applied to the Local Food Strategy of Ghent (Belgium): Need for a Cycle of Democratic Participation? Sustainability 2016, 8, 55. [Google Scholar] [CrossRef] [Green Version]
- Lanfranchi, M.; Giannetto, C. A case study on the role of farmers’ markets in the process of shortening the food chain and the possible economic benefits for consumers. Qual. Access Success 2015, 16, 94–98. [Google Scholar]
- D’Amico, M.; Di Vita, G.; Chinnici, G.; Pappalardo, G.; Pecorino, B. Short food supply chain and locally produced wines: Factors affecting consumer behaviour. Ital. J. Food Sci. 2014, 26, 329–334. [Google Scholar]
- Namin, A.; Dehdashtib, Y. A “hidden” side of consumer grocery shopping choice. J. Retail. Consum. Serv. 2019, 48, 16–27. [Google Scholar] [CrossRef]
- Alkon, A.H.; Guthman, J. The New Food Activism: Opposition, Cooperation, and Collective Action; University of California Press: Berkeley, CA, USA, 2017; pp. 1–336. [Google Scholar]
- Castro, I.A.; Majmundar, A.; Williams, C.B.; Baquero, B. Customer Purchase Intentions and Choice in Food Retail Environments: A Scoping Review. Int. J. Environ. Res. Public Health 2018, 15, 2493. [Google Scholar] [CrossRef] [Green Version]
- Laganà, V.R.; Skoglund, W.; Marcianò, C.; Nicolosi, A. Gastronomic culture and landscape imaginary: The consumer’s opinion in regions of north and south Europe. In Proceedings of the 21st IPSAPA/ISPALEM International Scientific Conference. Book Series: Mosaico Paesistico-Culturale; IPSAPA / ISPALEM: Udine, Italy, 2018; Volume 4, pp. 481–495, Accession Number: WOS:000471850600039. [Google Scholar]
- Solomon, M.; Bamossy, G.; Askegaard, S. Consumer Behaviour: A European Perspective, Pearson Education Third edition published 2006; Limited Edinburgh Gate Harlow Essex CM20 2JE England; Pearson: Loundon, UK, 2006; ISBN 978-0273-68752-2. [Google Scholar]
Figure 1.
Location of the county of Jämtland in Sweden.

Figure 2.
Annual production and consumption volume of cheese in Sweden from 2007 to 2017 (in 1000s of tonnes).
Figure 2.
Annual production and consumption volume of cheese in Sweden from 2007 to 2017 (in 1000s of tonnes).

Figure 3.
Social network analysis (SNA) affiliation network: attractiveness of sales points to purchase industrial cheese, local cheese and Källarlagrad getost in Östersund. Source: The authors.
Figure 3.
Social network analysis (SNA) affiliation network: attractiveness of sales points to purchase industrial cheese, local cheese and Källarlagrad getost in Östersund. Source: The authors.

Figure 4.
Graph related to the network of preferences of the consumers interviewed (2017).
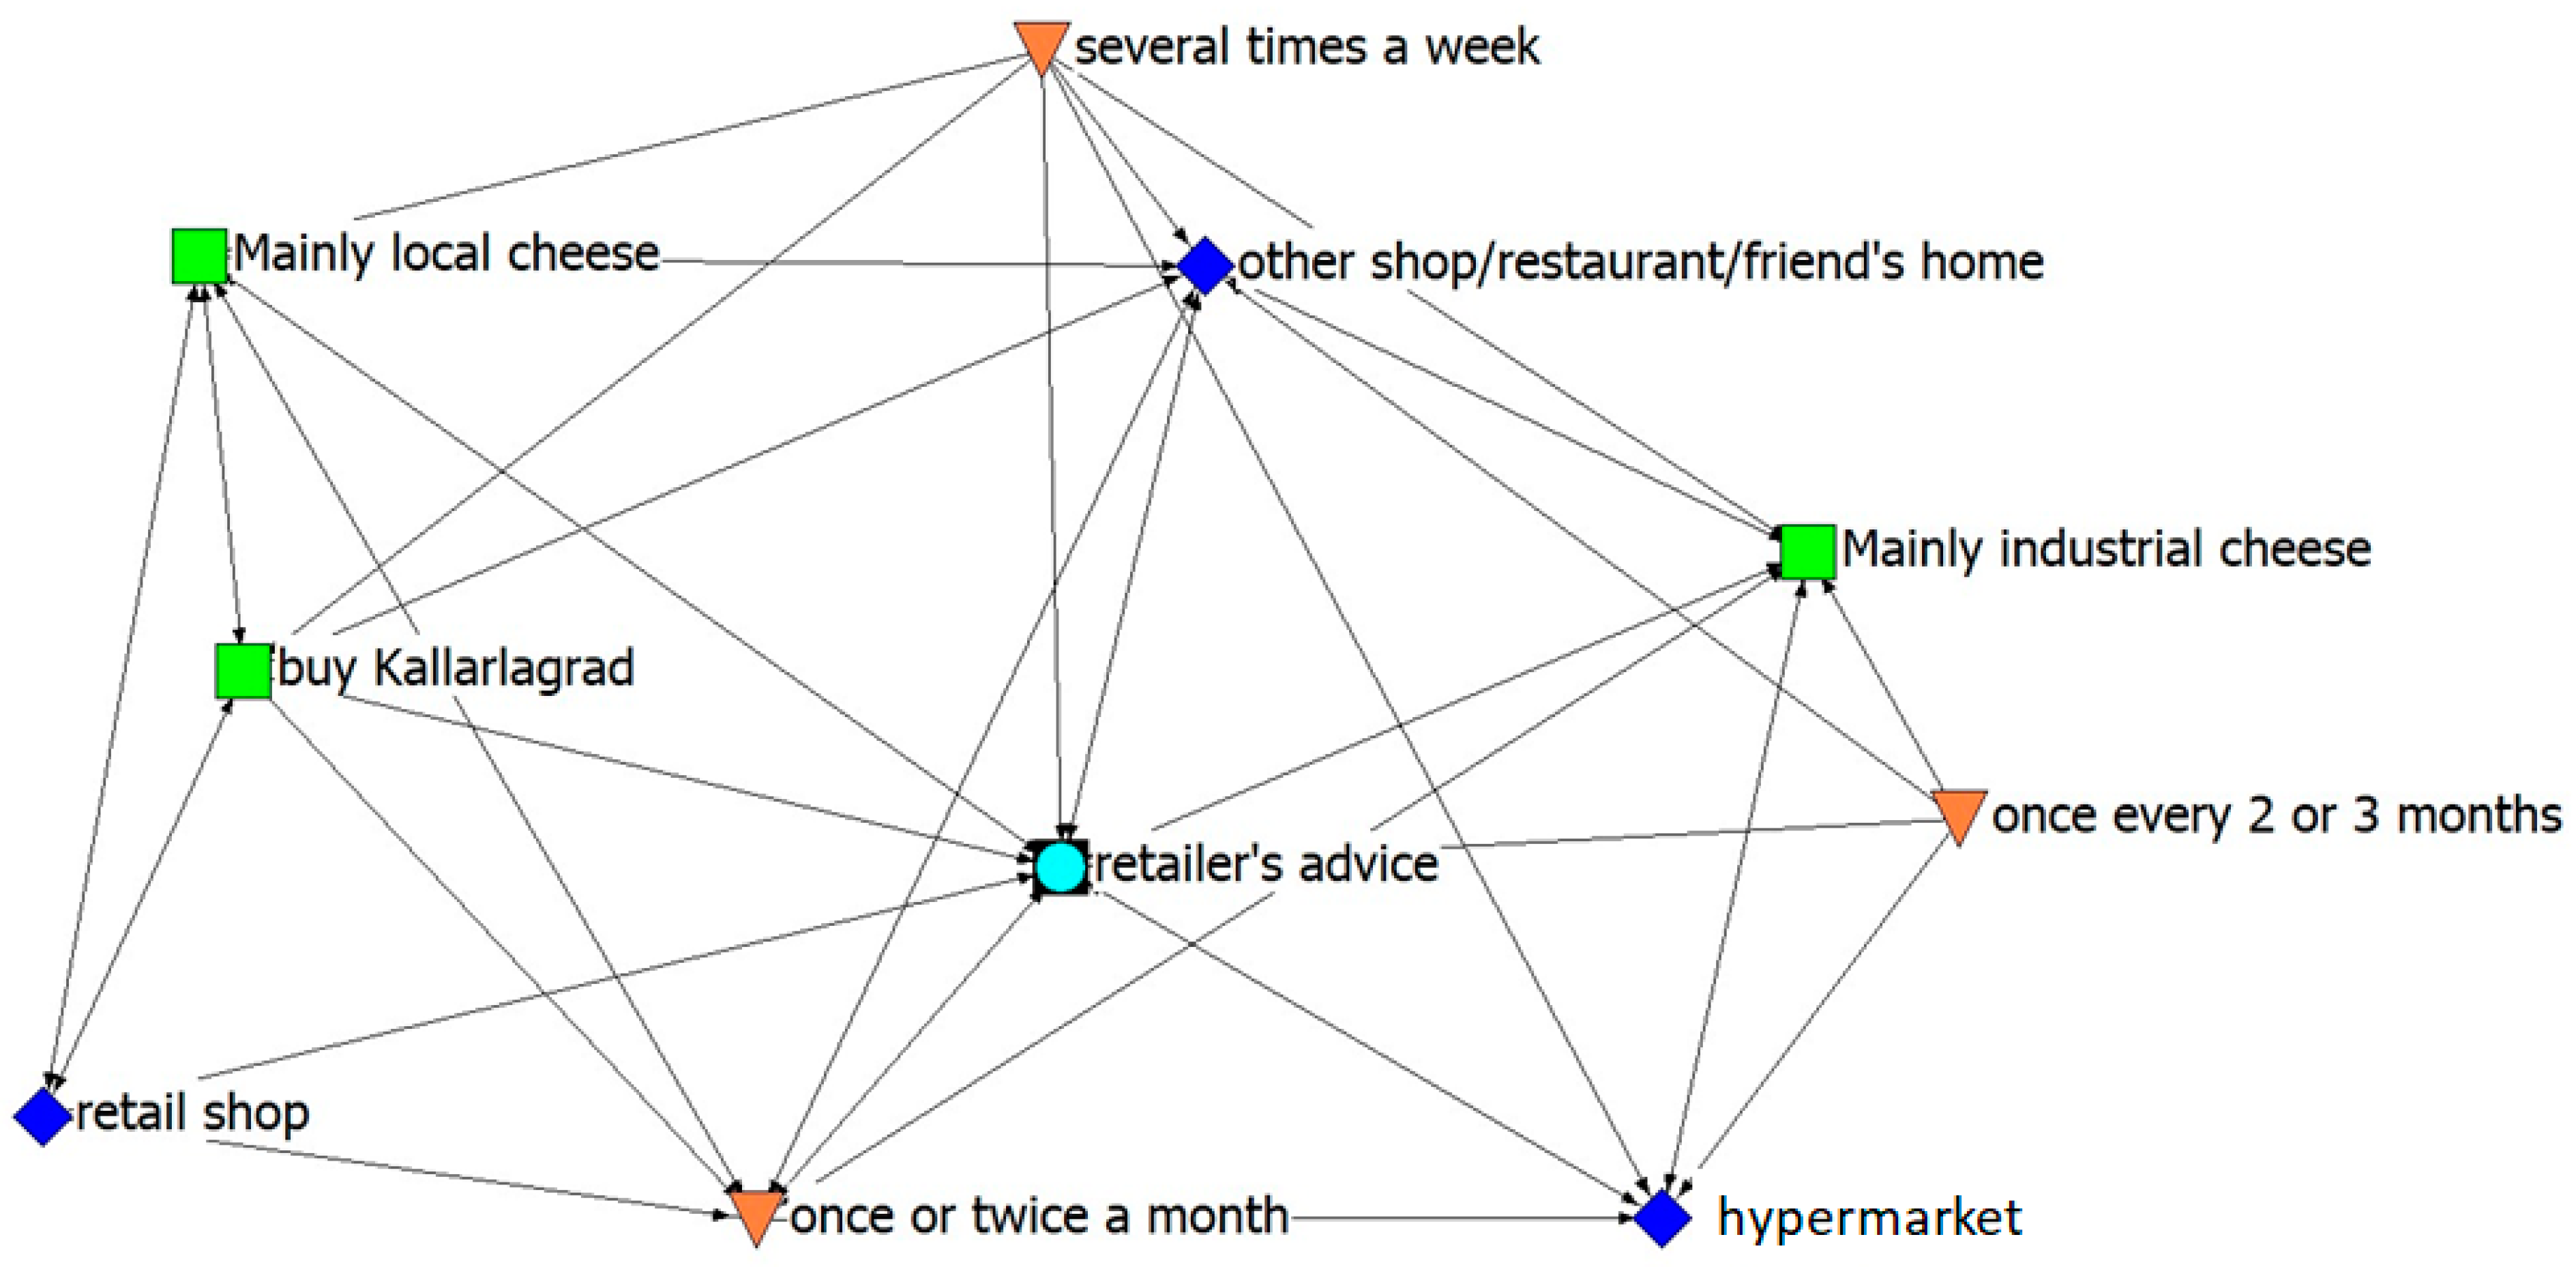
Figure 5.
Tree diagram of the hierarchical structure of the clusters. Source: The authors.

Figure 6.
Discrimination measures. Source: The authors.

Figure 7.
MCA: reasons to consume Källarlagrad getost in Östersund. Source: The authors.


Table 1.
Research hypothesis: constructs, measures and choices for purchasing cheese by consumers in the city of Östersund.
Table 1.
Research hypothesis: constructs, measures and choices for purchasing cheese by consumers in the city of Östersund.
| Conditions | Measures | Variable Name |
|---|---|---|
| Perceived quality | Food safety | Safety |
| Taste | Taste | |
| Craftmanship | Crafts | |
| Careful with source and brand | Brand | |
| Support economy | Cheese of my area | My area |
| Support local economy | Sle | |
| Ethical trade and social responsibility | Ethical | |
| Helping farmers | Helping F | |
| Attributes linked to the purchase of local/artisan cheeses | Versatility | Vers |
| Packaging | Pkg | |
| Wide range of choice | Wide range | |
| Price | Price | |
| Possibility of online purchase | Online | |
| Advertising | Advertising | |
| When I buy cheese I prefer local artisan one when it is possible Källarlagrad getost | Buy mainly local cheeses | Buy mainly local cheeses |
| Buy mainly industrial cheeses | Buy mainly industrial cheeses | |
| Buy Källarlagrad getost | Buy Källarlagrad getost | |
| Preference for the place of purchase of local/artisan cheese | Retail shop | Retail shop |
| Hypermarket | Hypermarket | |
| City market | City market | |
| Other shop/Restaurant/Friend’s home | Other shop/Restaurant/Friend’s home | |
| Loyalty | The advice of the retailer | Retailer’s advice |
| Frequency of purchase of local/artisan cheese | Several times a week | Several times a week |
| Once or twice a month | Once or twice a month | |
| Once every two or three months | Once every 2 or 3 months |
Source: the authors.
Table 2.
Consumers who buy Källarlagrad getost Slow Food: the variables chosen for the MCA and the corresponding coded names for the modalities.
Table 2.
Consumers who buy Källarlagrad getost Slow Food: the variables chosen for the MCA and the corresponding coded names for the modalities.
| Please Indicate How these Conditions Affect Your Slow Food Cheese Shopping | Variable Name |
|---|---|
| Food safety, quality and health benefits | Safety |
| For its taste | Taste |
| Craftmanship | Crafts |
| Versatility | Vers |
| Support local economy | Sle |
| Cheese of my area | My area |
| Gender * | Male/Female |
| Age * | Age 1; Age 2; Age 3 |
| Level of education * | Edu 1; Edu 2 |
| Cluster * | Cluster 1; Cluster 2 |
Note. * Supplementary variables: Age 1= 18-30 years, Age 2= 31-50 years, Age 3= >50 years; Edu 1= Middle-high school, Edu 2 = University degree, Modalities: variable name + = ‘a lot’; variable name − = ‘Slightly’. Source: the authors.
Table 3.
Descriptive statistics of the sample.
| Indications | Östersund | ||
|---|---|---|---|
| n. | % | ||
| Gender | Male | 93 | 46.5 |
| Female | 107 | 53.5 | |
| Age | 18–30 | 96 | 48.0 |
| 31–50 | 57 | 28.5 | |
| >50 | 47 | 23.5 | |
| Education | Middle-high school | 102 | 51.0 |
| University degree | 98 | 49.0 | |
| Occupation | Employee | 59 | 25.0 |
| Self-employee | 32 | 16.0 | |
| Retired | 17 | 8.5 | |
| Student | 74 | 37.0 | |
| Unemployed, housewife and other | 18 | 9.0 | |
| Family income | High | 8 | 4.0 |
| Upper middle | 113 | 56.5 | |
| Lower middle | 62 | 31.0 | |
| Low | 17 | 8.5 | |
| Family members | 1 | 45 | 22.5 |
| 2 | 40 | 20.0 | |
| 3 | 26 | 13.0 | |
| 4 | 32 | 16.0 | |
| 5 | 44 | 22.0 | |
| >5 | 13 | 6.5 | |
Source: The authors.
Table 4.
Respondents purchase and/or consume preferences. Numbers of Actors by group of the network.
Table 4.
Respondents purchase and/or consume preferences. Numbers of Actors by group of the network.
| Indications | % | N° |
|---|---|---|
| Consumers purchase preferences interviewed | ||
| Buy artisan local cheese | 45.5 | 91 |
| Buy industrial cheese | 47.5 | 95 |
| Buy Källarlagrad | 29.0 | 58 |
| Never buy cheeses | 7.0 | 14 |
| Preferences about place of purchase/consume by interviewed consumers | ||
| Buy cheeses at the specialised shop/retail shop | 25.5 | 51 |
| Buy at the hypermarket | 40.5 | 81 |
| Other shop/restaurant/friend’s home | 48.0 | 96 |
| Retailer’s advice | 78.5 | 157 |
| Frequency of purchase/consume of local cheeses/Industrial cheeses | ||
| Several times a week | 20.5 | 41 |
| Once or twice a month | 49.0 | 98 |
| Once every 2 or 3 months | 16.5 | 33 |
Source: The authors.
Table 5.
Descriptive statistics and network cohesion measures. Density, geodetic distance and Freeman’s degree centrality measures.
Table 5.
Descriptive statistics and network cohesion measures. Density, geodetic distance and Freeman’s degree centrality measures.
| Network Cohesion Measures | |
|---|---|
| Densities, Std dev | |
| Density (matrix average) | 51.11% |
| Standard deviation | 0.4999 |
| Geodesic distance: for each pair of nodes, the algorithm finds the # of edges in the shortest path between them | |
| Average distance (among reachable pairs) | 1.531 |
| Distance-based cohesion (compactness) | 0.691 |
| Distance-weighted fragmentation (breadth) | 0.309 |
Source: The authors.
Table 6.
Descriptive statistics: degree, betweenness.
| Indications | Norm Indegree % | In betweenness |
|---|---|---|
| Mainly industrial cheese | 55.556 | 0.583 |
| Mainly artisan local cheese | 66.667 | 20.950 |
| Buy Källarlagrad | 33.333 | 0.950 |
| Retailer’s advice | 100.000 | 7.950 |
| Retail shop | 22.222 | 0.000 |
| Super/hyper market | 55.556 | 0.783 |
| Other shop/restaurant/friend’s home | 88.889 | 5.533 |
| Several times a week | 0.000 | 0.000 |
| Once or twice a month | 77.778 | 5.667 |
| Once every 2 or 3 months | 11.111 | 0.583 |
Source: The authors.
Table 7.
Factor analysis. Structure of components extracted.
| Components | Factor Score |
|---|---|
| Component 1 (15.2%) | Versatility (Different uses) 0.490 |
| Attractive packaging 0.764 | |
| Wide range of choice 0.822 | |
| Ethical trade and social responsibility 0.514 | |
| Helping farmers/ranchers 0.478 | |
| Component 2 (14.5%) | Careful with source and brand 0.767 |
| Craftmanship, Information about production techniques 0.640 | |
| Organic food 0.615 | |
| Traditional cheese of my area 0.564 | |
| Component 3 (12.6%) | Advertising 0.593 |
| The possibility of online purchase 0.679 | |
| The advice of the retailer 0.708 | |
| Component 4 (10.1%) | Food safety, quality and health benefits 0.602 |
| Organoleptic qualities 0.704 | |
| Price 0.520 |
Note: Extraction method:Principal components analysis, Rotation Method: Varimax with Kaiser Normalization. Rotated Component Matrix: Rotation converged in 8 interations. Source: The authors.
Table 8.
Model summary.
| Dimension | Cronbach’s Alpha | Variance Accounted for | ||
|---|---|---|---|---|
| Total (Eigenvalue) | Inertia | % of Variance | ||
| 1 | 0.652 | 2.189 | 0.365 | 36.489 |
| 2 | 0.313 | 1.234 | 0.206 | 20.572 |
| Total | 3.424 | 0.571 | ||
| Mean | 0.543 a | 1.712 | 0.285 | 28.530 |
a. Mean Cronbach’s alpha is based on the mean eigenvalue. Source: the authors.
Table 9.
Results from MCA for the first two dimensions: distribution of discrimination measures of the investigated variables.
Table 9.
Results from MCA for the first two dimensions: distribution of discrimination measures of the investigated variables.
| Category | Discrimination Measure | |
|---|---|---|
| Dimension 1 | Dimension 2 | |
| Safety | 0.093 | 0.590 |
| Craftsmanship | 0.505 | 0.040 |
| Taste | 0.349 | 0.206 |
| Support local economy | 0.577 | 0.047 |
| Cheese of my area | 0.659 | 0.084 |
| Versatility | 0.005 | 0.268 |
| Active total | 2.189 | 1.234 |
| % of variance | 36.489 | 20.572 |
Source: The authors.
Table 10.
Results from MCA for the centroid coordinates of the categories.
| Category | Centroid Coordinates | ||
|---|---|---|---|
| Frequency | Dimension 1 | Dimension 2 | |
| Safety+ | 16 | 0.495 | 1.244 |
| Safety- | 42 | −0.188 | −0.474 |
| Crafts+ | 33 | 0.619 | −0.173 |
| Crafts- | 25 | −0.817 | 0.228 |
| Taste+ | 27 | −0.633 | −0.487 |
| Taste- | 31 | 0.551 | 0.424 |
| Sle+ | 34 | 0.638 | −0.181 |
| Sle- | 24 | −0.904 | 0.257 |
| My Area+ | 36 | 0.635 | −0.227 |
| My Area- | 22 | −1.039 | 0.372 |
| Vers+ | 10 | 0.162 | 1.134 |
| Vers- | 48 | −0.034 | −0.236 |
| Supplementary variable: | |||
| Gender a | |||
| Male | 31 | −0.130 | −0.027 |
| Female | 27 | 0.149 | 0.031 |
| Age a | |||
| Age1 | 20 | −0.621 | 0.187 |
| Age2 | 23 | 0.058 | 0.156 |
| Age3 | 15 | 0.739 | −0.489 |
| Level of education a | |||
| Edu1 | 25 | −0.124 | −0.201 |
| Edu2 | 33 | 0.094 | 0.152 |
| Cluster Number of Case a | |||
| Cluster 1 | 35 | −0.341 | −0.541 |
| Cluster 2 | 23 | 0.518 | 0.823 |
Note: a Supplementary variable. Modalities: variable name + = ‘a lot’; variable name − = ‘Slightly’. Source: The authors.
© 2019 by the authors. Licensee MDPI, Basel, Switzerland. This article is an open access article distributed under the terms and conditions of the Creative Commons Attribution (CC BY) license (http://creativecommons.org/licenses/by/4.0/).
Share and Cite
MDPI and ACS Style
Nicolosi, A.; Laganà, V.R.; Laven, D.; Marcianò, C.; Skoglund, W. Consumer Habits of Local Food: Perspectives from Northern Sweden. Sustainability 2019, 11, 6715. https://doi.org/10.3390/su11236715
AMA Style
Nicolosi A, Laganà VR, Laven D, Marcianò C, Skoglund W. Consumer Habits of Local Food: Perspectives from Northern Sweden. Sustainability. 2019; 11(23):6715. https://doi.org/10.3390/su11236715
Chicago/Turabian StyleNicolosi, Agata, Valentina Rosa Laganà, Daniel Laven, Claudio Marcianò, and Wilhelm Skoglund. 2019. "Consumer Habits of Local Food: Perspectives from Northern Sweden" Sustainability 11, no. 23: 6715. https://doi.org/10.3390/su11236715
Note that from the first issue of 2016, this journal uses article numbers instead of page numbers. See further details here.