Sensitivity of Radiative and Thermal Properties of Building Material in the Urban Atmosphere

 ,
,  , ,
, ,  , and
, and
Abstract
:1. Introduction
2. Methodology
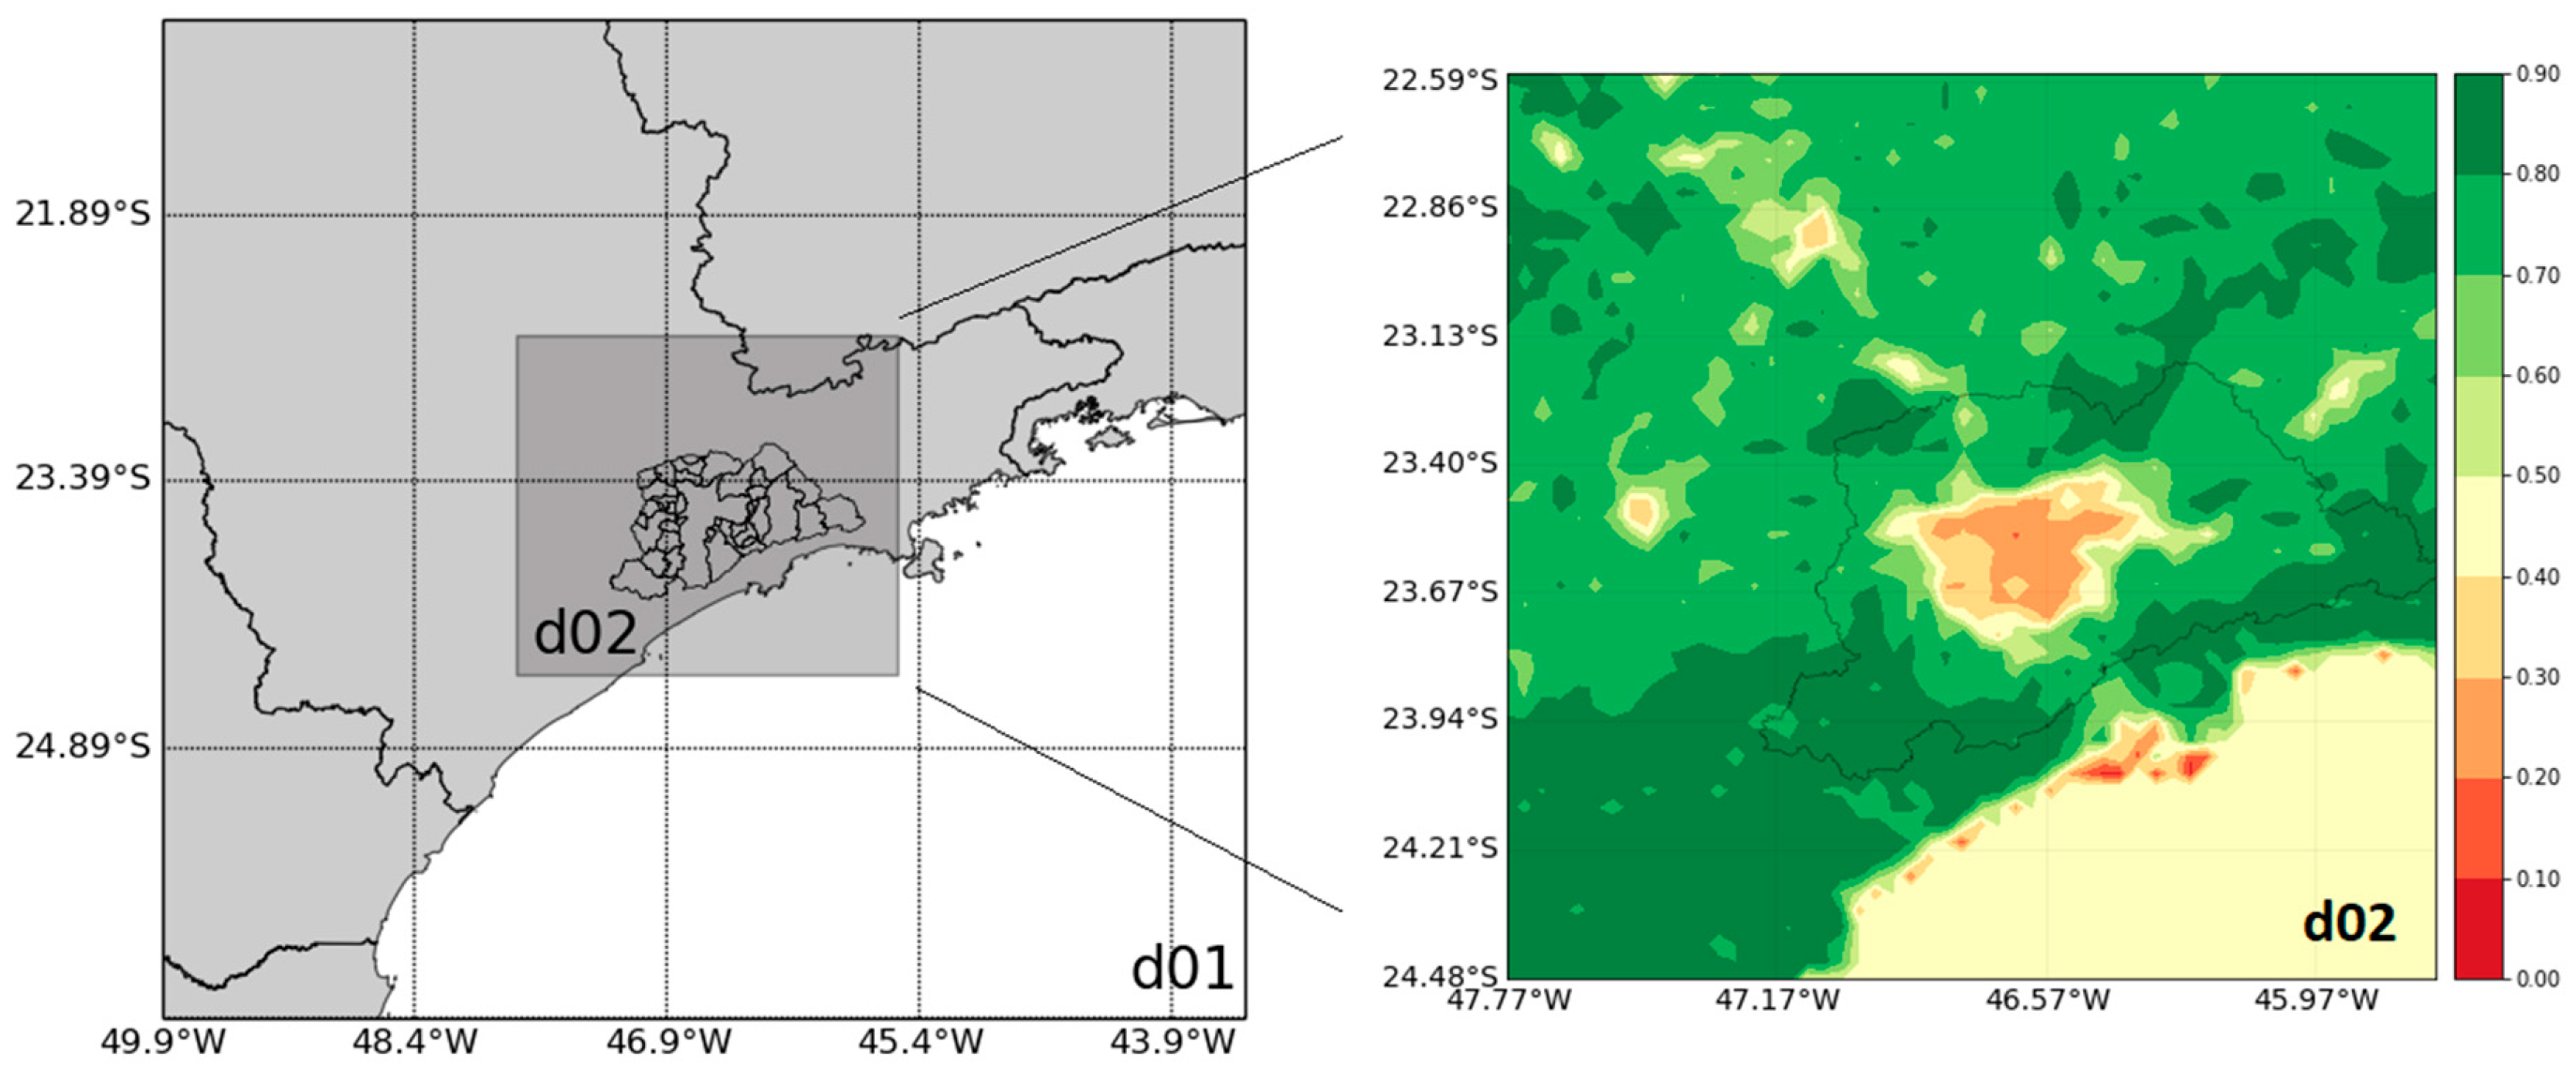
2.1. Study Area
2.2. Numerical Modeling Description
2.3. Simulations Descriptions
3. Results and Discussions
3.1. Surface Albedo
3.2. Surface Emissivity
3.3. Thermal Conductivity
3.4. Heat Capacity
4. Conclusions and Remarks
Author Contributions
Funding
Acknowledgments
Conflicts of Interest
References
- United Nations. World Urbanization Prospects: The 2018 Revision; United Nations: New York, NY, USA, 2019. [Google Scholar]
- Kalnay, E.; Cai, M. Impact of urbanization and land-use change on climate. Nature 2003, 423, 528–532. [Google Scholar] [CrossRef]
- Oke, T.R. Boundary Layer Climates, 2nd ed.; Routledge: London, UK, 1987; ISBN 9780203407219. [Google Scholar]
- Pielke, R.A.; Segal, M. Mesoscale Circulations Forced by Differential Terrain Heating. In Mesoscale Meteorology and Forecasting; Ray, P.S., Ed.; American Meteorological Society: Boston, MA, USA, 1986; pp. 516–548. [Google Scholar]
- Rizwan, A.M.; Dennis, L.Y.C.; Liu, C. A review on the generation, determination and mitigation of Urban Heat Island. J. Environ. Sci. 2008, 20, 120–128. [Google Scholar] [CrossRef]
- Oke, T.R. The energetic basis of the urban heat island. Q. J. R. Meteorol. Soc. 1982, 108, 1–24. [Google Scholar] [CrossRef]
- Chen, F.; Kusaka, H.; Bornstain, R.; Ching, J.; Grimmond, C.S.B.; Grossman-Clarke, S.; Loridan, T.; Manning, K.; Martilli, A.; Miao, S.; et al. The integrated WRF/urban modeling system: Development, evaluation, and applications to urban environmental problems. Int. J. Climatol. 2011, 31, 273–288. [Google Scholar] [CrossRef]
- García-Cueto, O.R.; Jáuregui-Ostos, E.; Toudert, D.; Tejeda-Martinez, A. Detection of the urban heat island in Mexicali, B.C., México and its relationship with land use. Atmósfera 2007, 20, 111–131. [Google Scholar]
- Ichinose, T.; Shimodozono, K.; Hanaki, K. Impact of anthropogenic heat on urban climate in Tokyo. Atmos. Environ. 1999, 33, 3897–3909. [Google Scholar] [CrossRef]
- Mirzaei, P.A.; Haghighat, F. Approaches to study Urban Heat Island—Abilities and limitations. Build. Environ. 2010, 45, 2192–2201. [Google Scholar] [CrossRef]
- Scalenghe, R.; Marsan, F.A. The anthropogenic sealing of soils in urban areas. Landsc. Urban Plan. 2009, 90, 1–10. [Google Scholar] [CrossRef]
- Peng, B.; Williams, S.; Loughnan, M.; Lloyd, G.; Hansen, A.; Kjellstrom, T.; Dear, K.; Saniotis, A. The Effects of Extreme Heat on Human Mortality and Morbidity in Australia: Implications for Public Health. Asia Pac. J. Public Health 2011, 23, 27S–36S. [Google Scholar] [CrossRef]
- Freitas, E.D.; Rozoff, C.M.; Cotton, W.R.; Dias, P.L.S. Interactions of an urban heat island and sea-breeze circulations during winter over the metropolitan area of São Paulo, Brazil. Bound. Layer Meteorol. 2007, 122, 43–65. [Google Scholar] [CrossRef]
- Pellegatti Franco, D.M.; Andrade, M.F.; Ynoue, R.Y.; Ching, J. Effect of Local Climate Zone (LCZ) classification on ozone chemical transport model simulations in Sao Paulo, Brazil. Urban Clim. 2019, 27, 293–313. [Google Scholar] [CrossRef]
- Yoshikado, H. Numerical Study of the Daytime Urban Effect and Its Interaction with the Sea Breeze. J. Appl. Meteorol. 1992, 31, 1146–1164. [Google Scholar]
- Yoshikado, H. Interaction of the Sea Breeze with Urban Heat Islands of Different Sizes and Locations. J. Meteorol. Soc. Jpn. Ser. II 1994, 72, 139–143. [Google Scholar] [CrossRef] [Green Version]
- Chen, T.; Sun, A.; Niu, R.; Chen, T.; Sun, A.; Niu, R. Effect of Land Cover Fractions on Changes in Surface Urban Heat Islands Using Landsat Time-Series Images. Int. J. Environ. Res. Public Health 2019, 16, 971. [Google Scholar] [CrossRef] [PubMed] [Green Version]
- Morais, M.V.B.; Marciotto, E.R.; Urbina Guerrero, V.V.; Freitas, E.D. Effective albedo estimates for the Metropolitan Area of São Paulo using empirical sky-view factors. Urban Clim. 2017, 21, 183–194. [Google Scholar] [CrossRef]
- Naserikia, M.; Asadi Shamsabadi, E.; Rafieian, M.; Leal Filho, W.; Naserikia, M.; Asadi Shamsabadi, E.; Rafieian, M.; Leal Filho, W. The Urban Heat Island in an Urban Context: A Case Study of Mashhad, Iran. Int. J. Environ. Res. Public Health 2019, 16, 313. [Google Scholar] [CrossRef] [PubMed] [Green Version]
- Peña, M.A. Relationships between remotely sensed surface parameters associated with the urban heat sink formation in Santiago, Chile. Int. J. Remote Sens. 2008, 29, 4385–4404. [Google Scholar] [CrossRef]
- Taha, H. Urban climates and heat islands: Albedo, evapotranspiration, and anthropogenic heat. Energy Build. 1997, 25, 99–103. [Google Scholar] [CrossRef] [Green Version]
- Atkinson, B.W. Numerical modelling of urban heat-island intensity. Bound. Layer Meteorol. 2003, 109, 285–310. [Google Scholar] [CrossRef]
- Montávez, J.P.; Rodríguez, A.; Jiménez, J.I. A study of the Urban Heat Island of Granada. Int. J. Climatol. 2000, 20, 899–911. [Google Scholar] [CrossRef]
- Bowler, D.E.; Buyung-Ali, L.; Knight, T.M.; Pullin, A.S. Urban greening to cool towns and cities: A systematic review of the empirical evidence. Landsc. Urban Plan. 2010, 97, 147–155. [Google Scholar] [CrossRef]
- Santamouris, M. Cooling the cities—A review of reflective and green roof mitigation technologies to fight heat island and improve comfort in urban environments. Sol. Energy 2014, 103, 682–703. [Google Scholar] [CrossRef]
- Morais, M.V.B.; Freitas, E.D.; Urbina Guerrero, V.V.; Martins, L.D. A modeling analysis of urban canopy parameterization representing the vegetation effects in the megacity of São Paulo. Urban Clim. 2016, 17, 102–115. [Google Scholar] [CrossRef]
- Qi, J.-D.; He, B.-J.; Wang, M.; Zhu, J.; Fu, W.-C. Do grey infrastructures always elevate urban temperature? No, utilizing grey infrastructures to mitigate urban heat island effects. Sustain. Cities Soc. 2019, 46, 101392. [Google Scholar] [CrossRef]
- Santamouris, M.; Synnefa, A.; Karlessi, T. Using advanced cool materials in the urban built environment to mitigate heat islands and improve thermal comfort conditions. Sol. Energy 2011, 85, 3085–3102. [Google Scholar] [CrossRef]
- Akbari, H.; Pomerantz, M.; Taha, H. Cool surfaces and shade trees to reduce energy use and improve air quality in urban areas. Sol. Energy 2001, 70, 295–310. [Google Scholar] [CrossRef]
- Moser, A.; Uhl, E.; Rötzer, T.; Biber, P.; Caldentey, J.; Pretzsch, H. Effects of climate trends and drought events on urban tree growth in Santiago de Chile. Cien. Invest. Agr. 2018, 45, 35–50. [Google Scholar] [CrossRef] [Green Version]
- Gupta, N.; Mathew, A.; Khandelwal, S. Analysis of cooling effect of water bodies on land surface temperature in nearby region: A case study of Ahmedabad and Chandigarh cities in India. Egypt J. Remote Sens. Space Sci. 2019, 22, 81–93. [Google Scholar] [CrossRef]
- Morris, C.J.G.; Simmonds, I. Associations between varying magnitudes of the urban heat island and the synoptic climatology in Melbourne, Australia. Int. J. Climatol. 2000, 20, 1931–1954. [Google Scholar] [CrossRef]
- Sang, J.; Liu, H.; Liu, H.; Zhang, Z. Observational and numerical studies of wintertime urban boundary layer. J. Wind Eng. Ind. Aerodyn. 2000, 87, 243–258. [Google Scholar] [CrossRef]
- Sharma, A.; Conry, P.; Fernando, H.J.S.; Hamlet, A.F.; Hellmann, J.J.; Chen, F. Green and cool roofs to mitigate urban heat island effects in the Chicago metropolitan area: Evaluation with a regional climate model. Environ. Res. Lett. 2016, 11, 064004. [Google Scholar] [CrossRef]
- Sharma, A.; Woodruff, S.; Budhathoki, M.; Hamlet, A.F.; Chen, F.; Fernando, H.J.S. Role of green roofs in reducing heat stress in vulnerable urban communities—A multidisciplinary approach. Environ. Res. Lett. 2018, 13, 094011. [Google Scholar] [CrossRef]
- Georgescu, M. Challenges Associated with Adaptation to Future Urban Expansion. J. Clim. 2015, 28, 2544–2563. [Google Scholar] [CrossRef]
- Song, J.; Wang, Z.-H.; Wang, C. The Regional Impact of Urban Heat Mitigation Strategies on Planetary Boundary Layer Dynamics Over a Semiarid City. J. Geophys. Res. Atmos. 2018, 123, 6410–6422. [Google Scholar] [CrossRef]
- Morais, M.V.B.; Guerrero, V.V.U.; Martins, L.D.; Martins, J.A.; Morais, M.V.B.; Guerrero, V.V.U.; Martins, L.D.; Martins, J.A. Dynamical Downscaling of Future Climate Change Scenarios in Urban Heat Island and Its Neighborhood in a Brazilian Subtropical Area. Proceedings 2017, 1, 106. [Google Scholar] [CrossRef] [Green Version]
- Patz, J.A.; Campbell-Lendrum, D.; Holloway, T.; Foley, J.A. Impact of regional climate change on human health. Nature 2005, 438, 310–317. [Google Scholar] [CrossRef]
- Lundgren Kownacki, K.; Gao, C.; Kuklane, K.; Wierzbicka, A.; Lundgren Kownacki, K.; Gao, C.; Kuklane, K.; Wierzbicka, A. Heat Stress in Indoor Environments of Scandinavian Urban Areas: A Literature Review. Int. J. Environ. Res. Public Health 2019, 16, 560. [Google Scholar] [CrossRef] [Green Version]
- Araujo, R.V.; Albertini, M.R.; Costa-da-Silva, A.L.; Suesdek, L.; Franceschi, N.C.S.; Bastos, N.M.; Katz, G.; Cardoso, V.A.; Castro, B.C.; Capurro, M.L.; et al. São Paulo urban heat islands have a higher incidence of dengue than other urban areas. Braz. J. Infect. Dis. 2015, 19, 146–155. [Google Scholar] [CrossRef] [Green Version]
- Mironova, V.; Shartova, N.; Beljaev, A.; Varentsov, M.; Grishchenko, M.; Mironova, V.; Shartova, N.; Beljaev, A.; Varentsov, M.; Grishchenko, M. Effects of Climate Change and Heterogeneity of Local Climates on the Development of Malaria Parasite (Plasmodium vivax) in Moscow Megacity Region. Int. J. Environ. Res. Public Health 2019, 16, 694. [Google Scholar] [CrossRef] [Green Version]
- Valdés, H.; Correa, C.; Mellado, F. Proposed model of sustainable construction skills for engineers in Chile. Sustainability 2018, 10, 3039. [Google Scholar] [CrossRef] [Green Version]
- Brown, M.A.; Southworth, F. Mitigating Climate Change through Green Buildings and Smart Growth. Environ. Plan. A 2008, 40, 653–675. [Google Scholar] [CrossRef] [Green Version]
- Letelier, V.; Ortega, J.; Tarela, E.; Muñoz, P.; Henríquez-Jara, B.; Moriconi, G. Mechanical Performance of Eco-Friendly Concretes with Volcanic Powder and Recycled Concrete Aggregates. Sustainability 2018, 10, 3036. [Google Scholar] [CrossRef] [Green Version]
- Muñoz, P.; Mendívil, M.A.; Letelier, V.; Morales, M.P. Thermal and mechanical properties of fired clay bricks made by using grapevine shoots as pore forming agent. Influence of particle size and percentage of replacement. Constr. Build. Mater. 2019, 224, 639–658. [Google Scholar] [CrossRef]
- Letelier, V.; Henríquez-Jara, B.I.; Manosalva, M.; Parodi, C.; Ortega, J.M. Use of Waste Glass as A Replacement for Raw Materials in Mortars with a Lower Environmental Impact. Energies 2019, 12, 1974. [Google Scholar] [CrossRef] [Green Version]
- Ortega, J.M.; Letelier, V.; Solas, C.; Moriconi, G.; Climent, M.Á.; Sánchez, I. Long-term effects of waste brick powder addition in the microstructure and service properties of mortars. Constr. Build. Mater. 2018, 182, 691–702. [Google Scholar] [CrossRef] [Green Version]
- Martilli, A.; Krayenhoff, E.S.; Nazarian, N. Is the Urban Heat Island intensity relevant for heat mitigation studies? Urban Clim. 2020, 31, 100541. [Google Scholar] [CrossRef]
- IBGE Censo Demográfico. Available online: https://www.ibge.gov.br/estatisticas/sociais/saude/9662-censo-demografico-2010.html?=&t=sobre (accessed on 12 September 2019).
- Duarte, D.H.S.; Shinzato, P.; Gusson, C.S.; Alves, C.A. The impact of vegetation on urban microclimate to counterbalance built density in a subtropical changing climate. Urban Clim. 2015, 14, 224–239. [Google Scholar] [CrossRef]
- de Lima, G.N.; Magaña Rueda, V.O. The urban growth of the metropolitan area of Sao Paulo and its impact on the climate. Weather Clim. Extrem. 2018, 21, 17–26. [Google Scholar] [CrossRef]
- Morais, M.V.B.; Freitas, E.D.; Marciotto, E.R.; Urbina Guerrero, V.V.; Martins, L.D.; Martins, J.A. Implementation of observed sky-view factor in a mesoscale model for sensitivity studies of the urban meteorology. Sustainability 2018, 10, 2183. [Google Scholar] [CrossRef] [Green Version]
- Johansson, E.; Spangenberg, J.; Gouvêa, M.L.; Freitas, E.D. Scale-integrated atmospheric simulations to assess thermal comfort in different urban tissues in the warm humid summer of São Paulo, Brazil. Urban Clim. 2013, 6, 24–43. [Google Scholar] [CrossRef]
- Stewart, I.D.; Oke, T.R.; Stewart, I.D.; Oke, T.R. Local Climate Zones for Urban Temperature Studies. Bull. Am. Meteorol. Soc. 2012, 93, 1879–1900. [Google Scholar] [CrossRef]
- Freitas, S.R.; Panetta, J.; Longo, K.M.; Rodrigues, L.F.; Moreira, D.S.; Rosário, N.E.; Silva Dias, P.L.; Silva Dias, M.A.F.; Souza, E.P.; Freitas, E.D.; et al. The Brazilian developments on the Regional Atmospheric Modeling System (BRAMS 5.2): An integrated environmental model tuned for tropical areas. Geosci. Model Dev. 2017, 10, 189–222. [Google Scholar] [CrossRef] [Green Version]
- Freitas, S.R.; Longo, K.M.; Silva Dias, M.A.F.; Chatfield, R.; Silva Dias, P.; Artaxo, P.; Andreae, M.O.; Grell, G.; Rodrigues, L.F.; Fazenda, A.; et al. The Coupled Aerosol and Tracer Transport model to the Brazilian developments on the Regional Atmospheric Modeling System (CATT-BRAMS)—Part 1: Model description and evaluation. Atmos. Chem. Phys. 2009, 9, 2843–2861. [Google Scholar] [CrossRef] [Green Version]
- Cotton, W.R.; Pielke, R.A., Sr.; Walko, R.L.; Liston, G.E.; Tremback, C.J.; Jiang, H.; McAnelly, R.L.; Harrington, J.Y.; Nicholls, M.E.; Carrio, G.G.; et al. RAMS 2001: Current status and future directions. Meteorol. Atmos. Phys. 2003, 82, 5–29. [Google Scholar] [CrossRef]
- Walko, R.L.; Band, L.E.; Baron, J.; Kittel, T.G.F.; Lammers, R.; Lee, T.J.; Ojima, D.; Pielke, R.A.; Taylor, C.; Tague, C.; et al. Coupled Atmosphere–Biophysics–Hydrology Models for Environmental Modeling. J. Appl. Meteorol. 2000, 39, 931–944. [Google Scholar] [CrossRef]
- Masson, V. A physically-based scheme for the urban energy budget in atmospheric models. Bound. Layer Meteorol. 2000, 94, 357–397. [Google Scholar] [CrossRef]
- Masson, V.; Grimmond, C.S.B.; Oke, T.R. Evaluation of the Town Energy Balance (TEB) Scheme with Direct Measurements from Dry Districts in Two Cities. Am. Meteorol. Soc. 2002, 41, 1011–1026. [Google Scholar]
- Freitas, E.D.; Martins, L.D.; Silva Dias, P.L.; Andrade, M.F. A simple photochemical module implemented in RAMS for tropospheric ozone concentration forecast in the metropolitan area of São Paulo, Brazil: Coupling and validation. Atmos. Environ. 2005, 39, 6352–6361. [Google Scholar] [CrossRef]
- McMullan, R. Environmental Science in Building; Macmillan Education: London, UK, 1998; ISBN 978-0-333-73201-4. [Google Scholar]
- Martilli, A.; Clappier, A.; Rotach, M.W. An Urban Surface Exchange Parameterisation for Mesoscale Models. Bound. Layer Meteorol. 2002, 104, 261–304. [Google Scholar] [CrossRef]
- Johnson, G.T.; Oke, T.R.; Lyons, T.J.; Steyn, D.G.; Watson, I.D.; Voogt, J.A. Simulation of surface urban heat islands under ‘IDEAL’ conditions at night part 1: Theory and tests against field data. Bound. Layer Meteorol. 1991, 56, 275–294. [Google Scholar] [CrossRef]
- NBR15220 Desempenho Térmico de Edificações Parte 1: Definições, Símbolos e Unidades 2003, 66. Available online: https://www.abntcatalogo.com.br/norma.aspx?ID=635 (accessed on 2 December 2019).
- Klemp, J.B.; Wilhelmson, R.B.; Klemp, J.B.; Wilhelmson, R.B. The Simulation of Three-Dimensional Convective Storm Dynamics. J. Atmos. Sci. 1978, 35, 1070–1096. [Google Scholar] [CrossRef] [Green Version]
- Chen, C.; Cotton, W.R. A one-dimensional simulation of the stratocumulus-capped mixed layer. Bound. Layer Meteorol. 1983, 25, 289–321. [Google Scholar] [CrossRef]
- Smagorinsky, J. General Circulation Experiments with the primitive equations. Mon. Weather Rev. 1963, 91, 99–164. [Google Scholar] [CrossRef]
- Hill, G.E. Factors Controlling the Size and Spacing of Cumulus Clouds as Revealed by Numerical Experiments. J. Atmos. Sci. 1974, 31, 646–673. [Google Scholar] [CrossRef] [Green Version]
- Lilly, D.K. On the numerical simulation of buoyant convection. Tellus 1962, 14, 148–172. [Google Scholar] [CrossRef]
- Daley, R. Atmospheric Data Analysis; Cambridge University Press: Cambridge, UK, 1991. [Google Scholar]
- Didan, K. MOD13Q1 MODIS/Terra Vegetation Indices 16-Day L3 Global 250m SIN Grid V006 [Data set]. Available online: https://doi.org/10.5067/MODIS/MOD13Q1.006 (accessed on 5 October 2019).
- Li, D.; Bou-Zeid, E.; Oppenheimer, M. The effectiveness of cool and green roofs as urban heat island mitigation strategies. Environ. Res. Lett. 2014, 9, 055002. [Google Scholar] [CrossRef]
- Oleson, K.W.; Bonan, G.B.; Feddema, J. Effects of white roofs on urban temperature in a global climate model. Geophys. Res. Lett. 2010, 37, L03701. [Google Scholar] [CrossRef] [Green Version]
- Family, R.; Mengüç, M. Analysis of Sustainable Materials for Radiative Cooling Potential of Building Surfaces. Sustainability 2018, 10, 3049. [Google Scholar] [CrossRef] [Green Version]
- Hoshyar, H.A.; Rahimipetroudi, I.; Ganji, D.D. Heat Transfer Performance on Longitudinal Porous Fins with Temperature-Dependent Heat Generation, Heat Transfer Coefficient and Surface Emissivity. Iran. J. Sci. Technol. Trans. Mech. Eng. 2019, 43, 383–391. [Google Scholar] [CrossRef]
- Ferreira, M.J.; de Oliveira, A.P.; Soares, J.; Codato, G.; Bárbaro, E.W.; Escobedo, J.F. Radiation balance at the surface in the city of São Paulo, Brazil: Diurnal and seasonal variations. Theor. Appl. Climatol. 2012, 107, 229–246. [Google Scholar] [CrossRef]
- Oke, T.R.; Johnson, G.T.; Steyn, D.G.; Watson, I.D. Simulation of surface urban heat islands under ‘ideal’ conditions at night part 2: Diagnosis of causation. Bound. Layer Meteorol. 1991, 56, 339–358. [Google Scholar] [CrossRef]
- Hamdi, R.; Schayes, G. Sensitivity study of the urban heat island intensity to urban characteristics. Int. J. Climatol. 2008, 28, 973–982. [Google Scholar] [CrossRef]
- Marciotto, E.R. Variability of energy fluxes in relation to the net-radiation of urban and suburban areas: A case study. Meteorol. Atmos. Phys. 2013, 121, 17–28. [Google Scholar] [CrossRef]
- Aida, M.; Gotoh, K. Urban Albedo as a Function of The Urban Structure—A two-dimensional numerical Simulation. Bound. Layer Meteorol. 1982, 23, 415–424. [Google Scholar] [CrossRef]
- Fortuniak, K. Numerical estimation of the effective albedo of an urban canyon. Theor. Appl. Climatol. 2007, 91, 245–258. [Google Scholar] [CrossRef]
- Qin, Y. A review on the development of cool pavements to mitigate urban heat island effect. Renew. Sustain. Energy Rev. 2015, 52, 445–459. [Google Scholar] [CrossRef]
- Aflaki, A.; Mirnezhad, M.; Ghaffarianhoseini, A.; Ghaffarianhoseini, A.; Omrany, H.; Wang, Z.-H.; Akbari, H. Urban heat island mitigation strategies: A state-of-the-art review on Kuala Lumpur, Singapore and Hong Kong. Cities 2017, 62, 131–145. [Google Scholar] [CrossRef] [Green Version]
- Yuan, J.; Emura, K.; Sakai, H.; Farnham, C.; Lu, S. Optical analysis of glass bead retro-reflective materials for urban heat island mitigation. Sol. Energy 2016, 132, 203–213. [Google Scholar] [CrossRef]
- Kakoniti, A.; Georgiou, G.; Marakkos, K.; Kumar, P.; Neophytou, M.K.-A. The role of materials selection in the urban heat island effect in dry mid-latitude climates. Environ. Fluid Mech. 2016, 16, 347–371. [Google Scholar] [CrossRef]
- Chung, M.H.; Park, J.C. Development of PCM cool roof system to control urban heat island considering temperate climatic conditions. Energy Build. 2016, 116, 341–348. [Google Scholar] [CrossRef]


| Physical | Options |
|---|---|
| Lateral boundary nudging points | 5 |
| Lateral boundary nudging time scale | 3600 s |
| Top boundary nudging time scale | 1800 s |
| Lateral Boundary Condition | Klemp [67] |
| Radiation parameterization | Chen & Cotton [68] |
| Radiation update timestep | 3600 s |
| Soil layers depth | −2.0, −1.5, −0.25 and −0.05 m |
| Soil saturation degree | 0.49, 0.44, 0.42, 0.35 |
| Turbulence scheme | Smagorinski [69] modified by Hill [70] and Lilly [71] |
| Parameters | Urban 1 | Urban 2 |
|---|---|---|
| Roof Albedo | 0.18 | 0.18 |
| Street Albedo | 0.08 | 0.08 |
| Wall Albedo | 0.14 | 0.14 |
| Roof Emissivity | 0.90 | 0.90 |
| Street Emissivity | 0.95 | 0.95 |
| Wall Emissivity | 0.90 | 0.90 |
| Aspect-Ratio | 10 | 0.6 |
| Building Heights (m) | 50 | 5 |
| Roughness Length (m) | 3 | 0.5 |
| Traffic Sensible Heat Flux (W∙m−2) | 90 | 10 |
| Traffic Latent Heat Flux (W∙m−2) | 10 | 5 |
| Industrial Sensible Heat Flux (W∙m−2) | 14 | 10 |
| Industrial Latent Heat Flux (W∙m−2) | 50 | 30 |
| Surface | Layer 1 | Layer 2 | Layer 3 |
|---|---|---|---|
| Wall | 0.8100 | 0.8100 | 0.8100 |
| Street | 0.0103 | 1.0103 | 1.0103 |
| Roof | 0.4100 | 0.0500 | 0.0300 |
| Surface | Layer 1 | Layer 2 | Layer 3 |
|---|---|---|---|
| Wall | 1.00 | 1.00 | 1.00 |
| Street | 1.24 | 1.28 | 1.28 |
| Roof | 2.11 | 0.28 | 0.29 |
| α = 0.9 | α = 0.08 | ε = 1 | λ (W∙m−1∙K−1)/10 | C (J∙m−3∙K−1) ∙ 10 | |
| Urban-Type 1 | 2.50 | −0.18 | 1.40 | 0.24 | 1.00 |
| Urban-Type 2 | 1.20 | −0.15 | 1.00 | 0.50 | 0.75 |
© 2019 by the authors. Licensee MDPI, Basel, Switzerland. This article is an open access article distributed under the terms and conditions of the Creative Commons Attribution (CC BY) license (http://creativecommons.org/licenses/by/4.0/).
Share and Cite
Morais, M.V.B.d.; Urbina Guerrero, V.V.; Freitas, E.D.d.; Marciotto, E.R.; Valdés, H.; Correa, C.; Agredano, R.; Vera-Puerto, I. Sensitivity of Radiative and Thermal Properties of Building Material in the Urban Atmosphere. Sustainability 2019, 11, 6865. https://doi.org/10.3390/su11236865
Morais MVBd, Urbina Guerrero VV, Freitas EDd, Marciotto ER, Valdés H, Correa C, Agredano R, Vera-Puerto I. Sensitivity of Radiative and Thermal Properties of Building Material in the Urban Atmosphere. Sustainability. 2019; 11(23):6865. https://doi.org/10.3390/su11236865
Chicago/Turabian StyleMorais, Marcos Vinicius Bueno de, Viviana Vanesa Urbina Guerrero, Edmilson Dias de Freitas, Edson R. Marciotto, Hugo Valdés, Christian Correa, Roberto Agredano, and Ismael Vera-Puerto. 2019. "Sensitivity of Radiative and Thermal Properties of Building Material in the Urban Atmosphere" Sustainability 11, no. 23: 6865. https://doi.org/10.3390/su11236865