Effects of Supercritical CO2 Treatment Temperature on Functional Groups and Pore Structure of Coals

1
State Key Laboratory of Coal Mine Disaster Dynamics and Control, Chongqing University, Chongqing 400044, China
2
College of Resources and Safety Engineering, Chongqing University, Chongqing 400030, China
3
National and Local Joint Engineering Research Center of Shale Gas Exploration and Development, Chongqing Institute of Geology and Mineral Resources, Chongqing 400042, China
*
Author to whom correspondence should be addressed.
Sustainability 2019, 11(24), 7180; https://doi.org/10.3390/su11247180
Submission received: 21 November 2019
/
Revised: 6 December 2019
/
Accepted: 11 December 2019
/
Published: 15 December 2019
(This article belongs to the Special Issue Geological Storage of CO2 and Climate Control)
Abstract
:The buried depth of a coal seam determines the temperature at which CO2 and coal interact. To better understand CO2 sequestration, the pore structure and organic functional groups of coal treated with different ScCO2 temperatures were studied. In this study, three different rank coals were treated with ScCO2 at different temperatures under 8 MPa for 96 h in a geochemical reactor. The changes in pore structure and chemical structure of coal after ScCO2 treatment were analyzed using mercury intrusion porosimetry, attenuated total reflection Fourier transform infra-red spectroscopy, fractal theory, and curve fitting. The results show that the enhancement effect of ScCO2 on pore structure of coal becomes less significant as the increase of buried depth. In most of the treated coal samples, the variation proportion of mesopores decreased and the variation proportion of macropores increased. In the relatively higher rank coals, the degree of condensation (DOC) of aromatic rings decreased after treatment with ScCO2. The DOC values showed a U-shape relationship with temperature, and the aromaticity showed a downward trend with increasing temperature. The chemical structural changes in the relatively lower rank coal sample were complex. These findings will provide an understanding of mechanisms relevant to CO2 sequestration with enhanced coalbed methane recovery under different geothermal gradients and for different ranks of coal.
1. Introduction
Carbon dioxide capture and sequestration (CCS) is technically and economically feasible, and it will be possible to reduce CO2 greenhouse gas emissions [1,2]. Geological storage as part of CCS is regarded as the most effective method to store CO2 [3,4,5]. A large number of abandoned underground coal mines and deep unmineable coal seams exist worldwide because of resource depletion, low production capacity, and technical limitations. These mines are potential hosts for CO2 storage and filling material consisting of a mixture of fine-fraction waste [6,7,8]. Compared to CH4, CO2 has higher adsorption capacity and can be stored stably in coal reservoirs [9]. In addition, replacing the CH4 is conducive to coalbed methane extraction and allows the energy resource in the coal seams to be utilized [10,11]. The potential release of significant quantities of CO2-enhanced coalbed methane (CO2-ECBM) has caused widespread concern [5,12,13]. It is estimated that at present, closed mines in China still contain about 42 × 109 tons of coal resources and nearly 500 × 109 cubic meters of unconventional gas [14]. Therefore, it is necessary to make full use of abandoned mine resources and deep unmineable coal seams to achieve CO2 sequestration [15].
Because most of the shallow coal seams in China have already been mined, the increased demand for coal caused by economic growth has led to the mining of deeper coal seams. When the target coal seam is deeper than 800 m, CO2 will become the supercritical state (31.06 °C, 7.38 MPa) [16]. The physical properties of CO2 such as density, viscosity, and diffusivity vary significantly, and there are complex physical and chemical interactions between supercritical carbon dioxide (ScCO2) and coal [17]. In terms of chemistry, as an organic solvent, ScCO2 extracts organic and inorganic matter from coal and this significantly affects the contacts between coal particles resulting in the opening of pores, and the macromolecular structure of the coal changes [18,19,20,21]. This affects the coal’s adsorptive capacity [22,23]. Fourier transform infra-red spectroscopy (FTIR) is a non-destructive method of detecting macromolecular structure of the coal, especially organic functional groups [24]. Zhang et al. [25,26] found that the functional group intensities of coal weakened significantly after ScCO2 treatment, indicating that ScCO2 extraction occurred. These studies qualitatively judge the weakening of the functional group intensities. Changes in the coal’s macromolecular structure were not considered, which can be deeply semi-quantitative analyzed through curve-fitting. Physically, the coal’s structure will be transformed and rearranged due to the changes in its pore structure, resulting in its mechanical properties altered [27]. In addition, the coal matrix will swell because of the CO2 adsorption, which will reduce the number and width of cracks and seepage channels in some coal reservoirs [28,29]. The effect of the above on the fracture width (W) is expressed as follows [25]:
where W1 is external stress, W2 is CO2 injection pressure, W3 is adsorption expansion effect, and W4 is ScCO2 extraction effect. The coal’s pore structure will change significantly, and this affects the CO2 storage capacity in the seam.
The coal’s burial depth determines the final temperature of the injected CO2. Some researchers have shown that both coal reservoir permeability and gas adsorption/desorption are significantly affected by temperature [30,31,32,33,34]. Several studies reveals that higher reservoir temperatures result in bond breaks between gas molecules and coal’s surface [35,36,37,38]. Finally, after gas is released from the coal, the gas adsorption capacity in the coal is reduced. Coal matrix swells due to CO2 adsorption, and gas diffusion and seepage channels are reduced [29]. Therefore, temperature influences the pore structure and the macromolecular structure of coal significantly, which needs to be discussed in detail.
Previous research has focused on changes in the pore structure of coal with different coal rank after ScCO2 exposure. ScCO2 increased the macropore volume of coal accompanied by a reduction in minerals, extraction of hydrocarbons, and weakening of mechanical properties. These experiments were conducted at a single temperature. The properties of ScCO2 such as density, viscosity, and diffusivity will change with the growing depth of the coal seams at different temperatures, and this may cause different results from previous studies that have not considered the temperature change. To date, the effects of temperature on coals affected by ScCO2 remain largely unreported in the literature. More efforts are needed to understand the interactions between ScCO2 and coal [39].
In this study, mercury intrusion porosimetry (MIP), and attenuated total reflection Fourier transform infra-red spectroscopy (ATR-FTIR) tests were used to determine the changes in the chemical functional groups and physical pore structure of three bituminous coal samples under a range of ScCO2 temperatures. The structural parameters of coals were further discussed through curve fitting and fractal theory, which are not commonly used in the previous studies. The aim of the study is to better understand how ScCO2 at different temperatures affects the interaction between CO2 and different rank coals. These results can guide further assessment of geological CO2 sequestration with enhanced coalbed methane recovery.
2. Materials and Methods
2.1. Sample Collection
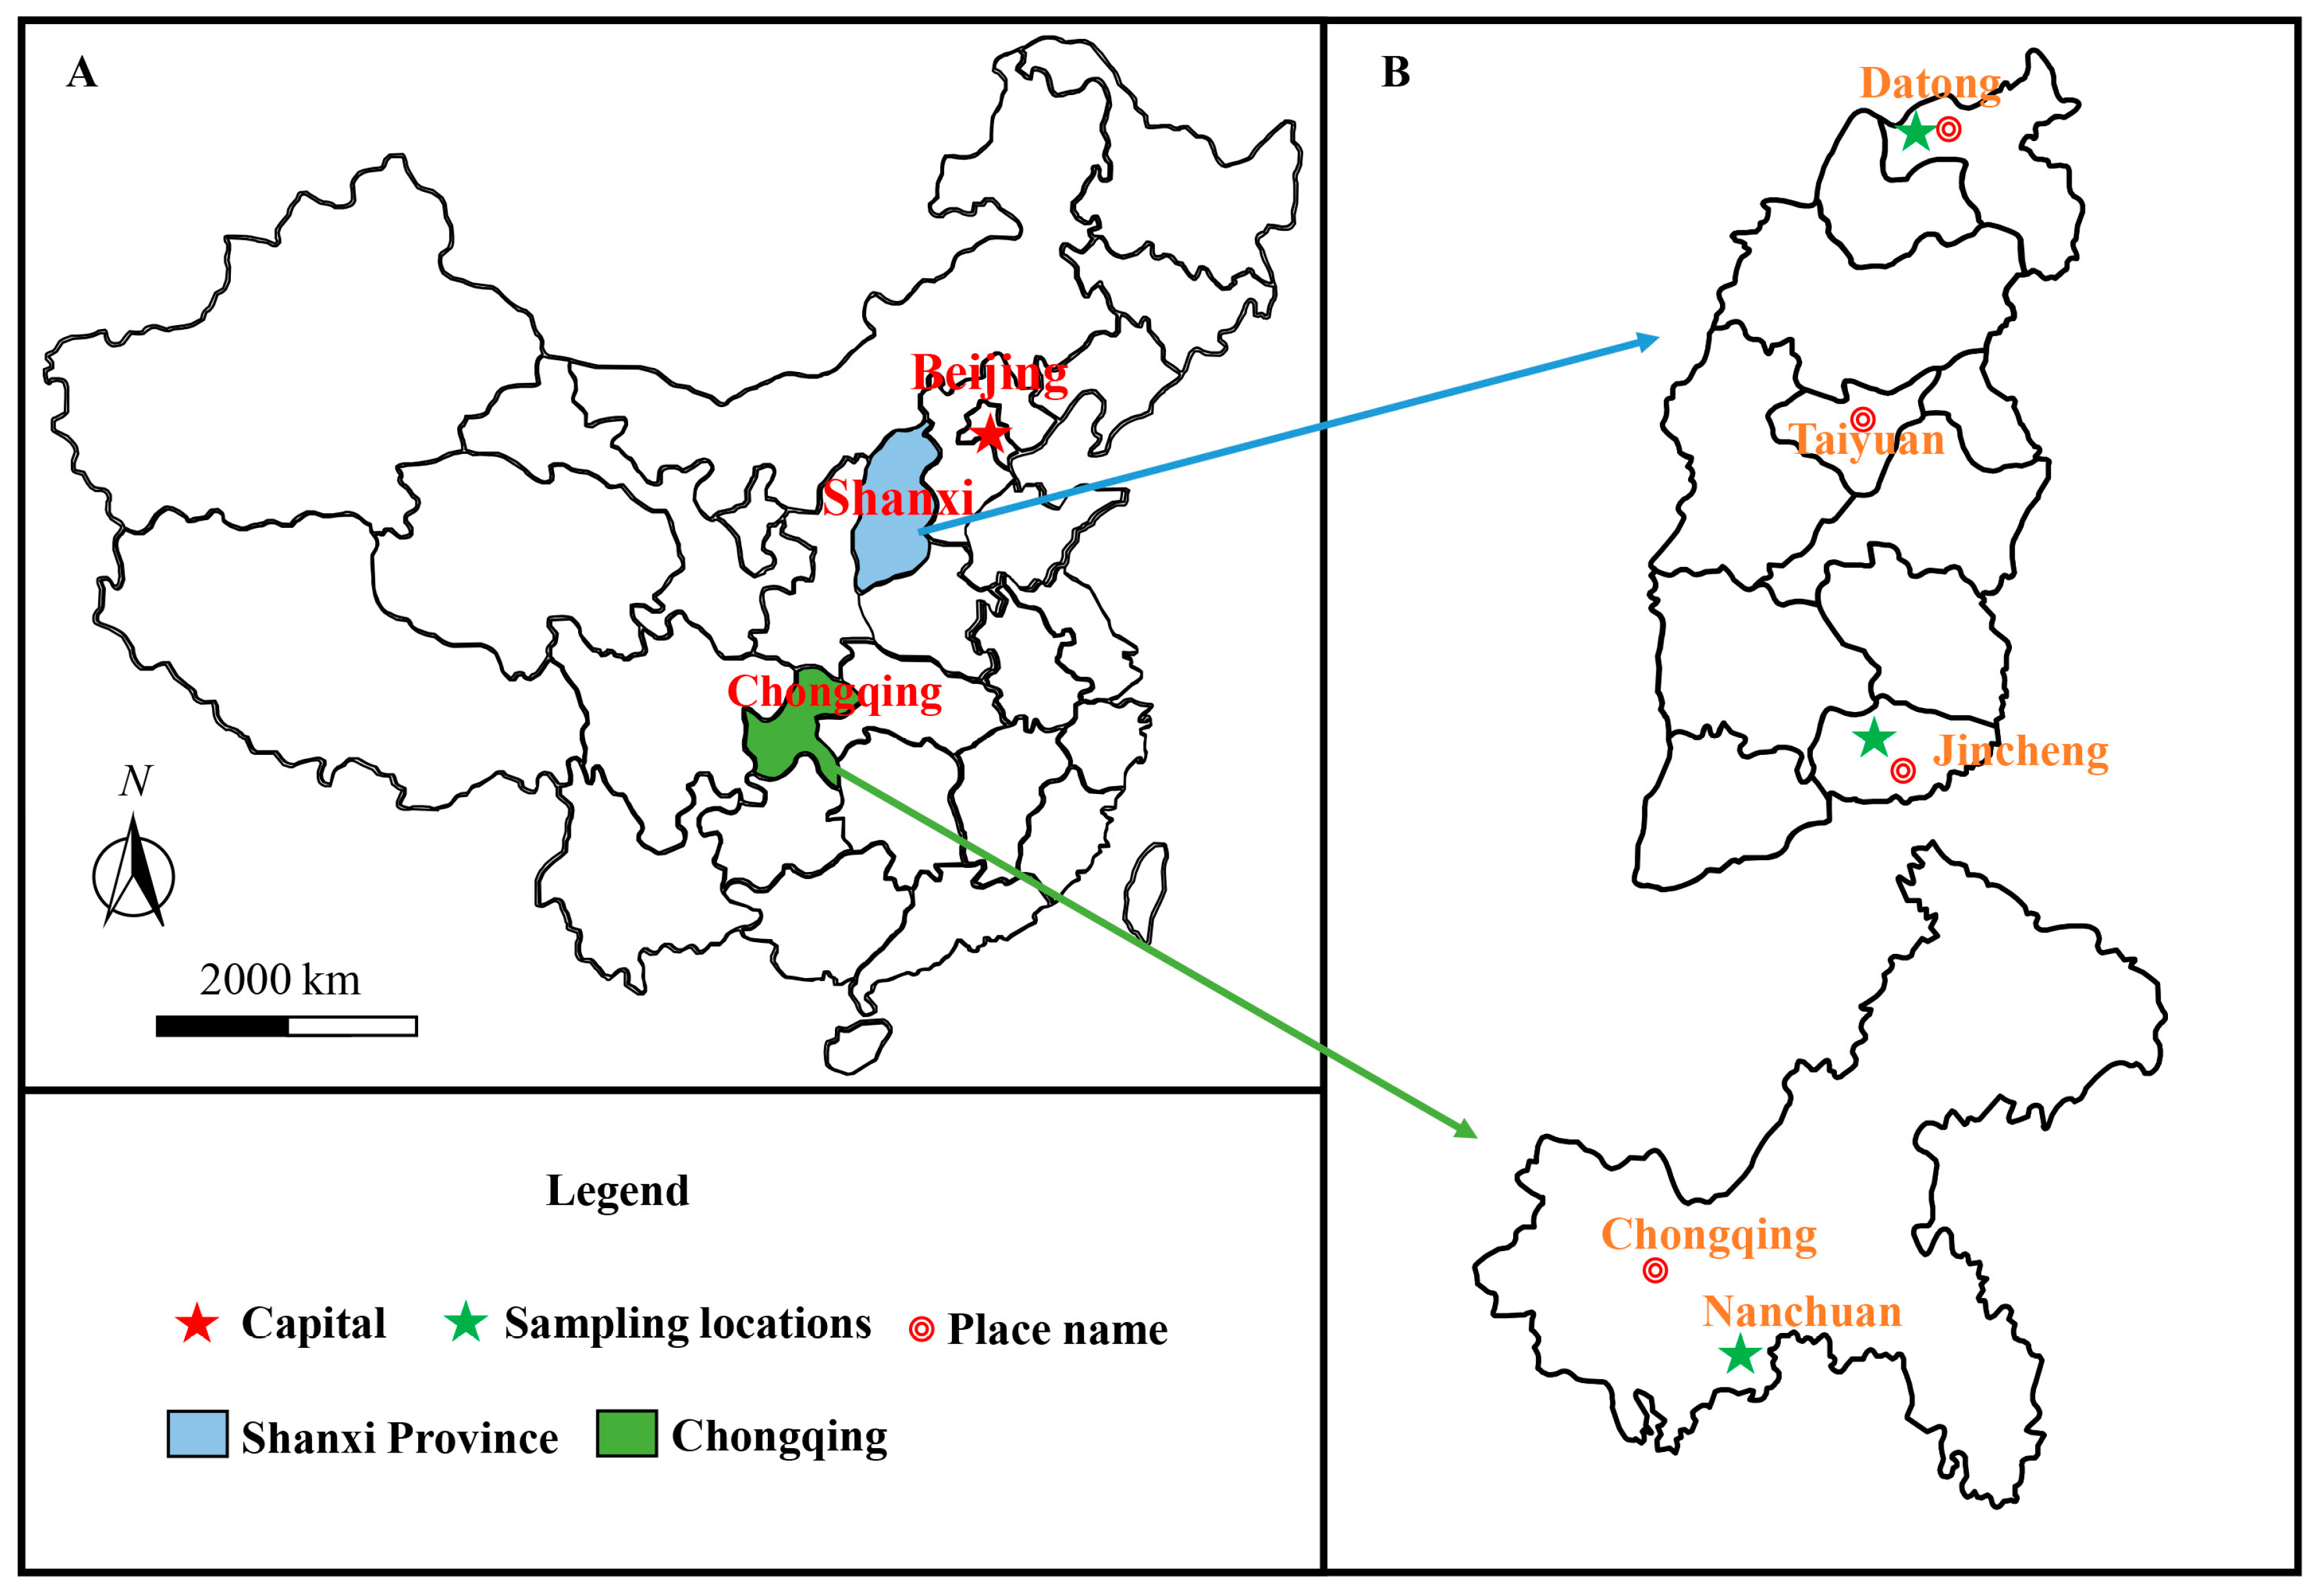
For this study, three coal samples from different mines were obtained, one from the Nanchuan coal mine in Chongqing (NC) and one each from the Jincheng coal mine (JC) and the Datong coal mine (DT) in Shanxi province. The general locations of the coal mines are shown in Figure 1. The vitrinite reflectance (Ro) analyses were performed on an Axio Scope A1 (Carl Zeiss Instruments, Oberkochen, Germany) following the standard ISO 7404-5:2009. The proximate analysis was carried out on a proximate analyzer (Changsha Kaiyuan Instruments, Changsha, China) according to the International Standard ISO 17246:2010. The analyses are shown in Table 1.
The coal samples were crushed, fully mixed, and sieved to a −3 mm grain size. For the experiments, the samples were divided into two even parts (ScCO2 treated sample, untreated sample) for comparison.
2.2. ScCO2 Treatment
The geothermal gradient of deep coal seams (>800 m) is generally 1–3 °C/hm. At present, the actual mining depth of deep coal seams in China is up to 1500m, where the reservoir temperature is about 70 °C [34]. With the growing demand for deep mining (>1900 m), CO2 may be stored in deeper coal seams at temperatures of up to 80 °C in the future. Thus, the test temperature in this experiment was taken as 40–80 °C. In order to better compare the effects of temperature on three coal samples, the experimental pressure was only set to 8 MPa according to the coalbed methane (CBM) logging data [40]. The experimental parameters are listed in Table 2.
The ScCO2 treatment experiments were conducted using a geochemical reactor that can simulate CO2 injection into a coal reservoir. The experimental setup is illustrated in Figure 2. The system consists of five main parts: a constant temperature water bath, a vacuum pump, a control panel and pipeline system, a pressure gauge, and a compression and gas injection system.
During an experiment, the saturating tank was first put into the constant temperature water bath which was heated to the target test temperature and the coal sample was degassed by the vacuum pump for 8 h. Then, the saturating tank was filled with CO2 via the ISCO pump (Teledyne ISCO, Lincoln, NE, USA) (10 mL/min). The final pressure of the sample tank after filling was 8 MPa. Meng and Qiu [27] concluded that changes of coal’s properties can be fully observed at 72 h. Liu et al. [19] proposed that the reaction between ScCO2 and coal in the first 60 h is sufficient. In this study, the reaction time was 96 h to make sure of a sufficient reaction process. The experimental condition was maintained at the target value listed in Table 2. After 96 h, the tank was slowly depressurized and the coal samples were taken for subsequent testing.
2.3. MIP Tests and Fractal Dimension Calculation(D)
The pore structure of the coal samples was performed using a Quantachrome PoreMaster-33 mercury porosimeter (Quantachrome Instruments, Boynton Beach, FL, USA). The pressure range of the equipment is 0.14–231 MPa. MIP can determine the pore size distribution from 6.4 nm to 950 μm, which is widely used for analyzing the pore structure of porous medium such as shale and coal. The particle size of the coal sample used for MIP testing was 3–5 mm.
Fractal dimension can characterize the surface roughness and internal complexity of porous media. Based on the fractal theory, the coal’s pore structure is further analyzed using the MIP data. The D value can be calculated from the Equation (2) [41]:
where V represents the cumulative intrusion volume of mercury (cm3/g); D denotes the fractal dimension; P denotes the mercury pressure (MPa); Pt denotes the threshold pressure of mercury (MPa); and A represents a constant.
2.4. Curve-Fitting Analysis of ATR-FTIR Spectra
The ATR-FTIR tests were performed using a Nicolet iS50 type Fourier infrared spectrometer (Thermo Fisher Scientific, Waltham, MA, USA). Thirty two scans per spectrum were collected at a resolution of 4 cm−1 over a scanned range of 650–4000 cm−1. The air spectrum was used as a background for each sample. The particle size of the coal sample used for ATR-FTIR testing was 74 μm.
Each spectrum is made up of multiple superimposed functional peaks. It is difficult to distinguish the position and the proportion of the absorption peaks in different regions. In order to better analyze the functional groups, the spectra were divided into three regions that have been used by other researchers for semi-quantitative analysis. These regions are aliphatic structures (3000–2800 cm−1), oxygen-containing structures (1800–1000 cm−1), and out-of-plane aromatic C-H structures (900–700 cm−1) [24]. The peaks were assigned following the work by Painter et al. [42] The peak analysis was performed using Peakfit V4.12 software (SeaSolve Software, Inc., San Jose, CA, USA). Based on the shape of the bands, the spectra were fitted by a combination of Gaussian and Lorentz functions [24,43].
Semi-quantitative parameters, “L”, “I”, and “DOC” (identified in Table 3 and described in the following sections) were obtained via curve-fitting of the FTIR spectra in order to investigate the coal’s chemical properties.
3. Results and Discussion
3.1. MIP Analyses
3.1.1. Variations in Pore Volume
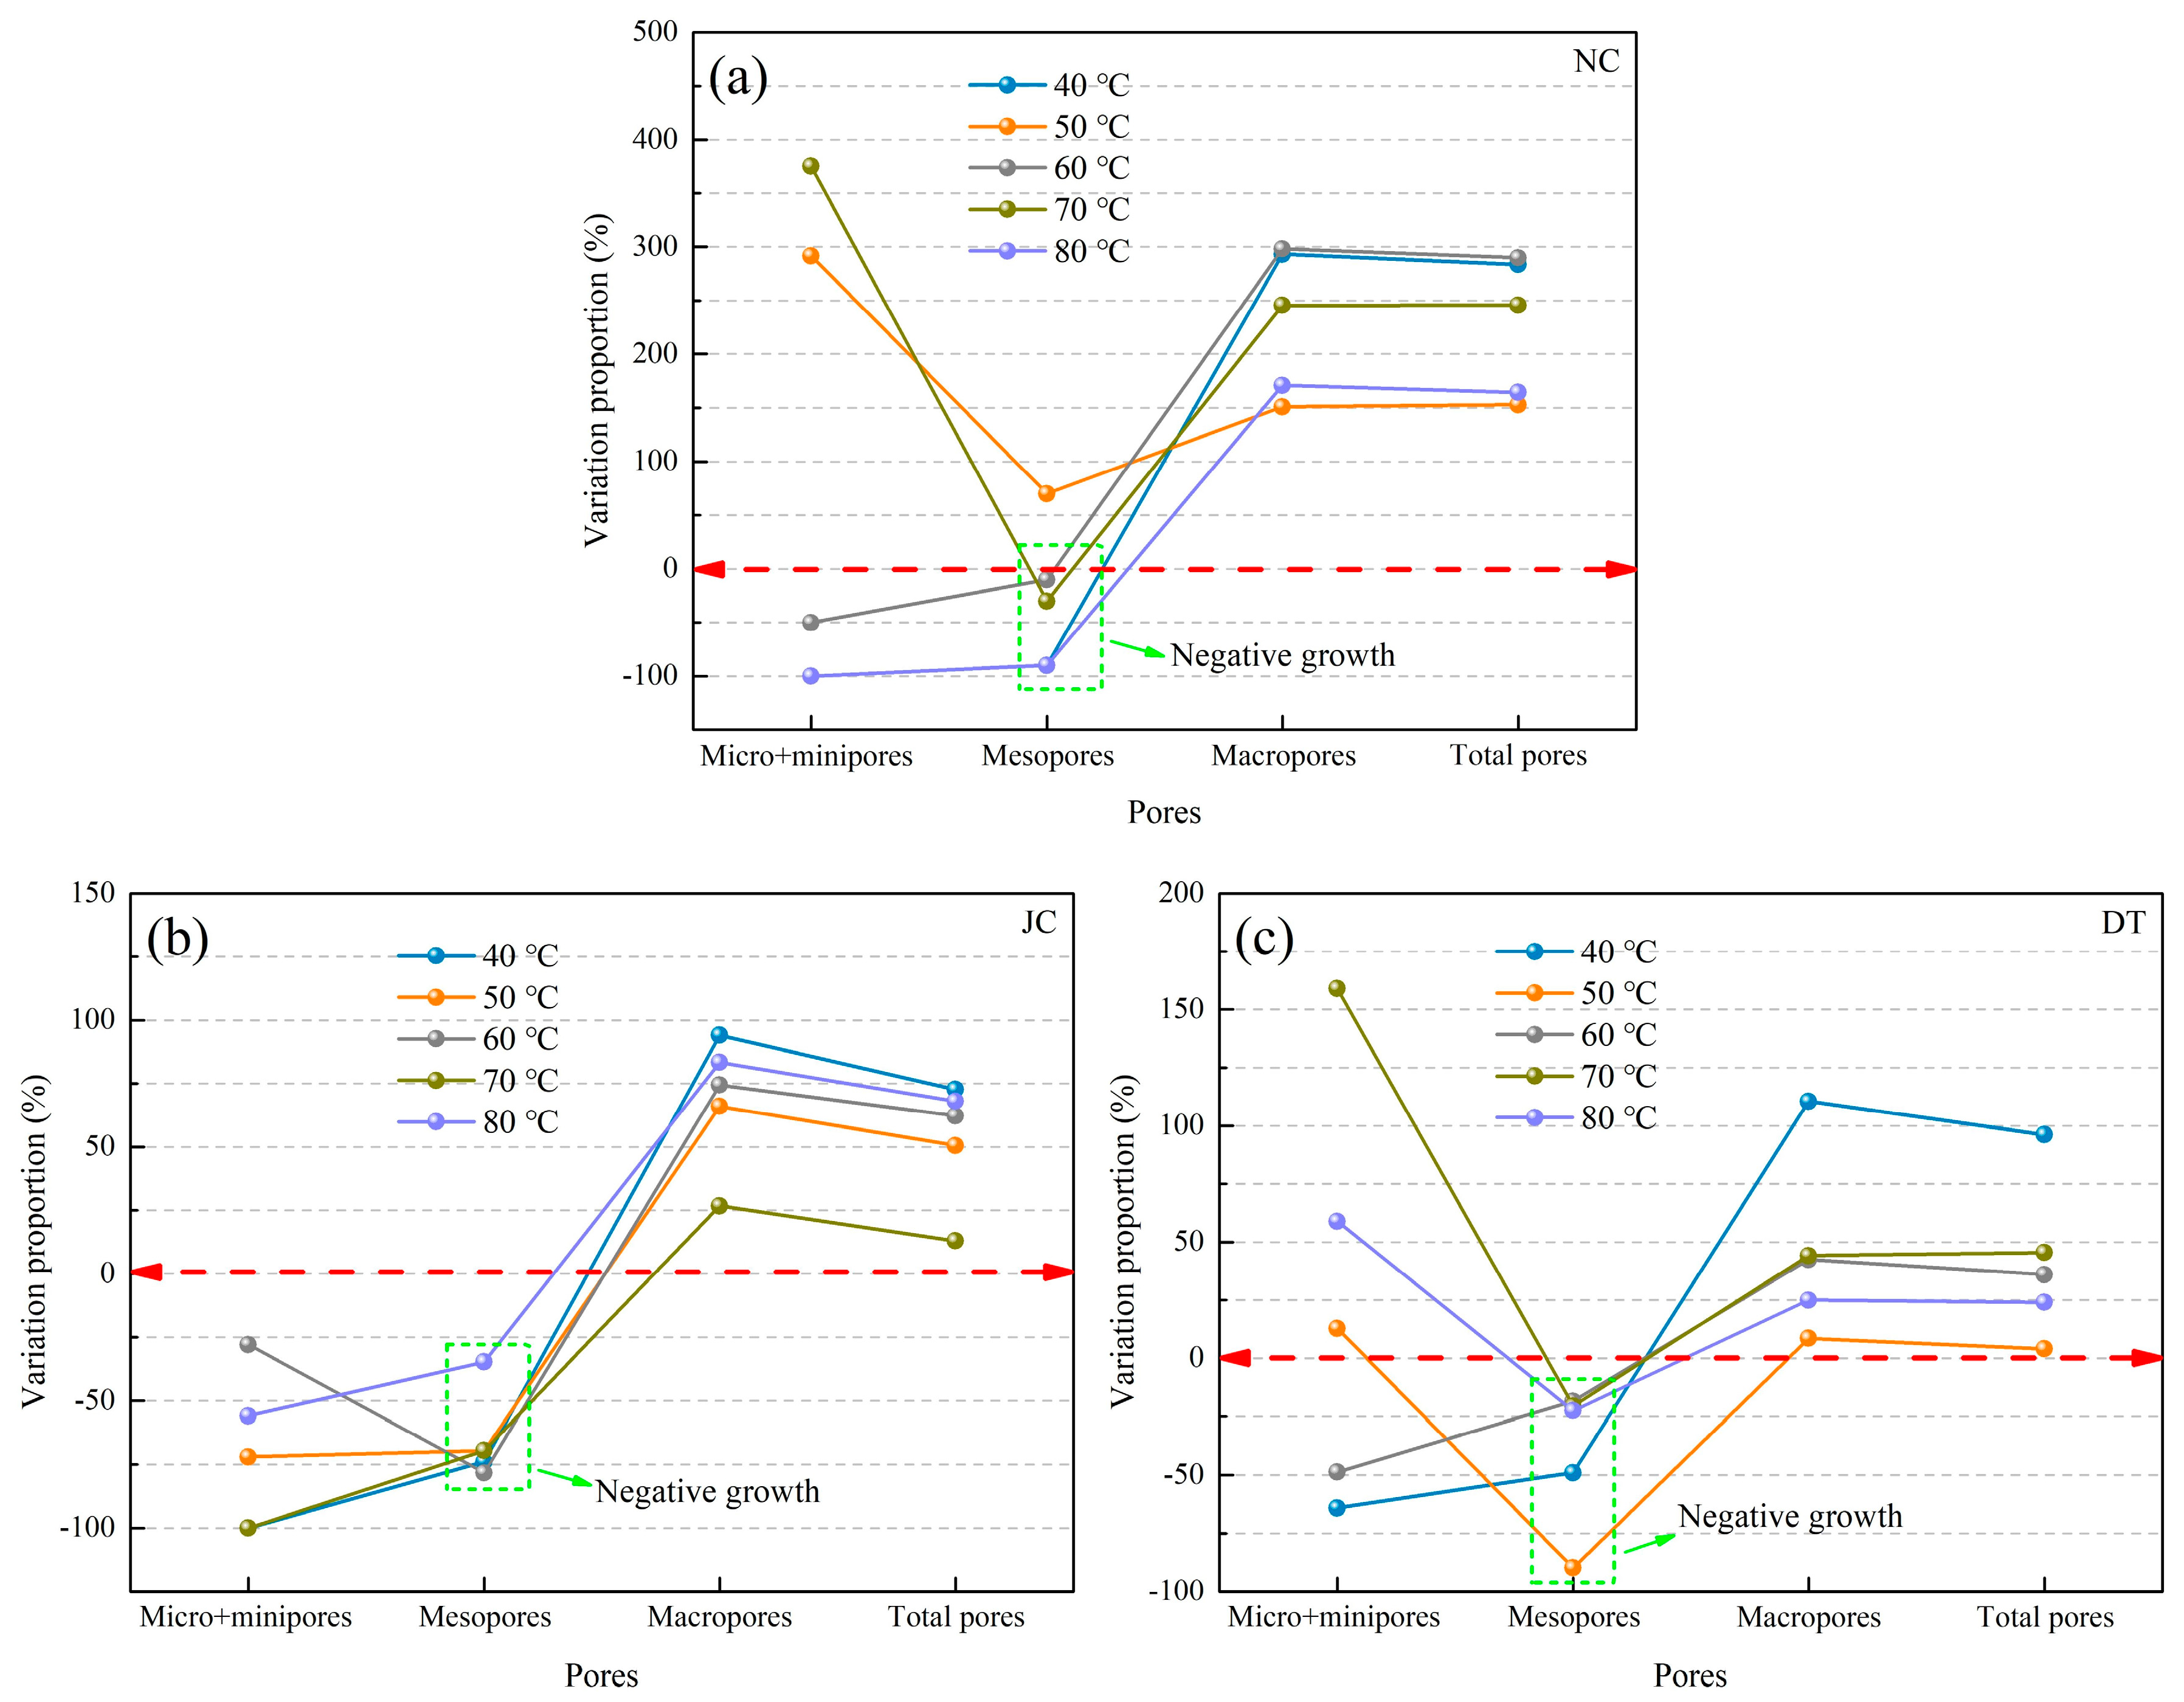
The pore volumes of the coal specimens have been divided according to the aperture classification method proposed by B.B Hodot [45], i.e., micropores (<10 nm), minipores (10–100 nm), mesopores (100–1000 nm), and macropores (>1000 nm). This method is widely used in China [25,46,47]. In this study, pores are divided into four parts (total pores, macro-, meso-, and micro+minipores). The volumes of different types of pores were calculated according to the cumulative amount of mercury injected in each aperture. The variation proportion in each pore size class after ScCO2 treatment was calculated by Equation (3).
where Vtreatment is pore volumes of ScCO2 treated coal sample; Vraw is pore volumes of untreated coal sample.
Figure 3a–c shows all the variation proportion of total pores in the treated samples are positive. This indicates that ScCO2 increases the pore size of coal. Given that water existed in the raw coal, CO2 dissolved in water formed carbonic acid during ScCO2 exposure [48,49]. Jiang et al. [50] found that crystal water was released from clay minerals after ScCO2 treatment. Previous studies have shown that some carbonate minerals are dissolved and some hydrocarbons are extracted and washed away by the gas or water after ScCO2 treatment [23,26]. The chemical reactions are listed in Equations (4) and (5). Apparently, many pores originally separated by minerals and hydrocarbons become continuous pores. Theoretically, CO2 is adsorbed in the coal seam while CH4 is replaced simultaneously. These continuous pores are conducive to CH4 desorption and flow. Therefore, CO2 could enhance coalbed methane recovery and can be stored in the coal seam [26].
The total pore volume in the samples treated with ScCO2 at 40 °C is almost the largest pore volume of all the temperatures tested. After ScCO2 treatment, the total pore volume of the NC, JC, and DT samples increased by 284%, 73%, and 96%, respectively. These results indicate that treatment at 40 °C has a great influence on the expansion of the seepage channels and the pore structure. The variation proportion of total pores decreases with as temperature increases. In conclusion, as the increase of buried depth, the enhancement effect became less significant. This is because temperature influences the supercritical fluid density. Under the same pressure, the density of ScCO2 decreases as temperature increases, and the solubility of ScCO2 decreases [50,51].
As seen in Figure 3, the value of variation proportion less than zero is defined as a “negative growth” region. The variation proportion of mesopores change is negative in almost all cases and the variation proportion of macropores change is always positive. It may be that the transformation of micro- and minipores to the mesopores is less complete than the transformation of micro-, mini-, and mesopores to macropores. Regardless of temperature effects, the increase in macropores is consistent with previous research [19,27,52]. The difference in the results of other pores is due to the complexity of coal’s pore structure.
3.1.2. Variations in Fractal Dimension (D)
The mercury injection curves are divided into three stages (Figure 4a) using the fractal divisions of mercury injection curves proposed by Liu et al. [19]. The stages A and B represent the microfissures (48.86–187.7 μm) and microcracks (8.428–48.86 μm) of the coal samples filled with mercury in the low-pressure injection process. Stage C shows the mercury enters the pores (9.61 nm–14.76 μm) in the high-pressure injection process. As described in Equations (2) and (3), the D value is obtained [41]. Figure 4b–d gives the ln(V) vs. ln(P-Pt) for fractal dimension analysis. The D values (D1, D2, D3) represent the fractal dimension of these three stages (A, B, C) of each coal sample, respectively. A larger D value indicates a rougher and more irregular surfaces [53].
As shown in Figure 5, the results show that most D1 values are lower at higher ScCO2 treatment temperatures, indicating that the complexity and surface roughness of microfissures gradually decrease with increasing temperature. D2 values are all between 2.8 and 3.0, which show that the microcracks are more complicated. After ScCO2 treatment, D2 values decrease, indicating that ScCO2 treatment reduces the complexity of microcracks. D3 values fluctuate greatly because stage C reflects the compression process at high pressure [54,55]. The blue dashed lines in Figure 5 marks the smaller D values, which represents a less complex pore structure. According to previous research, the coal surface becomes smoother after extraction effect of ScCO2 [12,23,56]. The ScCO2 reduced the DT coal’s pore structure complexity (the fractal dimension) when the coal was treated at higher temperatures of 70 °C and 80 °C, but the fractal dimension of the NC and JC coals appeared to exhibit an opposite trend at 50 °C and 70 °C, and 60 °C and 80 °C, respectively. It can be inferred that the higher the coal rank, the lower the favorable temperature range for ScCO2 to reduce pore complexity.
3.2. ATR-FTIR Analyses
The ATR-FTIR spectra from the treated and untreated coal samples at different temperatures are shown in Figure 6. The sample’s infrared spectra are similar, but the intensities of the absorption peaks are different. This indicates that the amounts and composition of those structures in the three coal samples differ. The peaks for the –OH groups (3600–3100 cm−1) and oxygen-containing structures (1800–1000 cm−1) in the DT coal are higher than those peaks in the NC and JC coals. In addition, the aromatic C–H stretching vibration peak (3100–3000 cm−1) from the DT coal is lower than that peak from the other two coals. The aliphatic hydrocarbon content (represented by the 3000–2800 cm−1 peak) increases with the decreasing coal rank. The 1306 cm−1 absorption peak is not present for the DT coal sample. The peak’s disappearance is related to the chemical and physical structural changes caused by a coalification jump [57,58]. The absorbance of the NC and JC samples in the aromatic structure reflectance range (900–700 cm−1) is greater than that of the DT sample. The organic functional group intensities weakened after ScCO2 treatment, indicating that some chemical changes must have taken place, such as organic molecule extraction. The oxygen-containing functional groups were reduced after ScCO2 exposure. The reduction of organic substances results in the transformation of open micro- and mesopores near the macropores into macropores. The peak fitting results for the NC coal sample after ScCO2 treatment at 40 °C and 8 MPa are shown in Figure 7. The errors of parameters extracted from ATR-FTIR spectra are within ±5%.
3.2.1. Variations in Aromaticity
The “I” IR index represents the intensity of aromatic structures relative to aliphatic structures [24]. Figure 8 shows the I (aromaticity), L (aliphatic chain length), and degree of condensation (DOC) of aromatic rings indexes and shows that the NC and JC coals contain more aromatic hydrocarbons than aliphatic hydrocarbons. However, the DT coal contains more aliphatic hydrocarbons, and this means that the aliphatic hydrocarbons content increases gradually as the coal rank decreases. The I-values for the NC and JC samples show a general downward trend with increasing temperature but the changes in DT coal sample I-values is more complicated. Previous research has shown that low-rank coal is excited more by ScCO2 treatment than high-rank coal, and that coal rank affects the aromatic and aliphatic hydrocarbon content of the coal [18,23]. Aliphatic structures were easier to be mobilized than aromatic structures. CO2 is a non-polar molecule. According to the similar phase dissolution-relationship, CO2 is easier to chemically react with non-polar bonds or weakly polar bonds. Small aliphatic molecules are bonded with some weak noncovalent bonds, such as hydrogen bonds or other even weaker interactions. More aliphatic hydrocarbons in DT coal is responsible for more complex chemical reactions in lower rank coal, such as dissociation reactions, addition reactions, polyaddition reactions, or substitution reactions [59]. In addition, lower rank coal may be more sensitive to temperature and it is easier to react with ScCO2 than higher rank coal. This is the reason why the distribution of DT coal I-values is relatively irregular. The chemical reactions that may occur in ScCO2 and coal are listed in Equations (6)–(8).
The hydrogen free radical (·H) resulted from cross-link breakage can be substituted by CHx, and the aromatic–CHx (Ar–CHx) and aliphatic–CHx forms (Equation (6)). The formation of C–C cross-links is a polyaddition reaction (Equation (7)). In addition, the free radical (·C) can be formed by the chemical bond of CHx under acid environment and heating condition [60]. This is the bond dissociation reaction of CHx (Equation (8)).
3.2.2. Variations in the DOC of Aromatic Rings
Figure 8 clearly shows that the DOC of aromatic rings increases as coal rank increases. The DOC-values for the NC and JC samples are much higher than the DT DOC-values. Liu et al. [59] also found that the DOC-values decrease after ScCO2 treatment, but the reason was not given in the literature. The U-shape relationship between temperature and DOC is also clear in Figure 8. According to the I-values, the relative contents of aliphatic and aromatic hydrocarbons changed after ScCO2 treatment. Thus, changes in the coal’s macromolecular structures cause the DOC-values to decrease. The DOC-values increase in the 60–80 °C range due to the molecular activation energy decreases and the intermolecular collision intensifies at higher temperatures. At 80 °C, the aliphatic side chains in the NC and JC coals are shorter, resulting in relatively compact structures with small spaces between the aromatic clusters [61]. At 80 °C, the DOC-values are higher than they are at lower temperatures.
The DOC of the aromatic rings increases as coal rank increases, resulting in a denser coal skeleton. Changes in the coal skeleton cause the coal to be compacted [62,63]. Therefore, an increase in the DOC-values indirectly results in the compaction of the coal bulk. After ScCO2 exposure, the decrease in the DOC-values indicates a relatively loose coal structure due to the extraction of the polycyclic aromatic hydrocarbons, the aliphatic hydrocarbons, and the aromatic hydrocarbons. Fu et al. [64] reported that an increase in the DOC of aromatic rings favors CH4 adsorption. Therefore, the decrease in the DOC-values after ScCO2 treatment favors CH4 desorption.
3.2.3. Variations in Aliphatic Chain Length and Aliphatic Hydrocarbon Content
The “L” value is the ratio between the CH2 and CH3. This represents the length or degree of the aliphatic side chains. Figure 8d–f shows the changes in the L-value and the percentage of aliphatic hydrocarbon groups in the treated and raw coal samples. The L-value of untreated coal samples increases with coal rank. The macromolecular structure of these samples is dominated by –CH2. This indicates that straight chains and alicyclic structures with few branches exist in the aliphatic hydrocarbons of the coal samples [60].
The trend of the NC and JC aliphatic chain lengths changes is basically the same. This is because they belong to the same coal rank. The fluctuation of the L-values indicates that at different temperatures, the aliphatic hydrocarbon side chains not only break and fall off, but the hydrocarbons also undergo different degrees of addition and polyaddition reactions. An example of cross-linked cluster generation can be found in the work by Carstro-Marcano et al. [65].
At 80 °C, the NC and JC chain lengths decrease by 58.89% and 50.38% respectively, which may be because the higher temperature encourages the side chains to fall off the –CH2 groups. The L-values of DT coal treated with ScCO2 are higher than the L-value of the untreated DT coal sample (except for the DT coal treated at 40 °C). The percentages of –CH2 and –CH3 in the DT coal generally decrease as the treatment temperature increases, but the decrease in –CH2 is less than –CH3. There are no obvious changes in the functional subgroups (–CH3, –CH2, and –CH) obtained from the aliphatic structures represented by the 3000–2800 cm−1 band. The changes that take place in the different coal samples at different ScCO2 treatment temperatures are complicated. This complexity arises from the complex chemical properties of ScCO2 fluids and coals.
In addition, under the pressure exerted by the surrounding rock, the functional groups and side chains in the coal may break and generate free radicals. These free radicals adhere to the cracks and internal surfaces in the coal and can combine with O2 to form CO [66]. Mazumder et al. [67] have shown that there is a high probability that coal and CO2 will react to form CO when CO2 is stored in coal seams. The newly generated CO, the aliphatic and aromatic hydrocarbons, and the polycyclic aromatic hydrocarbons in the coal matrix extracted by the ScCO2 are biologically toxic. These substances dissolved in gas and water will enter the coal seams, the rock formations, and the groundwater surrounding the coal seam and will become environmental hazards [23,68].
The functional groups and the coal’s internal structure changed after ScCO2 treatment indicating that chemical reactions occurred. Furthermore, the chemical changes and degrees of structural change in the three samples were not the same because the samples were not of the same rank. The changes in the macromolecular structure that took place in the relatively higher rank coals at different ScCO2 treatment temperatures were relatively simple but the changes in the relatively lower rank coal were more complex. Research has shown that ScCO2 extracted more organic material from low rank coal than it extracted from high rank coal. [10,23,68] CO2 Storage in low-rank coal seams will have more environmental issues. Additional research should be done on low-rank coal–ScCO2 reactions.
4. Conclusions
In this study, MIP test, fractal theory, ATR-FTIR test, and curve fitting were conducted on three coal samples to understand the effects of supercritical carbon dioxide (ScCO2) treatment on the pore structure and functional groups in the coal at different temperatures. The conclusions were drawn as follows:
- (1)
- The cumulative pore volume of the three coal samples treated with ScCO2 increases significantly. In most of the treated coal samples, the variation proportion of mesopores decreases and the variation proportion of macropores increases. Compared to the untreated coal samples, the total pore volumes in samples treated with ScCO2 at 40 °C (the NC, JC, and DT samples) increased by 284%, 73% and 96%, respectively. In general, compared to the treatment at any other temperature, the pore structure of coal develops better when the ScCO2 is 40 °C. The variation proportion of total pores decreases with increasing temperature. In conclusion, as the buried depth increased, the enhancement effect of ScCO2 became less significant.
- (2)
- The ScCO2 reduced the DT coal’s pore structure complexity (the fractal dimension) when the coal was treated at higher temperatures (70 °C and 80 °C), but the fractal dimension of the NC and JC coals appeared to exhibit an opposite trend in the 50°C and 70 °C, and 60°C and 80 °C. The higher the coal rank, the lower the favorable temperature range for ScCO2 to reduce pore complexity.
- (3)
- When measured by FTIR, the hydrocarbon functional group IR peaks from the three ScCO2-treated coal samples are lower than the peaks from the untreated samples because the ScCO2 extracted some hydrocarbons. The structural parameters of the coal samples were classified using three IR indexes: L (aliphatic chain length), I (aromaticity), and degree of condensation (DOC) of aromatic rings. These indexes were obtained by curve fitting. After treatment with ScCO2, the I-values for the NC and JC coals decreased when the temperature is increased. The DOC-values of those two samples are lower and the DOC-values follow a U-shape curve with temperature. The decrease in the DOC-values indicates a favorable desorption of CH4. However, no regular patterns in the IR index data for the DT coal sample were apparent, implying that the changes in the relatively lower rank coal during ScCO2 treatment are more complex. The changes in aliphatic chain lengths in the NC and JC coal samples are consistent. Almost all of the L-values of the ScCO2-treated coal sample (DT) are higher than the L-values of untreated samples.
Both CO2 sequestration and CO2-ECBM are affected by many factors. In this study, only the effects of ScCO2 on coal at different temperatures were investigated. Further effort is needed to investigate the effects of ScCO2 on coal under different water contents in our next work.
Author Contributions
Z.G. and M.Z. conceived and designed the experiments; M.Z., H.W. and X.L. performed the experiments; M.Z. and Y.C. analyzed the data; Z.G. and W.W contributed materials and analysis tools; Z.G. and M.Z. wrote the paper.
Funding
This research was funded by the National Natural Science Foundation of China (No. 51774055, 51904049, 51625401); and the Natural Science Foundation of Chongqing (General Program, No. cstc2019jcyj-msxmX0702).
Conflicts of Interest
The authors declare no conflict of interest.
References
- Pacala, S.; Socolow, R. Stabilization wedges: Solving the climate problem for the next 50 years with current technologies. Science 2004, 305, 968–972. [Google Scholar] [CrossRef] [PubMed] [Green Version]
- Chen, W.Y.; Xu, R.N. Clean coal technology development in China. Energ Policy 2010, 38, 2123–2130. [Google Scholar] [CrossRef]
- Prabu, V.; Mallick, N. Coalbed methane with CO2 sequestration: An emerging clean coal technology in India. Renew. Sustain. Energy Rev. 2015, 50, 229–244. [Google Scholar] [CrossRef]
- Singh, H.; Cai, J. A mechanistic model for multi-scale sorption dynamics in shale. Fuel 2018, 234, 996–1014. [Google Scholar] [CrossRef]
- Su, E.; Liang, Y.; Zou, Q.; Niu, F.; Li, L. Analysis of Effects of CO2 Injection on Coalbed Permeability: Implications for Coal Seam CO2 Sequestration. Energy Fuels 2019, 33, 6606–6615. [Google Scholar] [CrossRef]
- Wang, K.R.; Xu, T.F.; Wang, F.G.; Tian, H.L. Experimental study of CO2-brine-rock interaction during CO2 sequestration in deep coal seams. Int. J. Coal Geol. 2016, 154, 265–274. [Google Scholar] [CrossRef]
- Skrzypkowski, K. Compressibility of materials and backfilling mixtures with addition of solid wastes from flue-gas treatment and fly ashes. E3S Web Conf. 2018, 71, 00007. [Google Scholar] [CrossRef]
- Skrzypkowski, K.; Korzeniowski, W.; Poborska-Mlynarska, K. Binding capability of ashes and dusts from municipal solid waste incineration with salt brine and geotechnical parameters of the cemented samples. Arch. Min. Sci. 2018, 63, 903–918. [Google Scholar] [CrossRef]
- Benson, S.M.; Surles, T. Carbon dioxide capture and storage: An overview with emphasis on capture and storage in deep geological formations. Proc. IEEE 2006, 94, 1795–1805. [Google Scholar] [CrossRef] [Green Version]
- White, C.M.; Smith, D.H.; Jones, K.L.; Goodman, A.L.; Jikich, S.A.; LaCount, R.B.; DuBose, S.B.; Ozdemir, E.; Morsi, B.I.; Schroeder, K.T. Sequestration of carbon dioxide in coal with enhanced coalbed methane recovery—A review. Energy Fuels 2005, 19, 659–724. [Google Scholar] [CrossRef]
- Liu, X.; Nie, B.; Wang, W.; Wang, Z.; Zhang, L. The use of AFM in quantitative analysis of pore characteristics in coal and coal-bearing shale. Mar. Petrol. Geol. 2019, 105, 331–337. [Google Scholar] [CrossRef]
- Bae, J.S.; Bhatia, S.K.; Rudolph, V.; Massarotto, P. Pore Accessibility of Methane and Carbon Dioxide in Coals. Energy Fuels 2009, 23, 3319–3327. [Google Scholar] [CrossRef]
- Cai, C.; Kang, Y.; Wang, X.; Hu, Y.; Chen, H.; Yuan, X.; Cai, Y. Mechanism of supercritical carbon dioxide (SC-CO2) hydro-jet fracturing. J. CO2 Util. 2018, 26, 575–587. [Google Scholar] [CrossRef]
- Liang, Y. Promote the precise development and utilization of closed/abandoned mine resources in China. Coal Econ. Res. 2019, 39, 1. [Google Scholar] [CrossRef]
- Ehlig-Economides, C.; Economides, M.J. Sequestering carbon dioxide in a closed underground volume. J. Pet. Sci. Eng. 2010, 70, 123–130. [Google Scholar] [CrossRef] [Green Version]
- Massarotto, P.; Golding, S.D.; Bae, J.S.; Iyer, R.; Rudolph, V. Changes in reservoir properties from injection of supercritical CO2 into coal seams—A laboratory study. Int. J. Coal Geol. 2010, 82, 269–279. [Google Scholar] [CrossRef]
- Okolo, G.N.; Neomagus, H.W.J.P.; Everson, R.C.; Roberts, M.J.; Bunt, J.R.; Sakurovs, R.; Mathews, J.P. Chemical-structural properties of South African bituminous coals: Insights from wide angle XRD-carbon fraction analysis, ATR-FTIR, solid state C-13 NMR, and HRTEM techniques. Fuel 2015, 158, 779–792. [Google Scholar] [CrossRef]
- Kolak, J.J.; Burruss, R.C. Geochemical investigation of the potential for mobilizing non-methane hydrocarbons during carbon dioxide storage in deep coal beds. Energy Fuels 2006, 20, 566–574. [Google Scholar] [CrossRef]
- Liu, C.J.; Wang, G.X.; Sang, S.X.; Gilani, W.; Rudolph, V. Fractal analysis in pore structure of coal under conditions of CO 2 sequestration process. Fuel 2015, 139, 125–132. [Google Scholar] [CrossRef]
- Liu, C.J.; Wang, G.X.; Sang, S.X.; Rudolph, V. Changes in pore structure of anthracite coal associated with CO2 sequestration process. Fuel 2010, 89, 2665–2672. [Google Scholar] [CrossRef]
- Liu, S.; Ma, J.; Sang, S.; Wang, T.; Du, Y.; Fang, H. The effects of supercritical CO2 on mesopore and macropore structure in bituminous and anthracite coal. Fuel 2018, 223, 32–43. [Google Scholar] [CrossRef]
- Wang, Q.; Li, W.; Zhang, D.; Wang, H.; Jiang, W.; Zhu, L.; Tao, J.; Huo, P.; Zhang, J. Influence of high-pressure CO2 exposure on adsorption kinetics of methane and CO2 on coals. J. Nat. Gas Sci. Eng. 2016, 34, 811–822. [Google Scholar] [CrossRef]
- Zhang, D.; Gu, L.; Li, S.; Lian, P.; Tao, J. Interactions of Supercritical CO2 with Coal. Energy Fuels 2013, 27, 387–393. [Google Scholar] [CrossRef]
- He, X.; Liu, X.; Nie, B.; Song, D. FTIR and Raman spectroscopy characterization of functional groups in various rank coals. Fuel 2017, 206, 555–563. [Google Scholar] [CrossRef]
- Zhang, K.; Cheng, Y.; Li, W.; Wu, D.; Liu, Z. Influence of supercritical CO2 on pore structure and functional groups of coal: Implications for CO2 sequestration. J. Nat. Gas. Sci. Eng. 2017, 40, 288–298. [Google Scholar] [CrossRef] [Green Version]
- Zhang, B.; Liang, W.; Ranjith, P.G.; Li, Z.; Li, C.; Hou, D. Coupling Effects of Supercritical CO2 Sequestration in Deep Coal Seam. Energy Fuels 2018, 33, 460–473. [Google Scholar] [CrossRef]
- Meng, M.; Qiu, Z. Experiment study of mechanical properties and microstructures of bituminous coals influenced by supercritical carbon dioxide. Fuel 2018, 219, 223–238. [Google Scholar] [CrossRef]
- Day, S.; Fry, R.; Sakurovs, R. Swelling of Australian coals in supercritical CO2. Int. J. Coal Geol. 2008, 74, 41–52. [Google Scholar] [CrossRef]
- Zhang, X.G.; Ranjith, P.G.; Li, D.Y.; Perera, M.S.A.; Ranathunga, A.S.; Zhang, B.N. CO2 enhanced flow characteristics of naturally-fractured bituminous coals with N2 injection at different reservoir depths. J. CO2 Util. 2018, 28, 393–402. [Google Scholar] [CrossRef]
- Qu, H.; Liu, J.; Chen, Z.; Wang, J.; Pan, Z.; Connell, L.; Elsworth, D. Complex evolution of coal permeability during CO2 injection under variable temperatures. Int. J. Greenhouse Gas. Control. 2012, 9, 281–293. [Google Scholar] [CrossRef]
- Wang, K.; Du, F.; Wang, G. Investigation of gas pressure and temperature effects on the permeability and steady-state time of chinese anthracite coal: An experimental study. J. Nat. Gas Sci. Eng. 2017, 40, 179–188. [Google Scholar] [CrossRef]
- Li, X.; Yan, X.; Kang, Y. Effect of temperature on the permeability of gas adsorbed coal under triaxial stress conditions. J. Geophys. Eng. 2018, 15, 386–396. [Google Scholar] [CrossRef] [Green Version]
- Niu, S.; Zhao, Y.; Hu, Y. Experimental Investigation of the Temperature and Pore Pressure Effect on Permeability of Lignite Under the In Situ Condition. Transp. Porous Med. 2013, 101, 137–148. [Google Scholar] [CrossRef]
- Yin, G.; Jiang, C.; Wang, J.G.; Xu, J. Combined Effect of Stress, Pore Pressure and Temperature on Methane Permeability in Anthracite Coal: An Experimental Study. Transp. Porous Med. 2013, 100, 1–16. [Google Scholar] [CrossRef]
- Levy, J.H.; Day, S.J.; Killingley, J.S. Methane capacities of Bowen basin coals related to coal properties. Fuel 1997, 76, 813–819. [Google Scholar] [CrossRef]
- Sakurovs, R.; Day, S.; Weir, S.; Duffy, G. Application of a modified Dubinin-Radushkevich equation to adsorption of gases by coals under supercritical conditions. Energy Fuels 2007, 21, 992–997. [Google Scholar] [CrossRef]
- Crosdale, P.J.; Moore, T.A.; Mares, T.E. Influence of moisture content and temperature on methane adsorption isotherm analysis for coals from a low-rank, biogenically-sourced gas reservoir. Int. J. Coal Geol. 2008, 76, 166–174. [Google Scholar] [CrossRef]
- Perera, M.S.A.; Ranjith, P.G.; Choi, S.K.; Airey, D. Investigation of temperature effect on permeability of naturally fractured black coal for carbon dioxide movement: An experimental and numerical study. Fuel 2012, 94, 596–605. [Google Scholar] [CrossRef]
- Ozdemir, E. Modeling of coal bed methane (CBM) production and CO2 sequestration in coal seams. Int. J. Coal Geol. 2009, 77, 145–152. [Google Scholar] [CrossRef] [Green Version]
- Zhanli, R. Determination of heat flow in well Qincan 1 in Qinshui Basin, Shanxi province. Chin. J. Geol. 1998, 2, 251–254. [Google Scholar]
- Angulo, R.F.; Alvarado, V.; Gonzalez, H. Fractal Dimensions from Mercury Intrusion Capillary Tests. In Proceedings of the SPE Latin America Petroleum Engineering Conference, Caracas, Venezuela, 8–11 March 1992; pp. 255–263. [Google Scholar]
- Painter, P.C.; Snyder, R.W.; Starsinic, M.; Coleman, M.M.; Kuehn, D.W.; Davis, A. Concerning the Application of Ft-Ir to the Study of Coal—A Critical-Assessment of Band Assignments and the Application of Spectral-Analysis Programs. Appl. Spectrosc. 1981, 35, 475–485. [Google Scholar] [CrossRef]
- He, X.; Liu, X.; Song, D.; Nie, B. Effect of microstructure on electrical property of coal surface. Appl. Surf. Sci. 2019, 483, 713–720. [Google Scholar] [CrossRef]
- Xuguang, S. The investigation of chemical structure of coal macerals via transmitted-light FT-IR microspectroscopy. Spectrochim. Acta A Mol. Biomol. Spectrosc. 2005, 62, 557–564. [Google Scholar] [CrossRef] [PubMed]
- Hudot, B.B. Coal and Gas Outburst, 1st ed.; China Industrial Press: Beijing, China, 1966. [Google Scholar]
- Cai, Y.; Liu, D.; Pan, Z.; Yao, Y.; Li, J.; Qiu, Y. Pore structure and its impact on CH4 adsorption capacity and flow capability of bituminous and subbituminous coals from Northeast China. Fuel 2013, 103, 258–268. [Google Scholar] [CrossRef]
- Zhao, W.; Cheng, Y.; Yuan, M.; An, F. Effect of Adsorption Contact Time on Coking Coal Particle Desorption Characteristics. Energy Fuels 2014, 28, 2287–2296. [Google Scholar] [CrossRef]
- Ao, X.; Lu, Y.; Tang, J.; Chen, Y.; Li, H. Investigation on the physics structure and chemical properties of the shale treated by supercritical CO 2. J. CO2 Util. 2017, 20, 274–281. [Google Scholar] [CrossRef]
- Zhang, G.; Ranjith, P.G.; Perera, M.S.A.; Lu, Y.; Choi, X. Quantitative Analysis of Micro-structural Changes in a Bituminous Coal After Exposure to Supercritical CO2 and Water. Nat. Resour. Res. 2019, 28, 1639–1660. [Google Scholar] [CrossRef]
- Jiang, Y.; Luo, Y.; Lu, Y.; Qin, C.; Liu, H. Effects of supercritical CO2 treatment time, pressure, and temperature on microstructure of shale. Energy 2016, 97, 173–181. [Google Scholar] [CrossRef]
- Qin, C.; Jiang, Y.; Luo, Y.; Xian, X.; Liu, H.; Li, Y. Effect of Supercritical Carbon Dioxide Treatment Time, Pressure, and Temperature on Shale Water Wettability. Energy Fuels 2016, 31, 493–503. [Google Scholar] [CrossRef]
- Zhang, K.; Cheng, Y.; Jin, K.; Guo, H.; Liu, Q.; Dong, J.; Li, W. Effects of Supercritical CO2 Fluids on Pore Morphology of Coal: Implications for CO2 Geological Sequestration. Energy Fuels 2017, 31, 4731–4741. [Google Scholar] [CrossRef]
- Yin, H.; Zhou, J.; Jiang, Y.; Xian, X.; Liu, Q. Physical and structural changes in shale associated with supercritical CO 2 exposure. Fuel 2016, 184, 289–303. [Google Scholar] [CrossRef]
- Friesen, W.I.; Mikula, R.J. Fractal Dimensions of Coal Particles. J. Colloid Interface Sci. 1987, 120, 263–271. [Google Scholar] [CrossRef]
- Friesen, W.I.; Mikula, R.J. Mercury Porosimetry of Coals—Pore Volume Distribution and Compressibility. Fuel 1988, 67, 1516–1520. [Google Scholar] [CrossRef]
- Gathitu, B.B.; Chen, W.Y.; McClure, M. Effects of Coal Interaction with Supercritical CO2: Physical Structure. Ind. Eng. Chem. Res. 2009, 48, 5024–5034. [Google Scholar] [CrossRef]
- Ouyang, Z.Q.; Liu, D.M.; Cai, Y.D.; Yao, Y.B. Fractal Analysis on Heterogeneity of Pore-Fractures in Middle-High Rank Coals with NMR. Energy Fuels 2016, 30, 5449–5458. [Google Scholar] [CrossRef]
- Liu, X.; Song, D.; He, X.; Wang, Z.; Zeng, M.; Deng, K. Nanopore structure of deep-burial coals explored by AFM. Fuel 2019, 246, 9–17. [Google Scholar] [CrossRef]
- Liu, S.; Sang, S.; Ma, J.; Wang, T.; Du, Y.; Fang, H. Effects of supercritical CO2 on micropores in bituminous and anthracite coal. Fuel 2019, 242, 96–108. [Google Scholar] [CrossRef]
- Wang, Q.; Ye, J.-B.; Yang, H.-Y.; Liu, Q. Chemical Composition and Structural Characteristics of Oil Shales and Their Kerogens Using Fourier Transform Infrared (FTIR) Spectroscopy and Solid-State 13C Nuclear Magnetic Resonance (NMR). Energy Fuels 2016, 30, 6271–6280. [Google Scholar] [CrossRef]
- Ibarra, J.V.; Moliner, R.; Bonet, A.J. Ft-Ir Investigation on Char Formation during the Early Stages of Coal Pyrolysis. Fuel 1994, 73, 918–924. [Google Scholar] [CrossRef]
- Nie, B.; Liu, X.; Yang, L.; Meng, J.; Li, X. Pore structure characterization of different rank coals using gas adsorption and scanning electron microscopy. Fuel 2015, 158, 908–917. [Google Scholar] [CrossRef]
- Ouyang, Z.; Liu, D.; Cai, Y.; Yao, Y. Investigating the Fractal Characteristics of Pore-Fractures in Bituminous Coals and Anthracites through Fluid Flow Behavior. Energy Fuels 2016, 30, 10348–10357. [Google Scholar] [CrossRef]
- Fu, Y.; Liu, X.; Ge, B.; Liu, Z. Role of chemical structures in coalbed methane adsorption for anthracites and bituminous coals. Adsorption 2017, 23, 711–721. [Google Scholar] [CrossRef]
- Castro-Marcano, F.; Lobodin, V.V.; Rodgers, R.P.; McKenna, A.M.; Marshall, A.G.; Mathews, J.P. A molecular model for Illinois No. 6 Argonne Premium coal: Moving toward capturing the continuum structure. Fuel 2012, 95, 35–49. [Google Scholar] [CrossRef]
- Chamberlain, E.A.C.; Barrass, G.; Thirlaway, J.T. Gases Evolved and Possible Reactions during Low-Temperature Oxidation of Coal. Fuel 1976, 55, 217–223. [Google Scholar] [CrossRef]
- Mazumder, S.; Vanhemert, P.; Bruining, J.; Wolf, K.; Drabe, K. In situ CO2–coal reactions in view of carbon dioxide storage in deep unminable coal seams. Fuel 2006, 85, 1904–1912. [Google Scholar] [CrossRef]
- Kolak, J.J.; Hackley, P.C.; Ruppert, L.F.; Warwick, P.D.; Burruss, R.C. Using Ground and Intact Coal Samples To Evaluate Hydrocarbon Fate during Supercritical CO2 Injection into Coal Beds: Effects of Particle Size and Coal Moisture. Energy Fuels 2015, 29, 5187–5203. [Google Scholar] [CrossRef]
Figure 1.
Map of China showing the locations of the coal mines from which the samples were collected. (A) Map of China; (B) Map of Shanxi province and Chongqing.
Figure 1.
Map of China showing the locations of the coal mines from which the samples were collected. (A) Map of China; (B) Map of Shanxi province and Chongqing.

Figure 2.
Schematic diagram showing the equipment that constitutes the geochemical reactor.

Figure 3.
Variation proportion in each pore size class after ScCO2 treatment. (a) NC; (b) JC; (c) DT. Nanchuan coal mine in Chongqing (NC), Jincheng coal mine (JC), Datong coal mine (DT).
Figure 3.
Variation proportion in each pore size class after ScCO2 treatment. (a) NC; (b) JC; (c) DT. Nanchuan coal mine in Chongqing (NC), Jincheng coal mine (JC), Datong coal mine (DT).

Figure 4.
(a) Mercury injection curve from mercury intrusion porosimetry (MIP) tests on the coal samples; (b–d) ln(V) vs. ln(P-Pt) for fractal dimensions D1 (b); D2 (c); and D3 (d).
Figure 4.
(a) Mercury injection curve from mercury intrusion porosimetry (MIP) tests on the coal samples; (b–d) ln(V) vs. ln(P-Pt) for fractal dimensions D1 (b); D2 (c); and D3 (d).

Figure 5.
Variation trends of coal sample fractal dimensions (D1, D2, D3) of three coal samples at different temperatures. (a) NC; (b) JC; (c) DT.
Figure 5.
Variation trends of coal sample fractal dimensions (D1, D2, D3) of three coal samples at different temperatures. (a) NC; (b) JC; (c) DT.

Figure 6.
ATR-FTIR spectra of coal samples treated with ScCO2. (a) NC; (b) JC; (c) DT.

Figure 7.
Curves fit to the ATR-FTIR spectrum from NC coal after ScCO2 treated at 40 °C and 8 MPa.

Figure 8.
Graphs of IR indexes of the coal samples. (a–c), I and DOC; (d–f), percentage of different aliphatic hydrocarbon groups and change in L. See text for a description of the IR indexes.
Figure 8.
Graphs of IR indexes of the coal samples. (a–c), I and DOC; (d–f), percentage of different aliphatic hydrocarbon groups and change in L. See text for a description of the IR indexes.


Table 1.
Properties of the coal samples.
| Sample | Sampling Location | Proximate Analysis (wt %) | Ro (%) | Coal Rank | |||
|---|---|---|---|---|---|---|---|
| Mad | Aad | Vdaf | FCad | ||||
| NC | Nanchuan, Chongqing | 0.89 | 8.27 | 30.14 | 60.70 | 1.105 | Bituminous Coal B |
| JC | Jincheng, Shanxi | 0.98 | 5.53 | 31.26 | 62.23 | 1.051 | Bituminous Coal B |
| DT | Datong, Shanxi | 2.41 | 9.46 | 36.22 | 51.91 | 0.683 | Bituminous Coal C |
Note: Mad, moisture; Aad, ash; Vdaf, volatile matter; FCad, fixed carbon. daf = dry ash free. Nanchuan coal mine in Chongqing (NC), Jincheng coal mine (JC), Datong coal mine (DT).
Table 2.
Experimental conditions.
| Sample | Treated Time (h) | Temperature (°C) | Pressure (MPa) |
|---|---|---|---|
| NC/JC/DT | - | - | - |
| 96 | 40 | 8 | |
| 96 | 50 | 8 | |
| 96 | 60 | 8 | |
| 96 | 70 | 8 | |
| 96 | 80 | 8 |
Table 3.
Infrared indexes from ATR-FTIR spectra used to investigate the structure of hydrocarbons in the coal [44].
Table 3.
Infrared indexes from ATR-FTIR spectra used to investigate the structure of hydrocarbons in the coal [44].
| IR Index | Band Region (cm−1) | Index Meaning |
|---|---|---|
| L | A2925/A2950 | Aliphatic chain length/Degree of branch chain |
| I | A700-900/A2800-3000 | Aromaticity |
| DOC | A700-900/A1600 | Degree of condensation (DOC) of aromatic rings |
© 2019 by the authors. Licensee MDPI, Basel, Switzerland. This article is an open access article distributed under the terms and conditions of the Creative Commons Attribution (CC BY) license (http://creativecommons.org/licenses/by/4.0/).
Share and Cite
MDPI and ACS Style
Ge, Z.; Zeng, M.; Cheng, Y.; Wang, H.; Liu, X. Effects of Supercritical CO2 Treatment Temperature on Functional Groups and Pore Structure of Coals. Sustainability 2019, 11, 7180. https://doi.org/10.3390/su11247180
AMA Style
Ge Z, Zeng M, Cheng Y, Wang H, Liu X. Effects of Supercritical CO2 Treatment Temperature on Functional Groups and Pore Structure of Coals. Sustainability. 2019; 11(24):7180. https://doi.org/10.3390/su11247180
Chicago/Turabian StyleGe, Zhaolong, Mengru Zeng, Yugang Cheng, Haoming Wang, and Xianfeng Liu. 2019. "Effects of Supercritical CO2 Treatment Temperature on Functional Groups and Pore Structure of Coals" Sustainability 11, no. 24: 7180. https://doi.org/10.3390/su11247180
Note that from the first issue of 2016, this journal uses article numbers instead of page numbers. See further details here.