Article

Developing Harvest Strategies to Achieve Ecological, Economic and Social Sustainability in Multi-Sector Fisheries

1
CSIRO Oceans and Atmosphere, Queensland Biosciences Precinct, 306 Carmody Rd, St Lucia, Brisbane 4067, Australia
2
CSIRO Oceans and Atmosphere, Hobart, Tasmania 7000, Australia
3
Cathy Dichmont Consulting (CDC), Bribie Island 4507, Australia
4
The College of Science and Engineering, James Cook University, Douglas QLD 4814, Queensland, Australia
5
Fisheries Queensland, Department of Agriculture and Fisheries, GPO Box 46, Brisbane 4001, Australia
6
Great Barrier Reef Marine Park Authority, PO Box 1379, Townsville, Queensland 4810, Australia
7
Agri-Science Queensland, Department of Agriculture and Fisheries, GPO Box 46, Brisbane 4001, Australia
*
Author to whom correspondence should be addressed.
Sustainability 2019, 11(3), 644; https://doi.org/10.3390/su11030644
Submission received: 14 December 2018 / Revised: 22 January 2019 / Accepted: 23 January 2019 / Published: 26 January 2019
(This article belongs to the Special Issue Seafood Sustainability - Series I)

Abstract

:
Ecosystem based fisheries management (EBFM) provides a framework to achieve ecological, economic and social sustainability in fisheries. However, developing harvest strategies to achieve these multiple objectives is complex. This is even more so in multi-sector multi-species fisheries. In our study, we develop such harvest strategies for the multi-species Coral Reef Fin Fish Fishery (CRFFF) operating in the waters of Australia’s Great Barrier Reef. The fishery includes recreational, charter and commercial sectors, and is a provider of regional employment and supplier of seafood to both local and export markets. We convened a series of stakeholder workshops and conducted surveys to identify stakeholder objectives and priorities, as well as potential harvest strategy frameworks for the fishery. These potential harvest strategies were assessed against the objectives using a further qualitative impact survey. The analysis identified which frameworks were preferred by different stakeholder groups and why, taking into account the different objective priorities and tradeoffs in outcomes. The new feature of the work was to qualitatively determine which harvest strategies are perceived to best address triple bottom line objectives. The approach is therefore potentially applicable in other complex fisheries developing harvest strategies which, by design, strive to achieve ecological, economic and social sustainability.

1. Introduction

Ecosystem based fisheries management (EBFM) has been adopted in a wide range of jurisdictions to guide management in achieving the sustainable use of the marine resources [1]. In practice, EBFM has largely been reduced to three main dimensions—ecological, human, and governance—where ecological criteria focus on one or more aspects of ecosystem complexity; human dimension criteria integrate social and economic factors and involve stakeholders in the ecosystem planning processes; and governance criteria include a range of administrative structures (e.g., co-management) and processes to ensure the desirable outcomes are achieved [2]. The success of EBFM to date, however, has been limited due to three key impediments: a relative lack of explicit social, economic and institutional objectives; a general lack of process (frameworks, governance) for routine integration of all dimensions of sustainability; and a historical emphasis on biological considerations, especially those related to fished stocks [3]. Definitive research on appropriate ways to select and assess social objectives for fisheries is relatively recent [4]. What tends to be lacking is the inclusion of all three dimensions directly within harvest strategies.
The recent Queensland Sustainable Fisheries Strategy [5] aims to move the state’s fisheries towards a more ecologically, economically and socially sustainable future. As part of this process, a number of Fisheries Working Groups have been established to identify fishery objectives and harvest strategies aimed at moving the fisheries forward. These Working Groups include a wide range of stakeholders, including all fisher sectors (commercial, charter and recreational); processors and buyers; scientists, fishery managers, marine park managers and conservation groups.
The aim of this paper is to outline the process undertaken to develop a harvest strategy for a complex multi-sector fishery to achieve ecological, economic and social sustainability objectives. The Coral Reef Fin Fish Fishery (CRFFF) is one of Queensland’s most valuable in terms of export earnings, and has important recreational, commercial and charter sectors [6].
Consistent with the principles of EBFM, the process developed in this paper involved first identifying and prioritizing the objectives for the fishery with the key stakeholders. Given these objectives, modifications to the current harvest strategy were then developed that potentially considered these broader objectives. The effectiveness of these additions at improving performance was examined through a qualitative impact assessment against the objectives. The overall subjective probabilities that the options would improve the fishery’s outcomes were determined.
The process provides a roadmap for future harvest strategy development to achieve ecological, economic and social objectives. The paper is organized as follows. First, an outline of the fishery is presented in order to set the context of the analysis. Second, the methods used to elicit objectives and objective weights, develop the harvest strategies and qualitatively determine the impact of the alternative harvest strategy options are described. Next, the fishery specific outcomes are presented. Finally, implications for future development of harvest strategies to achieve ecological, economic and social outcomes are discussed.

2. The Coral Reef Fin Fish Fishery (CRFFF)

Queensland’s CRFFF targets primarily demersal reef-associated fish and operates predominantly in the Great Barrier Reef Marine Park, which includes no-take areas for biodiversity protection that restrict where this fishery can operate while providing some benefits to populations of fished species [7,8]. The Great Barrier Reef Marine Park stretches approximately 2300 km along the coast of Queensland from the northern tip of north-eastern Australia. It covers 344,400 km2 of the world’s largest coral reef ecosystem, and includes some 3000 coral reefs, 600 continental islands, 300 coral cays and about 150 inshore mangrove islands. The fishery is managed by Fisheries Queensland (the state’s fisheries management agency) under the Fisheries Act 1994 (QLD) and Fisheries Regulation 2008, and includes both input (including maximum vessel size, gear restrictions, area and seasonal closures) and output (Total Allowable Commercial Catch (TACC) limitations, individual transferable quotas (ITQs) size and possession limits) controls. Further details on management arrangements in the fishery can be found in Thébaud, et al. [9].
The fishery is multi-species in nature and the key commercial species groups include coral trout and red throat emperor, and a range of cods, groupers, emperors, tropical snappers, sea perches, and wrasses [10]. The market for landings can be divided into two main components: a high-value export market which developed in the mid-1990s and consists predominantly of live coral trout for the Asian food fish trade, and a domestic market which consumes mainly dead fish (both fresh and frozen) and is more multi-species. In the 2016–17 financial year, the gross value product of the commercial fishery was AUD 31.1 m, with each active vessel landing fish valued at around AUD 125,000 on average per annum [11].
In the commercial fishery, fishers use lines and operate from small tender vessels powered by an outboard motor. The tenders also use a main vessel as a “mother ship” for storage of the catch (as well as occasionally operating as a fishing platform). The use of multiple tenders enables the fishers to cover more area of the reef on any trip and access areas too shallow to fish from the primary vessel. A number of the vessels may also participate in other fisheries, e.g., using gillnets (for inshore fish species), trolls (for mackerel) and pots (for crabs).
Output controls in the form of TACCs and ITQs were introduced into the fishery in 2004. Commercial license holders were allocated reef quota (RQ) shares based on historical catch records associated with their license. There are three types of RQ quota: coral trout (CT), red throat emperor (RTE), and other species (OS), the latter being a collective of approximately 154 other reef fish species of which only a relatively small proportion are actively targeted by the commercial fishery. CT quota covers seven separate species of coral trout but the majority of the landings, and almost all exports, consist of the common coral trout (Plectropomus leopardus). All quota is fully tradable, in both permanent and temporary (lease) trades. Leased quota automatically reverts back to the owner at the end of each year.
The fishery also has a substantial recreational component. Recreational fishing is an important social and economic activity in the region [12], with some studies estimating that recreational fishing has nearly the same economic contribution to the Great Barrier Reef region as commercial fishing [13]. The recreational sector is predominantly based on private vessels on day trips, mostly fishing closer inshore than the commercial or charter sectors [14]. However, given the common species targeted, the two fisheries are biologically entwined. Recreational fishers are managed through size and possession limits (a maximum of two of each species, with a combined possession limit of 20 in total of all coral reef fin fish).
Associated with the recreational sector is a commercial charter sector. Since 2006, licensed charter fishing operators in the area of the fishery have been required to pay an annual management fee and report catches in logbooks. The vessels are also subject to trip limits based on the number of recreational fishers onboard and the length of the trip; i.e., the number of recreational fishers multiplied by the individual fisher’s recreational possession limits [15]. Extended limits apply for continuous trips between 72 h and 160 h where double the possession limit applies; trips over 160 h allow three times the possession limit.
As with most fisheries, stocks in the CRFFF are affected by environmental fluctuations. Being in a tropical environment, cyclones are regular occurrences which can damage the key habitats in parts of the fishery and have also affected catchability with flow on effects to fishery operations [16]. In more recent years, coral bleaching events related to climate change have been more frequent, also adversely affecting the species’ habitats and their ability to support the species [17,18].

3. Materials and Methods

3.1. Identification of Management Objectives

Considerable work has previously been undertaken examining management objectives in fisheries. Previous studies of fisheries management objectives (and natural resource management objectives in general) have generally identified a hierarchy of objectives, with higher level objectives being the typical triple bottom line categories of ecological, economic and social objectives, and lower level objectives being more detailed or specific objectives for the fishery in question [19,20,21,22,23,24]. A similar approach was adopted for this study, although a fourth higher level objective—enhancing management performance—was also included as this had been previously considered important by both managers and fishers [25]. Consideration of institutional objectives is also considered best practice in developing good management [3].
An initial review of objectives that had previously been applied in Australian fisheries was undertaken, and a total of 75 different potential objectives were identified. A series of workshops were held with members of the CRFFF Working Group to identify the triple bottom line objectives that were of most relevance to the fishery. The group formally includes 12 industry members (four commercial fishers, two recreational fishers, one charter operator, one export/marketing representative, one scientific member, one compliance (boating patrol) member, one Great Barrier Reef Marine Park Authority (GBRMPA) representative and one conservation non-governmental organization (NGO) representative) supported by 2–3 managers (see [26] for more information on the CRFFF Working Group). However, with not all members being available at all times, and substitutes provided, some 20 different individuals were involved in the discussions.
In the first of these meetings, stakeholders were assisted by providing the list of these 75 identified objectives, as well as some example objectives identified in an earlier Queensland study [25] and the concepts around the development of an objective hierarchy. Working Group members broke into smaller groups to identify which of these earlier objectives may be applicable to their fishery, which needed modification, and which new objectives specific to their fishery were required. A revised potential set of objectives was then compiled based on the outcomes from the group discussions.
Between meetings, the project team translated each of these potential conceptual objectives into operational objectives. To be considered operational, they needed to be realistic, be simulation-achievable (i.e., testable through management strategy evaluation), and have performance indicators against which each objective could be assessed.
A revised set of potential objectives was presented at the subsequent Working Group meeting, and the final set of 22 operation objectives for the fishery was identified through further discussion with the Working Group.

3.2. Objective Weighting Approaches

Different harvest strategies are likely to have different impacts against the different objectives. Additionally, individuals will assign different preferences to the objectives. To assess the overall suitability of the harvest strategy, the objectives need to be weighted according to stakeholder preferences, so that the different strategies can be compared on an effective performance basis. A range of methods has been applied in the literature to assess objective weights, each with advantages and disadvantages [27,28,29,30,31,32]. Comparative studies of these methods suggest in some cases that the objective weights may vary considerably between methods [33], although others have found higher correlations between the results of the different methods [34].
For this study, we applied a modified version of the analytic hierarchy process (AHP) [35] through an online survey of fishery stakeholders to elicit weights. AHP has been used in a number of marine and coastal applications to determine management sub-component importance and assist in decision making [19,20,23,25,36,37,38,39,40], and is the most common approach used for preference elicitation in applied natural resource case studies. Traditional AHP is based upon the construction of a series of pair-wise comparison matrices which compare sub-components to one another, and a hierarchical structure that groups similar sub-components into subgroups, and builds the hierarchy with progressive layers of groupings. The pair-wise comparison used in the traditional AHP method makes the process of assigning weights much easier for participants because only two sub-components are being compared at a time.
A challenge facing the use of traditional AHP is the propensity for respondents to be unintentionally inconsistent in their responses. Preference weightings are highly subjective, and inconsistency between responses to different combinations of comparisons is a common problem facing AHP, particularly when decision makers are confronted with many sets of comparisons [41]. Respondents do not necessarily cross check their responses, and even if they do, ensuring a perfectly consistent set of responses when many sub-components are compared is difficult. The discrete nature of the 1–9 scale in the traditional AHP approach can also contribute to inconsistency, as a perfectly consistent response may require a fractional preference score. Inconsistency can also arise through errors in entering judgments, lack of concentration and inappropriate use of extremes [40].
In natural resource management particularly, management agencies are turning to online surveys to understand the priorities of a wide range of stakeholders, better support policy development and management decision making, with many of these surveys using AHP approaches (e.g., [42,43,44,45,46,47]). The use of online surveys to elicit preferences is not unique to natural resource management, with a range of other AHP studies implemented through online surveys (e.g., [48,49]). A key advantage of the use of online surveys is that they allow access by relevant stakeholders who may be geographically dispersed, even if not large in absolute numbers (for example, see Thadsin, et al. [50]).
The lack of direct interaction with the respondents creates additional challenges for deriving priorities through approaches such as AHP. Direct interaction with the individual respondents is generally not feasible, and in many cases responses are anonymous. At the same time, levels of inconsistency tend to be high in online surveys. For example, Hummel, et al. [51] found that when their survey was conducted online, only 26% of respondents satisfied a relaxed threshold consistency ratio of 0.3 (compared to the standard threshold of 0.1); Sara, et al. [52] found 67% of respondents satisfied a relaxed threshold consistency ratio of 0.2; Marre, et al. [47] found 64% of the general public and 72% of resource managers provided consistent responses, while Tozer and Stokes [53] found only 25% or respondents satisfied the standard threshold consistency ratio. Most previous online-based AHP studies have tended to exclude responses that have a high level of inconsistency, resulting in a substantially reduced, and potentially unrepresentative, sample size (e.g., [47,51,52,53]).
In this study, we avoid some of these pitfalls by modifying the way in which the data are collected and analyzed, taking into account the symmetry assumption underlying AHP. In our survey, respondents were presented with a nine-point importance scale against which they could assess the importance of each objective. A nine-point scale was selected (rather than an “out of 10”) as it allows five categories to be defined with mid-points between them, and is also consistent with the traditional AHP approach. An example of one of the questions is presented in Figure 1. The complete questionnaire is provided in the Supplementary Material.
In the approach used in this study, a separate value is derived for each objective (e.g., a i = 1 to 9) given the importance level identified in Figure 1, and the relative score between any two objectives, α i,j, is derived from the difference between them. This can be estimated by
a i , j = { a i a j + 1    i f a i a j > 0 1 a i a j 1    i f a i a j 0   and   a j , i = 1 a i , j
Preferences are assumed to be symmetrical, such that if the relative importance of Objective 1 compared with Objective 2 has a value of α12 = 9, then α21 = 1/α12 = 1/9. For each set of comparisons, a comparison matrix of scores (A) can be developed, given by:
A = [ 1 a 12 a 1 n a 21 1 a 2 n a n 1 a n 2 1 ]
Given the derived matrix of relative objective importance, t(A) here are two general approaches used for determining the weights: the original eigenvalue method (EM) developed by Saaty [35] and the geometric mean method (GMM) developed by Crawford and Williams [54] (alternative approaches have also been used to derive the weights, with the row geometric method [54] gaining increasing interest [55]). While the former approach has been employed in a wider range of coastal and resource management studies, the latter has been found to be less susceptible to the influence of extreme preferences, as well as having better performance around other aspects of theoretical consistency (e.g., less susceptible to rank reversibility if the preference set changes, and greater transitivity properties) [55].
The objective weights (ωi) using the GMM are determined by:
ω i = ( j = 1 n a i , j ) 1 / n i ( j = 1 n a i , j ) 1 / n
where j = 1 n a i , j = a i , 1 × a i , 2 × × a i , n (i.e., the product of the elements of row i), and n is the total number of objectives being compared.
The analysis is undertaken within each level of aggregation in the hierarchy. That is, level one objectives are first compared with each other (e.g., the broad ecological, economic, management and social objectives) to estimate the broad category weight (e.g., ω1, ω2, ω3, ω4). Then, level two objectives within each of the broader objectives (i.e., the sub-objectives within a given level one objective) are compared to produce their relative weights within the broader objective (e.g., ω1.1, ω1.2, …, ω1.n, then ω2.1, ω2.2, …, ω2.n, etc.). Finally, the level three objectives within each of the level two objectives are compared to produce their relative weights (e.g., ω1.1.1, ω1.1.2, …, ω1.1.n). The overall weight of an individual operational is determined by the product of its initial weight estimate (i.e., when compared with other sub-components in that same group) multiplied by the weight of the higher order aggregation (i.e., compared with other higher order aggregations) under the principle of hierarchic composition [56]. For example, the final overall weight for objective 1.1.1 is given by ω1.1.1 * ω1.1 * ω1. This reduces the number of necessary direct comparisons, as only sub-components at the same level and within the same broader sub-component need to be compared.
An advantage of this approach over the traditional pair-wise comparison is that the respondent is able to compare all objectives within the comparison set at the same time, avoiding issues around inconsistency (which does not need to be calculated as a result). That is, the respondent will immediately be able to see how each objective compares with the others in the comparison set when making their response.
The online survey was developed in Survey Monkey. The survey was distributed to stakeholders in the fishery with the assistance of Fisheries Queensland (the management agency) and the members of the Working Group.

3.3. Identification of Potential Harvest Strategies

A range of potential harvest strategies were developed in collaboration with the CRFFF Working Group through a series of workshops. Initially, information was fed back to the Working Group about the outcomes of the objectives surveys to help identify key areas that required further consideration. The Working Group first established a “modified status quo” option (the “baseline”) which was considered the minimum amount of change required to meet the ecological sustainability objectives of the new Queensland Sustainable Fisheries Strategy [5]. A number of other alternatives were identified that were believed to enhance at least one or more of the broader objectives of the fishery.
The proposed harvest strategies are briefly described below to place subsequent sections of the paper in context. A more detailed description of the proposed harvest strategies is included in the Supplementary Material.
The key proposed modification underlying the “modified status quo” harvest strategy was the adoption of a target reference point for the stocks of 60% of the unexploited biomass, which is consistent with the Queensland Sustainable Fisheries Strategy [5]. This reference point was taken as a proxy for the biomass at maximum economic yield and to provide biological resilience to the stock. Harvest control rules were developed to adjust the fishery-level total allowable catch (TAC) each year, where these changes are then proportionally applied to both the commercial catch limit (TACC) and the recreational catch limits to maintain relative equity between the sectors. For coral trout species, the combined TAC is based on a stock assessment every 5 years and a suite of other indicators in the intermediate years. For red throat emperor, the changes are proposed to be based on a risk assessment undertaken at least every 5 years, with empirical indicators used to adjust the quota and possession limits in the intermediate years. Similarly, for the other species (OS) component, the combined TAC would be retained, with both commercial and recreational catches proportionally adjusted in response to changes in the level of catch and catch composition. Within this cap, species considered “at risk” would potentially be subject to separate commercial caps and recreational trip limits.
Alternative harvest strategies identified by the Working Group were believed to further enhance one or more ecological, economic or social objectives. These included (i) a separate allocation of the TAC to the charter sector (managed through vessel-level possession limits, as opposed to being based on the number of recreational fishers they carried), aimed at enhancing the economic performance of this sector and social benefits accruing to the recreational fishers using these vessels; (ii) the use of environmental “overrides” where TACs are adjusted in response to a spatially or temporally isolated weather event (e.g., a tropical cyclone) to enhance ecological outcomes and long term fishery performance; (iii) the combination of environmental overrides and spatially explicit management, where responses to the catastrophic event may vary in different areas of the fishery and also to ensure some form of spatial equity across regional communities; (iv) formally identifying separate TACs for a number of key OS quota species with ITQs and possession limits also allocated for these species; and, (v) formally identifying separate TACs for a number of key coral trout species, again with separate ITQs and possession limits for each of these species for largely ecological benefits.
It was recognized that these different alternative options would have greater benefits than the modified status quo against some objectives but potentially reduce benefits against others. A subsequent further analysis was hence undertaken to qualitatively assess the relative benefits of these alternative harvest strategy proposals.

3.4. Performance of Each Harvest Strategy against the Objectives

The assessment of the performance of the alternative harvest strategies against each of the objectives followed a similar approach as that outlined in [57] and Dichmont, et al. [43]. However, where in those approaches several distinct harvest strategies were scored, in this paper additional components to the “modified status quo” were assessed. A second online survey was developed in Survey Monkey aimed at eliciting “expert” opinion as to the effects of the management options on the objective outcomes. The main target of the second survey was members of the CRFFF Working Group who had taken part in developing the set of management objectives and harvest strategies, and most likely had expectations about how they would perform. Given the small number involved in this group, the survey was also administered to those individuals from the first survey who had agreed to participate in a follow-on survey (other than the working group members).
The respondents of the second survey were asked to rate each potential harvest strategy relative to the baseline (i.e., the modified status quo) against each objective on a scale ranging from of “Much worse than the baseline” to “Much better than the baseline”. An example of one such comparison applied in the survey is given in Figure 2. The complete questionnaire is provided in the Supplementary Material.
The resultant choices were converted to a 7-point scale, ranging from −3 (“Much worse than the baseline”) to +3 (“Much better than the baseline”), with “About the same as the baseline” having a value of 0. The final output of this process is an (i * j) impact matrix, Is, for each strategy s, where i is the number of objectives and j is the total number of respondents of the second survey.
The relative weights for each respondent for each objective derived from the objective survey were combined into a single (r * i) relative weight matrix, Wt by stakeholder group, t, where r is the number of respondents to the objective survey and i is the number of objectives considered. The overall results were derived by the product of these two matrices, W’I for each stakeholder group and harvest strategy, producing (r*j) observations, providing a score representing how well the harvest strategy performs against the baseline given the objective preference of each respondent r and the expectations about how the strategy performs against these objectives from each respondent j. A positive score indicates that the strategy is better than the present system, while a negative score indicates that the strategy is worse. In this regard, the resultant scores are similar in principle to utility measures, and the process for assessing the subjective probabilities or an outcome similar to those used in multi-attribute utility theory [58].
From the relative frequencies of these scores, we are able to derive a subjective probability distribution [59] of the expected benefits of each harvest strategy that takes into account heterogeneity in both the impact scores and also the objective preference weightings. The probability distributions are subjective rather than objective as they are based on distributions of opinion and expert judgement rather than actual real-world outcomes.

3.5. Ethical Clearance

The surveys and workshops were approved by CSIRO’s (Commonwealth Scientific and Industrial Research Organisation) Social Science Human Research Ethics Committee (Project 113/17) in accordance with the Australian National Statement on Ethical Conduct in Human Research. As the surveys were sequential, each was submitted separately for review and clearance before being implemented.

4. Results

4.1. Identification and Weighting of Objectives

A total of 22 operational objectives were agreed by the Working Group (Table 1). These were arranged into a three-level hierarchy, with the top level consisting of ecological sustainability, economic, governance (management) and social objectives.
A number of other objectives (mostly governance and social objectives) were also considered important by the Working Group, but it was recognized that these could not be influenced by a harvest strategy, and were not subsequently considered in the further analysis as they would not be affected by the scoring system. For example, one such management objective—transparent decision making—is a function of the governance structure rather than a feature of any particular harvest strategy. It was noted that these additional objectives would need to be considered when developing broader management structures.

4.1.1. Objective Weighting Survey Responses

The objective weighting survey received a total of 110 responses, of which around half were from commercial fishers (Figure 3). Most respondents identified as one of two different stakeholder groups, with the biggest overlap being between the commercial fishers and quota holders. Only three responses were received from conservation groups, so these were incorporated into the “other” category, which also contains commercial and recreational fisheries association representatives (but who were not active fishers in the CRFFF), and quota brokers.

4.1.2. Objective Importance

The distributions of the derived higher-level objective groups (Ecological Sustainability, Economic, Management, and Social) by stakeholder group are shown in Figure 4. All groups tended to rank the ecological sustainability objectives the highest. The commercially oriented groups (commercial fishers, quota owners and buyers) also generally rated economic objectives similar to the ecological sustainability objectives, whereas the other groups tended to rate economic objectives lower than ecological sustainability. Charter operators were closer to recreational than commercial weightings. Most groups tended to rate the social objectives the lowest, consistent with most other previous management objective studies in Australia [24,60].
The full set of average objective weightings are given in Table 2. The weightings on the lower level objectives appear fairly similar across the different stakeholder groups. This is an artefact of the “dilution” effect of distributing the higher-level objective weights over many sub-objectives. The cumulative effect of these small differences at the lower level, however, may result in overall different preferences for different harvest strategies at the stakeholder level.

4.2. Performance of Harvest Strategies against the Objectives

A second questionnaire to assess each of the potential harvest strategies (described in Section 3.3 and detailed in the Supplementary Material) against each of the objectives was developed and sent to a smaller group of stakeholders. As the aim of the second survey was to elicit expert opinion as to how each of the potential harvest strategies might perform against the different fisheries objectives, the main target was the Working Group members, who were familiar with both the proposed harvest strategies and the objectives. However, as this group was relatively small (12 stakeholder members plus 2–3 managers), additional responses were elicited from other stakeholders with a prior involvement with the project. From the first survey of management objective importance, 48 respondents expressed a willingness to participate in a follow up survey (including working group members), and this broader group was approached.
Working Group members were notified in advance about the second survey and agreed to a short turnaround time. The survey was administered during a fishery closure, during which time all commercial fishers were onshore. The survey was only open for one week (the last week of the closure), during which 28 responses were received. From these, a total of 18 useable responses were received, with the other 10 respondents only providing details of their involvement with the fishery and no assessments of the harvest strategy options. Four respondents answered most, but not all of the harvest strategy related questions. These were included in the set of usable responses, with the average response of the rest of the group used to replace the missing values in the subsequent analyses. Two-thirds (12) of the usable responses were from Working Group members, with the remainder from individuals not involved in determining the harvest strategies. The distribution of the responses by stakeholder group is shown in Figure 5.

4.2.1. Harvest Strategy Impacts

The expected (perceived) impact of each harvest strategy option against the objectives is shown in Figure 6. The charter sector allocation option is generally expected to provide benefits against nearly all objectives, with the possible exception of two objectives: discard mortality (Ecol1.2.2) (possibly due to a perception of some respondents that the quota will encourage high-grading and discarding as in commercial fisheries, although the current recreational trip limits are also essentially a quota) and costs of management (Econ2.5) (possibly due to a perception of higher monitoring, surveillance and control costs). The addition of environmental overrides is generally considered to have ecological sustainability benefits, but potentially negative consequences for the economic objectives. Social outcomes are expected to be mixed, with improvement against some objectives (e.g., Social4.2.1 and Social4.2.3, both relating to improved social perceptions) and losses in other areas (Social4.3.1—access to local seafood). The addition of spatially explicit control rules and environmental overrides is expected to produce a similar pattern with respect to ecological and economic outcomes as the previous option, although the magnitude and uncertainty around some of these impacts is greater (e.g., Ecol1.1.2, Ecol1.2.1, Ecol1.2.3, Econ2.2).
Separating out some of the OS species and applying TACs to these is expected to potentially have more substantial ecological benefits, with a mixed result in terms of economic objectives. With a large number of species included in the OS quota, separating out key species is likely to improve their ecological sustainability. In contrast, separating out the coral trout species into separate TACs is expected to have little or no ecological benefit (as there are only a small number of species covered by this quota), but would entail economic costs.
Willingness to comply with management regulations (Manage3) is also likely to vary with the different potential harvest strategies. With the exception of the separate charter allocation, and to a lesser extent the OS species quotas, willingness to comply is expected to decrease, with the greatest decreases being expected with the two environmental override options. These options potentially impose additional restrictions on the fishery (in response to environmental events), and hence may attract additional opposition by fishers.

4.2.2. Overall Performance Measures of Each of the Harvest Strategies

The derived impact matrix was multiplied by the matrix of objective weights (i.e., W’I) to produce a matrix of potential weighted scores for each of the harvest strategy options, with each score ranging from −3 to 3. The distributions of these scores are illustrated in Figure 7. For each of the 18 expert assessments of the impact of the strategy on the objectives, there are 110 weighted scores reflecting heterogeneity in the importance of these objectives; or for each of the 110 individuals providing the objective importance weights, there are 18 different weighted scores associated with each strategy representing the uncertainty in the effects of the strategy on the objectives. In total, 1980 subjectively weighted scores are estimated for each harvest strategy reflecting both heterogeneity in the stakeholder groups and uncertainty in the expert assessments. All experts and stakeholders are assumed to have equal weight.
The derived cumulative subjective probabilities in Figure 7 represent the likelihood that a harvest strategy alternative would perform better than the baseline harvest strategy alone. From these, it can be seen that no single alternative management option was considered an improvement in all cases, with both positive and negative outcomes expected given the variability in expected impact and objective weightings. The cumulative subjective probability associated with the point at which the score equals zero provides a measure of the relative likelihood of a positive or negative outcome. For example, based on the relative frequency of each score in the outcome set [59], the addition of a separate allocation to the charter sector is expected to have a 60% chance of a positive outcome and a 40% chance of a zero or negative outcome.
The results were also considered by stakeholder group to determine if there were substantial differences of opinion in terms of the relative merit of particular harvest strategy additions. The use of mean scores has been found to provide a more reliable indicator than individual scores in other studies where expert opinion has been elicited [61]. Given the common set of expert assessments of the impacts of each harvest strategy on the different objectives, differences between groups reflects the differences in the importance given to these objectives.
The average score for the charter allocation option was small but positive for all of the stakeholder groups (Table 3). Similarly, the average score for the split OS quota was also positive across all of the stakeholder groups. This suggests that, on average, these options would be beneficial from the perspective of all groups. In contrast, the split CT quota was negative for all groups, suggesting it is not a desirable option.
The scores for environmental overrides were generally negative on average for the commercial and recreational sectors, but positive for the manager, scientist and other stakeholder groups (Table 3). Adding spatially explicit control rules improved the average score for all of the stakeholder groups, although the overall average was still marginally negative for quota holders and commercial fishers.
An alternative to considering the average score is to consider the proportion of outcomes with a negative score (Table 4). Generally, the charter allocation and split OS quota produced negative outcomes on fewer than 35% of cases, whereas the split CT option resulted in negative scores more than 57% of cases.

5. Discussion and Conclusions

The aim of the study was to identify the impact of different harvest strategies for the CRFFF in achieving ecological, economic and social objectives, as identified by the various stakeholder groups. A fourth objective was also considered, namely, the implications of the management option for fishery governance, following the proposal by Stephenson, et al. [3]. The process was undertaken with considerable stakeholder engagement, with the CRFFF Working Group developing the operational fishery objectives and also the baseline and potential alternative harvest strategies.
While the Working Group agreed on a set of objectives that the harvest strategy should address, not surprisingly the importance weight given to these objectives varied between stakeholder groups. All groups tended to rank the ecological sustainability objectives the highest. The relative weight of the economic objectives varied between stakeholder groups, with the commercially oriented groups (fishers, quota owners and buyers) generally weighting economic objectives similar to the ecological sustainability objectives, while the other groups tended to weight the economics objectives much lower. Social objectives were generally given a low weight by all stakeholder groups, with the exception of recreational fishers and the “other” group, which consisted predominantly of conservation group and industry association representatives.
These different objective weightings had an impact on how the different harvest strategy options were potentially perceived by the different stakeholder groups. For example, the use of environmental overrides was considered to result in benefits in terms of expected ecological outcomes but at a higher economic cost. For the commercially oriented groups with similar economic and ecological sustainability objective weights, these effects largely cancelled out, resulting in a slight negative expected benefit. For the other groups with the lower economic weighting, these options were seen to result in a positive outcome.
The apparent trade-offs between ecological and economic outcomes also reflects a tendency for most respondents to discount future economic and ecological impacts (both positive and negative) differently. For example, harvest strategies that performed well against the objective of achieving MEY-level stocks should also result in longer term economic benefits. However, the impacts estimated by the stakeholders were much more short term in respect to economic outcomes than ecological outcomes. This may reflect the state of economic resilience in the fishery, where a reduction in economic performance due to higher operating costs involved in achieving higher ecological performance may result in greater short-term economic stress. To some extent this is also reflected in the relative weighting by the groups, with those sectors with a financial stake in the industry placing greater importance on economic outcomes, potentially not so much to only improve economic performance, but to also ensure it does not deteriorate.
While we did not test every combination, the analyses demonstrate how triple bottom line outcomes can be affected by relatively small changes in the harvest strategy and through combining approaches targeted at particular aspects. For example, the addition of spatial consideration to the environmental override option was introduced to improve both ecological outcomes and social outcomes, with spatial management allowing inter-regional equity considerations to be addressed. Although social objectives had a low weighting for many groups, the additional social benefits from the introduction of spatial considerations were sufficient to change the sign on the average net score from negative to positive for some groups, and reduce the magnitude of the negative sign in the others.
The outcomes from the process are not necessarily an endpoint in terms of determining an optimal harvest strategy, since managers will need to consider these findings in light of the agreed strategic direction, their legislative mandate and feasibility. The perceived relative benefits of alternative harvest strategy options were opinion-based: harvest strategy evaluation against triple bottom line objectives, acknowledging alternative sector weightings, can also be undertaken quantitatively using simulation modelling. While acceptability to all groups may not be required given the constraints under which managers must operate and also the diversity of views across and within stakeholder groups, the process identified which areas of a potential option may need further consideration to be more acceptable to a greater proportion of stakeholders. For example, reducing the costs (or the perception of costs) associated with the environmental overrides and spatial management options would result in benefits being realized by all groups. Similarly, further investigation as to why separate OS quota was seen as desirable, while separate CT quota was not, may lead to improvements in the management of both sets of species. As a consequence, these results provide valuable insights which can inform the subsequent consultation to refine the harvest strategies. While considered separately, the options are not mutually exclusive. For example, a charter sector allocation could be implemented in addition to the other options.
A key feature of the process used in this study is that it allows managers to integrate all dimensions of sustainability into the harvest strategy development process and also provides an explicit role for stakeholder engagement. Industry and other groups were directly involved in identifying the objectives, weighting the objectives, identifying the potential harvest strategies and providing input (based on expert knowledge) as to how these strategies are likely to perform. The process provides a formal framework in which this consultation can take place. As such, it directly addresses the key impediments to developing effective EBFM [3] by providing a suite of stakeholder-developed ecological, economic, and social objectives as well as a general process to integrate these into harvest strategies that consider the three dimensions of sustainability.

Supplementary Materials

The following are available online at https://www.mdpi.com/2071-1050/11/3/644/s1: Detailed description of the alternative harvest strategies.

Author Contributions

Conceptualization, S.P., N.D., C.D. and R.P.; Formal analysis, S.P. and T.C.; Funding acquisition, N.D.; Investigation, S.P., T.C., N.D., C.D., S.B., T.R., R.P. and G.L.; Methodology, S.P., N.D. and C.D.; Project administration, N.D.; Resources, S.B. and T.R.; Software, S.P.; Supervision, N.D.; Writing – original draft, S.P.; Writing – review & editing, S.P., T.C., N.D., C.D., S.B., T.R., R.P. and G.L.

Funding

This research was funded by the Fisheries Research and Development Corporation (FRDC), grant number 2015-013. In-kind contributions were made by CSIRO, Queensland Department of Agriculture and Fisheries, and the Great Barrier Reef Marine Park Authority (GBRMPA).

Acknowledgments

The authors would like to thank the CRFFF Working Group members who contributed to the development of the fisheries objectives and harvest strategies, and the survey participants who provided the necessary data to undertake the analyses.

Conflicts of Interest

S.B. and T.R. are managers of the fishery. All other authors declare no conflict of interest. The funder (FRDC) had no role in the design of the study; in the collection, analyses, or interpretation of data; in the writing of the manuscript, or in the decision to publish the results.

References

  1. Pikitch, E.K.; Santora, C.; Babcock, E.A.; Bakun, A.; Bonfil, R.; Conover, D.O.; Dayton, P.; Doukakis, P.; Fluharty, D.; Heneman, B.; et al. Ecosystem-Based Fishery Management. Science 2004, 305, 346–347. [Google Scholar] [CrossRef] [PubMed]
  2. Arkema, K.K.; Abramson, S.C.; Dewsbury, B.M. Marine ecosystem-based management: From characterization to implementation. Front. Ecol. Environ. 2006, 4, 525–532. [Google Scholar] [CrossRef]
  3. Stephenson, R.L.; Benson, A.J.; Brooks, K.; Charles, A.; Degnbol, P.; Dichmont, C.M.; Kraan, M.; Pascoe, S.; Paul, S.D.; Rindorf, A.; et al. Practical steps toward integrating economic, social and institutional elements in fisheries policy and management. ICES J. Mar. Sci. 2017, 74, 1981–1989. [Google Scholar] [CrossRef] [Green Version]
  4. Brooks, K.; Schirmer, J.; Pascoe, S.; Triantafillos, L.; Jebreen, E.; Cannard, T.; Dichmont, C.M. Selecting and assessing social objectives for Australian fisheries management. Mar. Policy 2015, 53, 111–122. [Google Scholar] [CrossRef]
  5. Department of Agriculture and Fisheries. Queensland Sustainable Fisheries Strategy, 2017–2027; Queensland Government: Brisbane, Australia, 2017.
  6. Innes, J.; Thebaud, O.; Norman Lopez, A.; Little, L.R. Does size matter? An assessment of quota market evolution and performance in the Great Barrier Reef fin-fish fishery. Ecol. Soc. 2014, 19, 1–14. [Google Scholar] [CrossRef]
  7. Halpern, B.S.; Lester, S.E.; McLeod, K.L. Placing marine protected areas onto the ecosystem-based management seascape. Proc. Natl. Acad. Sci. USA 2010, 107, 18312–18317. [Google Scholar] [CrossRef] [PubMed] [Green Version]
  8. Williamson, D.H.; Russ, G.R.; Ayling, A.M. No-take marine reserves increase abundance and biomass of reef fish on inshore fringing reefs of the Great Barrier Reef. Environ. Conserv. 2004, 31, 149–159. [Google Scholar] [CrossRef]
  9. Thébaud, O.; Innes, J.; Norman-López, A.; Slade, S.; Cameron, D.; Cannard, T.; Tickell, S.; Kung, J.; Kerrigan, B.; Williams, L.; et al. Micro-economic drivers of profitability in an ITQ-managed fishery: An analysis of the Queensland Coral Reef Fin-Fish Fishery. Mar. Policy 2014, 43, 200–207. [Google Scholar] [CrossRef] [Green Version]
  10. Department of Employment, Economic Development and Innovation (DEEDI). Annual Status Report 2010 Coral Reef Fin Fish Fishery; Department of Employment, Economic Development and Innovation: Brisbane, Australia, 2011; p. 19.
  11. Queensland Department of Agriculture and Fisheries (DAF). Queensland Fisheries Summaries; Queensland Department of Agriculture and Fisheries: Brisbane, Australia, 2018.
  12. Sutton, S.G.; Tobin, R.C. Recreational fishers’ attitudes towards the 2004 rezoning of the Great Barrier Reef Marine Park. Environ. Conserv. 2009, 36, 245–252. [Google Scholar] [CrossRef]
  13. Stoeckl, N.; Hicks, C.C.; Mills, M.; Fabricius, K.; Esparon, M.; Kroon, F.; Kaur, K.; Costanza, R. The economic value of ecosystem services in the Great Barrier Reef: Our state of knowledge. Ann. N. Y. Acad. Sci. 2011, 1219, 113–133. [Google Scholar] [CrossRef]
  14. Mapstone, B.D.; Little, L.R.; Punt, A.E.; Davies, C.R.; Smith, A.D.M.; Pantus, F.; McDonald, A.D.; Williams, A.J.; Jones, A. Management strategy evaluation for line fishing in the Great Barrier Reef: Balancing conservation and multi-sector fishery objectives. Fish. Res. 2008, 94, 315–329. [Google Scholar] [CrossRef]
  15. Queensland Government. Charter Fishing Action Plan 2017–2020: Discussion Paper; Queensland Government: Brisbane, Australia, 2017.
  16. Tobin, A.; Schlaff, A.; Tobin, R.; Penny, A.; Ayling, A.; Krause, B.; Welch, D.; Sutton, S.; Sawynok, B.; Marshall, N. Adapting to Change: Minimising Uncertainty about the Effects of Rapidly-Changing Environmental Conditions on the Queensland Coral Reef Fin Fish Fishery; Fishing and Fisheries Research Centre, James Cook University: Townsville, Australia, 2010. [Google Scholar]
  17. Stuart-Smith, R.D.; Brown, C.J.; Ceccarelli, D.M.; Edgar, G.J. Ecosystem restructuring along the Great Barrier Reef following mass coral bleaching. Nature 2018, 560, 92–96. [Google Scholar] [CrossRef] [PubMed]
  18. Wismer, S.; Tebbett, S.B.; Streit, R.P.; Bellwood, D.R. Spatial mismatch in fish and coral loss following 2016 mass coral bleaching. Sci. Total Environ. 2019, 650, 1487–1498. [Google Scholar] [CrossRef] [PubMed]
  19. Pascoe, S.; Proctor, W.; Wilcox, C.; Innes, J.; Rochester, W.; Dowling, N. Stakeholder objective preferences in Australian Commonwealth managed fisheries. Mar. Policy 2009, 33, 750–758. [Google Scholar] [CrossRef]
  20. Soma, K. How to involve stakeholders in fisheries management—A country case study in Trinidad and Tobago. Mar. Policy 2003, 27, 47–58. [Google Scholar] [CrossRef]
  21. Mardle, S.; Pascoe, S.; Boncoeur, J.; Le Gallic, B.; Garcia-Hoyo, J.J.; Herrero, N.; Jimenez-Toribio, R.; Cortes, C.; Padilla, N.; Nielsen, J.R.; et al. Objectives of fisheries management: Case studies from the UK, France, Spain and Denmark. Mar. Policy 2002, 26, 415–428. [Google Scholar] [CrossRef]
  22. Wattage, P.; Mardle, S.; Pascoe, S. Evaluation of the importance of fisheries management objectives using choice-experiments. Ecol. Econ. 2005, 55, 85–95. [Google Scholar] [CrossRef]
  23. Leung, P.; Muraoka, J.; Nakamoto, S.T.; Pooley, S. Evaluating fisheries management options in Hawaii using analytic hierarchy process (AHP). Fish. Res. 1998, 36, 171–183. [Google Scholar] [CrossRef]
  24. Jennings, S.; Pascoe, S.; Hall-Aspland, S.; LeBouhellec, B.; Norman-Lopez, A.; Sullivan, A.; Pecl, G. Setting objectives for evaluating management adaptation actions to address climate change impacts in south-eastern Australian fisheries. Fish Oceanogr. 2016, 25, 29–44. [Google Scholar] [CrossRef]
  25. Pascoe, S.; Dichmont, C.M.; Brooks, K.; Pears, R.; Jebreen, E. Management objectives of Queensland fisheries: Putting the horse before the cart. Mar. Policy 2013, 37, 115–122. [Google Scholar] [CrossRef] [Green Version]
  26. Queensland Department of Agriculture and Fisheries (DAF). Coral Reef Fin Fish Fishery Working Group. Available online: www.daf.qld.gov.au/business-priorities/fisheries/sustainable/sustainable-fisheries-strategy/fishery-working-groups/-coral-reef-fin-fish-fishery-working-group (accessed on 23 January 2019).
  27. Roberts, R.; Goodwin, P. Weight approximations in multi-attribute decision models. J. Multi-Criteria Decis. Anal. 2002, 11, 291–303. [Google Scholar] [CrossRef]
  28. Bottomley, P.A.; Doyle, J.R. A comparison of three weight elicitation methods: Good, better, and best. Omega 2001, 29, 553–560. [Google Scholar] [CrossRef]
  29. Bottomley, P.A.; Doyle, J.R.; Green, R.H. Testing the reliability of weight elicitation methods: Direct rating versus point allocation. JMR J. Mark. Res. 2000, 37, 508–513. [Google Scholar] [CrossRef]
  30. Wang, J.-J.; Jing, Y.-Y.; Zhang, C.-F.; Zhao, J.-H. Review on multi-criteria decision analysis aid in sustainable energy decision-making. Renew. Sustain. Energy Rev. 2009, 13, 2263–2278. [Google Scholar] [CrossRef]
  31. Hayashi, K. Multicriteria analysis for agricultural resource management: A critical survey and future perspectives. Eur. J. Oper. Res. 2000, 122, 486–500. [Google Scholar] [CrossRef]
  32. Doyle, J.R.; Green, R.H.; Bottomley, P.A. Judging Relative Importance: Direct Rating and Point Allocation Are Not Equivalent. Organ. Behav. Hum. Decis. Process. 1997, 70, 65–72. [Google Scholar] [CrossRef]
  33. Pöyhönen, M.; Hämäläinen, R.P. On the convergence of multiattribute weighting methods. Eur. J. Oper. Res. 2001, 129, 569–585. [Google Scholar] [CrossRef] [Green Version]
  34. Van Ittersum, K.; Pennings, J.M.E.; Wansink, B.; van Trijp, H.C.M. The validity of attribute-importance measurement: A review. J. Bus. Res. 2007, 60, 1177–1190. [Google Scholar] [CrossRef]
  35. Saaty, T.L. The Analytic Hierarchy Process; McGraw-Hill: New York, NY, USA, 1980. [Google Scholar]
  36. Himes, A.H. Performance Indicator Importance in MPA Management Using a Multi-Criteria Approach. Coast. Manag. 2007, 35, 601–618. [Google Scholar] [CrossRef]
  37. Mardle, S.; Pascoe, S.; Herrero, I. Management objective importance in fisheries: An evaluation using the analytic hierarchy process (AHP). Environ. Manag. 2004, 33, 1–11. [Google Scholar] [CrossRef]
  38. Nielsen, J.R.; Mathiesen, C. Stakeholder preferences for Danish fisheries management of sand eel and Norway pout. Fish. Res. 2006, 77, 92–101. [Google Scholar] [CrossRef]
  39. Wattage, P.; Mardle, S. Stakeholder preferences towards conservation versus development for a wetland in Sri Lanka. J. Environ. Manag. 2005, 77, 122–132. [Google Scholar] [CrossRef] [PubMed]
  40. Baby, S. AHP Modeling for Multicriteria Decision-Making and to Optimise Strategies for Protecting Coastal Landscape Resources. Int. J. Innov. 2013, 4, 218–227. [Google Scholar] [CrossRef]
  41. Bodin, L.; Gass, S.I. On teaching the analytic hierarchy process. Comput. Oper. Res. 2003, 30, 1487–1497. [Google Scholar] [CrossRef]
  42. Dichmont, C.; Pascoe, S.; Jebreen, E.; Pears, R.; Brooks, K.; Perez, P. Providing Social Science Objectives and Indicators to Compare Management Options in the Queensland Trawl Planning Process; CSIRO: Collingwood, Australia, 2012. [Google Scholar]
  43. Dichmont, C.M.; Pascoe, S.; Jebreen, E.; Pears, R.; Brooks, K.; Perez, P. Choosing a fishery’s governance structure using data poor methods. Mar. Policy 2013, 37, 123–131. [Google Scholar] [CrossRef]
  44. Pascoe, S.; Tobin, R.; Windle, J.; Cannard, T.; Marshall, N.; Kabir, Z.; Flint, N. Developing a Social, Cultural and Economic Report Card for a Regional Industrial Harbour. PLoS ONE 2016, 11. [Google Scholar] [CrossRef]
  45. Pascoe, S.; Doshi, A. Estimating Coastal Values Using Multi-Criteria and Valuation Methods; CSIRO: Brisbane, Australia, 2018. [Google Scholar]
  46. Whitmarsh, D.; Wattage, P. Public attitudes towards the environmental impact of salmon aquaculture in Scotland. Environ. Policy Gov. 2006, 16, 108–121. [Google Scholar] [CrossRef]
  47. Marre, J.-B.; Pascoe, S.; Thébaud, O.; Jennings, S.; Boncoeur, J.; Coglan, L. Information preferences for the evaluation of coastal development impacts on ecosystem services: A multi-criteria assessment in the Australian context. J. Environ. Manag. 2016, 173, 141–150. [Google Scholar] [CrossRef]
  48. Samvedi, A.; Jain, V.; Chan, F.T.S. Quantifying risks in a supply chain through integration of fuzzy AHP and fuzzy TOPSIS. Int. J. Prod. Res. 2013, 51, 2433–2442. [Google Scholar] [CrossRef]
  49. Benlian, A. Is traditional, open-source, or on-demand first choice? Developing an AHP-based framework for the comparison of different software models in office suites selection. Eur. J. Inf. Syst. 2011, 20, 542–559. [Google Scholar] [CrossRef]
  50. Thadsin, K.; George, H.; Stanley, M. Introduction of AHP Satisfaction Index for workplace environments. J. Corp. Real Estate 2012, 14, 80–93. [Google Scholar]
  51. Hummel, J.M.; Steuten, L.G.M.; Groothuis-Oudshoorn, C.J.M.; Mulder, N.; IJzerman, M.J. Preferences for Colorectal Cancer Screening Techniques and Intention to Attend: A Multi-Criteria Decision Analysis. Appl. Health Econ. Health Policy 2013, 11, 499–507. [Google Scholar] [CrossRef] [PubMed]
  52. Sara, J.; Stikkelman, R.M.; Herder, P.M. Assessing relative importance and mutual influence of barriers for CCS deployment of the ROAD project using AHP and DEMATEL methods. Int. J. Greenh. Gas Control 2015, 41 (Suppl. C), 336–357. [Google Scholar] [CrossRef]
  53. Tozer, P.R.; Stokes, J.R. Producer Breeding Objectives and Optimal Sire Selection. J. Dairy Sci. 2002, 85, 3518–3525. [Google Scholar] [CrossRef]
  54. Crawford, G.; Williams, C. A note on the analysis of subjective judgment matrices. J. Math. Psychol. 1985, 29, 387–405. [Google Scholar] [CrossRef]
  55. Aguarón, J.; Moreno-Jiménez, J.M. Local stability intervals in the analytic hierarchy process. Eur. J. Oper. Res. 2000, 125, 113–132. [Google Scholar] [CrossRef]
  56. Saaty, T.L. Axiomatic Foundation of the Analytic Hierarchy Process. Manag. Sci. 1986, 32, 841–855. [Google Scholar] [CrossRef]
  57. Pascoe, S.; Bustamante, R.; Wilcox, C.; Gibbs, M. Spatial fisheries management: A framework for multi-objective qualitative assessment. Ocean Coast. Manag. 2009, 52, 130–138. [Google Scholar] [CrossRef]
  58. Huber, G.P. Methods for quantifying subjective probabilities and multi-attribute utilities. Decis. Sci. 1974, 5, 430–458. [Google Scholar] [CrossRef]
  59. Hampton, J.M.; Moore, P.G.; Thomas, H. Subjective Probability and Its Measurement. J. R. Stat. Soc. Ser. A (General) 1973, 136, 21–42. [Google Scholar] [CrossRef]
  60. Pascoe, S.; Dichmont, C.M. Does membership matter? Individual influences in natural resource management decision making. Mar. Policy 2017, 83, 48–54. [Google Scholar] [CrossRef]
  61. Wallsten, T.S.; Budescu, D.V.; Erev, I.; Diederich, A. Evaluating and Combining Subjective Probability Estimates. J. Behav. Decis. Mak. 1997, 10, 243–268. [Google Scholar] [CrossRef] [Green Version]
Figure 1. Example question in the objective importance survey.
Sustainability 11 00644 g001
Figure 2. Example question in the harvest strategy performance survey.
Sustainability 11 00644 g002
Figure 3. Distribution of survey responses by stakeholder group.
Sustainability 11 00644 g003
Figure 4. Objective weight distributions by stakeholder group. The thick bar represents the median weight; the box represents the range of weights between the 75th and 25th percentile (i.e., 50% of the observations); the “whiskers” represent the upper and lower bounds of the distribution.
Sustainability 11 00644 g004
Figure 5. Impact survey response by stakeholder group.
Sustainability 11 00644 g005
Figure 6. Distribution of the impacts against the management objectives. The thick bar represents the median weight; the box represents the range of weights between the 75th and 25th percentile (i.e., 50% of the observations); the “whiskers” represent the upper and lower bounds of the distribution.
Sustainability 11 00644 g006
Figure 7. Weighted impact score distributions and their cumulative subjective probabilities.
Sustainability 11 00644 g007
Table 1. Objective hierarchy identified with the Working Group.
Broad Objectives (Level 1)Sub-objectives (Level 2)Specific Operational Objectives (Level 3)
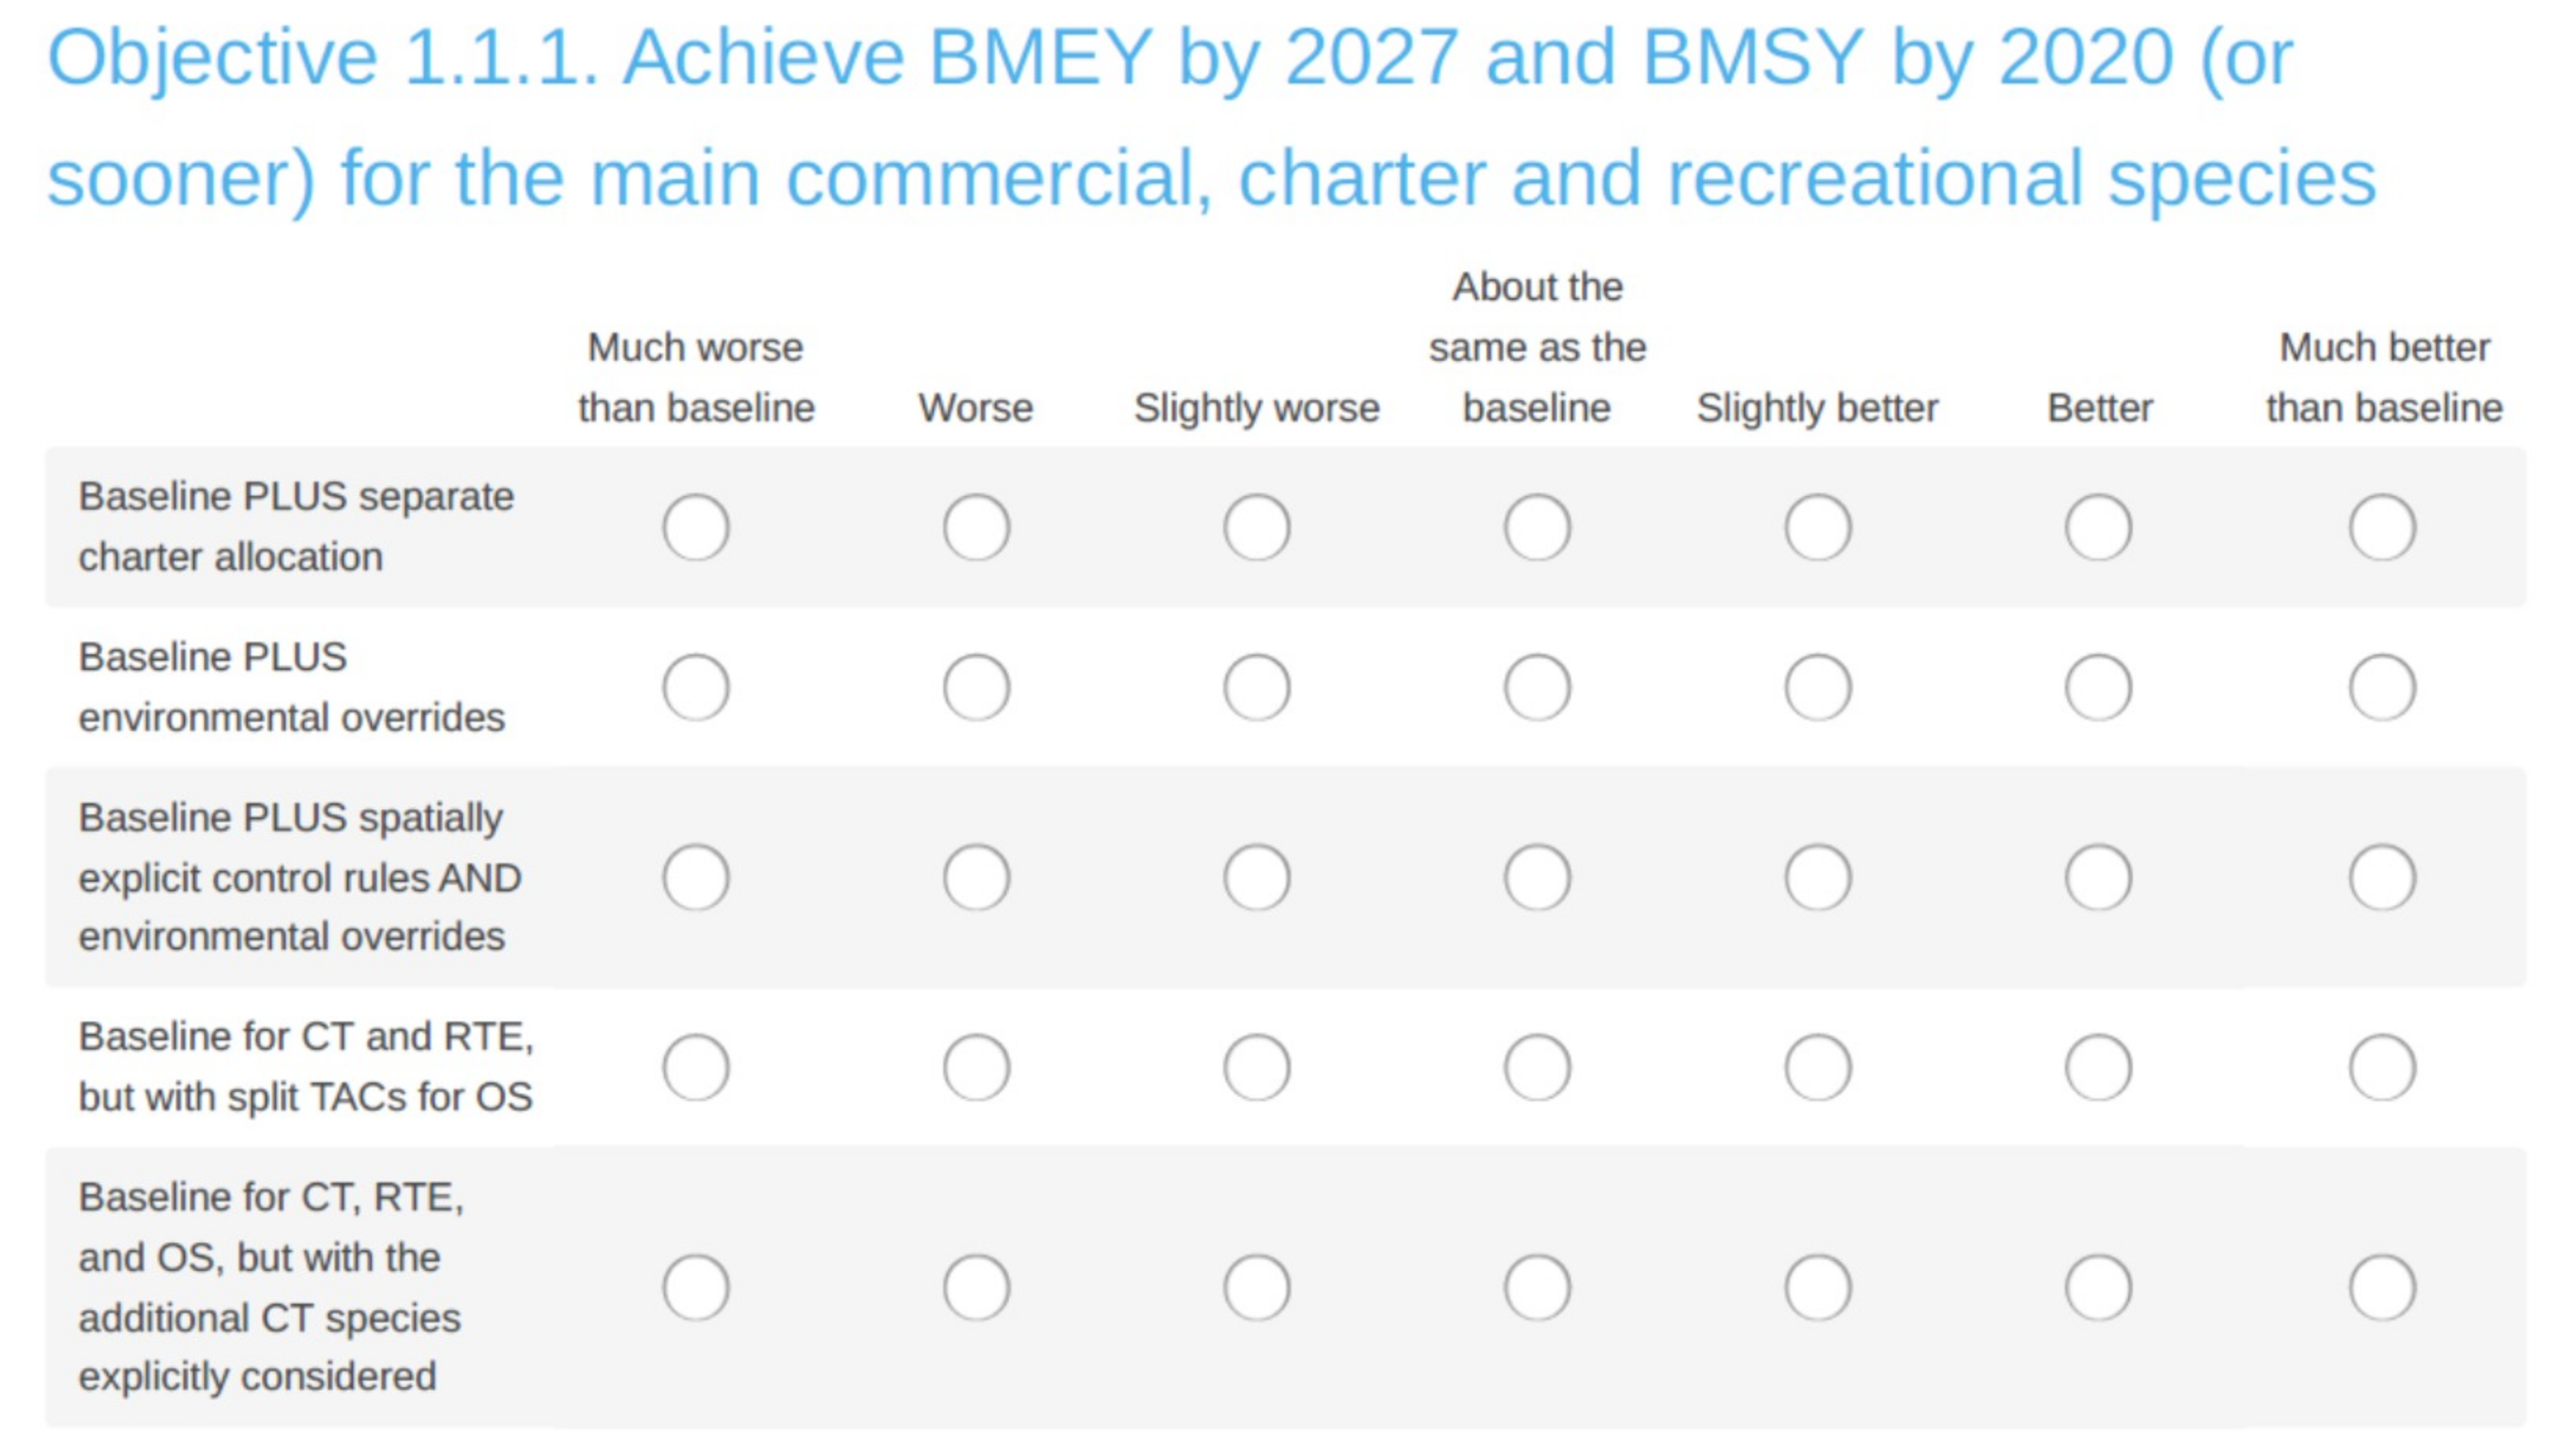
1. Ensure ecological sustainability 1.1 Ensure resource biomass sustainability1.1.1 As per the Queensland Sustainable Fisheries Strategy, achieve BMEY (biomass at maximum economic yield) (~60% unfished biomass or defensible proxy), by 2027 for the main commercial, charter and recreational species; if below biomass at maximum sustainable yield, BMSY, aim to achieve BMSY (~40–50% B0) by 2020.
1.1.2 Minimize risk to Other Species in the fishery which are not included in 1.1.1.
1.2 Ensure ecosystem resilience1.2.1 Minimize risk to bycatch species
1.2.2 Minimize discard mortality of target species (e.g., high grading)
1.2.3 Minimize broader ecological risks
1.2.4 Minimize risk to protected species
1.3 Minimize risk of localized depletion 1.3.1 Minimize risk of localized depletion due to fishing
1.3.2. Minimize risk of localized depletion in response to environmental events (e.g., cyclone)
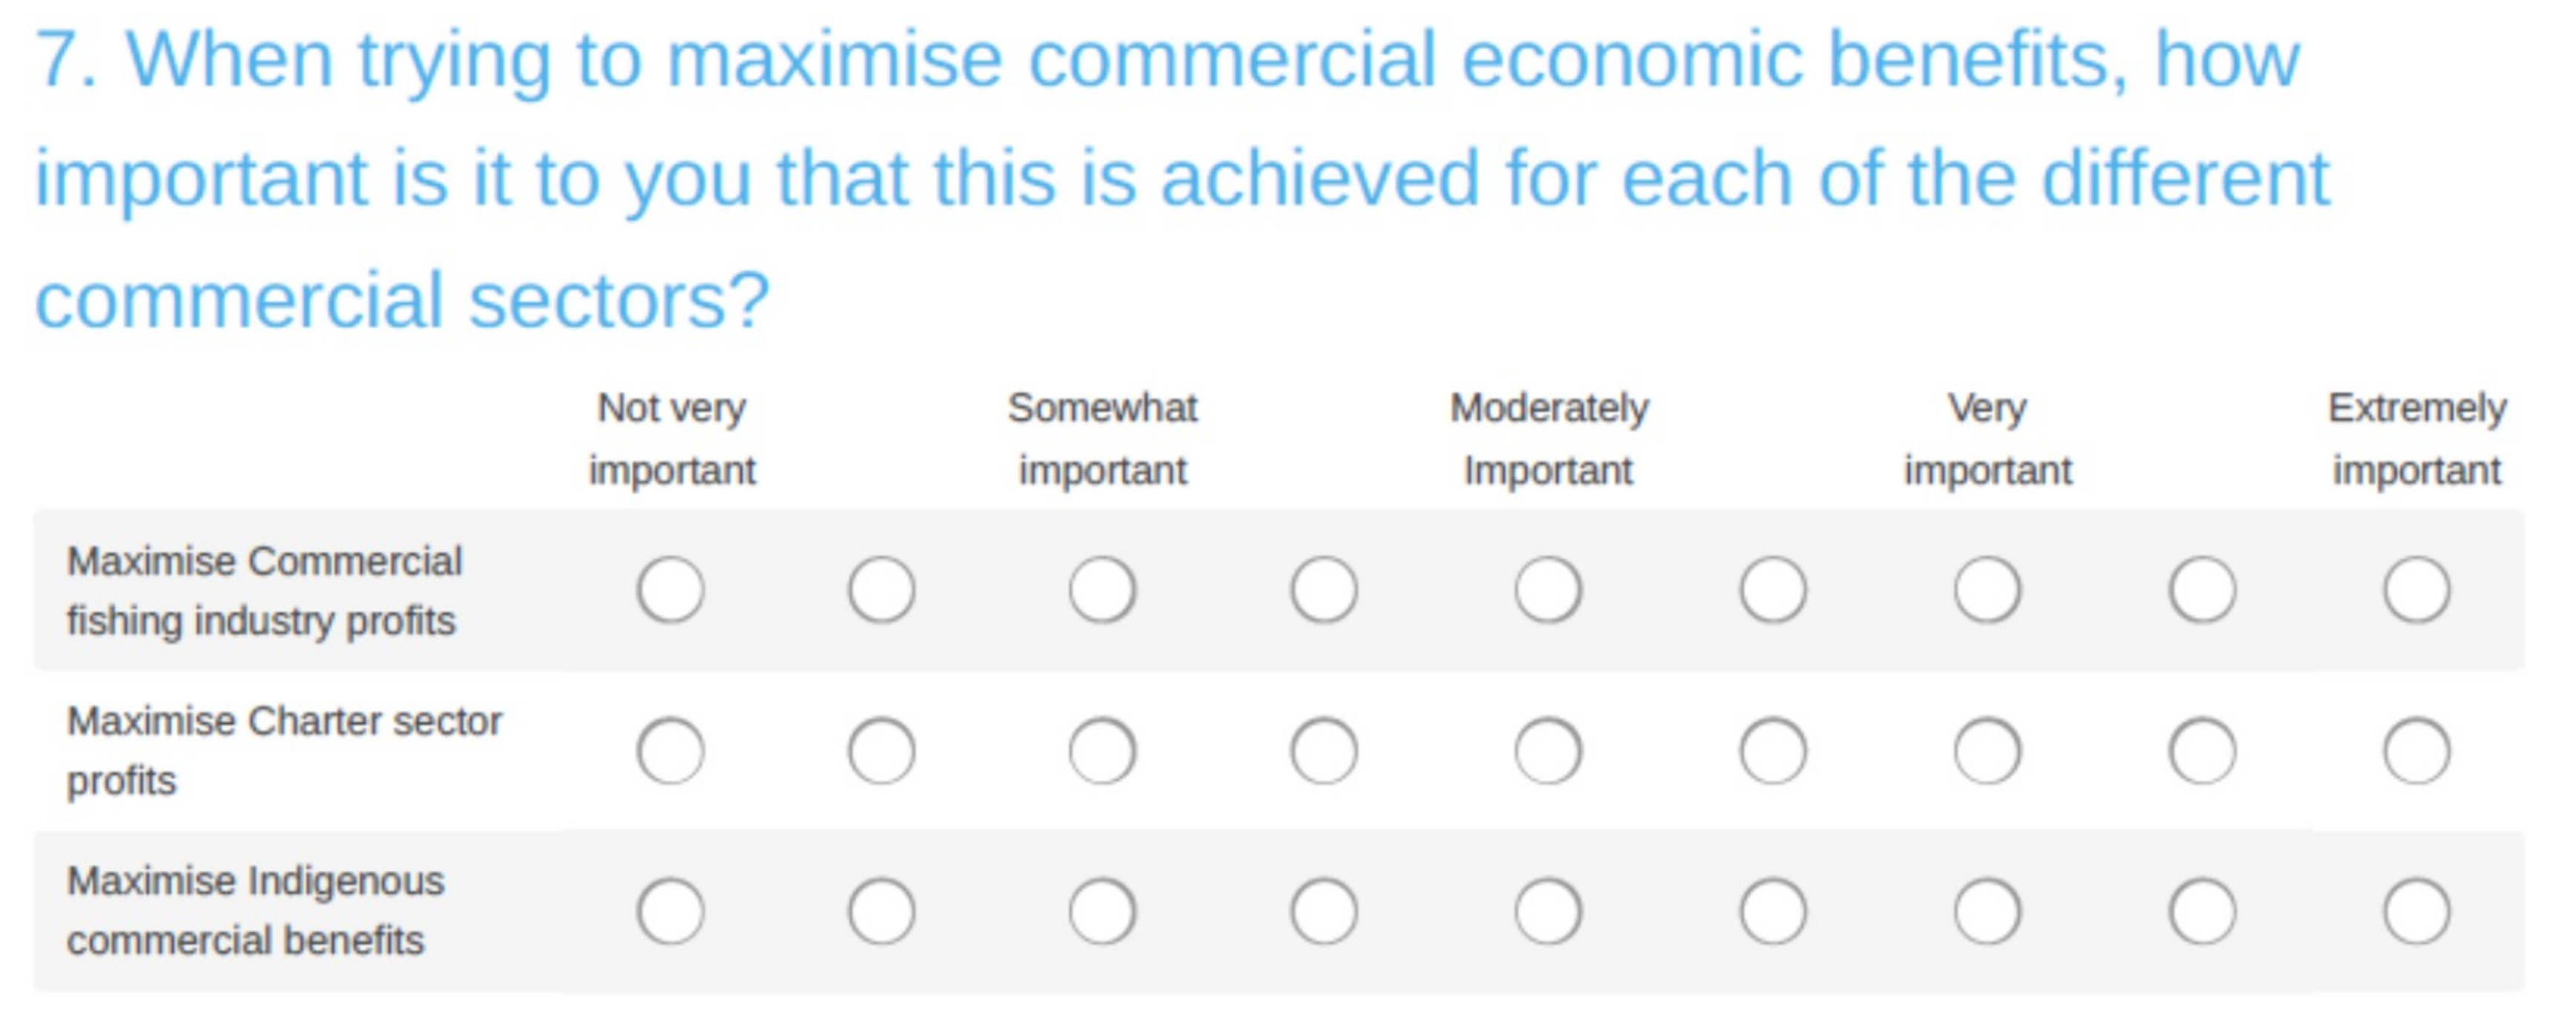
2. Enhance fishery economic performance 2.1 Maximize commercial economic benefits, as combined totals for each of the following sectors 2.1.1 Commercial fishing industry profits
2.1.2 Charter sector profits
2.1.3 Indigenous commercial benefits
2.2 Maximize value of recreational fishers and charter experience (direct to participant)2.2 Maximize value of recreational fishers and charter experience
2.3 Maximize flow-on economic benefits to local communities (from all sectors)2.3 Maximize flow-on economic benefits to local communities
2.4 Minimize short term (inter-annual) economic risk 2.4 Minimize short term (inter-annual) economic risk
2.5 Minimize costs of management associated with the harvest strategy: monitoring, undertaking assessments, adjusting management controls2.5 Minimize costs of management associated with the harvest strategy: monitoring, undertaking assessments, adjusting management controls
3. Enhance management performance3.1 Maximize willingness to comply with the harvest strategy3.1 Maximize willingness to comply with the harvest strategy
4. Maximize social outcomes4.1 Maximize equity between recreational, charter, indigenous and commercial fishing4.1 Increase equitable access to the resource
4.2 Improve social perceptions of the fishery (social license to operate) (recreational, commercial, charter, indigenous) 4.2.1 Through sound fishing practices, minimize adverse public perception around discard mortality (compliance with size limits, environmental sustainability, and waste)
4.2.2 Maximize utilization of the retained catch of target species
4.2.3 Maximize the potential for fishing to be perceived as a positive activity with benefits to the community (commercial, rec, and charter)
4.3 Enhance the net social value to the local community from use of the resource 4.3.1 Increase access to local seafood (all species)
4.3.2 Maximize spatial equity between regions or local communities
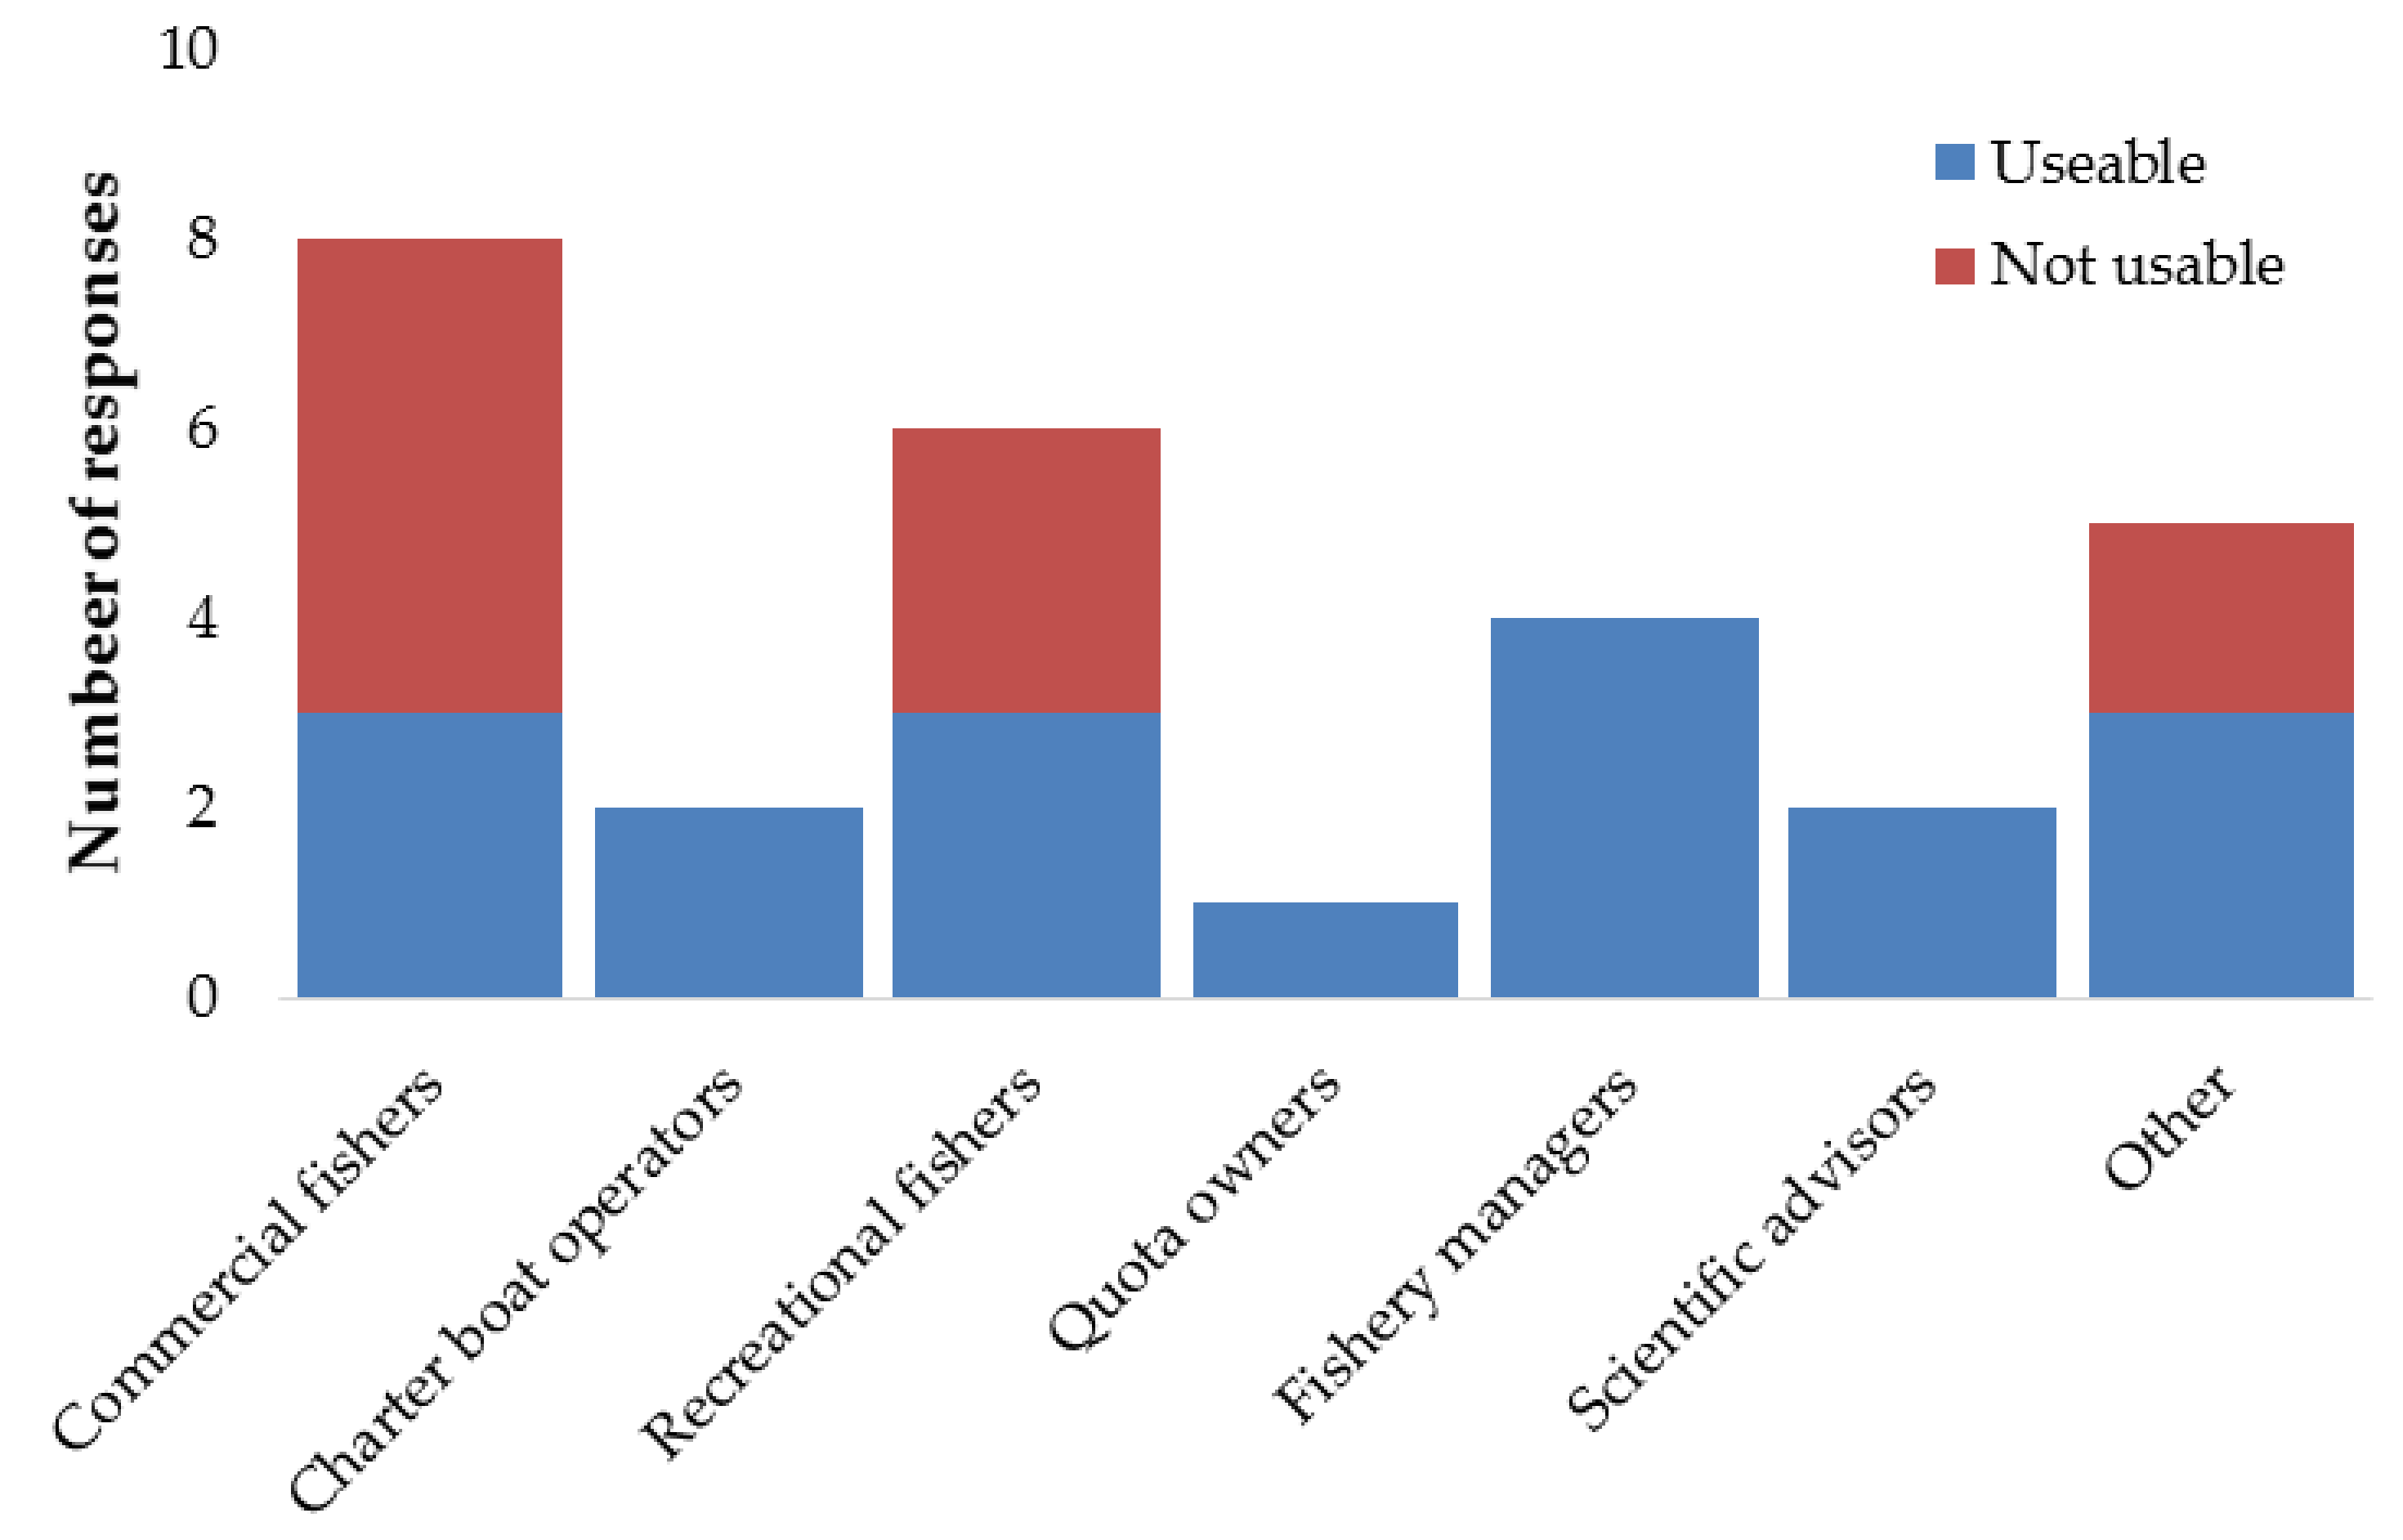
Table 2. Average weights by stakeholder group.
GroupCommercial FishersCharter Boat OperatorsRecreational FishersQuota OwnersProcessors/Wholesalers/BuyersFishery ManagersScientific AdvisorsOther
Responses 57 25 26 35 8 7 7 9
MeanRSEMeanRSEMeanRSEMeanRSEMeanRSEMeanRSEMeanRSEMeanRSE
Ecol10.3083%0.3843%0.3353%0.2973%0.3873%0.4543%0.4613%0.4053%
Ecol1.10.1004%0.1304%0.1244%0.1104%0.2074%0.2544%0.1934%0.1384%
• Ecol1.1.10.0586%0.0556%0.0706%0.0646%0.1336%0.1706%0.0936%0.0626%
• Ecol1.1.20.0426%0.0756%0.0546%0.0466%0.0746%0.0836%0.1006%0.0766%
Ecol1.20.1095%0.1325%0.1155%0.1015%0.0995%0.1205%0.1915%0.1335%
• Ecol1.2.10.0227%0.0237%0.0267%0.0187%0.0187%0.0167%0.0407%0.0277%
• Ecol1.2.20.0375%0.0455%0.0385%0.0395%0.0395%0.0385%0.0445%0.0515%
• Ecol1.2.30.0286%0.0336%0.0276%0.0236%0.0276%0.0336%0.0546%0.0296%
• Ecol1.2.40.0236%0.0316%0.0246%0.0206%0.0166%0.0336%0.0536%0.0266%
Ecol1.30.0995%0.1225%0.0965%0.0875%0.0815%0.0805%0.0775%0.1345%
• Ecol1.3.10.0666%0.0846%0.0616%0.0616%0.0386%0.0446%0.0516%0.0736%
• Ecol1.3.20.0337%0.0387%0.0357%0.0257%0.0427%0.0367%0.0277%0.0627%
Econ20.2864%0.2394%0.2144%0.2894%0.3114%0.1254%0.1234%0.1694%
Econ2.10.0995%0.0625%0.0535%0.0985%0.0945%0.0335%0.0355%0.0365%
• Econ2.1.10.0647%0.0237%0.0257%0.0647%0.0577%0.0177%0.0167%0.0237%
• Econ2.1.20.0187%0.0317%0.0207%0.0197%0.0247%0.0087%0.0107%0.0087%
• Econ2.1.30.0178%0.0088%0.0088%0.0158%0.0138%0.0088%0.0098%0.0068%
Econ2.20.0238%0.0438%0.0538%0.0258%0.0368%0.0328%0.0148%0.0188%
Econ2.30.0616%0.0576%0.0486%0.0606%0.0866%0.0226%0.0326%0.0596%
Econ2.40.0506%0.0366%0.0286%0.0526%0.0436%0.0186%0.0196%0.0266%
Econ2.50.0535%0.0415%0.0325%0.0555%0.0535%0.0205%0.0225%0.0305%
Manage30.2644%0.2324%0.2774%0.2714%0.2414%0.3174%0.2934%0.2704%
Social40.1424%0.1454%0.1744%0.1434%0.0614%0.1044%0.1234%0.1564%
Social4.10.0337%0.0477%0.0487%0.0387%0.0167%0.0387%0.0457%0.0397%
Social4.20.0485%0.0515%0.0565%0.0515%0.0215%0.0295%0.0375%0.0675%
• Social4.2.10.0106%0.0116%0.0136%0.0116%0.0066%0.0086%0.0066%0.0176%
• Social4.2.20.0176%0.0186%0.0186%0.0186%0.0056%0.0126%0.0166%0.0216%
• Social4.2.30.0216%0.0226%0.0266%0.0226%0.0106%0.0096%0.0156%0.0296%
Social4.30.0616%0.0476%0.0706%0.0546%0.0246%0.0376%0.0416%0.0506%
• Social4.3.10.0397%0.0237%0.0327%0.0347%0.0137%0.0177%0.0267%0.0357%
• Social4.3.20.0226%0.0246%0.0386%0.026%0.0126%0.0216%0.0156%0.0166%
Table 3. Average weighted “score” by stakeholder group.
Stakeholder GroupCharterEnvironmental OverridesSpatially Explicit Control Rules and Environmental Overrides Split OS QuotaSplit CT Quota
Commercial fisher0.06−0.13−0.060.28−0.28
Charter boat operator0.09−0.020.070.37−0.23
Recreational fisher0.09−0.070.020.34−0.26
Quota owner0.06−0.15−0.070.28−0.29
Processor/wholesaler0.09−0.020.040.38−0.24
Fishery manager0.100.030.080.49−0.23
Scientific advice0.110.020.090.46−0.22
Other0.100.000.080.40−0.24
Table 4. Proportion of estimates with a negative value by stakeholder group.
Stakeholder GroupCharterEnvironmental OverridesSpatially Explicit Control Rules and Environmental Overrides Split OS QuotaSplit CT Quota
Commercial fisher0.300.510.480.310.64
Charter boat operator0.290.370.350.290.59
Recreational fisher0.290.450.390.320.61
Quota owner0.290.530.490.310.64
Processor/wholesaler0.330.340.380.250.58
Fishery manager0.350.330.320.270.59
Scientific/advice0.310.360.340.250.57
Other0.300.360.340.290.58

