Article

Energy Management and Optimization of a PV/Diesel/Battery Hybrid Energy System Using a Combined Dispatch Strategy

by
Ali Saleh Aziz
1,
Mohammad Faridun Naim Tajuddin
1,*,
Mohd Rafi Adzman
1,
Makbul A. M. Ramli
2 and
Saad Mekhilef
3
1
Centre of Excellence for Renewable Energy, School of Electrical Systems Engineering, Universiti Malaysia Perlis, Perlis 02600, Malaysia
2
Department of Electrical and Computer Engineering, King Abdulaziz University, Jeddah 21589, Saudi Arabia
3
Power Electronics and Renewable Energy Research Laboratory (PEARL), Department of Electrical Engineering, University of Malaya, Kuala Lumpur 50603, Malaysia
*
Author to whom correspondence should be addressed.
Sustainability 2019, 11(3), 683; https://doi.org/10.3390/su11030683
Submission received: 29 November 2018 / Revised: 9 January 2019 / Accepted: 22 January 2019 / Published: 28 January 2019
(This article belongs to the Special Issue Smart Energy Management for Smart Grids)

Abstract

:
In recent years, the concept of hybrid energy systems (HESs) is drawing more attention for electrification of isolated or energy-deficient areas. When optimally designed, HESs prove to be more reliable and economical than single energy source systems. This study examines the feasibility of a combined dispatch (CD) control strategy for a photovoltaic (PV)/diesel/battery HES by combining the load following (LF) strategy and cycle charging (CC) strategy. HOMER software is used as a tool for optimization analysis by investigating the techno-economic and environmental performance of the proposed system under the LF strategy, CC strategy, and combined dispatch CD strategy. The simulation results reveal that the CD strategy has a net present cost (NPC) and cost of energy (COE) values of $110,191 and $0.21/kWh, which are 20.6% and 4.8% lower than those of systems utilizing the LF and CC strategies, respectively. From an environmental point of view, the CD strategy also offers the best performance, with CO2 emissions of 27,678 kg/year. Moreover, the results show that variations in critical parameters, such as battery minimum state of charge, time step, solar radiation, diesel price, and load growth, exert considerable effects on the performance of the proposed system.

1. Introduction

Progressive energy demand growth and rapid depletion of fossil fuels have raised concerns of future energy supplies [1]. Moreover, the utilization of conventional energy sources from fossil fuels has resulted in tremendous increases in CO2 emissions, which are the primary cause of global warming [2,3]. The atmospheric CO2 concentration has increased by approximately 40% compared with that at the beginning of the industrial revolution [4]. These issues have led to the determination of alternative energy sources with the potential to reduce pollution and produce a sustainable energy supply [5]. The utilization of renewable energy sources (RESs) has grown exponentially over the last few years. By the end of 2017, approximately 26.5% of the total global electricity produced came from RES, as shown in Figure 1 [6]. RESs, such as solar, wind, hydropower, geothermal, and biomass, are easily replenished and environmentally friendly. However, the major drawback of RESs is the unpredictable and intermittent nature of power generation. This issue can be overcome by integrating different energy sources to produce a hybrid energy system (HES), which can solve reliability problems and provide an environmentally friendly solution [7,8,9]. Various power sources and storages, such as diesel generators, batteries, and supercapacitors, should be integrated into HESs to improve system stability and smooth out fluctuations [10,11].
The optimal design of HESs requires appropriate sizing of the components and a feasible energy management strategy. Selection of a suitable energy management strategy is critical because it determines the behavior of the system by controlling the flow of energy and deciding the priority of each component in the system [12]. The proper energy management strategy is therefore able to improve the power system stability, ensure the continuity of power supply, minimize the cost of energy (COE), and protect components against damage due to overloads. Moreover, in grid-connected systems, the energy management strategy is vital to control the flow of energy from and to the grid and for metering purposes [13,14]. Depending on the system configuration and the optimization objectives, different energy management strategies are performed based on various technical and economic criterions. These strategies can be less or more complicated, requiring the utilization of less or more complicated optimization algorithms [15].
The energy management strategy is conducted by selecting, installing, and programming a central controller to manage the flow of energy according to an optimized strategy. Various mathematical programs and optimization techniques are employed to design and plan energy management strategies. These strategies include off-grid and grid-connected HESs as presented in Figure 2 [14].
Although the non-dispatchable RESs necessitate complex systems modeling, they are themselves simple to model without the need for control logic, in which the power is merely produced in direct response to the available renewable energy resources. On the other hand, the dispatchable components, such as the generator and battery, are more difficult to model because they must be controlled to achieve matching of demand and supply properly, and to compensate for the intermittency of the non-dispatchable RESs [16,17]. “Should a generator charge the battery or should excess solar production be responsible for charging the battery only and the generator used only to satisfy the load?” This question has led to some rules that manage the operation of generator and battery energy storage. The load following (LF) and cycle charging (CC) dispatch strategies are used to control generator operation and battery energy storage. Under the LF strategy, a generator produces only enough power to satisfy the load demand and does not charge the batteries. Batteries are charged only by excess electricity from RESs. Under the CC strategy, the generator operates at its maximum rated capacity whenever it is switched on to feed the load and charge the battery bank by the excess power [18,19]. In the CC strategy, a setpoint state-of-charge (SOC) can be applied. When a certain setpoint is selected, the system does not stop charging the battery until it reaches the specified setpoint [20,21,22]. The chosen dispatch strategies are applied only when dispatchable components such as generator and battery are operating simultaneously during a time step [23].
HOMER software that was developed by National Renewable Energy Laboratory (NREL), United States, is considered one of the most powerful tools for the optimization of HESs through performing a techno-economic analysis of the system with a project lifetime of a certain number of years [24]. Different technologies, such as PV, wind turbine, hydrokinetic, hydropower, biomass, conventional generator, battery, flywheel, supercapacitor, and fuel cell, can be addressed with HOMER. HOMER can model both the LF strategy and CC strategy to control the generator and energy storage operation. Both of these strategies make economic dispatch decisions; they choose the most economical way to serve the load at each time step. HOMER simulates hundreds or even thousands of all possible combinations of the energy system and then ranks the results according to the least-cost options that meet the load requirements [25,26,27].
Many studies throughout the world have used HOMER software to investigate the optimal design of proposed HESs using LF or CC strategies. Halabi et al. [28], Ansong et al. [29], Sigarchian et al. [30], Rezzouk and Mellit [31], and Madziga et al. [32] used the LF strategy to analyze the performance of suggested HESs to find the optimal configurations. Each study proposed certain components that differed from others and the simulation was conducted for a specific area. On the other hand, the authors in [9,33,34,35,36,37] carried out techno-economic analysis to investigate the optimum HES using the CC strategy in which different setpoints SOC were suggested.
Other studies have been conducted to investigate the optimum HES using both the LF strategy and the CC strategy to find the best one for the proposed HESs. Kansara and Parekh [38] performed dispatch analysis of a stand-alone wind/diesel/battery energy system and found that the system achieved better performance for high renewable penetration under the LF strategy; for low renewable penetration, the CC strategy was preferable. The optimal size of the PV/diesel/battery power system under the LF and CC control strategies was investigated in [39], and results showed that the optimum design for the CC strategy had a smaller COE than that of the LF strategy. The authors in [40] presented a techno-economic analysis of the PV/diesel/battery system and concluded that the LF provided better economic performance compared to the CC strategy. A comparison of the LF and CC control strategies for two different HESs was studied in [41], and it was found that for the PV/diesel HES, the CC strategy provided better performance in terms of net present cost (NPC), COE, and greenhouse gas (GHG) emissions, but not in terms of renewable penetration. For a wind/diesel system, the LF dispatch strategy demonstrated better techno-economic and environmental performance than the CC strategy. The authors in [42] investigated the best energy management strategy for HESs in three different places in India and found that the LF strategy achieved better techno-economic and environmental performance than the CC strategy for all locations. The optimum planning and design of the PV/diesel/battery for a school, a small dispensary, and 25 households using both LF and CC control strategies was examined by Fodhil et al. [43], who showed that the LF strategy was more cost effective for the dispensary, while the CC strategy was more cost effective for both the school and households. Moreover, the LF strategy had more PV penetration and less GHG emissions than the CC strategy in all cases. Shoeb and Shafiullah [44] investigated the performance of a PV/diesel/battery HES for standalone electrification of a rural area in southern Bangladesh. They showed that the CC strategy was more economical than the LF strategy. Ghenai and Bettayeb [45] analyzed the feasibility of different off-grid HESs using PV, diesel, battery, and fuel cell to supply electricity for a building in the University of Sharjah, UAE. They reported that for all cases, the use of the CC strategy for power generation was preferable to the LF strategy. Maatallah et al. [46] studied the techno-economic feasibility of a PV/wind/diesel/battery hybrid system for a case study in Bizerte, Tunisia and found that the LF strategy was more cost-effective than the CC strategy. The system under the LF strategy was able to save more than $27,000 during the project lifetime. A study on the viability of supplying electricity through an HES consisting of a PV, diesel generator, biomass plant, and batteries to rural areas in the northern region of Bangladesh was presented in [47]. It was found that the CC strategy was more economical than the LF strategy and it was capable of saving around $12,450 during the project lifetime. On the other hand, the LF strategy caused the cost of energy (COE) to increase from $0.188/kWh to $0.189/kWh.
From the previous works, it has been found that the optimum dispatch strategy is affected by various parameters, such as fuel price, fuel conversion efficiency of the generator, operation and maintenance (O&M) costs, renewable penetration, and battery and generator capacity. Moreover, LF and CC strategies are found to be simple and effective tools for the control of HESs, but they have some drawbacks. By using a generator to charge batteries during operation, the CC dispatch strategy provides more energy to the batteries. This approach shuts down the generator during the low-load period, which results in a reduction of the total operating time of the generator. However, the sequence of the battery charging/discharging process may damage or ruin the battery, which leads to increased replacement costs. On the other hand, when the generator satisfies the load demand without charging the batteries, the LF dispatch strategy ensures that the batteries remain charged by the RES output power only, and this maximizes the use of available renewable energy. Furthermore, in the LF strategy, the utilization of the battery is limited. Hence, a longer life of the battery can be achieved. However, the main drawback of the LF strategy is that for most of the time, the generator works at part load, and this increases the variable cost due to the lower off-design efficiency. In many cases, the system performance under one of these dispatch strategies is much better than that of the other. However, predicting the best strategy before running the model is difficult.
Based on the literature review and the research gap discussed above, the objective of this paper is to examine the techno-economic and environmental performance of an off-grid PV/diesel/battery HES supplying electricity to a small remote village in Iraq using a combined dispatch (CD) strategy. Combining the LF and CC dispatch strategies may help improve the system performance by allowing more efficient utilization of the generator and batteries. The system performance under this strategy is compared with the existing dispatch strategies (LF and CC), and HOMER software is utilized for analysis of the proposed systems. To the best knowledge of the authors, this is the first study investigating the techno-economic and environmental performance of an HES using the CD strategy.
The rest of the paper is organized as follows. Section 2 presents the methodology, which provides the assessment of site specifications, load profile, metrological data, system components, mathematical representation, and the control strategy. Section 3 presents the results obtained, including the optimization and sensitivity analysis. Finally, the conclusion is given in Section 4.

2. Methodology

Successful evaluation of any renewable energy project requires appropriate criteria to be applied in the selected area to ensure that the operational behavior of different scenarios can be analyzed accurately. The following analysis frameworks are adopted in the current work:
  • Selected site specifications and load demand data
  • Metrological data (solar radiation and temperature)
  • Hybrid power system components
  • Mathematical representation
  • System operational control

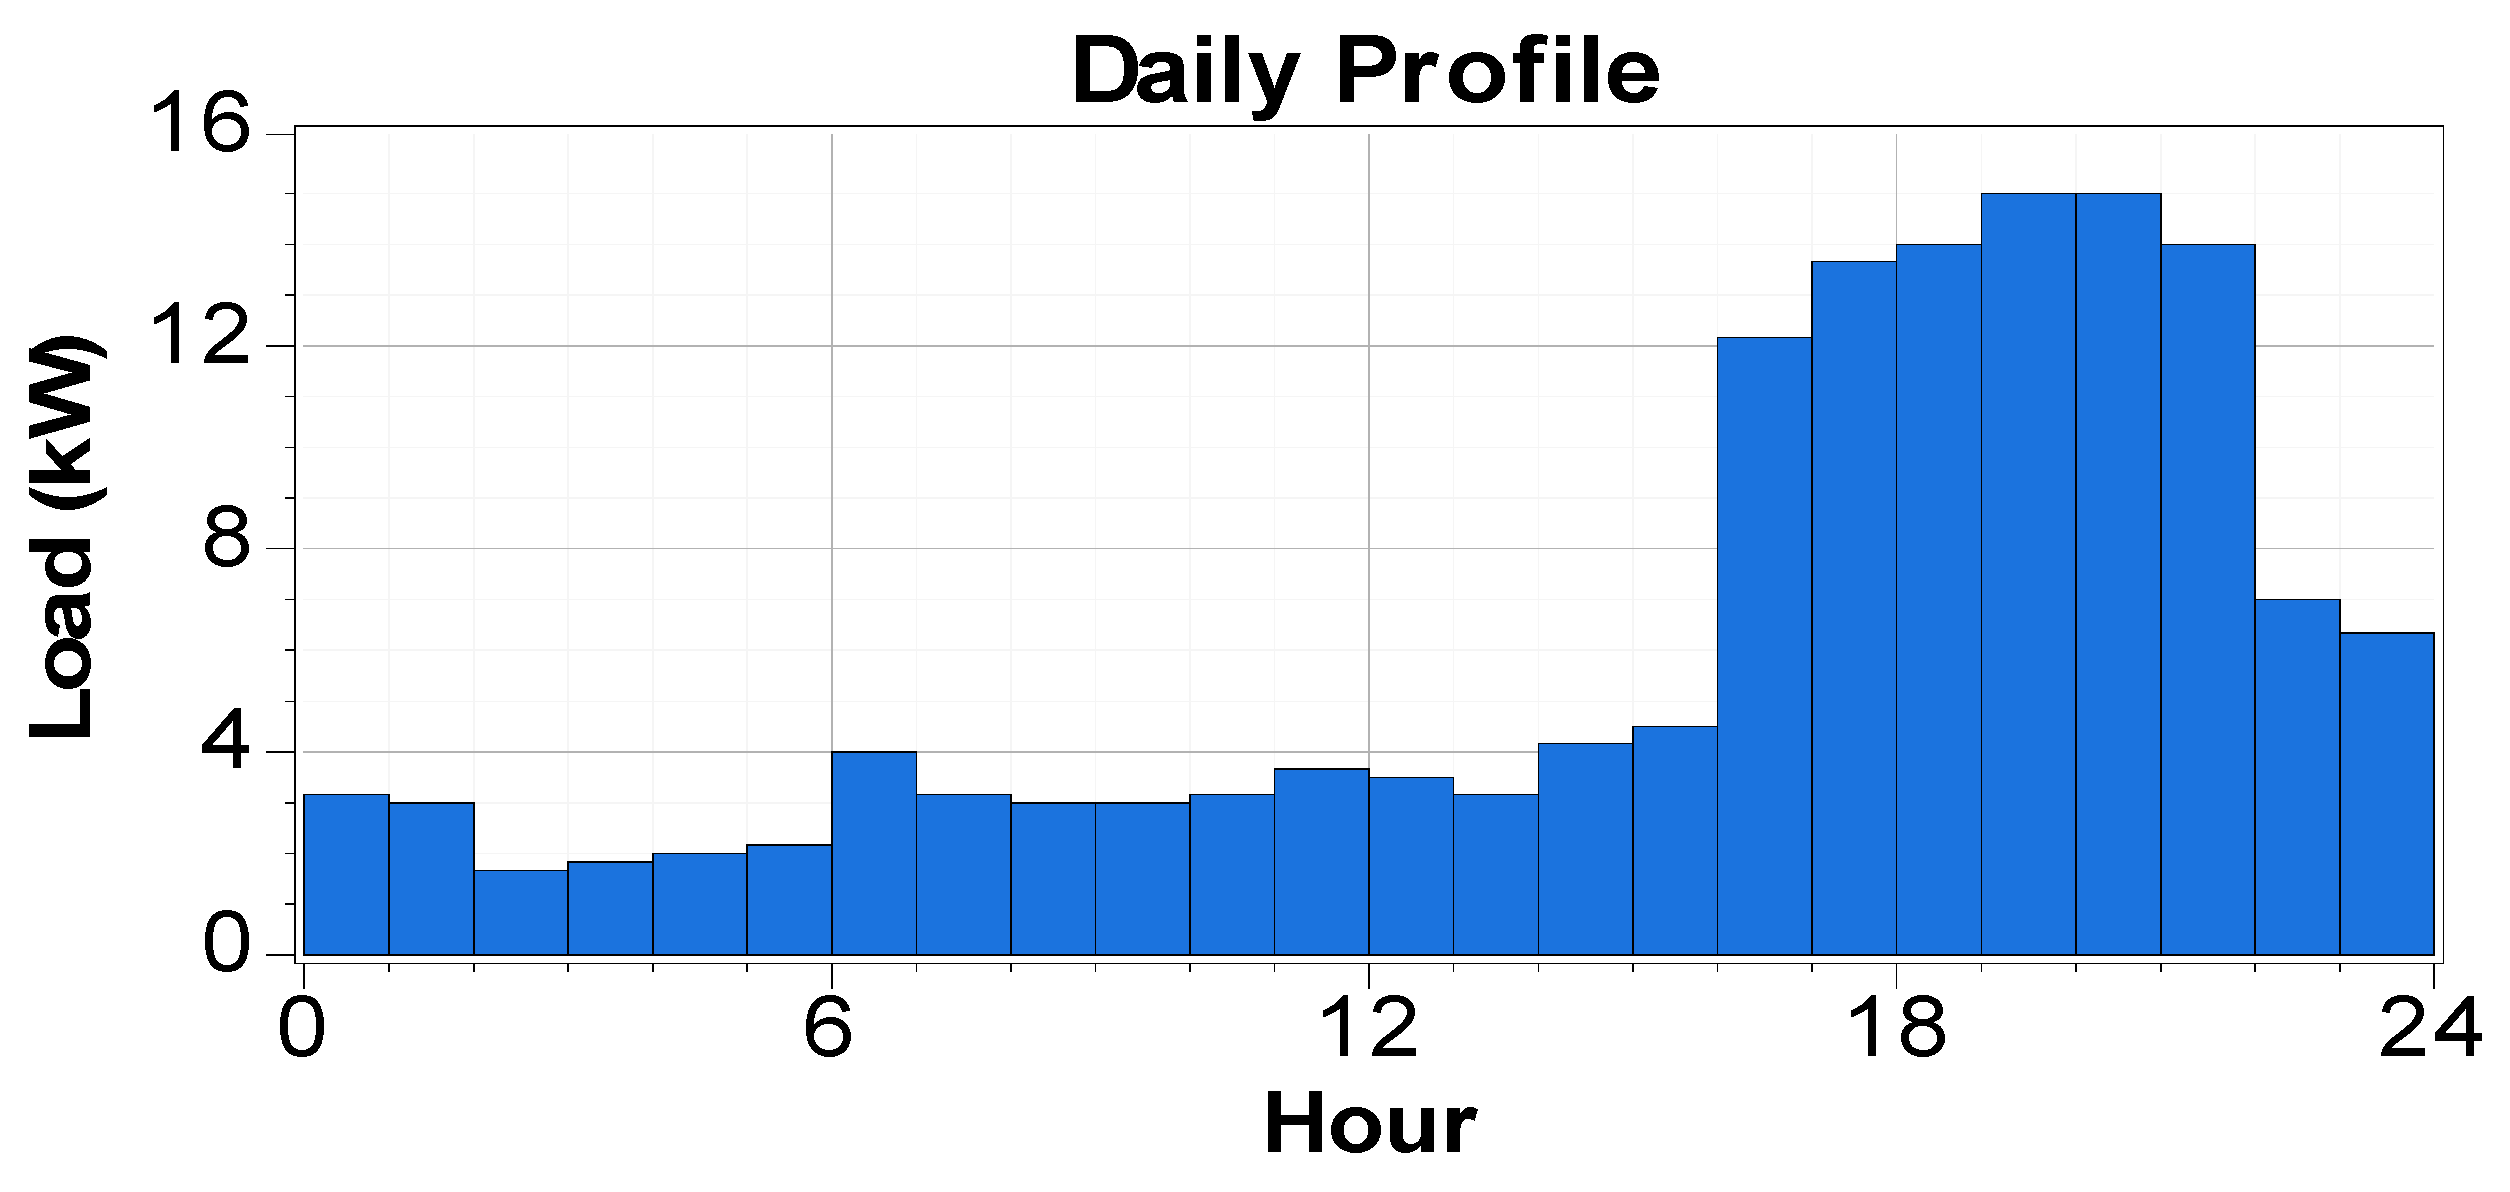
2.1. Specification and Load Profile of the Selected Site

The remote rural village selected as a case study in this research is located at Muqdadiyah District, Diyala, Iraq. The village consists of 40 households with total number of people of around 150. Water-wells and hand pumps are the primary sources of water in the area. The village does not have access to grid power, and this situation may open new opportunities for utilization of stand-alone HESs to provide electricity for the area. Similar to most remote rural areas, the residential units of the village require a low electricity supply for electrical appliances and lighting. Figure 3 shows the total daily load profile of the village’s households [48]. A 5% random variability is considered for time step to time step and day-to-day analyses to provide better reliability. During the first hours of the day (00:00–06:00), the power consumption is low since the people are asleep. From 06:00–07:00, the load profile shows an increase since most of the people get ready either to leave for schools or their work. Then the load profile decreases again, as most of the family members are outside, and continue until 14:00 when people come back to their homes. Starting from 14:00 the load profile shows a continues increment and the maximum is recorded from 19:00–21:00 since most people are present in their homes; then, the load decreases, which refers to the start of sleep time. A daily total energy demand of 145 kWh/day, a daily average of 6.04 kW, and power peak load of 18.29 kW are found.

2.2. Solar Resource and Temperature

Solar radiation and ambient temperature are the two parameters with the most profound effects on the output PV power. In this framework, HOMER software uses the monthly average global horizontal radiation and ambient temperature as input parameters. Section 2.4 provides the mathematical expression of the effects of these parameters on the output PV power. The following points explain the solar radiation and ambient temperature data in the selected site, which were obtained from the NASA website [49].
  • The solar radiation and clearance index data for the selected village (33° N latitude and 44° E longitude) are presented in Figure 4. The annual average solar radiation is 5.02 kWh/m2/day, maximum solar radiation (7.56 kWh/m2/day) is recorded in June, and the minimum solar radiation (2.62 kWh/m2/day) is recorded in December. The amount of solar radiation received by the area is relatively high, which indicates that the solar energy system is an attractive power source.
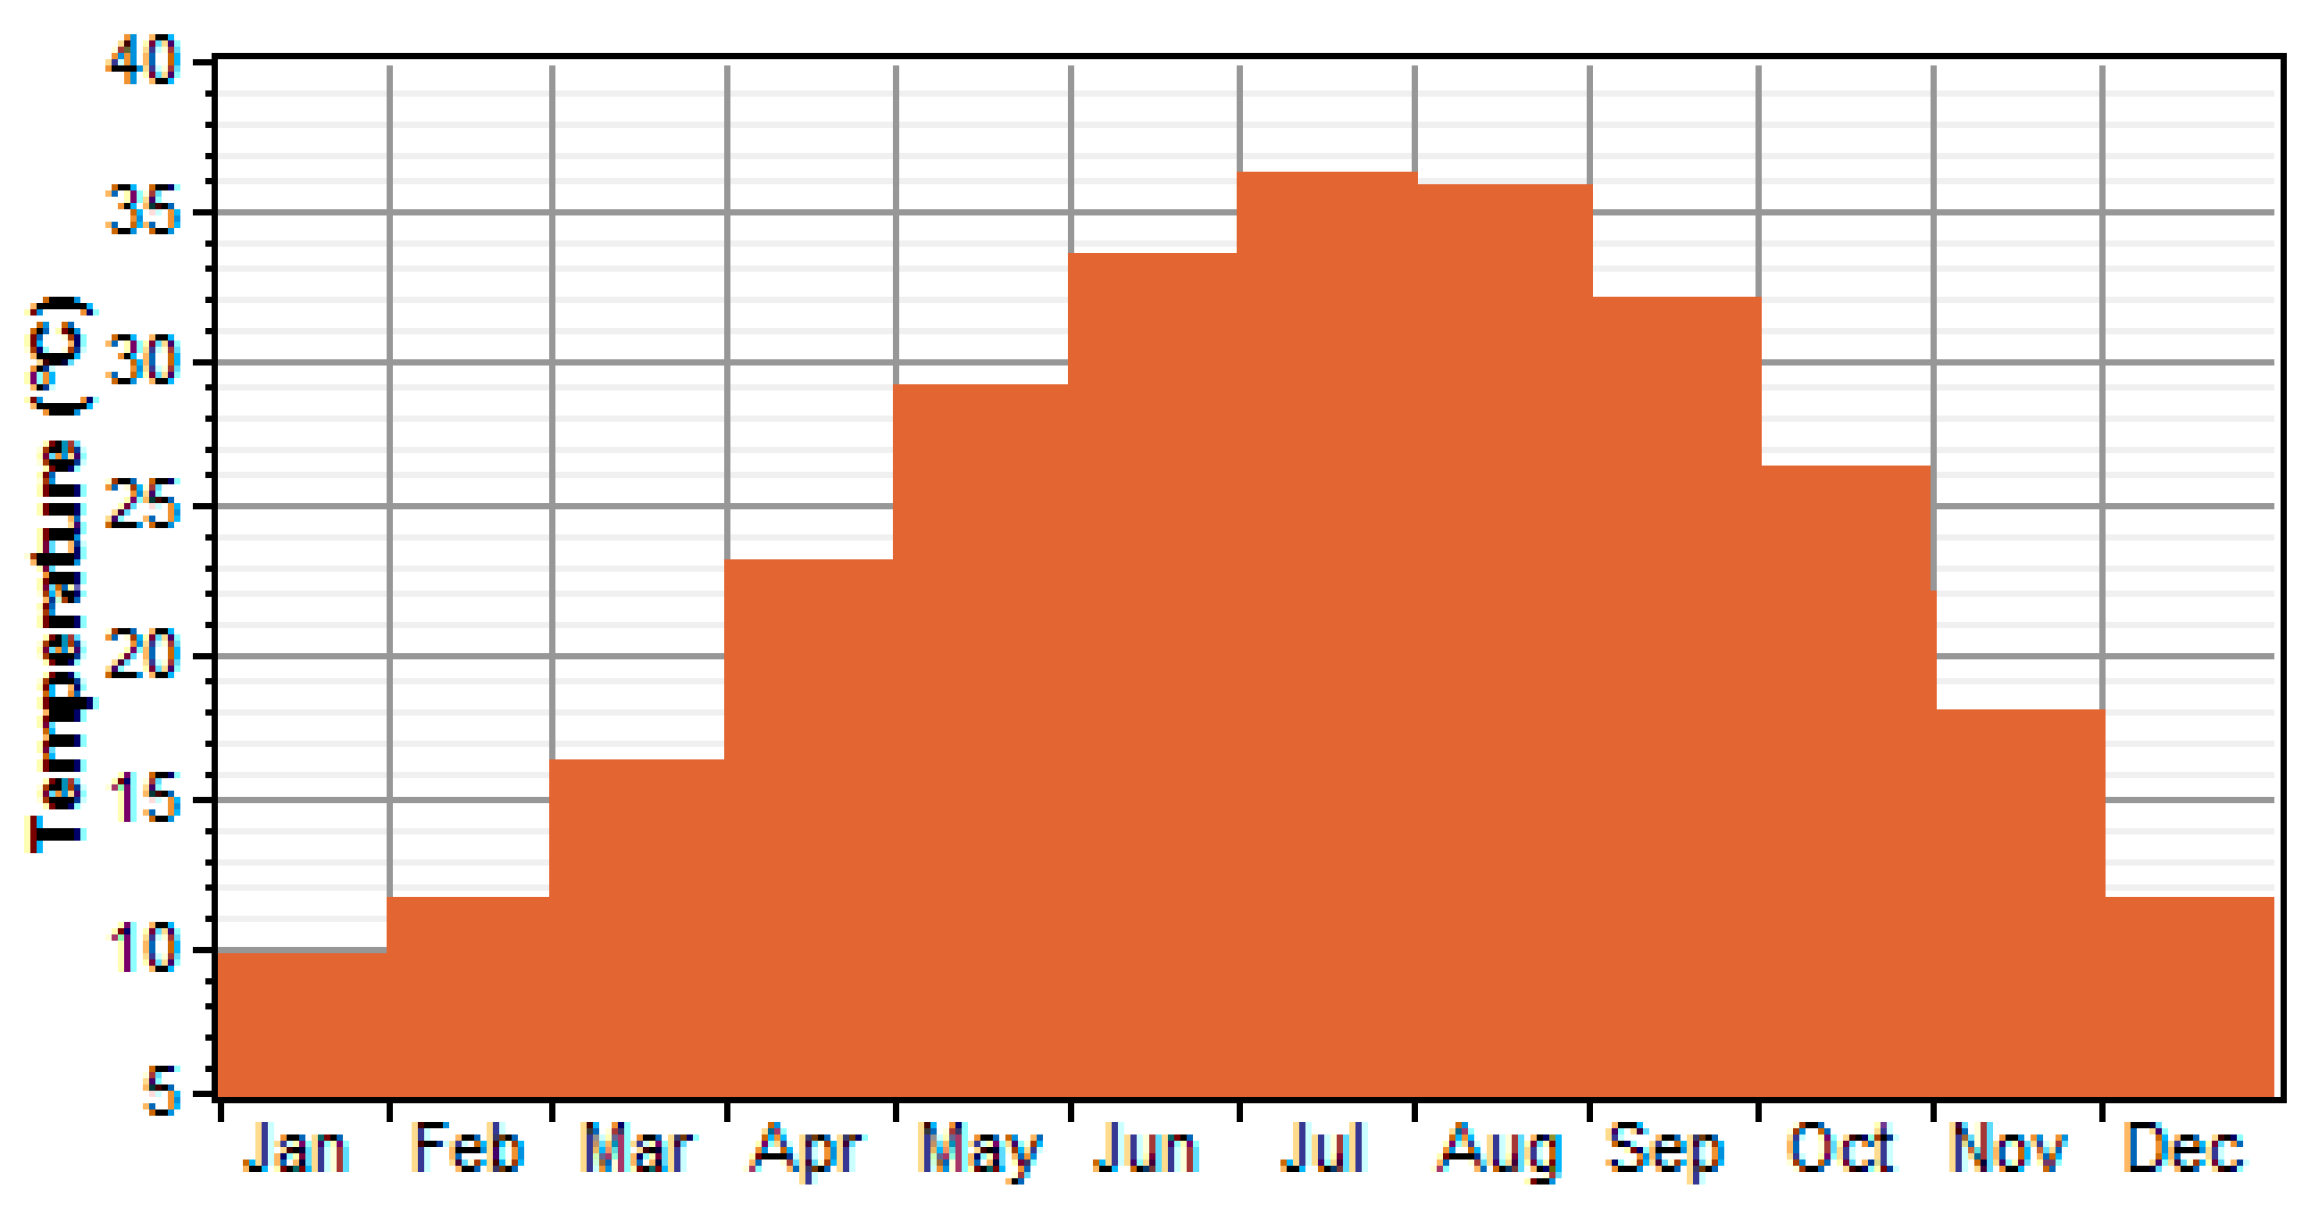
  • The ambient temperature plays a vital role in the performance of PV modules. Therefore, accurate measurement of ambient temperature data is essential. The monthly average ambient temperature for the chosen area is illustrated in Figure 5. The summer season shows the highest ambient temperature, at 36.15 °C in July, and the winter season records the lowest ambient temperature, at 9.77 °C in January. In HOMER software, the ambient temperature is taken into consideration when calculating the output PV power.

2.3. System Components

In this research, the proposed HES consists of four components, i.e., the PV system, diesel generator, converter, and batteries. A schematic diagram of the proposed HES is illustrated in Figure 6. The techno-economic input parameters for all components in the HES are explained in detail in Table 1. Note that the technical parameters and costs of the components were obtained from several references [28,50,51,52]. Regarding the capacity, the optimizer lets HOMER find the optimal sizes for system components.

2.4. Mathematical Representation

2.4.1. Output PV Power

The output PV power is known to be profoundly affected by the amount of the solar radiation available and the temperature. In this respect, the following expression is used in HOMER to compute the output PV power [53,54]:
P P V = Y P V f P V ( G T G T , S T C ) [ 1 + α p ( T c T c , S T C ) ]
where YPV is the PV rated capacity under standard test conditions (kW), fPV is the derating factor of PV, GT is the solar radiation incident on the PV array in the current time step (kW/m2), GT,STC is the incident irradiance at standard test conditions (1 kW/m2), αp is the temperature coefficient of power (%/°C), TC is the temperature of the PV cell (°C) in the current time step, and TC,STC is the temperature of the PV cell under standard test conditions (25 °C).
The PV cell temperature is calculated using the following expression:
T c = T a + ( T c , N O C T T a , N O C T ) ( G T G T , N O C T ) [ 1 η m p , S T C ( 1 α p T c , S T C ) τ α ] 1 + ( T c , N O C T T a , N O C T ) ( G T G T , N O C T ) ( α p η m p , S T C τ α )
where Ta is the ambient temperature (°C), TC,NOCT is the nominal operating cell temperature (NOCT) in (°C), Ta,NOCT is the ambient temperature at which the NOCT is defined (20 °C), GT,NOCT is the solar radiation at which the NOCT is defined (0.8 kW/m2), ηmp,STC is the maximum power point efficiency under standard test conditions (%), τ is the solar transmittance of any cover over the PV array (%), and α is the solar absorptance of the PV array (%).

2.4.2. Economic Model

Considering that the purpose of HOMER is to reduce the costs of system operation and determine the optimum system configuration, economics play a crucial role in this simulation. The optimum combination of the HES components is obtained on the basis of the NPC, which is the sum of all costs and revenues that take place throughout the lifetime of a project. To calculate the total NPC of a system, the following equation is used [55,56]:
N P C = C a n n , t o t C R F ( i , T p )
where Cann,tot is the total annualized cost ($/year), i is the annual real interest rate (%), TP is the project lifetime (year), and CRF is the capital recovery factor, which is given by [55,56]:
C R F ( i , n ) = i   ( 1 + i ) n ( 1 + i ) n 1
where n is the number of years.
Salvage costs (SC), which are the residual values of the system components by the end of the project lifetime, are taken into consideration in the NPC calculation. The following expression is utilized to find the SC [54]:
S C = C R C T r e m T c o m
where CRC is the cost of replacement ($), Trem represents the remaining life of the component (year), and Tcom refers to the component lifetime (year).
COE is the average cost per kWh of producing electricity, given by [53,56]:
C O E = C a n n , t o t E a n n , t o t
where Eann,tot is the total electrical load served (kWh/year).

2.5. Control Strategy

The two control methods of the hybrid PV/diesel/battery system are the LF and CC dispatch strategies. In this study, these two strategies are presented for PV/diesel/battery HES and compared with the proposed combined strategy. The implementation of these strategies in practice can be done using a suitable controller, such as microcontroller, PLC, FPGA, etc.

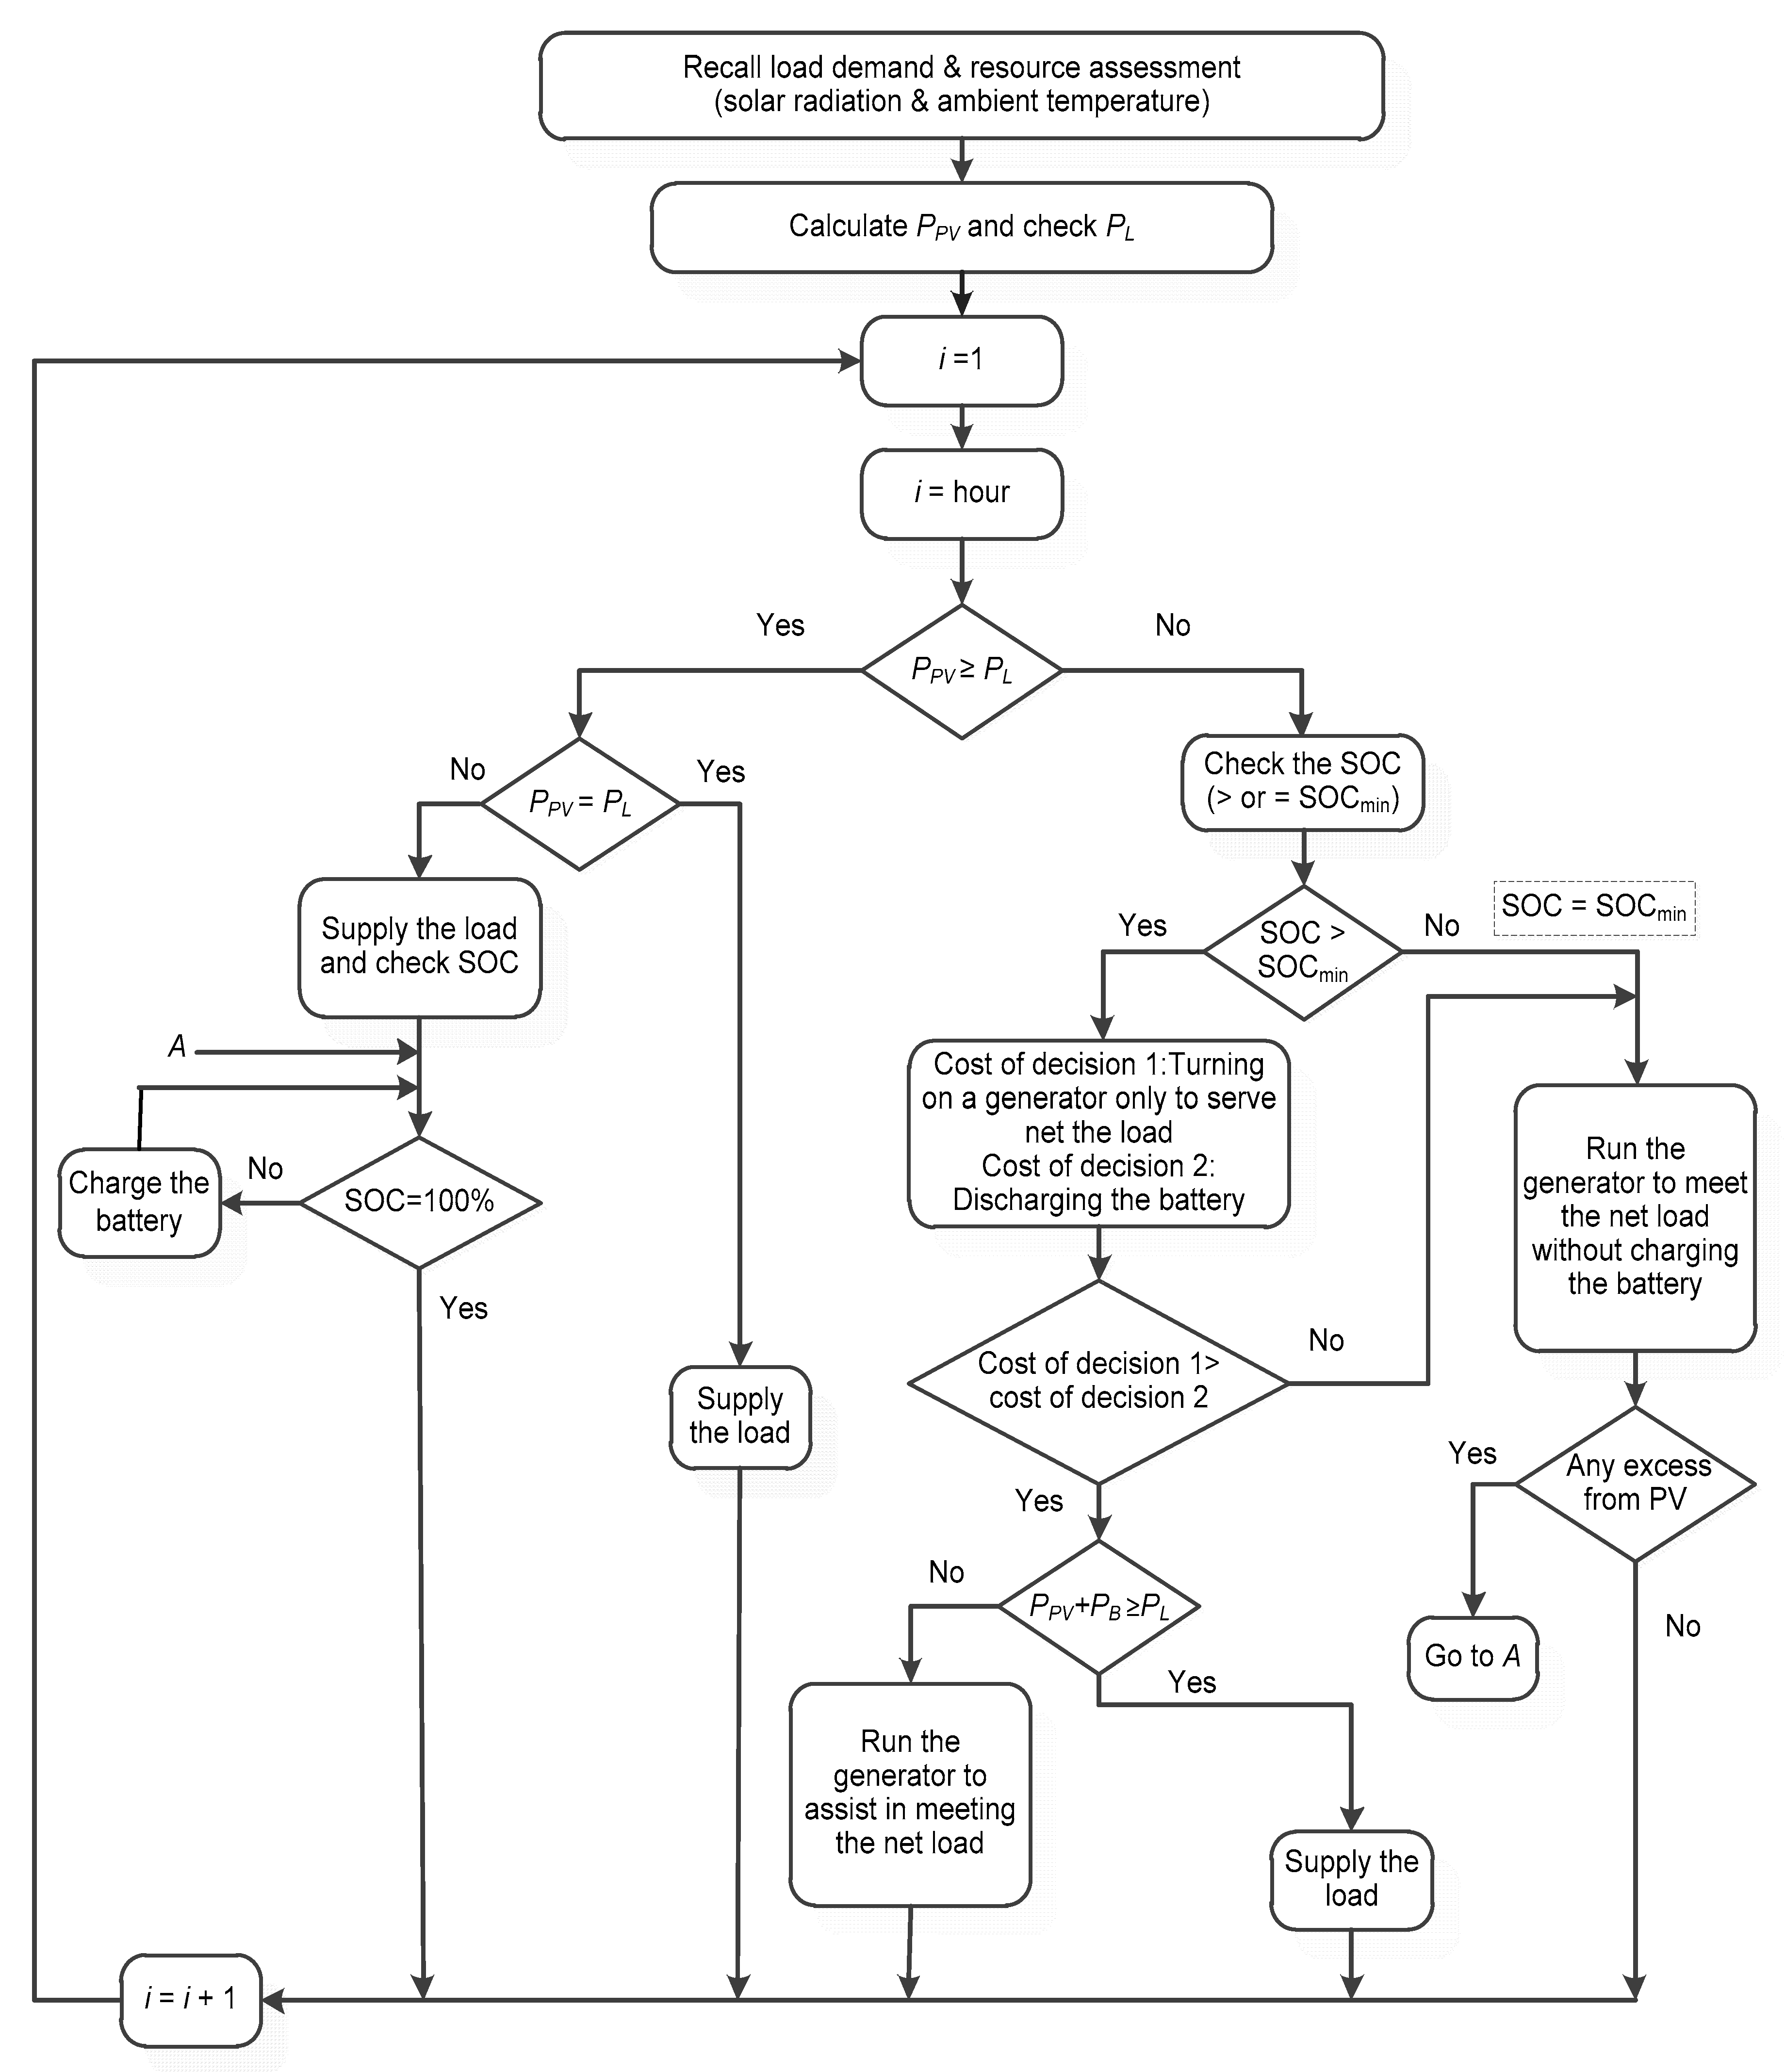
2.5.1. Load Following Strategy

Figure 7 shows the flowchart of the LF dispatch strategy for the PV/diesel/battery HES. The system operation of this model can be classified into three cases as follows:
The first case is when the output PV power is equal to the load power. Here, the PV power meets the load demand, the batteries do not draw any energy, and the generator stays off. In this case, no excess power exists.
The second case takes place when the output PV power is higher than the load power. The PV feeds the load resulting in excess power. In this case, the excess power will be damped if the battery is fully charged. In the case where the battery is not fully charged, the excess PV power is used to charge the battery. The generator also does not work in this case.
The last case is when the PV power is lower than the load power. The two possible subcases are as follows:
  • If SOC = SOCmin, the generator works to feed the net load (load minus renewable power). The generator provides only enough power to satisfy the net load without charging the battery. It is important to mention that if the minimum generator loading output power is higher than the net load, the generator works to feed the load and the excess power from the PV charges the battery.
  • If SOC > SOCmin, a cost of discharging the battery is computed and compared with the cost of turning on the generator that operates only to serve the net load. If the battery discharging cost is higher than the cost of turning on a generator, then the battery would not be discharged while the generator runs and produce enough power to meet the load demand without charging the battery. Otherwise, the battery is discharged. The following equations explain the cost of each decision:
  • The cost of discharging the batteries is calculated using the following equation [16,57]:
    C d i s c h = C b a t t , w e a r .
    Cbatt,wear is the battery wear cost ($/kWh), which is given by [16,57]:
    C b a t t , w e a r = C b a t t , r e p N b a t t Q l i f e η r t
    where Cbatt,rep is the battery replacement cost ($), Nbatt is the number of batteries in the storage bank, Qlife is the single battery throughput (kWh), and ηrt is the battery round trip efficiency (%).
The cost of turning on the generator ($/kWh), in which the generator operates only to serve the net load, is calculated using the following expression [58]:
C g e n = F c o n F p r i c e L s e r v e d G o u t p u t + C g e n , r e p L s e r v e d G l i f e t i m e + C g e n , O & M L s e r v e d
where Fcon is the fuel consumption (L/hour), Fprice is the fuel price ($/L), Lserved is the total load to be served, Goutput is the generator output (kW), Cgen,rep is the replacement cost of the generator ($/kWh), Glifetime is the generator lifetime, and Cgen,O&M is the O&M cost of the generator.

2.5.2. Cycle Charging Strategy

The flowchart of the CC dispatch strategy for the PV/diesel/battery HES is shown in Figure 8. The operating strategy of this system is identical to that of the system utilizing LF dispatch. However, the strategy differs from the LF strategy in that when the generator is switched on, it runs at its maximum rated capacity to supply the net load and charge the battery with excess energy. The following equations explain the cost of each decision:
The cost of discharging the batteries is calculated using [16,57]:
C d i s c h = C b a t t , w e a r + C b a t t , e n e r g y
Battery energy cost, Cbatt,energy ($/kWh) is calculated in time step n using the following expression [57,58]:
C b a t t , e n e r g y , n = i = 1 n 1 C c c , i i = 1 n 1 E c c , i
where Ccc,i is the cost of cycle charging in time step i ($), and Ecc,i is the quantity of energy put into the batteries in time step i (kWh).
The cost of running the generator at maximum capacity to meet the net load and charge the battery is calculated using the following equation [58]:
C g e n , c h = C g e n + C c c C b a t t , e n e r g y
where Ccc here refers to the cost of cycle charge in the current time step, which is calculated using [58]:
C c c = C g e n , m a r g + C b a t t , w e a r .
Cgen,marg is the marginal cost of the generator ($/kWh), which is calculated using the following expression [58]:
C g e n , m a r g = F s l o p e F p r i c e η r t
where Fslope is the slope of fuel curve (L/kWh).

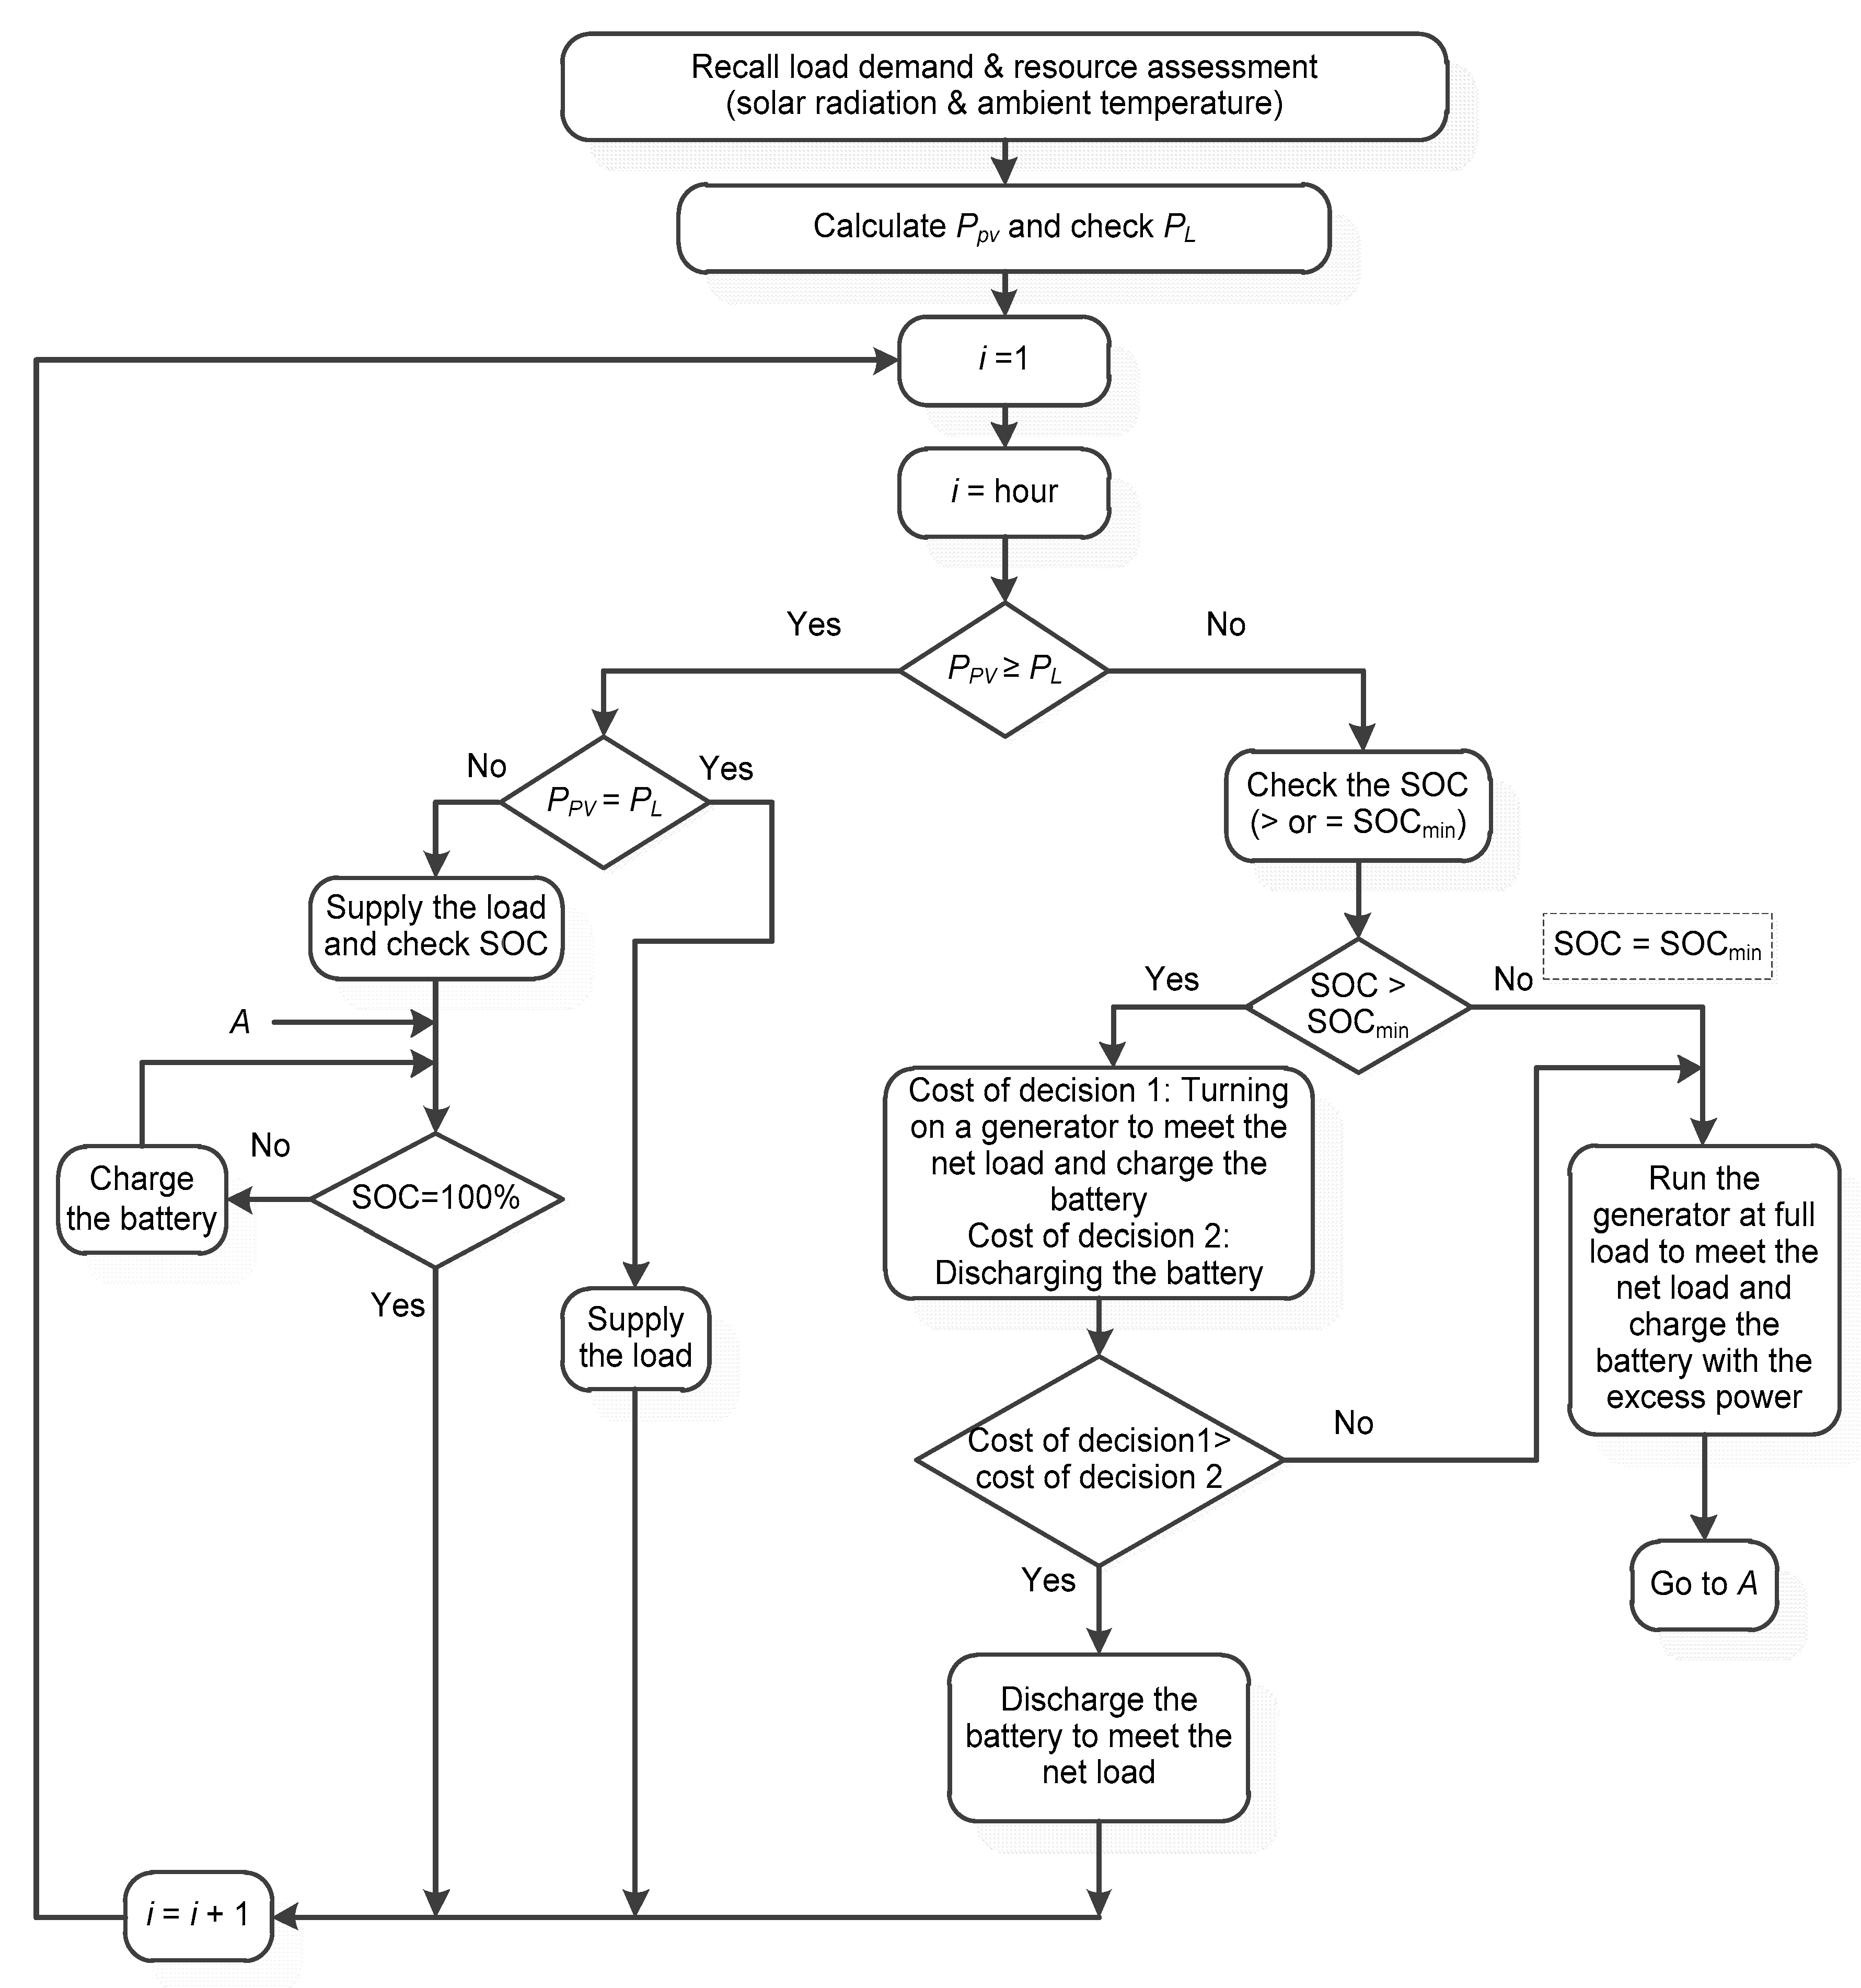
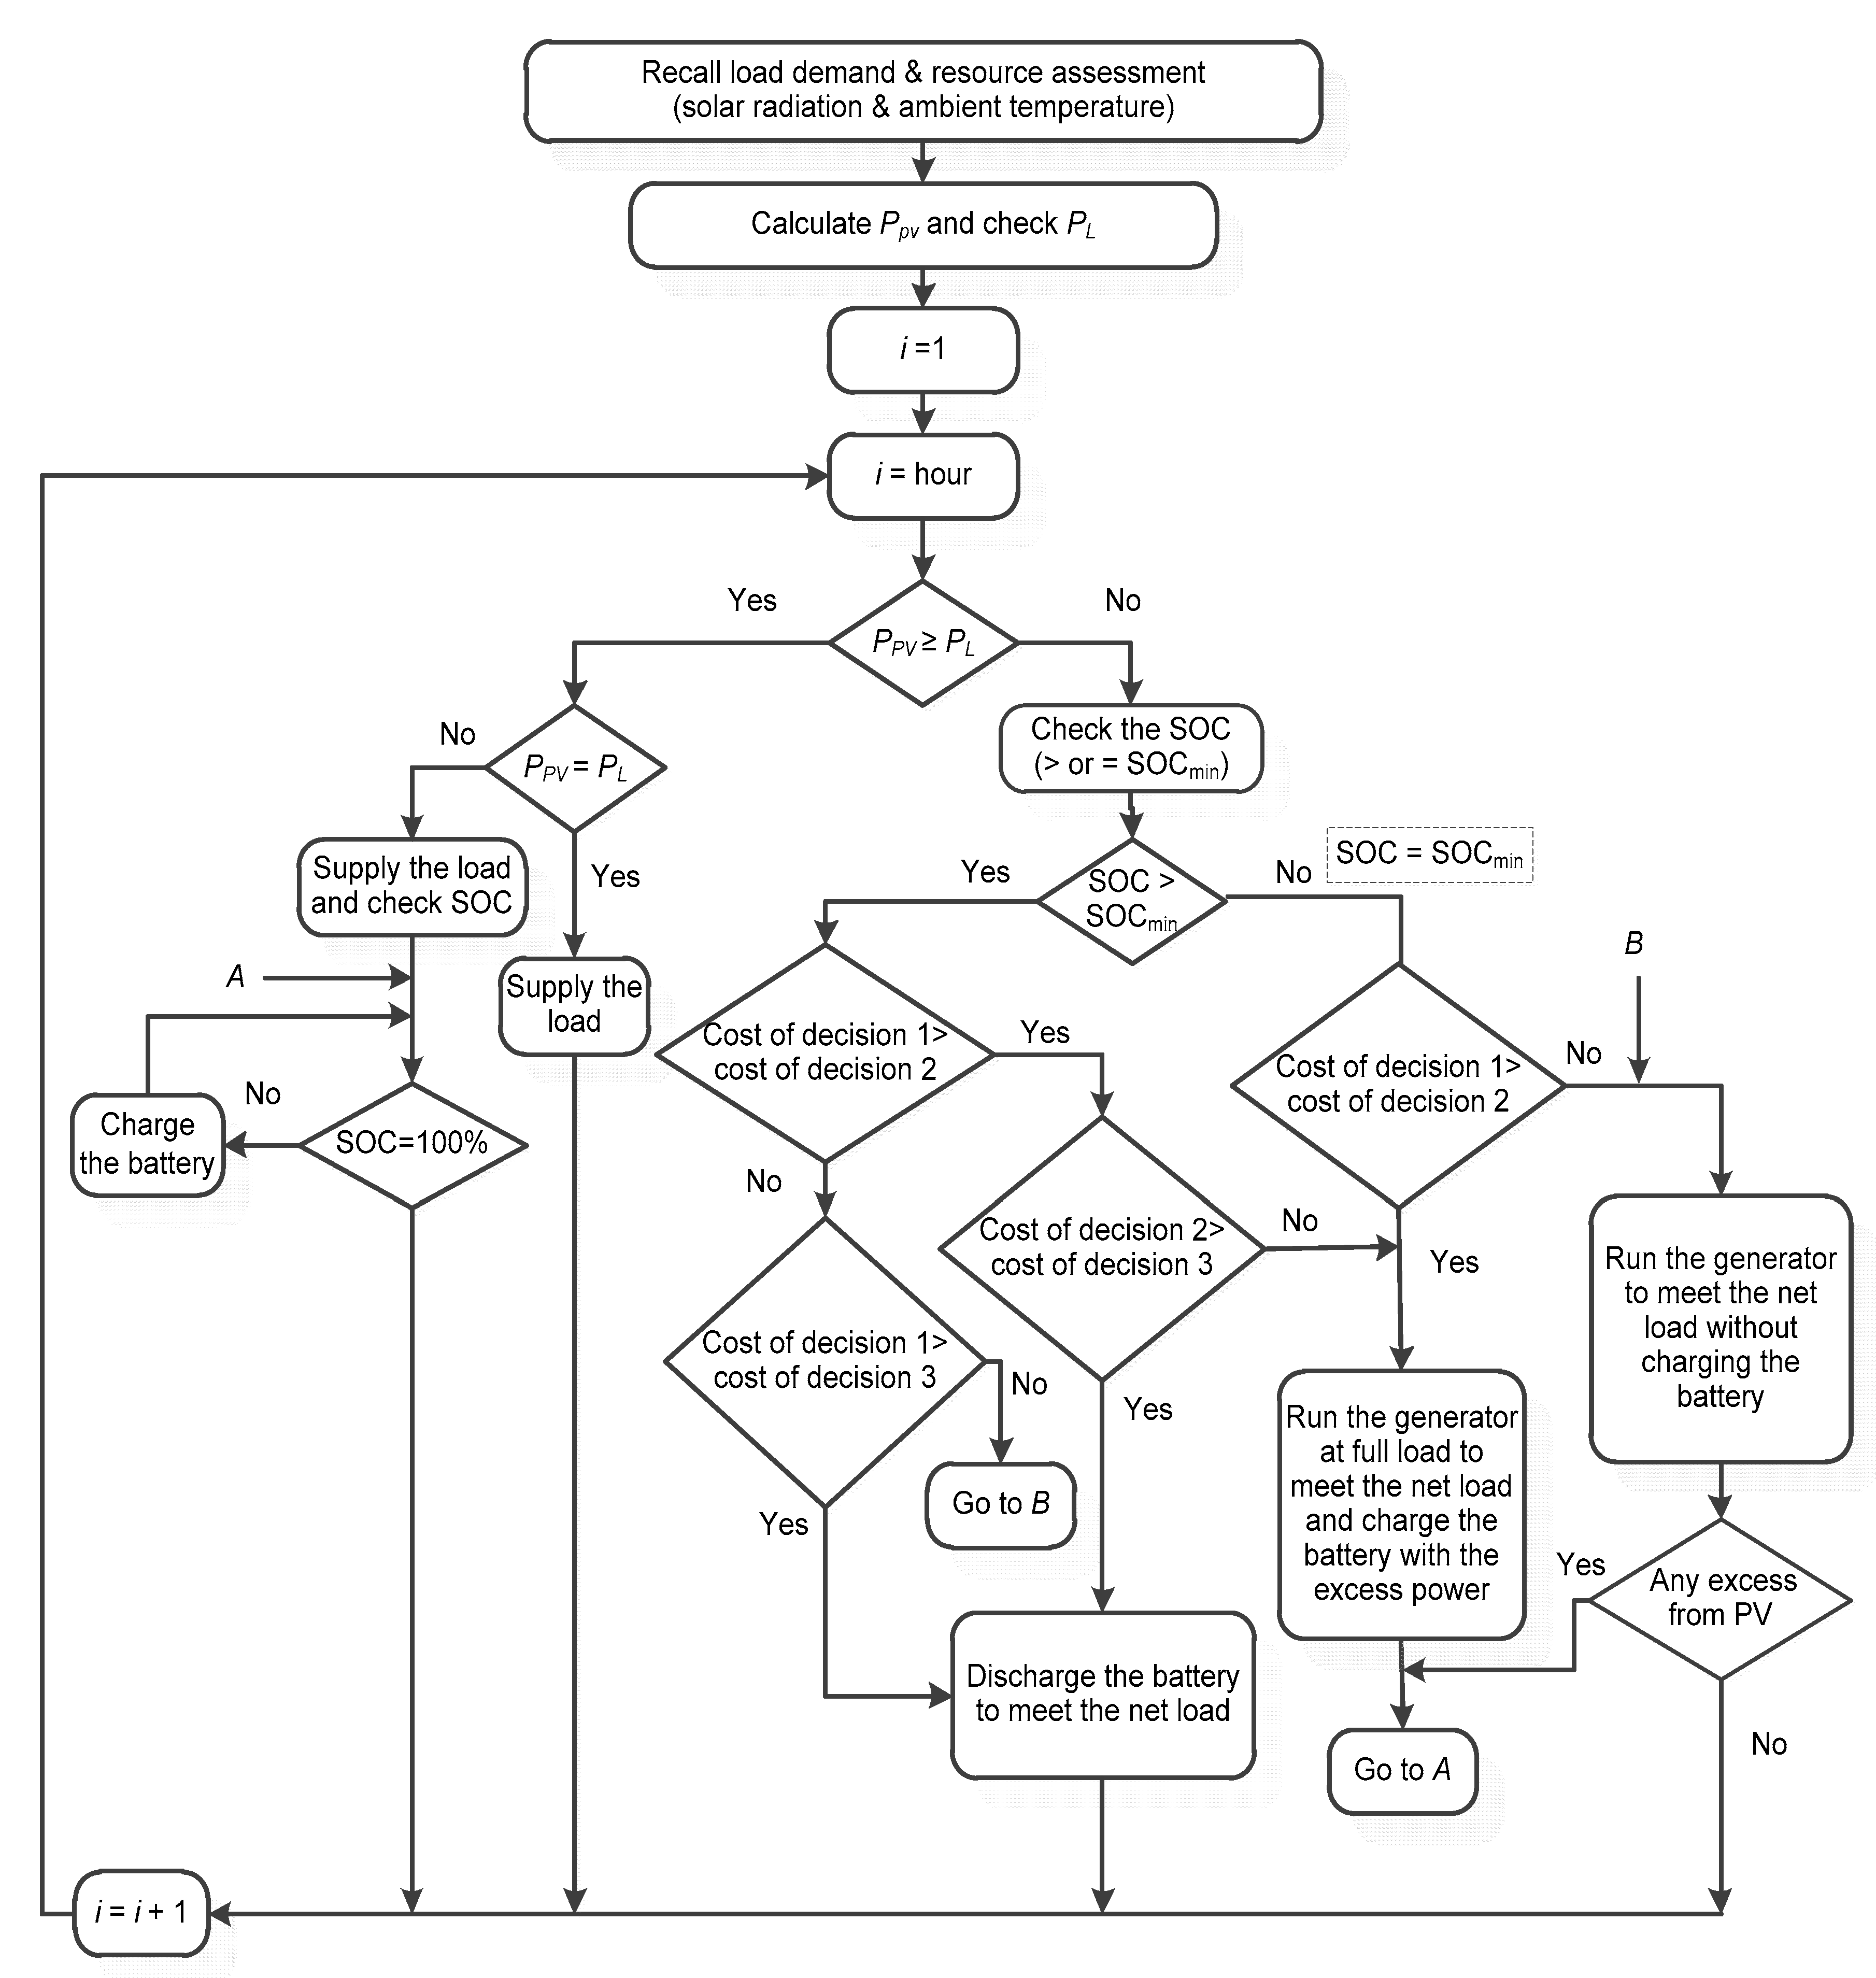
2.5.3. Combined Dispatch Strategy

The decision of charging the battery by the diesel generator depends mainly on the future net load, which is the difference between the load demand and the output power from renewable sources. As predicting the future net load is challenging, the current net load is used in the CD strategy as a proxy for the future net load to investigate whether to charge the battery from the generator. This strategy tends to use the LF strategy when the net load is high and the CC strategy when the net load is low. During a low net load period, the CC strategy avoids the use of the generator. On the other hand, the LF strategy ensures continuous usage of the generator during high net load periods. The flexibility of the CD strategy based on high and low loads makes this model capable of producing better performance in the energy access scenarios compared with individual LF or CC strategies. Figure 9 shows the flowchart of the PV/diesel/battery HES with the CD strategy. As shown in the figure, three dispatch decisions are available in this strategy. At every time step, the CD strategy calculates the cost of each possible decision to obtain the least costly choice. This cost includes expenses in the current time step and the expected value of any change in the battery-stored energy, and a decision is made according to the tradeoff between the marginal cost of operating the generator and the battery wear cost. The details of the three cases are as follows:
The first decision takes place when the generator provides only enough electricity to satisfy the net load without charging the battery.
In the second decision, the generator meets the net load and charges the battery with the excess power.
The third decision is feeding the net load by the battery alone.
The system operation of this model can be explained as follows:
If the PV power is equal to or higher than the load demand, the power flow is the same for that of LF and CC strategies.
If the PV power is less than the load power, the two possible subcases are as follows:
  • If SOC = SOCmin, the controller compares the cost of running the generator to produce only enough power to feed the net load without charging the battery with the cost of running the generator at its maximum capacity to serve the net load and charge the battery with the excess electricity. A decision is made based on the least cost dispatch decision.
  • If SOC > SOCmin, three decision costs are compared with each other, which are: the cost of turning on the generator that operates only to serve the net load without charging the battery, the cost of running the generator at its maximum capacity to serve the net load and charge the battery, and the cost of discharging the battery. The power flow solution is taken place according to the minimum cost decision.

3. Results and Discussion

The simulation results are presented and analyzed in this section. The HES was simulated under the three different dispatch strategies. First, the technical feasibility was examined to investigate the ability of the available energy to satisfy electric load demand throughout the year. Then, the economic viability and environmental effects of the proposed systems were investigated. Finally, a sensitivity analysis was performed to determine the impact of some critical parameters on the system performance. The simulation was performed using an annual discount rate of 7.8% and a 20-year project lifetime. Moreover, the system performance was set at a maximum capacity shortage of 1% and a battery minimum SOC of 25%.

3.1. Optimization Results

A feasible system is one that can meet the load demands. In HOMER, the infeasible systems were excluded, while the feasible ones were filtered and presented by their NPC. A comparison of the optimized PV/diesel/battery systems under different dispatch strategies is provided in Table 2. The results show that best optimal combination of PV/diesel/battery HES under the CD strategy consisted of a 19.4 kW PV, a diesel generator with a 21 kW capacity, 220 batteries, and an 8.05 kW power converter. The system yielded an NPC of $110,191 and COE of $0.21/kWh, which were 20.6% and 4.8% lower than those of systems utilizing the LF and CC strategies, respectively. These results can be interpreted by the fact that the CD strategy obtained the most economical cost dispatch decision between LF and CC at every time step.
In the LF dispatch strategy, better renewable source utilization could be attained because the diesel generator contributed approximately 40.6% of the total energy production, the lowest compared with that in other strategies. This condition led to greater dependency on renewable components, which was in contrast to the CC dispatch strategy, wherein the generator produced a 73.8% share of the total energy production. The renewable fractions of LF, CC, and CD strategies were 44.7%, 18.4%, and 35.6%, respectively. The monthly average electric production for the system under the three dispatch strategies for one year is presented in Figure 10.
In terms of diesel generator performance, the diesel generator under the CD strategy yielded 2171 working hours; these values were lower than those of the LF and CC strategies, and, hence, the higher generator operation life was obtained under this strategy. The results show that the operating lifespans of LF, CC, and CD strategies were 4.08 years, 4.58 years, and 6.91 years, respectively. Moreover, it was found that the generator under the CD strategy consumed the lowest amount of diesel with 10,574 L/year, which was 1.7% and 23% lower than the system under the LF and CC strategies, respectively. Figure 11 shows the fuel consumption duration curve for the system under the three dispatch strategies for the entire year. It is evident that despite the fact that the generator working hours of the LF strategy were more than those of the CC strategy, the fuel consumption of the LF strategy was lower than that of the CC strategy. This is because the generator under the LF strategy produced only enough power to feed the load, in contrast to the CC strategy, in which the generator operated at its maximum rated capacity to supply the load and charge the battery; hence, more diesel would be consumed.
Battery energy storage is a critical component of standalone HESs because this parameter affects the reliability of meeting loads. Battery throughput (kWh/year) is a performance measure defined as the amount of energy that cycles through the storage bank in one year. Battery throughput affects the battery operational lifetime; the lower the annual battery throughput (lower charge/discharge cycles per year), the higher the battery lifetime [59]. Figure 12 shows the battery input/output energies under the three different strategies. Since the use of the battery in the LF strategy was limited, the LF strategy presented the lowest amount of input/output energy, followed by the CD strategy and the CC strategy, which showed the highest amount of input/output energy. These results show the LF strategy presented the lowest annual battery throughput, which was estimated to be 54.15 kWh, in contrast to the CC strategy, which had a yearly throughput of 79.9 kWh. The annual throughput of CD was calculated to be 70.76 kWh.
Battery autonomy refers to the number of hours a battery can support the critical load without charging during the main failure. Achieving some battery autonomy is necessary, especially during the rainy season when the output PV power cannot meet the load demand [60]. The simulation results indicate that the battery autonomy of the LF strategy was 8.94 h, which was the highest among those of other strategies. This result is due to the high nominal capacity of the system under this strategy. The battery autonomy values of the CC and CD strategies were 4.17 and 6.55 h, respectively.

3.2. Economic Analysis of the System under the Three Dispatch Strategies

A cost summary of the system under all dispatch strategies is shown in Figure 13. The following bullets describe the cost analysis for each configuration:
  • The lowest capital cost was achieved by using the CC strategy ($32,537), followed by the CD strategy ($50,042). The system under CC had a capital cost of $64,779, which was the highest among the systems compared, because of the large sizes of renewable components.
  • Once installed, the PV, converter, and batteries under all strategies were inexpensive to operate and maintain compared with the diesel generator, which contributed most of the total O&M cost. The CD strategy was found to have the lowest O&M cost, which was $18,172, i.e., 37.7% and 21.9% lower than those of LF and CC, respectively.
  • The replacement cost of the LF, CC, and CD strategies were $9005, $8457, and $5135, respectively. The CD strategy had the lowest cost because it depended less on the diesel generator, which led to making this strategy have the highest generator lifetime as compared to other strategies.
  • The fuel cost of the CD strategy was $42,016, which was lower than that of the other strategies, because of the relatively low fuel consumption in this strategy. The fuel costs of the LF and CC strategies were $42,742 and $55,182, respectively.
  • The salvage costs over the project lifetime of the LF, CC, and CD strategies were estimated to be $–6974, $–3727, and $–5174, respectively; these costs originated from the remaining life of the system components.

3.3. Environmental Assessment

Consumption of diesel has a negative impact on the environment and is harmful to human health, since different kinds of gaseous pollutants are emitted during the process. These emissions include nitrogen oxide (NOx), sulfur dioxide (SO2), particulate matter (PM), unburned hydrocarbon (UHC), carbon monoxide (CO), and carbon dioxide (CO2) [61]. The HESs have positive effects on the environment. Combining PV with the diesel and battery is capable of reducing the emissions significantly [31]. The releasing of annual emissions for the HES under different control strategies has been determined and demonstrated to compare the cases from the environmental standpoint. Table 3 presents the greenhouse emissions of PV/diesel/battery with LF, CC, and CD strategies. It is obvious that the system with CD was the most environmentally friendly option by having the lowest amount of CO2 emissions (27,678 kg/year), in contrast to the system with the CC strategy, which had CO2 emissions of 36,352 kg/year. The CO2 emissions of the system with the LF strategy were calculated to be 28,157 kg/year. These results were achieved according to the resulting fuel consumption presented in Table 2, which indicates that the diesel generator under the CD strategy yielded a fuel consumption of 10,574 L/year, lower than that of the LF and CC strategies. As a result, minimum greenhouse emissions were obtained under this strategy.

3.4. Energy Balance of the Optimized Systems

In order to have a better understanding of the system operation, details of the system’s power flow and the battery status during 24 h in April for LF, CC, and CD strategies are provided in this section. The energy flow and the battery status for each strategy are explained in the following points:
  • LF strategy: Figure 14 shows the energy balance and battery SOC of the proposed HES under LF strategy. At the start of the day (00:00–05:30), the battery discharged its power to supply the load alone. At 05:30, the PV array began producing power, but it was not enough to meet the load; therefore, the batteries continued to discharge their power for half an hour. At 06:00, the batteries reached their minimum SOC, so the generator worked to meet the load while the batteries were charged by the excess power from PV until 07:00. For the period between 07:00 and 13:30, PV power was sufficient to fulfill all demand and charge the battery. From 13:30 to 16:30 the generator restarted and worked together with the PV. From 16:30 to 18:30, the batteries discharged to help the PV and the generator in satisfying the load. At 18:30, the PV power became zero, and the load was met by the generator and the batteries for the rest of the day.
  • CC strategy: The energy balance and battery SOC of the proposed HES under CC strategy is depicted in Figure 15. For the first few hours (00:00–05:30), the load was served by the battery, similar to the LF strategy. From 05:30 to 07:00, both the PV and battery shared to satisfy the load. From 07:00 to 10:00, the generator produced power so that both the PV and generator could serve the load. Since it was a cycle-charging scheme, the excess power of the generator was used to charge the battery. The load was satisfied by the PV, which also charged the batteries from 10:00 to 12:30. At 12:30, the PV output showed a decrease in its output power; therefore, the batteries discharged their power to compensate for the required power and continued to do so until 15:30. At 15:30, the generator worked with the PV to feed the load and charge the batteries. The PV output fell to zero at 18:30 and the generator continued to feed the load for the remaining time of the day.
  • CD strategy: Figure 16 presents the energy balance and battery SOC of the proposed HES under CD strategy. As in the LF and CC strategies, the load was served by the battery alone from 00:00 until 05:30. From 05:30 until 15:30, the PV supplied the load and charged the battery during the high solar radiation hours, while the batteries discharged their power to share with the PV in satisfying the load during the low solar radiation hours. Around 15:30, the generator operated at its maximum rated capacity to share in meeting the load with the PV and charged the batteries by the excess power. This case represented the CC strategy, which continued until 18:30. After 18:30, the PV output became zero, and the generator produced only enough power to satisfy the load without charging the battery. This case referred to the LF strategy and continued until 19:30. The CC strategy took place again from 19:30 to 21:30. In the period from 21:30 to 22:00, the generator and the batteries shared to feed the load. At 22:00, the generator turned off, and the load was served by the batteries for the remaining time.

3.5. Sensitivity Analysis

In this part of the study, sensitivity analysis was conducted to investigate the effect of important parameters on the system performance. The parameters considered for sensitivity analysis were battery minimum SOC, time step, solar radiation, diesel price, and load growth.

3.5.1. Battery Minimum SOC
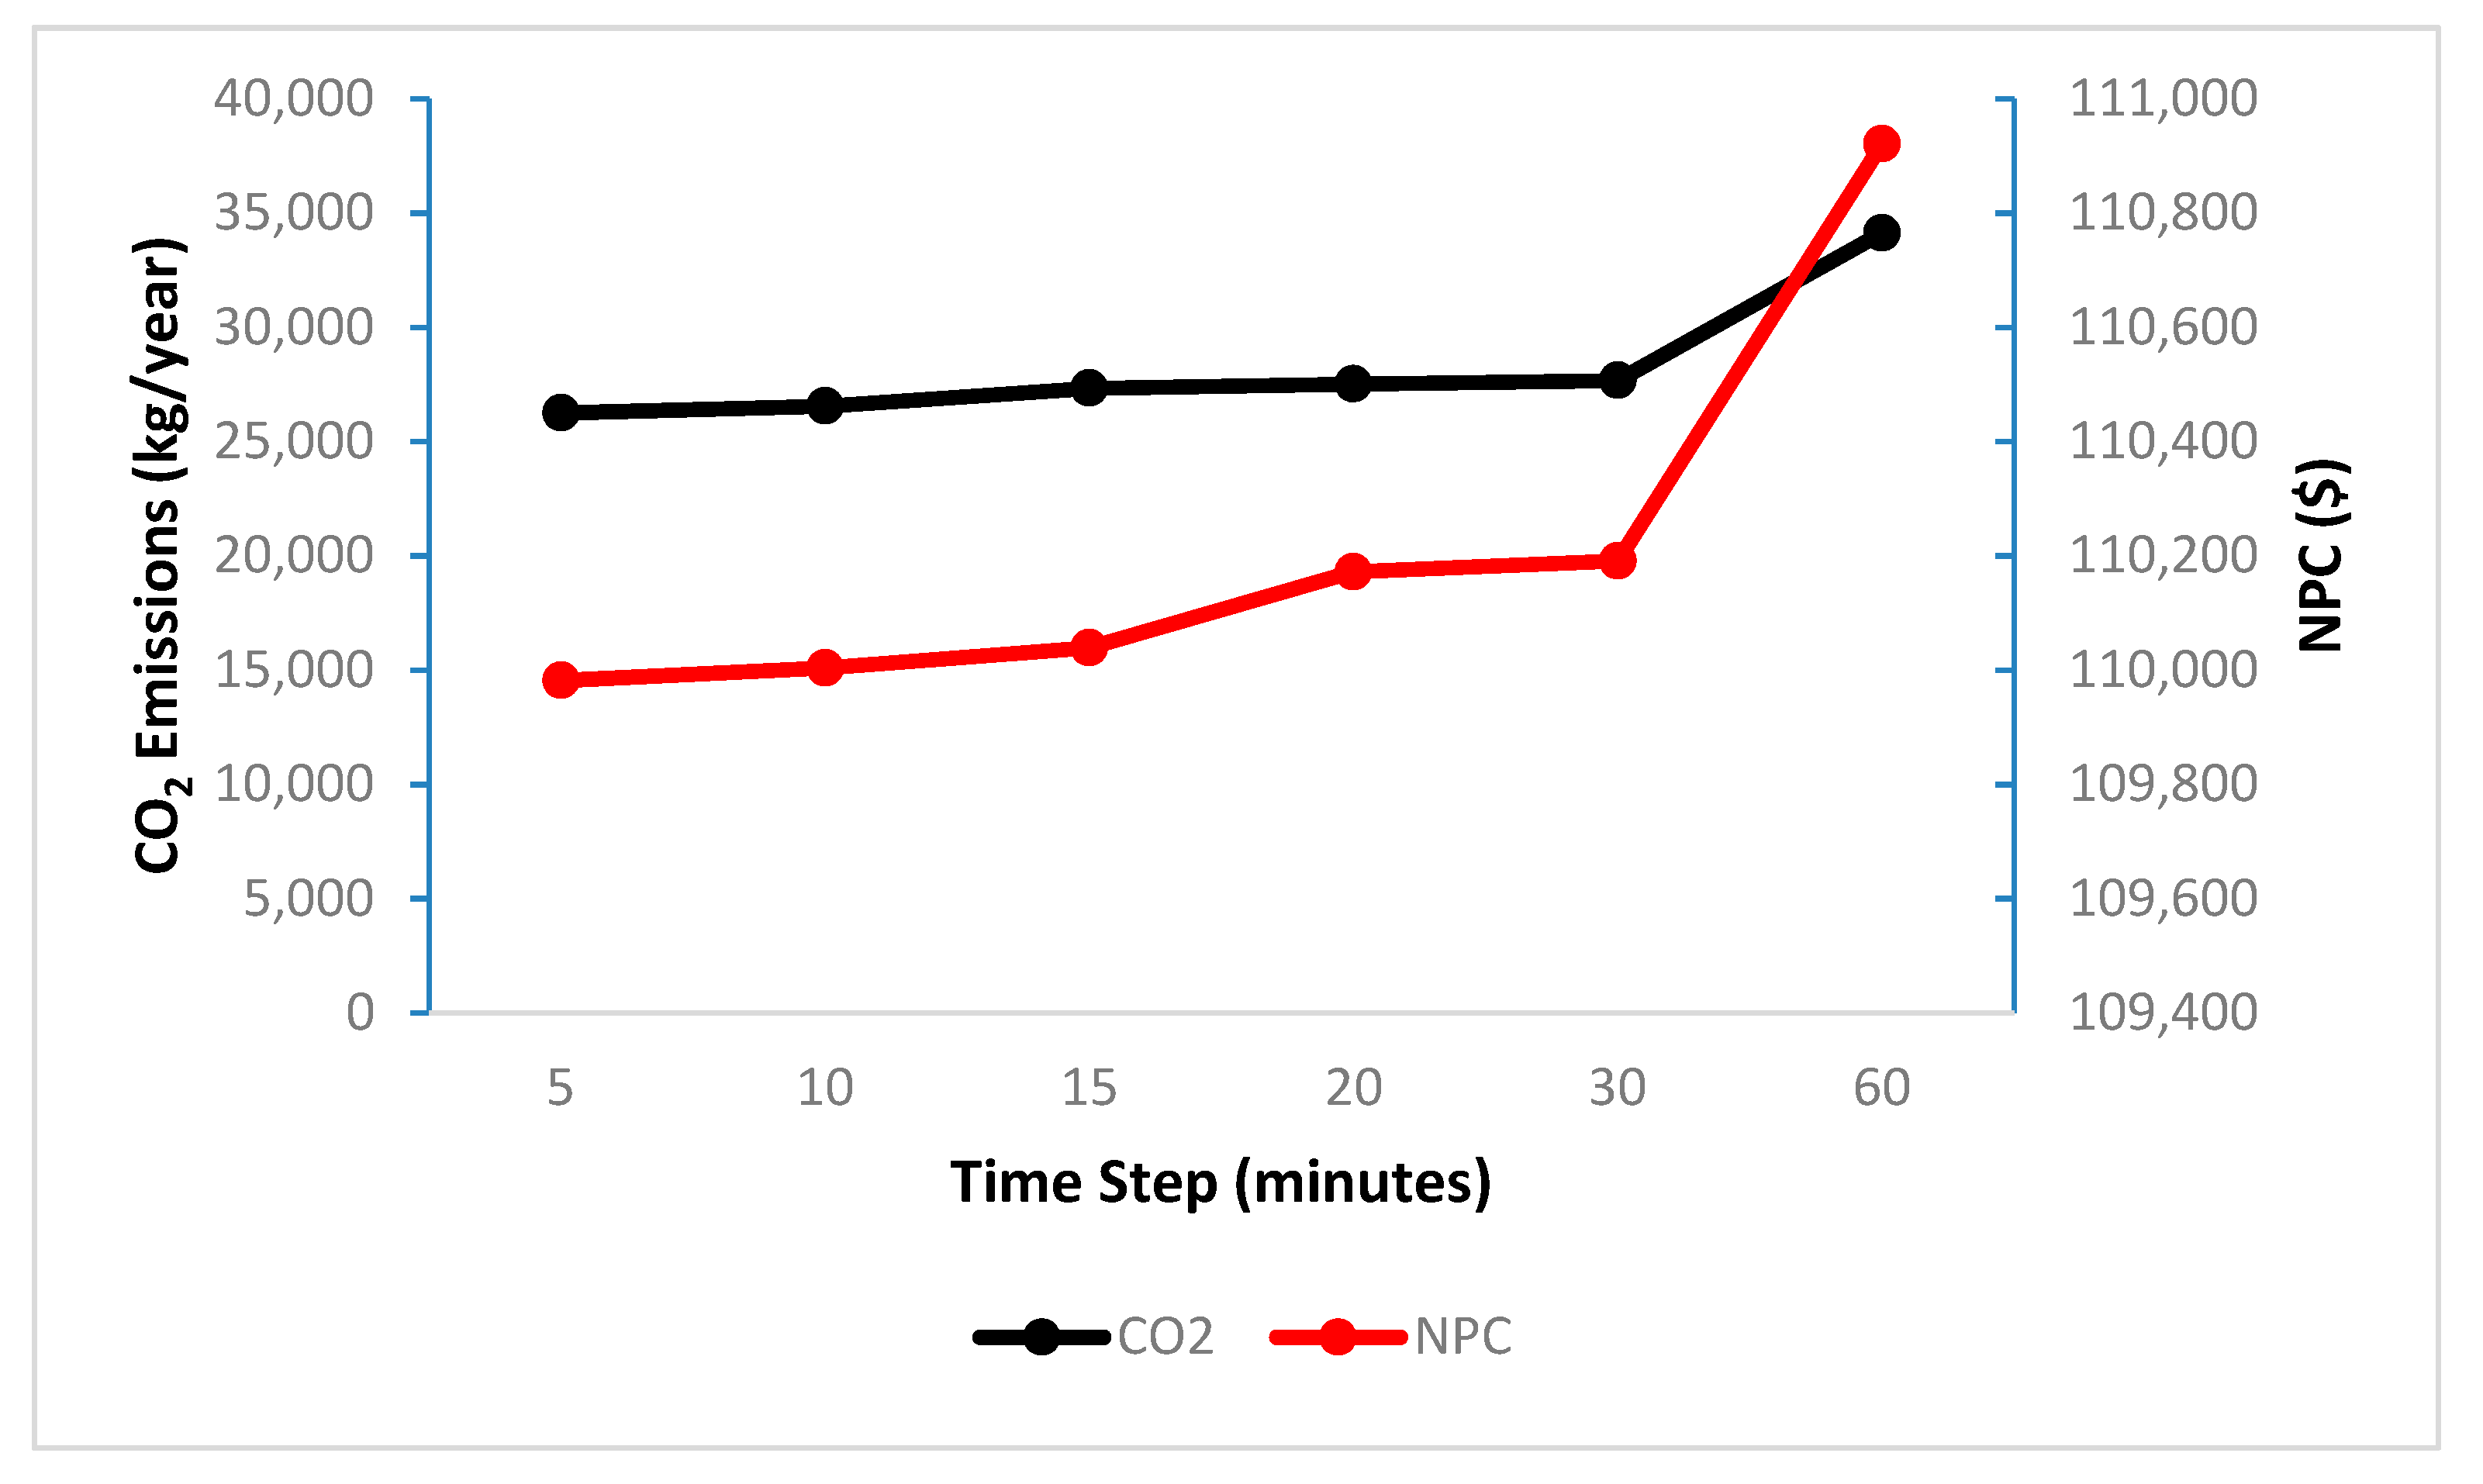
Battery SOCmin is the lowest acceptable battery charge level. The battery level is never drawn below the SOCmin, which is given as a percentage of the total capacity. In this part, the impact of the SOCmin on the system performance was investigated. The variations in SOCmin were set to 15%, 20%, 25%, 30%, 35%, and 40. Figure 17 shows a graph of the total NPC and CO2 emissions cost as a function of SOCmin variation. As can be seen in the Figure, when the SOCmin increased from 15% to 40%, CO2 emissions increased from 25,468 kg/year to 34,159 kg/year. This result indicated that an increase in SOCmin would increase the system’s dependence on the diesel generator to supply the load demand and charge the battery, resulting in greater CO2 emissions. Moreover, NPC increased from $107,637 to $114,274. However, researchers have recommended that the SOCmin not be set to an extremely low value to avoid damaging the storage bank by excessive discharge [62,63,64,65].

3.5.2. Time Step

The system operation was simulated by performing energy balance calculations in every time step for 8760 h in a year. A comparison between the output power of the available energy sources and load demand was conducted at every time step, and the flow of energy from and to every component in the system was investigated. For a system that included a generator and a battery, a decision was made at each time step on the operation of the generator and whether to charge or discharge the battery. Sensitivity analysis was performed in this section to evaluate the effect of time step variations from 5 min to 1 h on the system performance. As shown in Figure 18, the best economic performance was achieved by setting the time step to 5 min, which gave an NPC of $109,982. This can be explained by the fact that reducing the time step led to an increase in the number of times of cost comparison, which led to a minimum possible cost. At the same time, the most environmentally friendly system could also be obtained when the time step was set to 5 min; in such a case, the CO2 emissions were 26,257 kg/year.

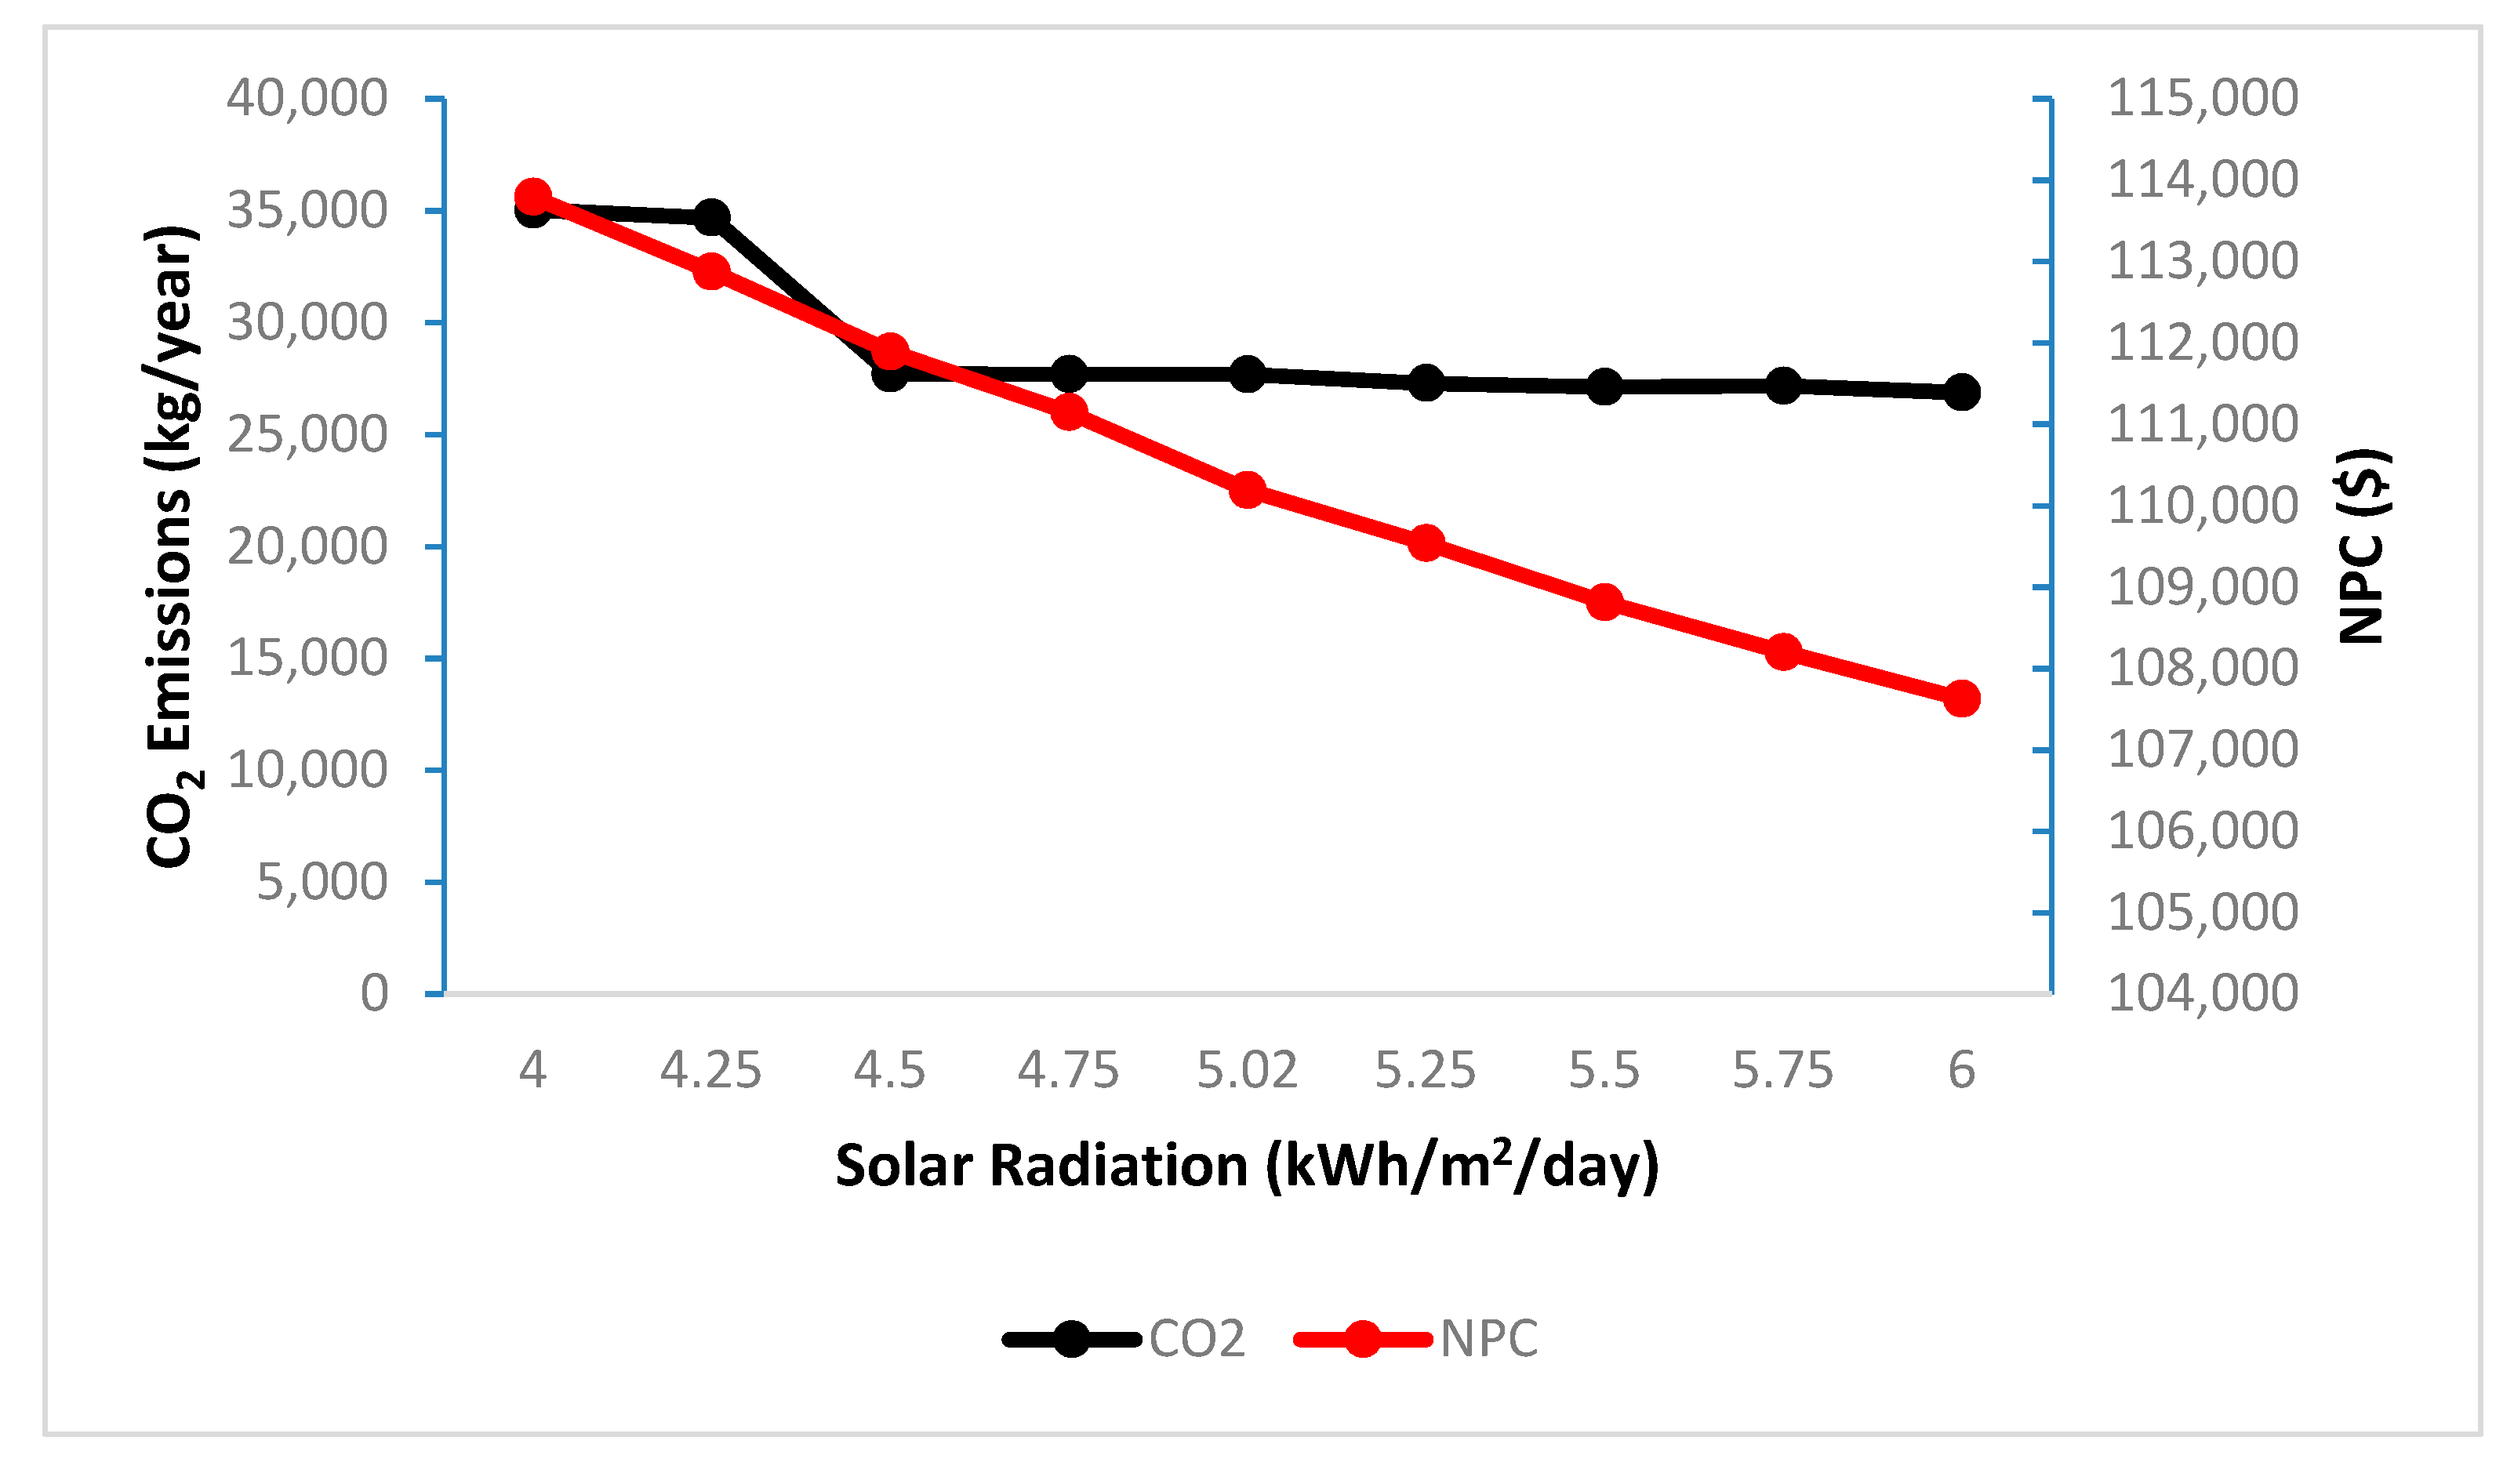
3.5.3. Solar Radiation

Global solar radiation intensity and the efficiency of the solar panels play a significant role in the harvesting of solar energy in the HESs. The power produced by the PV panels increases when the solar radiation increases and vice-versa; hence, the variation of solar radiation can significantly affect the performance of the system. In this subsection, the annual average global solar radiation was varied between 4 kWh/m2/day and 6 kWh/m2/day. Figure 19 shows the graph of NPC and CO2, with the variation of solar radiation. The NPC and CO2 of the system decreased from $113,792 to $107,627 and from $35,038/kWh to $26,874/kWh, respectively, when solar radiation increased from 4 kWh/m2/day to 6 kWh/m2/day. The decrements of NPC and CO2 occurred because the increase of solar radiation increased the output power of PV; hence, the generator operation hours and fuel consumption were reduced.

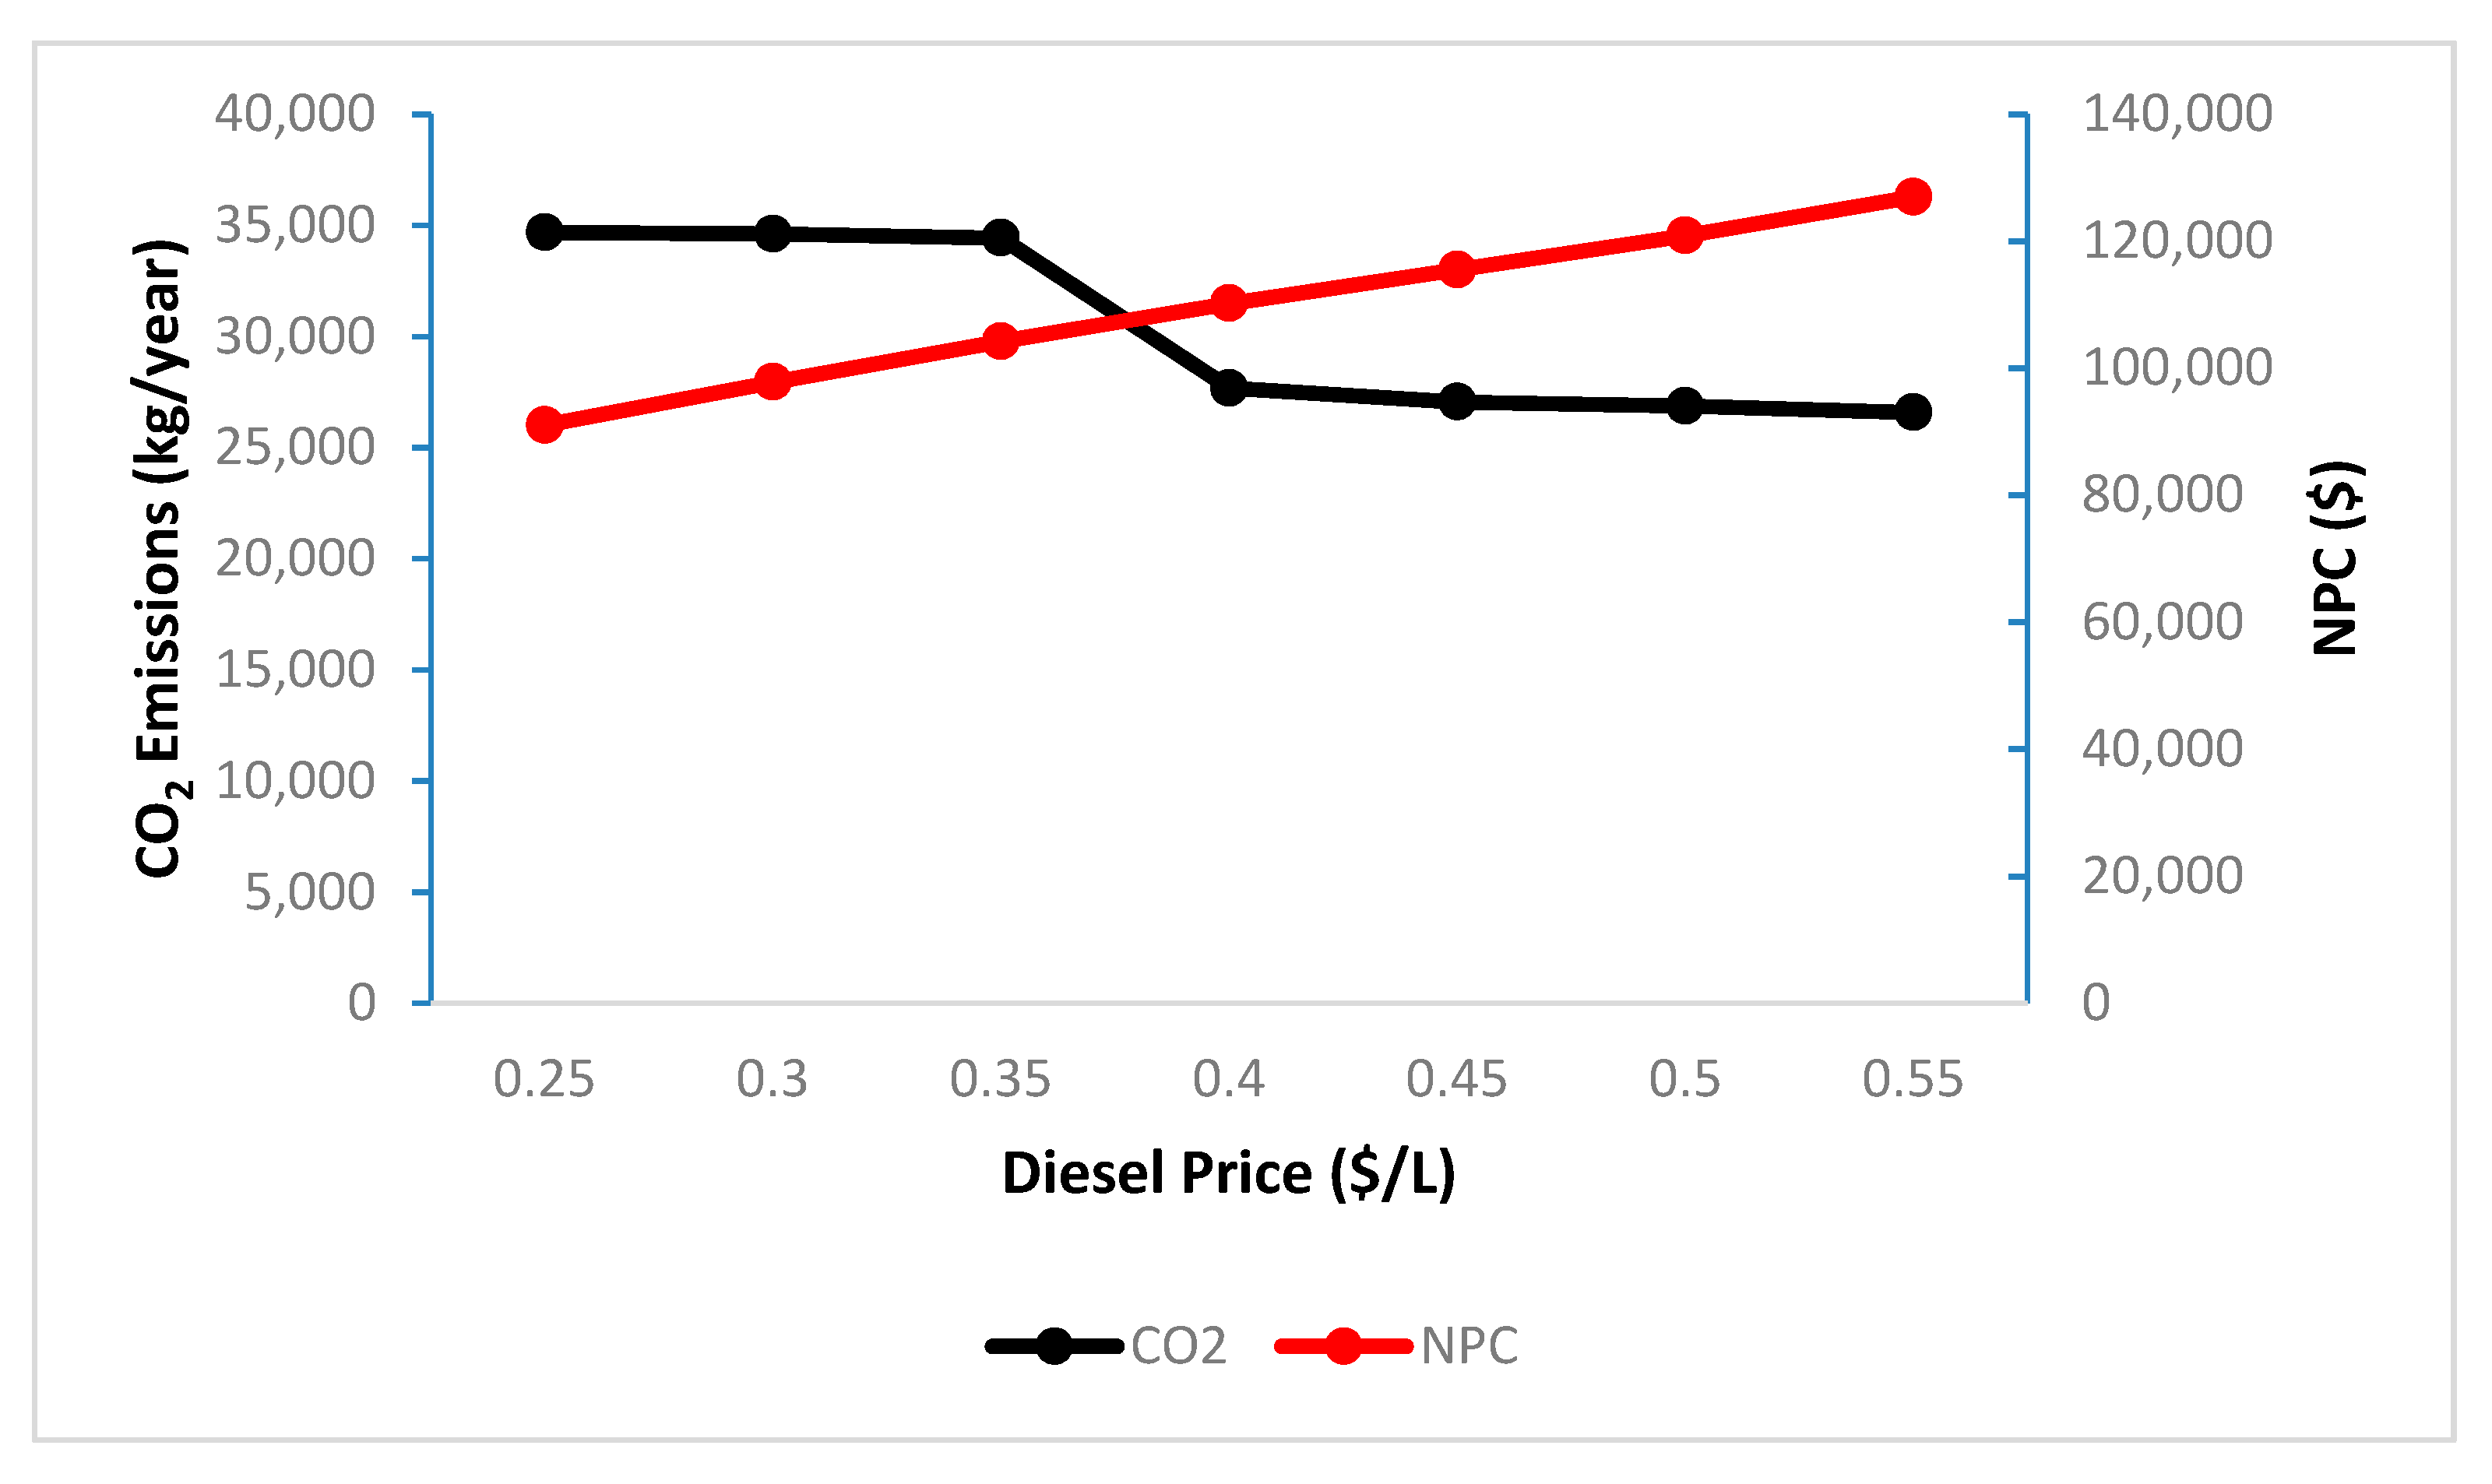
3.5.4. Diesel Fuel Price

It is well known that the fuel price fluctuates continuously. The fuel price fluctuations encourage the use of renewable energy technologies, which offer stabilization of electricity costs [59]. The current price of diesel in Iraq is about $0.4/L with some variability from time to time. To investigate the effect of diesel fuel variation on the system performance, a sensitivity analysis was done by varying the price between $0.25/L and $0.55/L. The impact of diesel price variation on the NPC and CO2 is depicted in Figure 20. It is obvious that with the rise in diesel fuel price from 0.25/L and $0.55/L, CO2 emissions decreased from 34,683 kg/year to 26,578 kg/year while NPC increased from $91,051 to $126,989. These results can be explained by the fact that a rise in diesel price led to making the utilization of the diesel generator less competitive. Therefore, the generator working hours were reduced, which affected the optimal power flow of the system.

3.5.5. Load Consumption Growth

The output power of an energy system depends on the load requirements that should be satisfied all the time. If the load consumption increases, the energy production should imperatively be increased. The load demand is usually varied from time to time. In this subsection, different load consumptions (145, 150, 155, 160, 165, 170, 175, and 180 kWh/day) were considered to investigate their impact on the system performance. The effect of load consumption growth on the NPC and CO2 is presented in Figure 21. The results indicate that NPC and CO2 of the system increased by 22.6% and 52.3%, respectively, when the load consumption increased from 145 kWh/day to 180 kWh/day. The increments of NPC and CO2 were mainly due to the increase of the required capacity of the different components of the system, including the diesel generator to increase the energy productions of the system.

4. Conclusions

Optimization of energy sources is a critical key in the assessment of the feasibility of HESs. This study presents an optimal plan and design by providing a systematic techno-economic and environmental evaluation of a PV/diesel/battery off-grid configuration for a rural area in Iraq. Three different control strategies were proposed in this study, i.e., LF, CC, and CD. HOMER software was used to evaluate the overall analyses, including the optimization and sensitivity. The cost analysis results show that the combination of 19.4 kW PV, a diesel generator with a 21 kW capacity, 220 batteries, and an 8.05 kW power converter with the CD strategy was the optimal solution for this case study by having an NPC of $110,191 and a COE of 0.21 $/kWh, which were 20.6% and 4.8% less expensive than the systems under the LF and CC strategies, respectively. Moreover, minimum fuel consumption made the CD dispatch strategy the most suitable option for the environment, considering its CO2 emissions of 27,678, which were 1.7% and 23.9% lower than those of the LF and CC strategies, respectively. Furthermore, sensitivity analysis showed that variations in some important parameters, such as battery minimum SOC, time step, solar radiation, diesel price, and load growth, had significant effects on system performance. This study could play a vital role in decision making towards better energy management strategies.

Author Contributions

A.S.A. contributed theoretical approaches, simulation, and preparing the article; M.F.N.T. and M.R.A. contributed on supervision; M.A.M.R. and S.M. contributed on article editing.

Funding

This research was funded by the Ministry of Education (MOE) Malaysia, grant number FRGS/1/2015/TK10/UNIMAP/03/2.

Acknowledgments

The authors would like to thank the Universiti Malaysia Perlis and the Ministry of Higher Education (MOHE) Malaysia for providing the facilities and financial support (Fundamental Research Grant Scheme (FRGS) under a grant number of FRGS/1/2015/TK10/UNIMAP/03/2).

Conflicts of Interest

The authors declare no conflicts of interest.

References

  1. Mehrpooya, M.; Mohammadi, M.; Ahmadi, E. Techno-economic-environmental study of hybrid power supply system: A case study in Iran. Sustain. Energy Technol. Assess. 2018, 25, 1–10. [Google Scholar] [CrossRef]
  2. Owusu, P.A.; Asumadu-Sarkodie, S. A review of renewable energy sources, sustainability issues and climate change mitigation. Cogent. Eng. 2016, 3, 1167990. [Google Scholar] [CrossRef]
  3. Ramli, M.A.; Hiendro, A.; Twaha, S. Economic analysis of PV/diesel hybrid system with flywheel energy storage. Renew. Energy 2015, 78, 398–405. [Google Scholar] [CrossRef]
  4. Moreira, D.; Pires, J.C. Atmospheric CO2 capture by algae: Negative carbon dioxide emission path. Bioresour. Technol. 2016, 215, 371–379. [Google Scholar] [CrossRef] [PubMed]
  5. Kim, H.; Bae, J.; Baek, S.; Nam, D.; Cho, H.; Chang, H. Comparative analysis between the government micro-grid plan and computer simulation results based on real data: The practical case for a South Korean Island. Sustainability 2017, 9, 197. [Google Scholar] [CrossRef]
  6. REN21. Renewables 2018 Global Status Report; REN21 Secretariat: Paris, France, 2018; ISBN 978-3-9818911-3-3. [Google Scholar]
  7. Shahzad, M.K.; Zahid, A.; Rashid, T.U.; Rehan, M.A.; Ali, M.; Ahmad, M. Techno-economic feasibility analysis of a solar-biomass off grid system for the electrification of remote rural areas in Pakistan using HOMER software. Renew. Energy 2017, 106, 264–273. [Google Scholar] [CrossRef]
  8. Shi, B.; Wu, W.; Yan, L. Size optimization of stand-alone PV/wind/diesel hybrid power generation systems. J. Taiwan Inst. Chem. Eng. 2017, 73, 93–101. [Google Scholar] [CrossRef]
  9. Nag, A.K.; Sarkar, S. Modeling of hybrid energy system for futuristic energy demand of an Indian rural area and their optimal and sensitivity analysis. Renew. Energy 2018, 118, 477–488. [Google Scholar] [CrossRef]
  10. Arul, P.; Ramachandaramurthy, V.K.; Rajkumar, R. Control strategies for a hybrid renewable energy system: A review. Renew. Sustain. Energy Rev. 2015, 42, 597–608. [Google Scholar] [CrossRef]
  11. Strnad, I.; Prenc, R. Optimal sizing of renewable sources and energy storage in low-carbon microgrid nodes. Electr. Eng. 2017, 100, 1661–1674. [Google Scholar] [CrossRef]
  12. Cheng, L.; Wang, W.; Wei, S.; Lin, H.; Jia, Z. An improved energy management strategy for hybrid energy storage system in light rail vehicles. Energies 2018, 11, 423. [Google Scholar] [CrossRef]
  13. Li, H.; Eseye, A.T.; Zhang, J.; Zheng, D. Optimal energy management for industrial microgrids with high-penetration renewables. Prot. Control Mod. Power Syst. 2017, 2. [Google Scholar] [CrossRef]
  14. Olatomiwa, L.; Mekhilef, S.; Ismail, M.; Moghavvemi, M. Energy management strategies in hybrid renewable energy systems: A review. Renew. Sustain. Energy. Rev. 2016, 62, 821–835. [Google Scholar] [CrossRef]
  15. Vivas, F.; Heras, A.D.L.; Segura, F.; Andújar, J. A review of energy management strategies for renewable hybrid energy systems with hydrogen backup. Renew. Sustain. Energy. Rev. 2018, 82, 126–155. [Google Scholar] [CrossRef]
  16. Farret, F.A.; Simões, M. Godoy Integration of Renewable Sources of Energy; John Wiley & Sons, Inc.: Hoboken, NJ, USA, 2018. [Google Scholar]
  17. Zambrana, M.N.F.V. System Design and Analysis of a Renewable Energy Source Powered Microgrid. M.Sc. Thesis, University of Maryland, College Park, MD, USA, 2018. [Google Scholar]
  18. Sawle, Y.; Gupta, S.; Bohre, A.K. Optimal sizing of standalone PV/Wind/Biomass hybrid energy system using GA and PSO optimization technique. Energy Procedia 2017, 117, 690–698. [Google Scholar] [CrossRef]
  19. Hosseinalizadeh, R.; Shakouri, G.H.; Amalnick, M.S.; Taghipour, P. Economic sizing of a hybrid (PV–WT–FC) renewable energy system (HRES) for stand-alone usages by an optimization-simulation model: Case study of Iran. Renew. Sustain. Energy Rev. 2016, 57, 1657. [Google Scholar] [CrossRef]
  20. Olatomiwa, L.; Mekhilef, S.; Huda, A.S.N.; Sanusi, K. Techno-economic analysis of hybrid PV-diesel-battery and PV-wind-diesel-battery power systems for mobile BTS: The way forward for rural development. Energy Sci. Eng. 2015, 3, 271–285. [Google Scholar] [CrossRef]
  21. Ajlan, A.; Tan, C.W.; Abdilahi, A.M. Assessment of environmental and economic perspectives for renewable-based hybrid power system in Yemen. Renew. Sustain. Energy Rev. 2017, 75, 559–570. [Google Scholar] [CrossRef]
  22. Hsu, D.; Kang, L. Dispatch Analysis of Off-Grid Diesel Generator-Battery Power Systems. Int. J. Emerg. Electr. Power Syst. 2014, 15. [Google Scholar] [CrossRef]
  23. Zobaa, A.F.; Bansal, R.C. Handbook of Renewable Energy Technology; World Scientific Pub. Co.: Singapore, 2011. [Google Scholar]
  24. Jung, T.; Kim, D.; Moon, J.; Lim, S. A scenario analysis of solar photovoltaic grid parity in the Maldives: The case of Malahini resort. Sustainability 2018, 10, 4045. [Google Scholar] [CrossRef]
  25. Brenna, M.; Foiadelli, F.; Longo, M.; Abegaz, T. Integration and optimization of renewables and storages for rural electrification. Sustainability 2016, 8, 982. [Google Scholar] [CrossRef]
  26. Jiang, F.; Xie, H.; Ellen, O. Hybrid energy system with optimized storage for improvement of sustainability in a small town. Sustainability 2018, 10, 2034. [Google Scholar] [CrossRef]
  27. Mazzola, S.; Astolfi, M.; Macchi, E. A detailed model for the optimal management of a multigood microgrid. Appl. Energy 2015, 154, 862–873. [Google Scholar] [CrossRef]
  28. Halabi, L.M.; Mekhilef, S.; Olatomiwa, L.; Hazelton, J. Performance analysis of hybrid PV/diesel/battery system using HOMER: A case study Sabah, Malaysia. Energy Convers. Manag. 2017, 144, 322–339. [Google Scholar] [CrossRef]
  29. Ansong, M.; Mensah, L.D.; Adaramola, M.S. Techno-economic analysis of a hybrid system to power a mine in an off-grid area in Ghana. Sustain. Energy Technol. Assess. 2017, 23, 48–56. [Google Scholar] [CrossRef]
  30. Sigarchian, S.G.; Paleta, R.; Malmquist, A.; Pina, A. Feasibility study of using a biogas engine as backup in a decentralized hybrid (PV/wind/battery) power generation system—Case study Kenya. Energy 2015, 90, 1830–1841. [Google Scholar] [CrossRef]
  31. Rezzouk, H.; Mellit, A. Feasibility study and sensitivity analysis of a stand-alone photovoltaic–diesel–battery hybrid energy system in the north of Algeria. Renew. Sustain. Energy. Rev. 2015, 43, 1134–1150. [Google Scholar] [CrossRef]
  32. Madziga, M.; Rahil, A.; Mansoor, R. Comparison between three off-grid hybrid systems (solar photovoltaic, diesel generator and battery storage system) for electrification for Gwakwani village, South Africa. Environments 2018, 5, 57. [Google Scholar] [CrossRef]
  33. Upadhyay, S.; Sharma, M. Development of hybrid energy system with cycle charging strategy using particle swarm optimization for a remote area in India. Renew. Energy 2015, 77, 586–598. [Google Scholar] [CrossRef]
  34. Rajbongshi, R.; Borgohain, D.; Mahapatra, S. Optimization of PV-biomass-diesel and grid base hybrid energy systems for rural electrification by using HOMER. Energy 2017, 126, 461–474. [Google Scholar] [CrossRef]
  35. Amutha, W.M.; Rajini, V. Cost benefit and technical analysis of rural electrification alternatives in southern India using HOMER. Renew. Sustain. Energy. Rev. 2016, 62, 236–246. [Google Scholar] [CrossRef]
  36. Sen, R.; Bhattacharyya, S.C. Off-grid electricity generation with renewable energy technologies in India: An application of HOMER. Renew. Energy 2014, 62, 388–398. [Google Scholar] [CrossRef]
  37. Singh, A.; Baredar, P.; Gupta, B. Techno-economic feasibility analysis of hydrogen fuel cell and solar photovoltaic hybrid renewable energy system for academic research building. Energy Convers. Manag. 2017, 145, 398–414. [Google Scholar] [CrossRef]
  38. Kansara, B.U.; Parekh, B.R. Dispatch, control strategies and emissions for isolated wind-diesel hybrid power system. Int. J. Innov. Technol. Explor. Eng. 2013, 2, 152–156. [Google Scholar]
  39. Eu-Tjin, C.; Huat, C.K.; Seng, L.Y. Control strategies in energy storage system for standalone power systems. In Proceedings of the 4th IET Clean Energy and Technology Conference, Kuala Lumpur, Malaysia, 14–15 November 2016. [Google Scholar]
  40. Markovic, M.; Nedic, Z.; Nafalski, A. Microgrid solutions for insular power systems in the outback of Australia. Masz. Elektr. Zesz. Probl. 2016, 109, 103–107. [Google Scholar]
  41. Kansara, B.U.; Parekh, B.R. Penetration of renewable energy resources based dispatch strategies for isolated hybrid systems. Int. J. Electr. Electron. Eng. Res. 2013, 3, 121–130. [Google Scholar]
  42. Saraswat, S.K.; Rao, K.V.S. 10 kW solar photovoltaic—Diesel hybrid energy system for different solar zones of India. In Proceedings of the 2016 International Conference on Emerging Technological Trends (ICETT), Kollam, India, 21–22 October 2016. [Google Scholar]
  43. Fodhil, F.; Hamidat, A.; Nadjemi, O. Energy control strategy analysis of hybrid power generation system for rural Saharan community in Algeria. In Artificial Intelligence in Renewable Energetic Systems Lecture Notes in Networks and Systems; Springer: Cham, Switzerland, 2017; pp. 108–120. [Google Scholar]
  44. Shoeb, M.; Shafiullah, G. Renewable energy integrated islanded microgrid for sustainable irrigation—A Bangladesh perspective. Energies 2018, 11, 1283. [Google Scholar] [CrossRef]
  45. Ghenai, C.; Bettayeb, M. Optimized design and control of an off grid solar PV/hydrogen fuel cell power system for green buildings. IOP Conf. Ser. Earth Environ. Sci. 2017, 93, 012073. [Google Scholar] [CrossRef] [Green Version]
  46. Maatallah, T.; Ghodhbane, N.; Nasrallah, S.B. Assessment viability for hybrid energy system (PV/wind/diesel) with storage in the northernmost city in Africa, Bizerte, Tunisia. Renew. Sustain. Energy Rev. 2016, 59, 1639–1652. [Google Scholar] [CrossRef]
  47. Islam, M.S.; Akhter, R.; Rahman, M.A. A thorough investigation on hybrid application of biomass gasifier and PV resources to meet energy needs for a northern rural off-grid region of Bangladesh: A potential solution to replicate in rural off-grid areas or not? Energy 2018, 145, 338–355. [Google Scholar] [CrossRef]
  48. Hassan, Q.; Jaszczur, M.; Abdulateef, J. Optimization of PV/wind/diesel hybrid power system in HOMER for rural electrification. J. Phys. Conf. Ser. 2016, 745, 032006. [Google Scholar] [CrossRef]
  49. Surface Meteorology and Solar Energy. Available online: https://eosweb.larc.nasa.gov/cgi-bin/sse/homer.cgi (accessed on 15 August 2018).
  50. Garni, H.Z.A.; Awasthi, A.; Ramli, M.A. Optimal design and analysis of grid-connected photovoltaic under different tracking systems using HOMER. Energy Convers. Manag. 2018, 155, 42–57. [Google Scholar] [CrossRef]
  51. Bimble Solar. Available online: https://www.bimblesolar.com/NiFe200ah (accessed on 5 September 2018).
  52. Aziz, A.S.; Tajuddin, M.F.N.; Adzman, M.R. Feasibility analysis of PV/wind/battery hybrid power generation: A case study. Int. J. Renew. Energy Res. 2018, 8, 661–671. [Google Scholar]
  53. Nacer, T.; Hamidat, A.; Nadjemi, O.; Bey, M. Feasibility study of grid connected photovoltaic system in family farms for electricity generation in rural areas. Renew. Energy 2016, 96, 305–318. [Google Scholar] [CrossRef]
  54. Mamaghani, A.H.; Escandon, S.A.A.; Najafi, B.; Shirazi, A.; Rinaldi, F. Techno-economic feasibility of photovoltaic, wind, diesel and hybrid electrification systems for off-grid rural electrification in Colombia. Renew. Energy 2016, 97, 293–305. [Google Scholar] [CrossRef]
  55. Alharthi, Y.; Siddiki, M.; Chaudhry, G. Resource Assessment and Techno-Economic Analysis of a Grid-Connected Solar PV-Wind Hybrid System for Different Locations in Saudi Arabia. Sustainability 2018, 10, 3690. [Google Scholar] [CrossRef]
  56. Alam, M.; Bhattacharyya, S. Decentralized renewable hybrid mini-grids for sustainable electrification of the off-grid coastal areas of Bangladesh. Energies 2016, 9, 268. [Google Scholar] [CrossRef]
  57. Rendall, C.O. Economic Feasibility Analysis of Microgrids in Norway: An Application of HOMER Pro. Master’s Thesis, Norwegian University of Life Sciences, Ås, Norway, 2018. [Google Scholar]
  58. HOMER Energy Index. Available online: https://www.homerenergy.com/products/pro/docs/3.11/index.html (accessed on 25 September 2018).
  59. Maheri, A. Multi-objective design optimisation of standalone hybrid wind-PV-diesel systems under uncertainties. Renew. Energy 2014, 66, 650–661. [Google Scholar] [CrossRef] [Green Version]
  60. Tharani, K.L.; Dahiya, R. Choice of battery energy storage for a hybrid renewable energy system. Turk. J. Electr. Eng. Comput. Sci. 2018, 26, 666–676. [Google Scholar] [CrossRef]
  61. Fazelpour, F.; Soltani, N.; Rosen, M.A. Economic analysis of standalone hybrid energy systems for application in Tehran, Iran. Int. J. Hydrogen Energy 2016, 41, 7732–7743. [Google Scholar] [CrossRef]
  62. Wang, Y.; Jiao, X.; Sun, Z.; Li, P. Energy Management strategy in consideration of battery health for PHEV via stochastic control and particle swarm optimization algorithm. Energies 2017, 10, 1894. [Google Scholar] [CrossRef]
  63. Bordin, C.; Anuta, H.O.; Crossland, A.; Gutierrez, I.L.; Dent, C.J.; Vigo, D. A linear programming approach for battery degradation analysis and optimization in offgrid power systems with solar energy integration. Renew. Energy 2017, 101, 417–430. [Google Scholar] [CrossRef] [Green Version]
  64. Rivera-Barrera, J.; Muñoz-Galeano, N.; Sarmiento-Maldonado, H. SoC estimation for lithium-ion batteries: Review and future challenges. Electronics 2017, 6, 102. [Google Scholar] [CrossRef]
  65. Galad, M.; Spanik, P.; Cacciato, M.; Nobile, G. Comparison of common and combined state of charge estimation methods for VRLA batteries. In Proceedings of the ELEKTRO, Strbske Pleso, Slovakia, 16–18 May 2016. [Google Scholar]
Figure 1. Energy mix of the global electricity generation by the end of 2017 [6].
Sustainability 11 00683 g001
Figure 2. Commonly used approaches for energy management strategies [14].
Sustainability 11 00683 g002
Figure 3. The total daily load profile of the village’s households [49].
Sustainability 11 00683 g003
Figure 4. Monthly average solar global radiation and clearance index of the village.
Sustainability 11 00683 g004
Figure 5. Monthly average temperature of the village.
Sustainability 11 00683 g005
Figure 6. Schematic diagram of PV/diesel/battery hybrid energy system (HES).
Sustainability 11 00683 g006
Figure 7. Load following (LF) dispatch strategy for the PV/diesel/battery HES.
Sustainability 11 00683 g007
Figure 8. Cycle charging (CC) dispatch strategy for PV/diesel/battery HES.
Sustainability 11 00683 g008
Figure 9. Combined dispatch (CD) strategy for PV/diesel/battery HES.
Sustainability 11 00683 g009
Figure 10. Monthly average electric production for the HES under (a) load following (LF) strategy, (b) CC strategy, and (c) CD strategy.
Sustainability 11 00683 g010
Figure 11. Fuel consumption duration curve for the HES under (a) LF strategy, (b) CC strategy, and (c) CD strategy.
Sustainability 11 00683 g011
Figure 12. Input/output energy of battery for different dispatch strategies.
Sustainability 11 00683 g012
Figure 13. Cost summary of PV/diesel/battery under different dispatch strategies. O&M is operation and maintenance.
Sustainability 11 00683 g013
Figure 14. Energy balance and battery SOC of PV/diesel/battery under LF strategy.
Sustainability 11 00683 g014
Figure 15. Energy balance and battery SOC of PV/diesel/battery under CC strategy.
Sustainability 11 00683 g015
Figure 16. Energy balance and battery SOC of PV/diesel/battery under CD strategy.
Sustainability 11 00683 g016
Figure 17. Impact of battery minimum SOC on CO2 emissions and NPC.
Sustainability 11 00683 g017
Figure 18. Impact of time step on CO2 emissions and NPC.
Sustainability 11 00683 g018
Figure 19. Impact of solar radiation on CO2 emissions and NPC.
Sustainability 11 00683 g019
Figure 20. Impact of diesel price on CO2 emissions and NPC.
Sustainability 11 00683 g020
Figure 21. Impact of load growth on CO2 emissions and NPC.
Sustainability 11 00683 g021
Table 1. Input parameters and costs of different components.
ReferenceDescriptionSpecification
[50]1. PV system
Tracking systemFixed
Nominal operating cell temperature47 °C
Temperature coefficient−0.4%/°C
Efficiency at standard test condition18%
Derating factor80%
Capital cost$640/kW
Operating and maintenance cost$10/kW/year
Cost of replacement$640/kW
Lifetime25 years
[28]2. Diesel generator
Cost of capital$220/kW
Cost of operating and maintenance$0.03/kW/hour
Cost of replacement$200/kW
Lifetime15,000 h
[51]3. Batteries
ModelIron Edison Nickel Iron
Nominal capacity200 Ah (0.24 kWh)
Nominal voltage1.2 V
Capital cost$130
Operating and maintenance cost$1/year
Replacement cost$100
[52]4. Converter
Efficiency90% for inverter, 85% for rectifier
Cost of capital$550/kW
Cost of operating and maintenance$5/kW/year
Cost of replacement$450/kW
Lifetime15 years
Table 2. Optimization results of the HES for different dispatch strategies. NPC is net present cost; COE is cost of energy.
ItemUnitLoad FollowingCycle ChargingCombined Dispatch
PVkW28.510.219.4
Battery-300140220
Diesel generatorkW212121
ConverterkW5.285.788.05
NPC$138,704115,722110,191
COE$/kWh0.2640.220.21
Renewable fraction%44.718.435.6
PV productionkWh/year42,88415,31429,116
Diesel generator productionkWh/year29,25543,18734,080
Total productionkWh/year72,13958,50163,196
Excess electricity%190.7746.74
Generator number of startsstart/year567494498
Generator operating hourshour/year367532772171
Generator operation lifeyear4.084.586.91
Fuel consumptionL/year10,75713,88710,574
Batteries throughputkWh/year/battery54.1579.970.76
Batteries nominal capacitykWh7233.652.8
Batteries autonomyhour8.944.176.55
Table 3. Pollutant emissions for different control strategies. PM is particulate matter; UHC is unburned hydrocarbon.
Pollutant Emissions (kg/year)LFCCCD
NOx167215164
SO268.98967.8
PM1.081.391.06
UHC7.74107.61
CO177229174
CO228,15736,35227,678

