Experimental Study and Numerical Simulation on Hybrid Coupled Shear Wall with Replaceable Coupling Beams


1
College of Civil Engineering and Architecture, Hainan University, Haikou 570228, China
2
Research Institute of Structural Engineering and Disaster Reduction, Tongji University, Shanghai 200092, China
3
State Key Laboratory of Disaster Reduction in Civil Engineering, Tongji University, Shanghai 200092, China
*
Author to whom correspondence should be addressed.
Sustainability 2019, 11(3), 867; https://doi.org/10.3390/su11030867
Submission received: 26 December 2018
/
Revised: 30 January 2019
/
Accepted: 1 February 2019
/
Published: 7 February 2019
(This article belongs to the Special Issue Resilience and Sustainability of Civil Infrastructures under Extreme Loads)
Abstract
:The coupled shear wall with replaceable coupling beams is a current research hotspot, while still lacking comprehensive studies that combine both experimental and numerical approaches to describe the global performance of the structural system. In this paper, hybrid coupled shear walls (HSWs) with replaceable coupling beams (RCBs) are studied. The middle part of the coupling beam is replaced with a replaceable “fuse”. Four ½-scale coupled shear wall specimens including a conventional reinforced concrete shear wall (CSW) and three HSWs (F1SW/F2SW/F3SW) with different kinds of replaceable “fuses” (Fuse 1/Fuse 2/Fuse 3) are tested through cyclic loading. Fuse 1 is an I-shape steel with a rhombic opening at the web; Fuse 2 is a double-web I-shape steel with lead filled in the gap between the two webs; Fuse 3 consists of two parallel steel tubes filled by lead. The comparison of seismic properties of the four shear walls in terms of failure mechanism, hysteretic response, strength degradation, stiffness degradation, energy consumption, and strain response is presented. The nonlinear finite element analysis of four shear walls is conducted by ABAQUS software. The deformation process, yielding sequence of components, skeleton curves, and damage distribution of the walls are simulated and agree well with the experimental results. The primary benefit of HSWs is that the damage of the coupling beam is concentrated at the replaceable “fuse”, while other parts remain intact. Besides, because the “fuse” can dissipate much energy, the damage of the wall-piers is also alleviated. In addition, among the three HSWs, F1SW possesses the best ductility and load retention capacity while F2SW possesses the best energy dissipation capacity. Based on this comprehensive study, some suggestions for the conceptual design of HSWs are further proposed.
1. Introduction
Based on the working mechanism of structures under seismic loads and previous earthquake damage surveys, it is found that in many cases, structures fail only because of some specific components’ failure, not all of them [1,2,3]. The repair work of damaged components can be very costly and even impractical, especially for cast-in-place reinforced concrete structure. Coupled shear wall system is an efficient structural system to resist lateral forces, which is widely used in high-rise buildings [4,5]. Under large lateral forces, plastic hinges are designed to appear at the beam ends to dissipate energy [6], and then lead to failure. To improve the reliability of the coupling beam, many scholars are committed to reduce the damage of the beam mainly in two ways. Traditional designers propose special reinforcement layouts or constructional measures to enhance the energy dissipation capacity and ductility of coupling beams [7,8,9,10]. However, those methods do not change the failure mechanism of the coupled wall that the beam ends are most vulnerable to damage, and repairing the coupling beam is very difficult.
In recent years, the design of replaceable components has been proposed [11]. By consciously making the risky parts of the structure into a replaceable form, the replaceable parts can dissipate energy by plastic deformation to protect the other components from damage. The replaceable components can be called “fuses” [12,13]. As for the coupling beams in coupled shear walls, Fortney et al. first put forward the concept of replaceable coupling beams (RCBs) [14]. They divide the coupling beam into 3 parts. The middle part which is named the “fuse” is intentionally weakened to dissipate energy by shear yielding. A design methodology is presented in great detail, which will ensure that the outer sections remain elastic through the inelastic range of the fuse section. Cyclic reversal test of a steel coupling beam with a replaceable “fuse” shows that the damage of the beam is concentrated at the middle part, which is easy to be replaced. Li et al. develop a replaceable coupling beam which is designed as a steel truss with a replaceable buckling restrained steel web. The buckling restrained web can dissipate energy by shear deformation and is confined by two precast reinforced concrete panels to avoid out-of-plane buckling. Cyclic tests show that the “fuse” has desirable deformation and energy absorption capacities and inelastic deformation is concentrated at steel webs. Besides, they also developed a modified strip model to predict the bearing capacity of the beam [15]. Recently, Ji et al. [16] developed a type of replaceable steel coupling beam which consists of a central “fuse” shear link connecting to steel beam segments at its two ends. Large-scale specimens of the beams are tested, showing that all specimens have fully developed the shear strength and shown large inelastic rotation capacities of no less than 0.06 rad. Besides, different types of the connection between the fuse and the beam segments were compared in the test, showing that the end plate connection is most convenient for the post-damage repair whereas the bolted web connection can bear the largest residual deformation. These experimental studies demonstrate the advantages of RCBs compared to conventional coupling beams. However, previous experimental studies have focused on component performance without a comprehensive discussion of global performance of the structural system.
On the other hand, much research uses numerical methods to study the global seismic performance of new shear walls. Wang et al. develops a type of RCB in which the middle part of the coupling beam is replaced by a shape memory alloy (SMA) damper [17]. Two groups of SMA wires which can dissipate energy by inelastic tensional deformation are assembled on the damper. The relative flexural deformation of the wall limbs is transferred to the ends of coupling beams and then to the SMA dampers. After earthquakes, the deformation of the damper can recover automatically because of the pseudo elasticity of austenite SMA material. Besides, an elastic-plastic time history analysis of a 12-story frame-shear wall structure with SMA damper is carried out to illustrate the performance of the proposed coupling beam. Kurama proposes to connect the steel coupling beam and the wall-piers with prestressed steel strand and install steel angles at the joints [18,19]. Nonlinear behavior of the proposed coupled wall is studied through numerical simulation, proving that when there is relative deformation between the wall-piers and the beam, the steel angles which can be replaced after the earthquake, will suffer severe plastic deformation to dissipate energy. In addition, a nonlinear numerical analysis of a hybrid coupled wall system (HCW) with replaceable steel coupling beams versus traditional RC coupling beams under seismic excitations is carried out by Ji et al. [20], showing that HCW can adequately meet code defined objectives in terms of global and component behavior under service level earthquakes. Under extreme events, the interstory drifts and beam rotations of HCW are much lower than the conventional coupled walls. Recently, Shahrooz et al. [21] have conducted nonlinear static and dynamic analyses of a 20-story prototype building with RCBs. The results show that: (1) the mid-span fuses are the primary energy-dissipating components and yield first; (2) the wall-piers experience little or no damage under design ground motions; (3) residual deformations are small which facilitates the replacement of the fuses. These numerical studies illustrate the benefits of the coupled shear wall with RCBs over the conventional coupled wall system, but lack the support of experimental data.
Although previous studies have done a lot of work on RCBs, there are few experimental studies of the structural system to validate the global performance of HSW. In this paper, the cyclic reversal tests and elaborate finite element simulation of three types of HSWs (F1SW/F2SW/F3SW) and a conventional coupled shear wall (CSW) are conducted. The global seismic behaviors of HSWs and CSW are compared. The authors must mention that in a former article, Lu et al. [22] have presented the study of F1SW. The practical design method of RCB and the hysteretic performance of Fuse 1 are first investigated. Then, the cyclic reversal test of F1SW and the numerical simulation by OpenSEES software are presented to show the global performance of the wall. In addition, the comparative study of F1SW and CSW are also briefly presented in review articles [8,23]. However, this paper presents the experimental and numerical study of other two types of HSWs (F2SW/F3SW), which have different RCBs, to illustrate the performance of HSWs more comprehensively. Furthermore, the concrete damage is taken into account in the finite element simulation conducted by ABAQUS software, to reveal the damage of HSWs. This paper also compares the similarities and differences between the three HSWs in seismic performance. The issues on how different configurations of “fuses” influence the global structural system’s performance are discussed and suggestions for conceptual design are put forward.
2. Experimental Setup and Instrumentation
2.1. Experimental Specimens
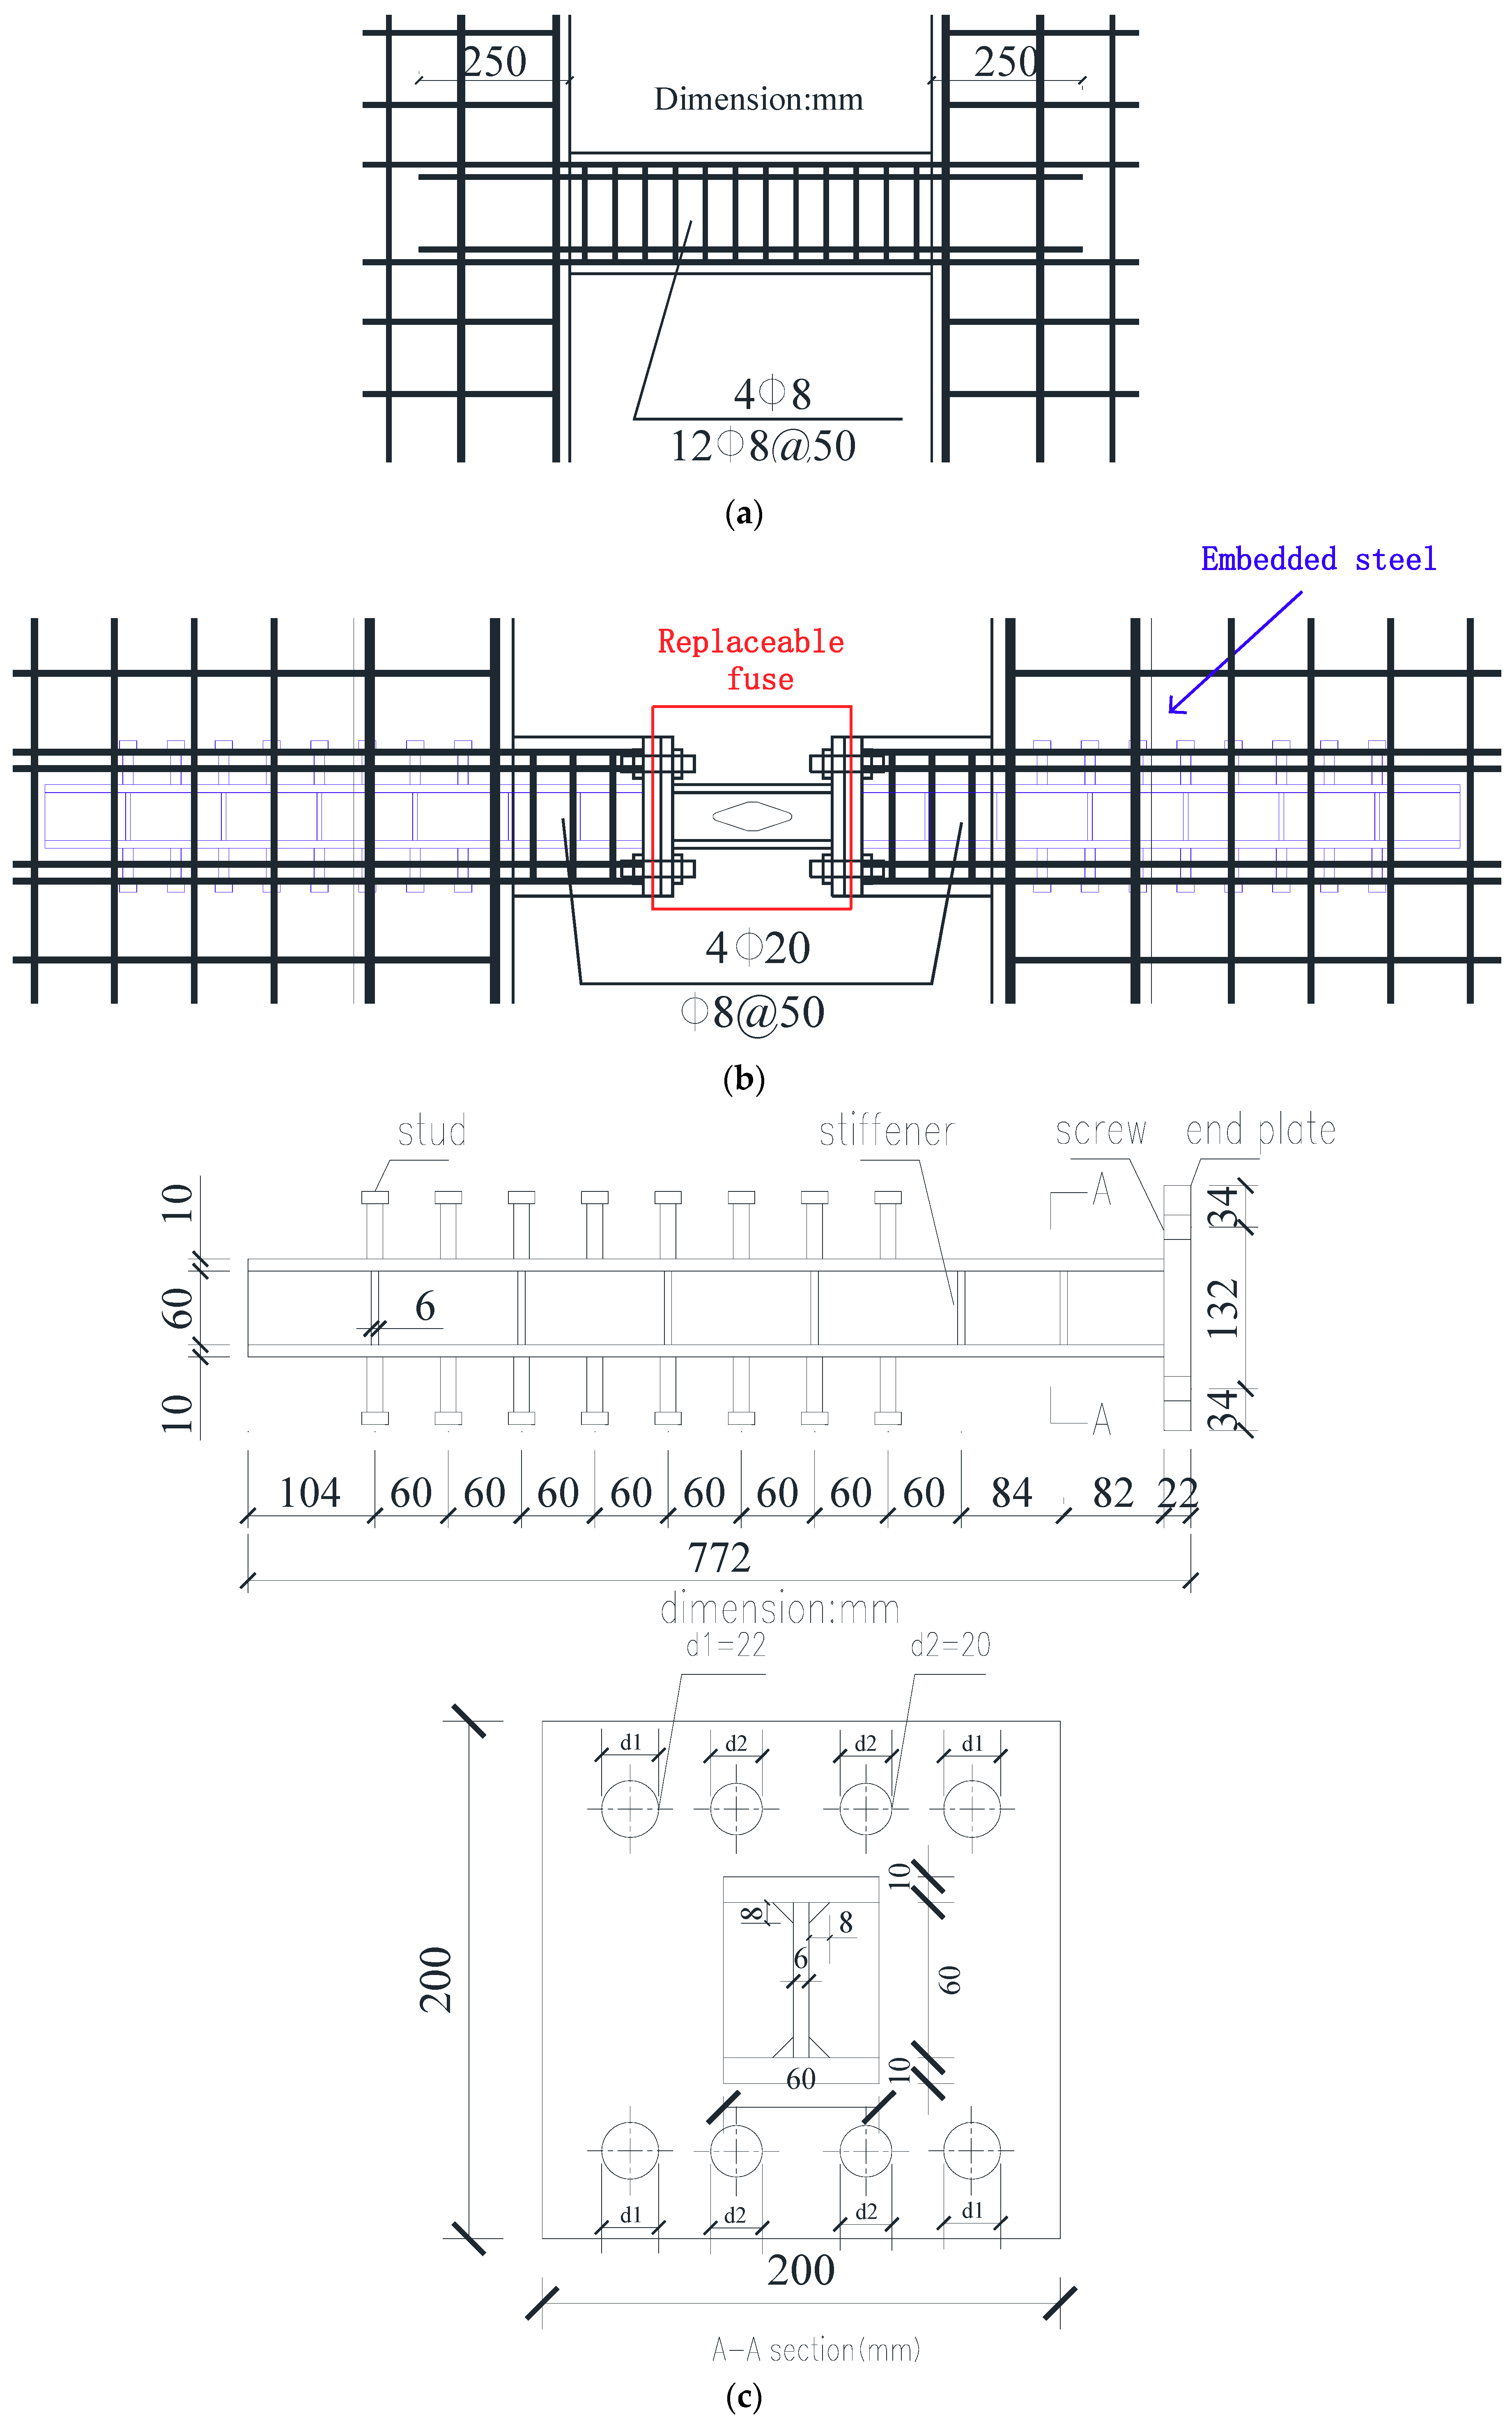
Specimens include a conventional reinforced concrete coupled shear wall (CSW) and three hybrid coupled shear walls (HSWs) with different RCBs (F1SW/F2SW/F3SW), which are designed based on Chinese design codes [24]. The scale of the specimens is 1/2. The dimensions and reinforcement layouts of the four specimens are the same except the coupling beams (shown in Figure 1). The concrete grade of the shear wall is C25; the longitudinal reinforcements of the concealed column adopt HRB335 grade steel bars; the longitudinal reinforcements of the coupling beams, the stirrups of the beams and concealed columns, and the distributing bars of the shear wall adopt HPB235 grade steel bars. The steel and concrete grades are regulated by Chinese code [25].
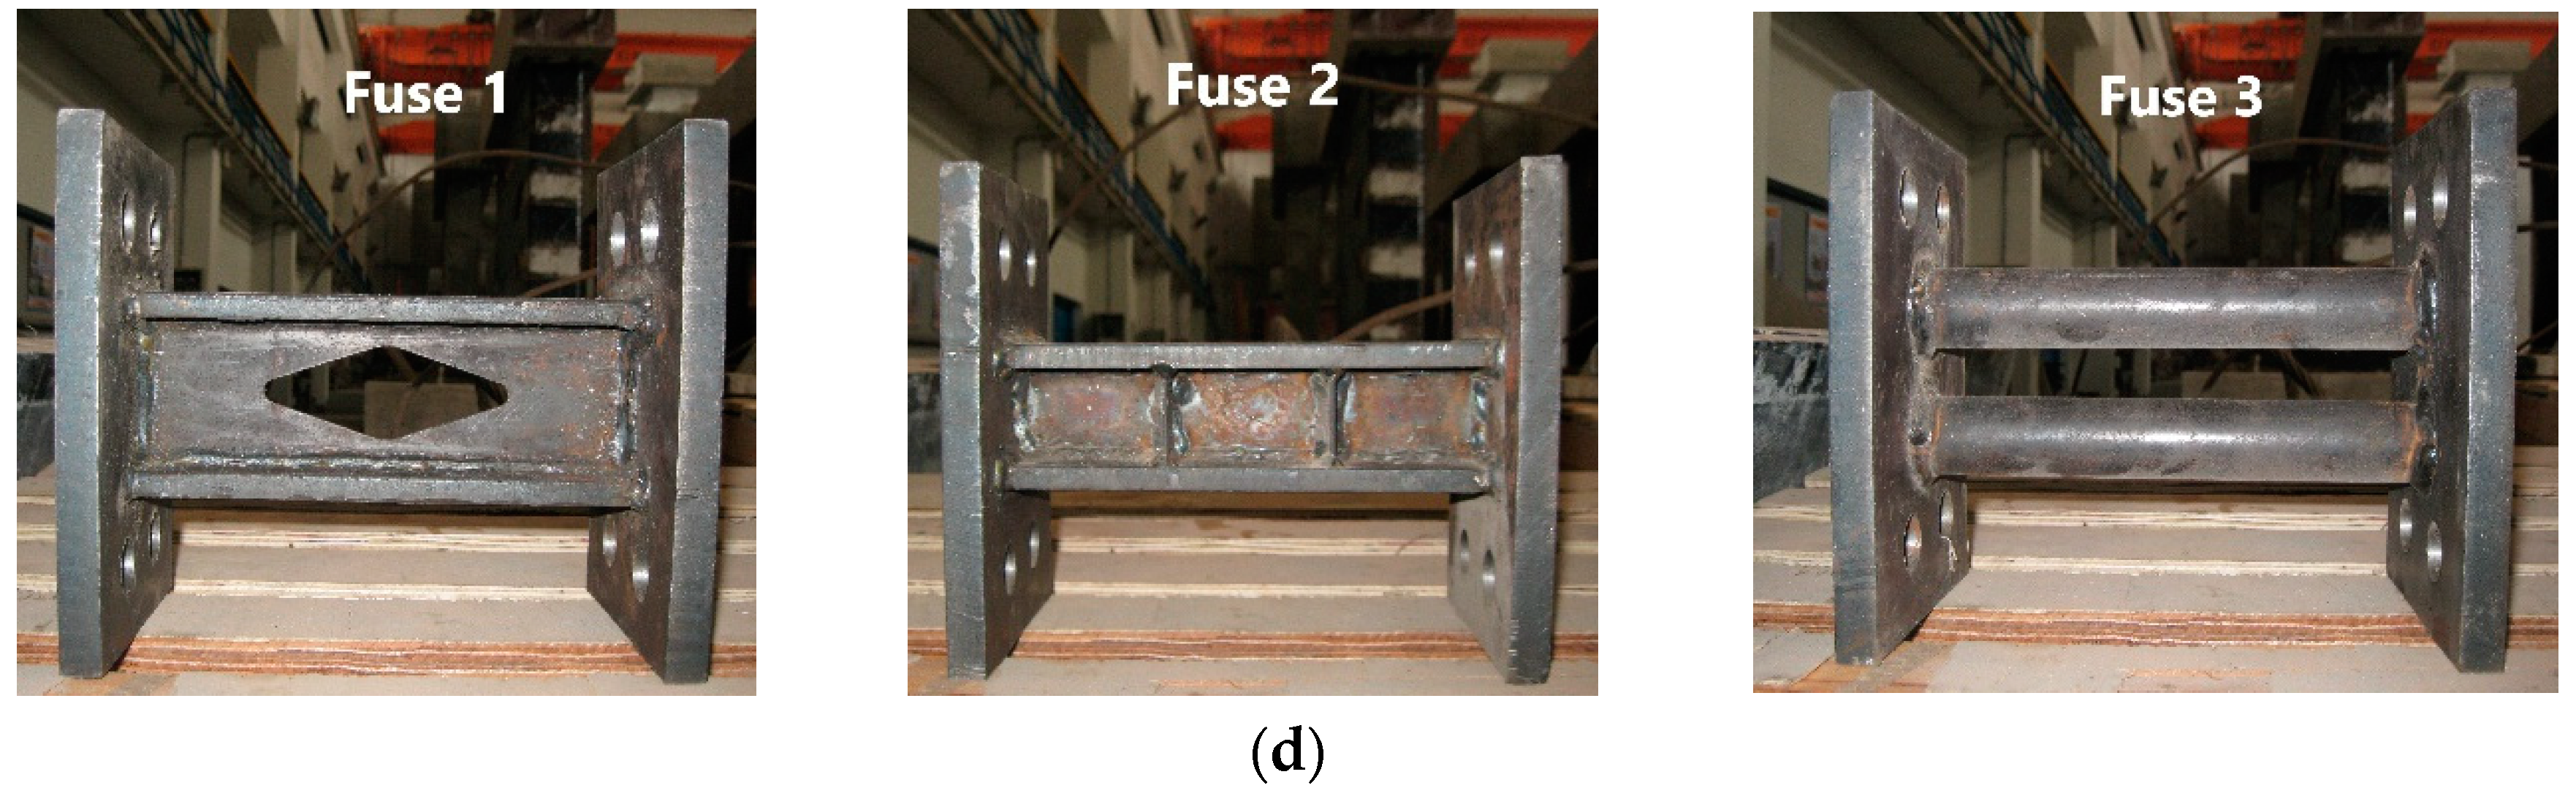
The RCB consists of two non-yield sections embedded in the wall-piers and a replaceable “fuse”. To make the “fuse” replaceable, the “fuse” is connected to the embedded steel by end plates and bolts, shown in Figure 2b. The design method of the RCB is discussed in former study [22]. The bearing capacities of the beams are presented in Table 1 [22]. Fuse 1 is an I-shape steel with a rhombic opening at the web. The opening can enlarge the yield range of the web to enhance the energy dissipation capacity. Fuse 2 is a double-web I-shape steel with lead filled in the gap between the two webs. Fuse 3 consists of two parallel steel tubes filled by lead. After being installed at the mid-span of the coupling beam, Fuse 1 and Fuse 2 are designed to suffer shear failure while Fuse 3 are designed to suffer bending failure. The lead in Fuse 2 and Fuse 3 can dissipate energy and prevent the steel plates or tubes from buckling. The details of the coupling beams are presented in Figure 2.
2.2. Experimental Setup
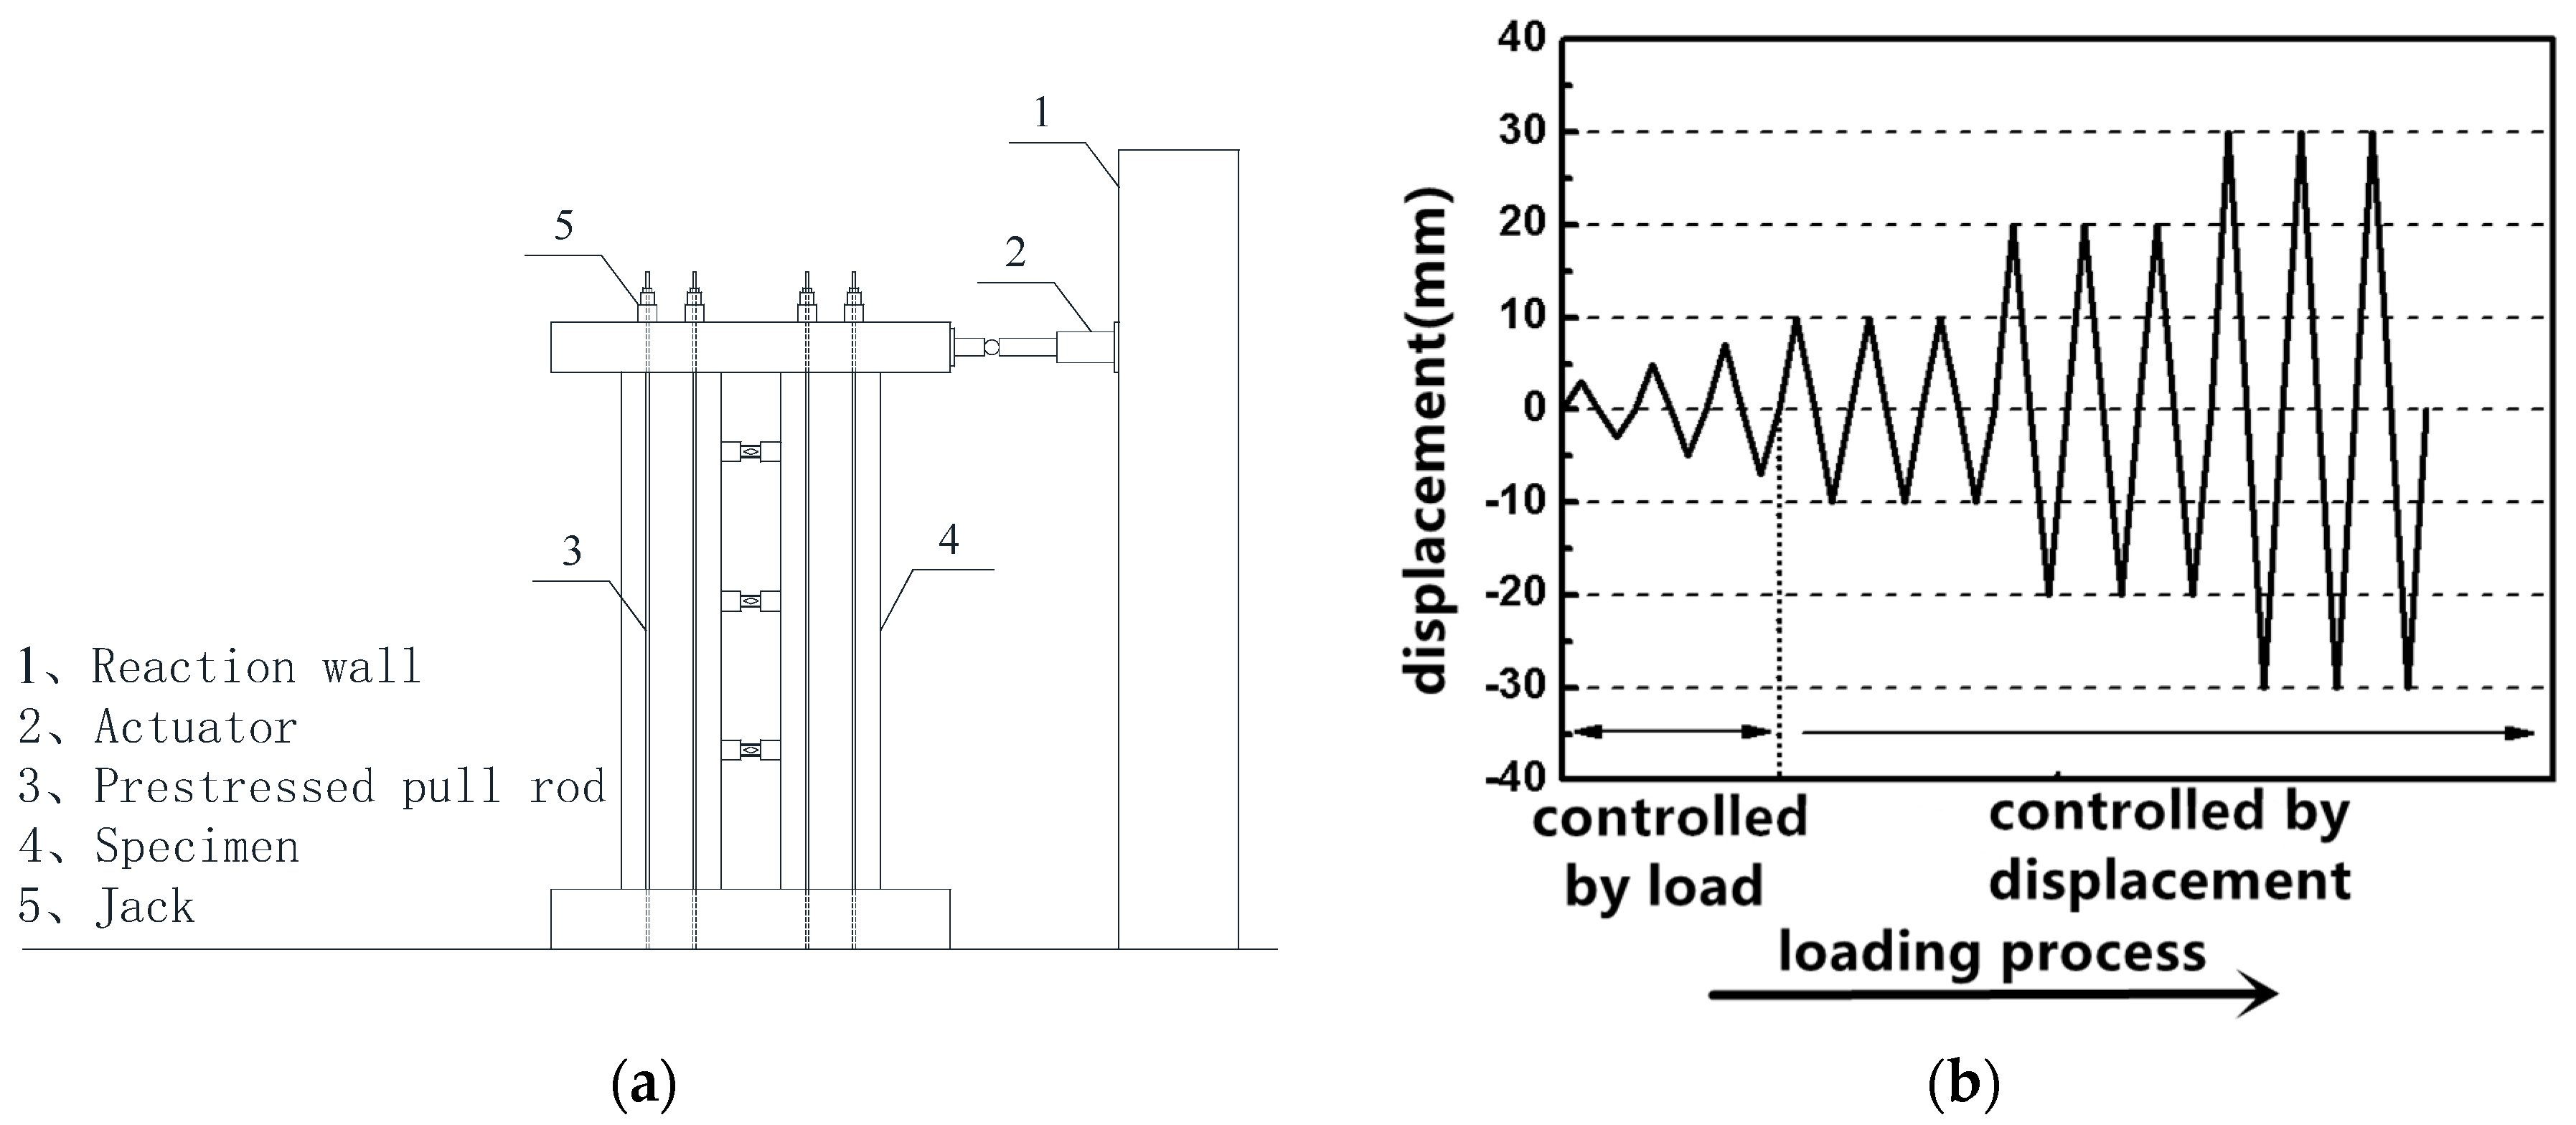
The experimental setup is shown in Figure 3. The bottom of the shear wall is fixed on the foundation while the top is free. The vertical force is preloaded by prestresses pull rods and the lateral force is loaded by the actuator. The prestressed pull rod is anchored by bolts and steel plates at the base, so the prestressed rods can be rotated slightly during the repeated loading process. The preloaded vertical load is . The loading process of the lateral force is controlled by load before yielding. The initial loading value is 25% of the estimated yield load. When reaching 75% of the estimated yield load, the gap between each load level is reduced. Please note that each level of load cycles once. After yielding, the process is controlled by displacement. The displacement increases step by step, and the step length is equal to the final displacement of the load control period. Each level of displacement cycles 3 times until the horizontal bearing capacity drops to 85% of the maximum value or the specimen cannot withstand the predetermined axial pressure. The specific loading history is shown in Figure 3b.
3. Experimental Results and Discussion
3.1. Experimental Observations
The failure modes of the coupling beams and the wall-piers under cyclic reversal forces were introduced as below.
3.1.1. Failure Mode of Coupling Beams
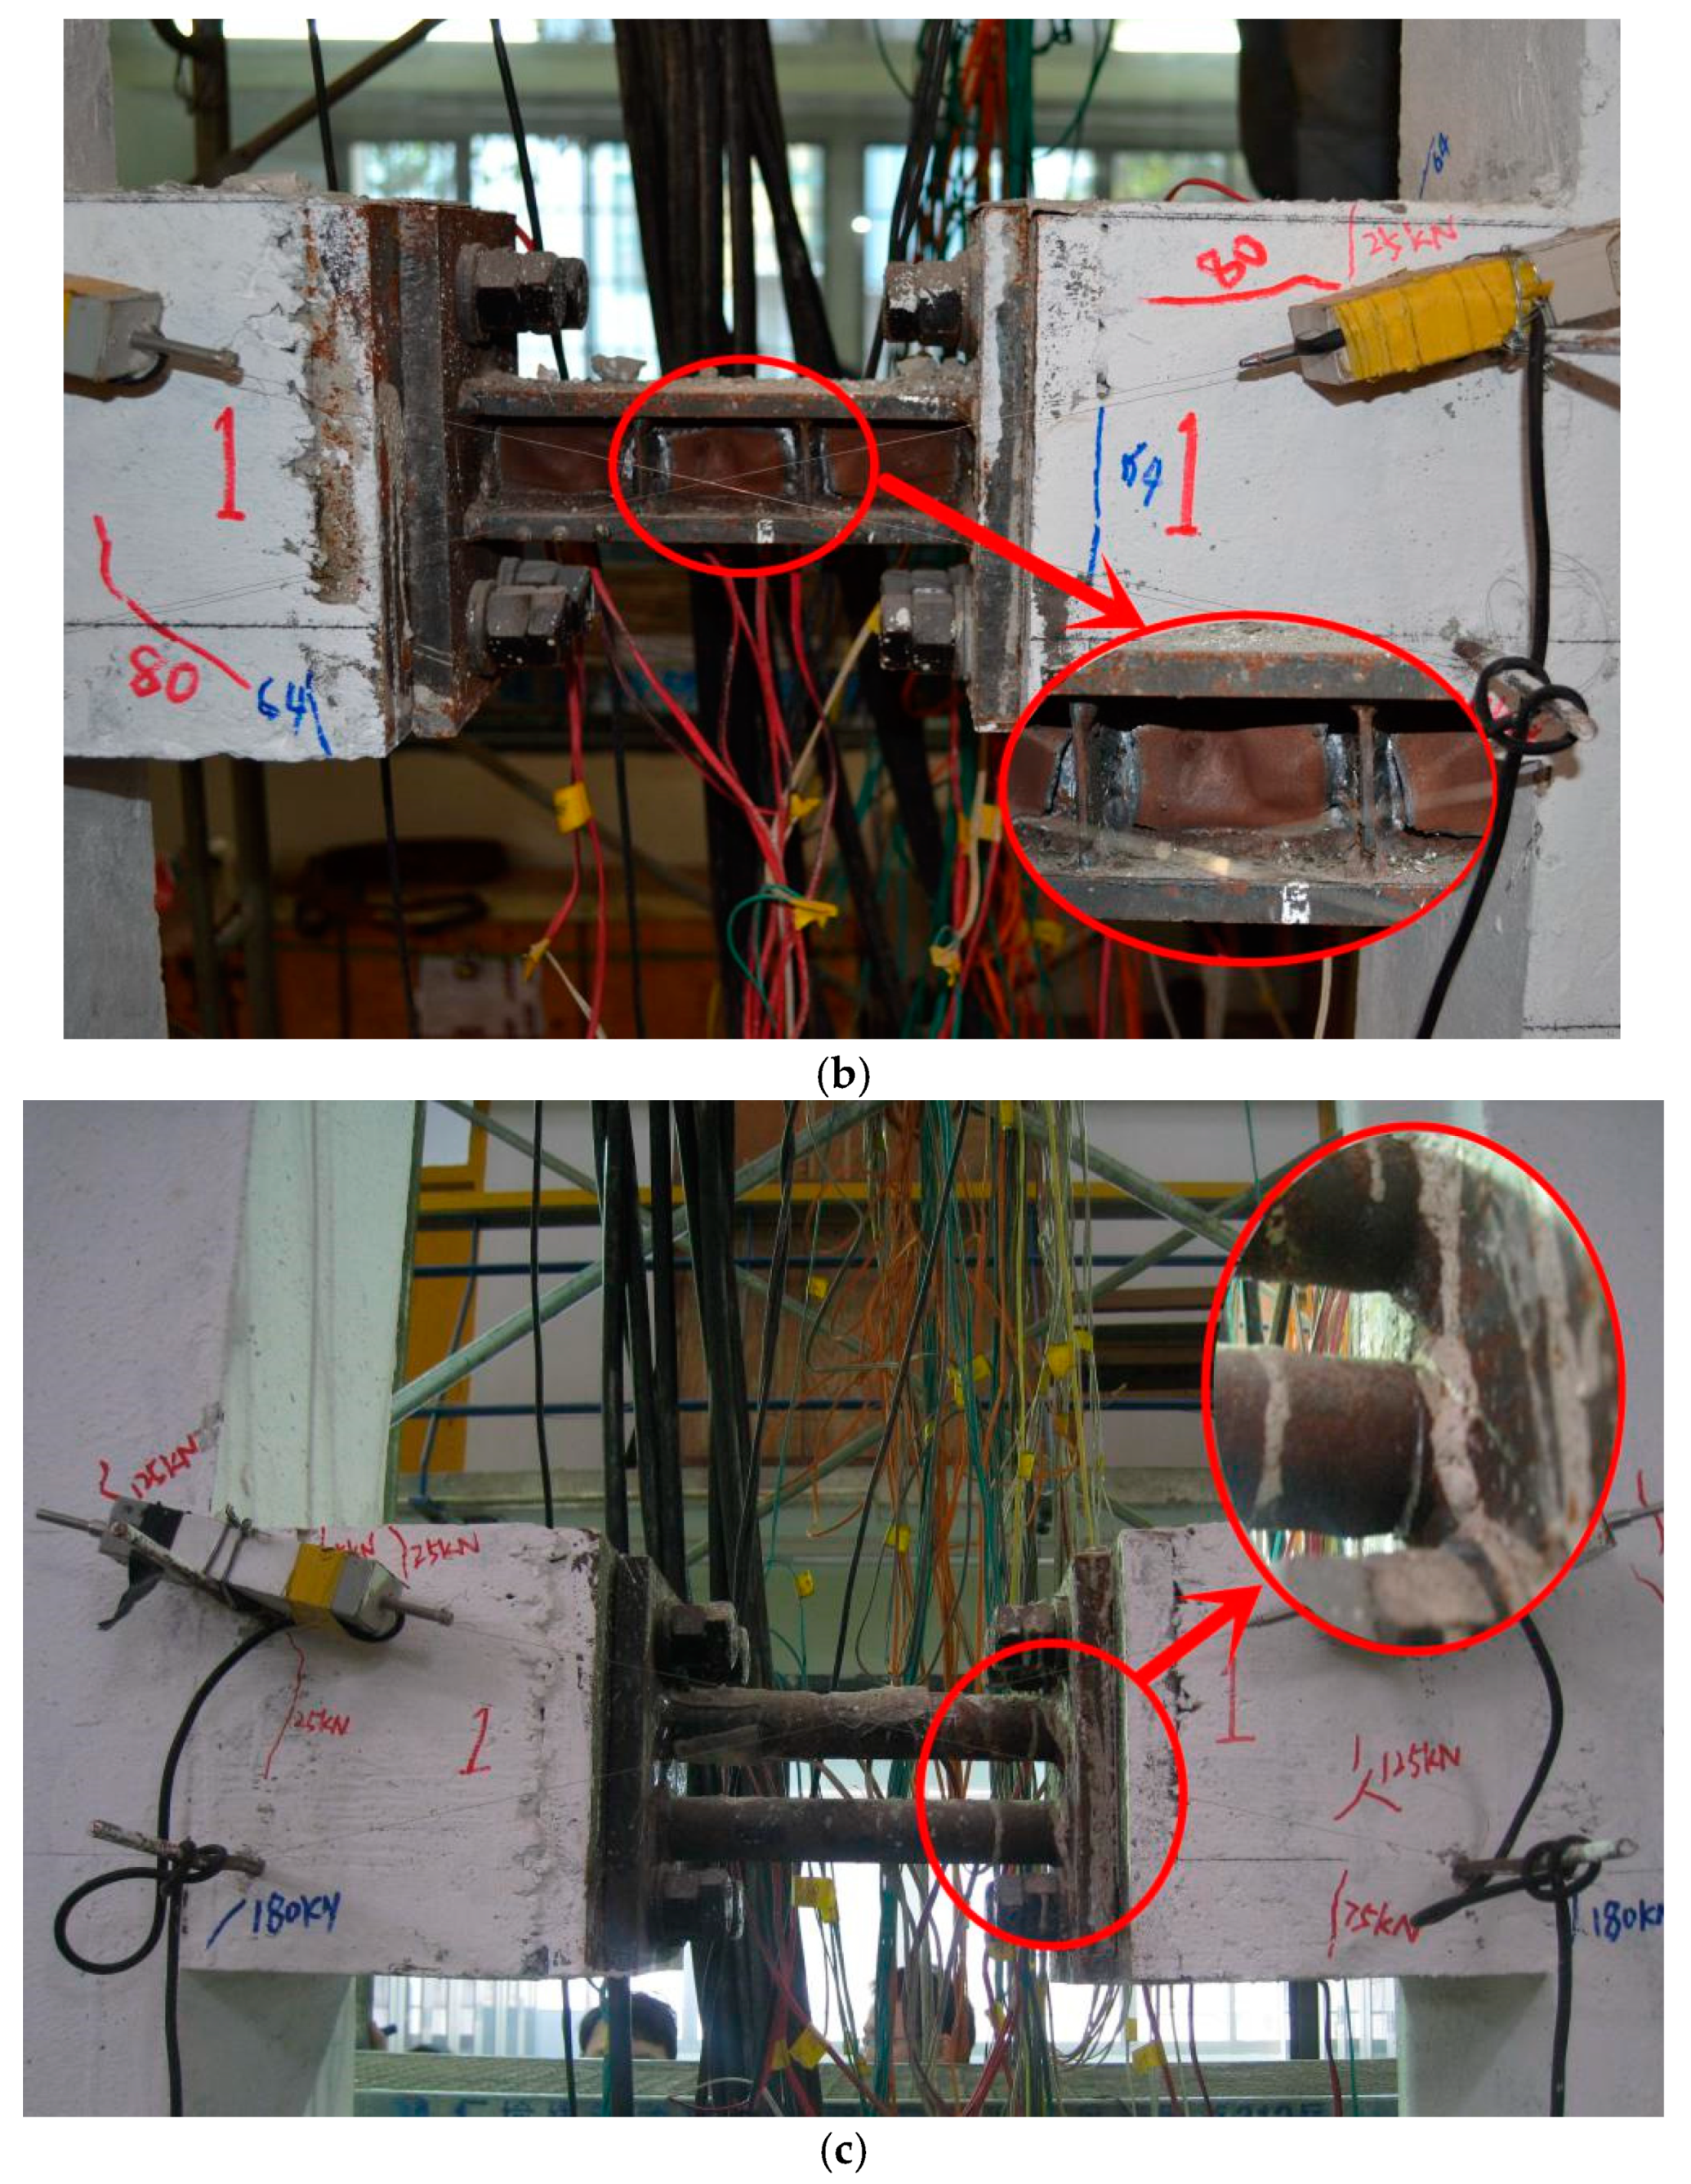
As for CSW, when the lateral force achieved the calculated yield force, vertical bending cracks formed at the beam ends of the first and second floor at the same time. The cracks continued to extend, and then connected. Furthermore, the concrete of the beam ends was crushed on the first floor. Ultimately, except the beam ends, the coupling beam had almost no damage. The failure mode was typical bending failure with plastic hinges, shown in Figure 4a. As for RCBs, the coupling beams of F1SW, F2SW, and F3SW had quite similar failure modes. Some micro cracks firstly appeared at the non-yield sections and beam ends. However, those cracks did not extend visibly any more. The ultimate failure was caused by the destruction of the “fuses”. Taking F1SW as an example, the final cracking status is shown in Figure 4b. In general, coupled walls with RCBs achieved the design intention. The non-yield sections and beam ends were generally not-damaged, with very small residual deformations. The plastic deformation was concentrated at the “fuse”, which was easy to be removed after loading, as shown in Figure 4c.
Probably due to eccentrically loading caused by installation and manufacturing error, F3SW appeared out-of-plane buckling during the loading process. To avoid further buckling, after that F3SW was loaded in one direction, which means the specimen was repeatedly loaded to the maximum displacement and then unloaded until it failed. While the other specimens were repeatedly loaded to the maximum displacement, then unloaded, and then reversely loaded to the maximum displacement.
Although the failure modes of the three RCBs were similar, the yielding mechanisms of the three “fuses” were different, shown in Figure 5. The cracks of the fuses almost occurred at the place where the stress was concentrated, such as the corner of the opening and the weld seam. As for Fuse 1, when the top displacement reached 60mm, cracks formed at the web around the rhombic opening. The cracks first appeared at the corners of the opening due to stress concentration. Then, the cracks continued to extend to the flanges until the web was torn. As for Fuse 2, when the top displacement reached 80mm, cracks first formed at the intersections of the stiffeners and the web probably because of the stress concentration induced by welding. With the increase in displacement, the web near the stiffeners was finally torn. As for Fuse 3, cracks appeared at the tube ends and led to the failure. The difference is that Fuse 3 suffered typical bending failure while Fuse 1 and Fuse 2 suffered shear failure.
3.1.2. Failure Mode of Wall-Piers
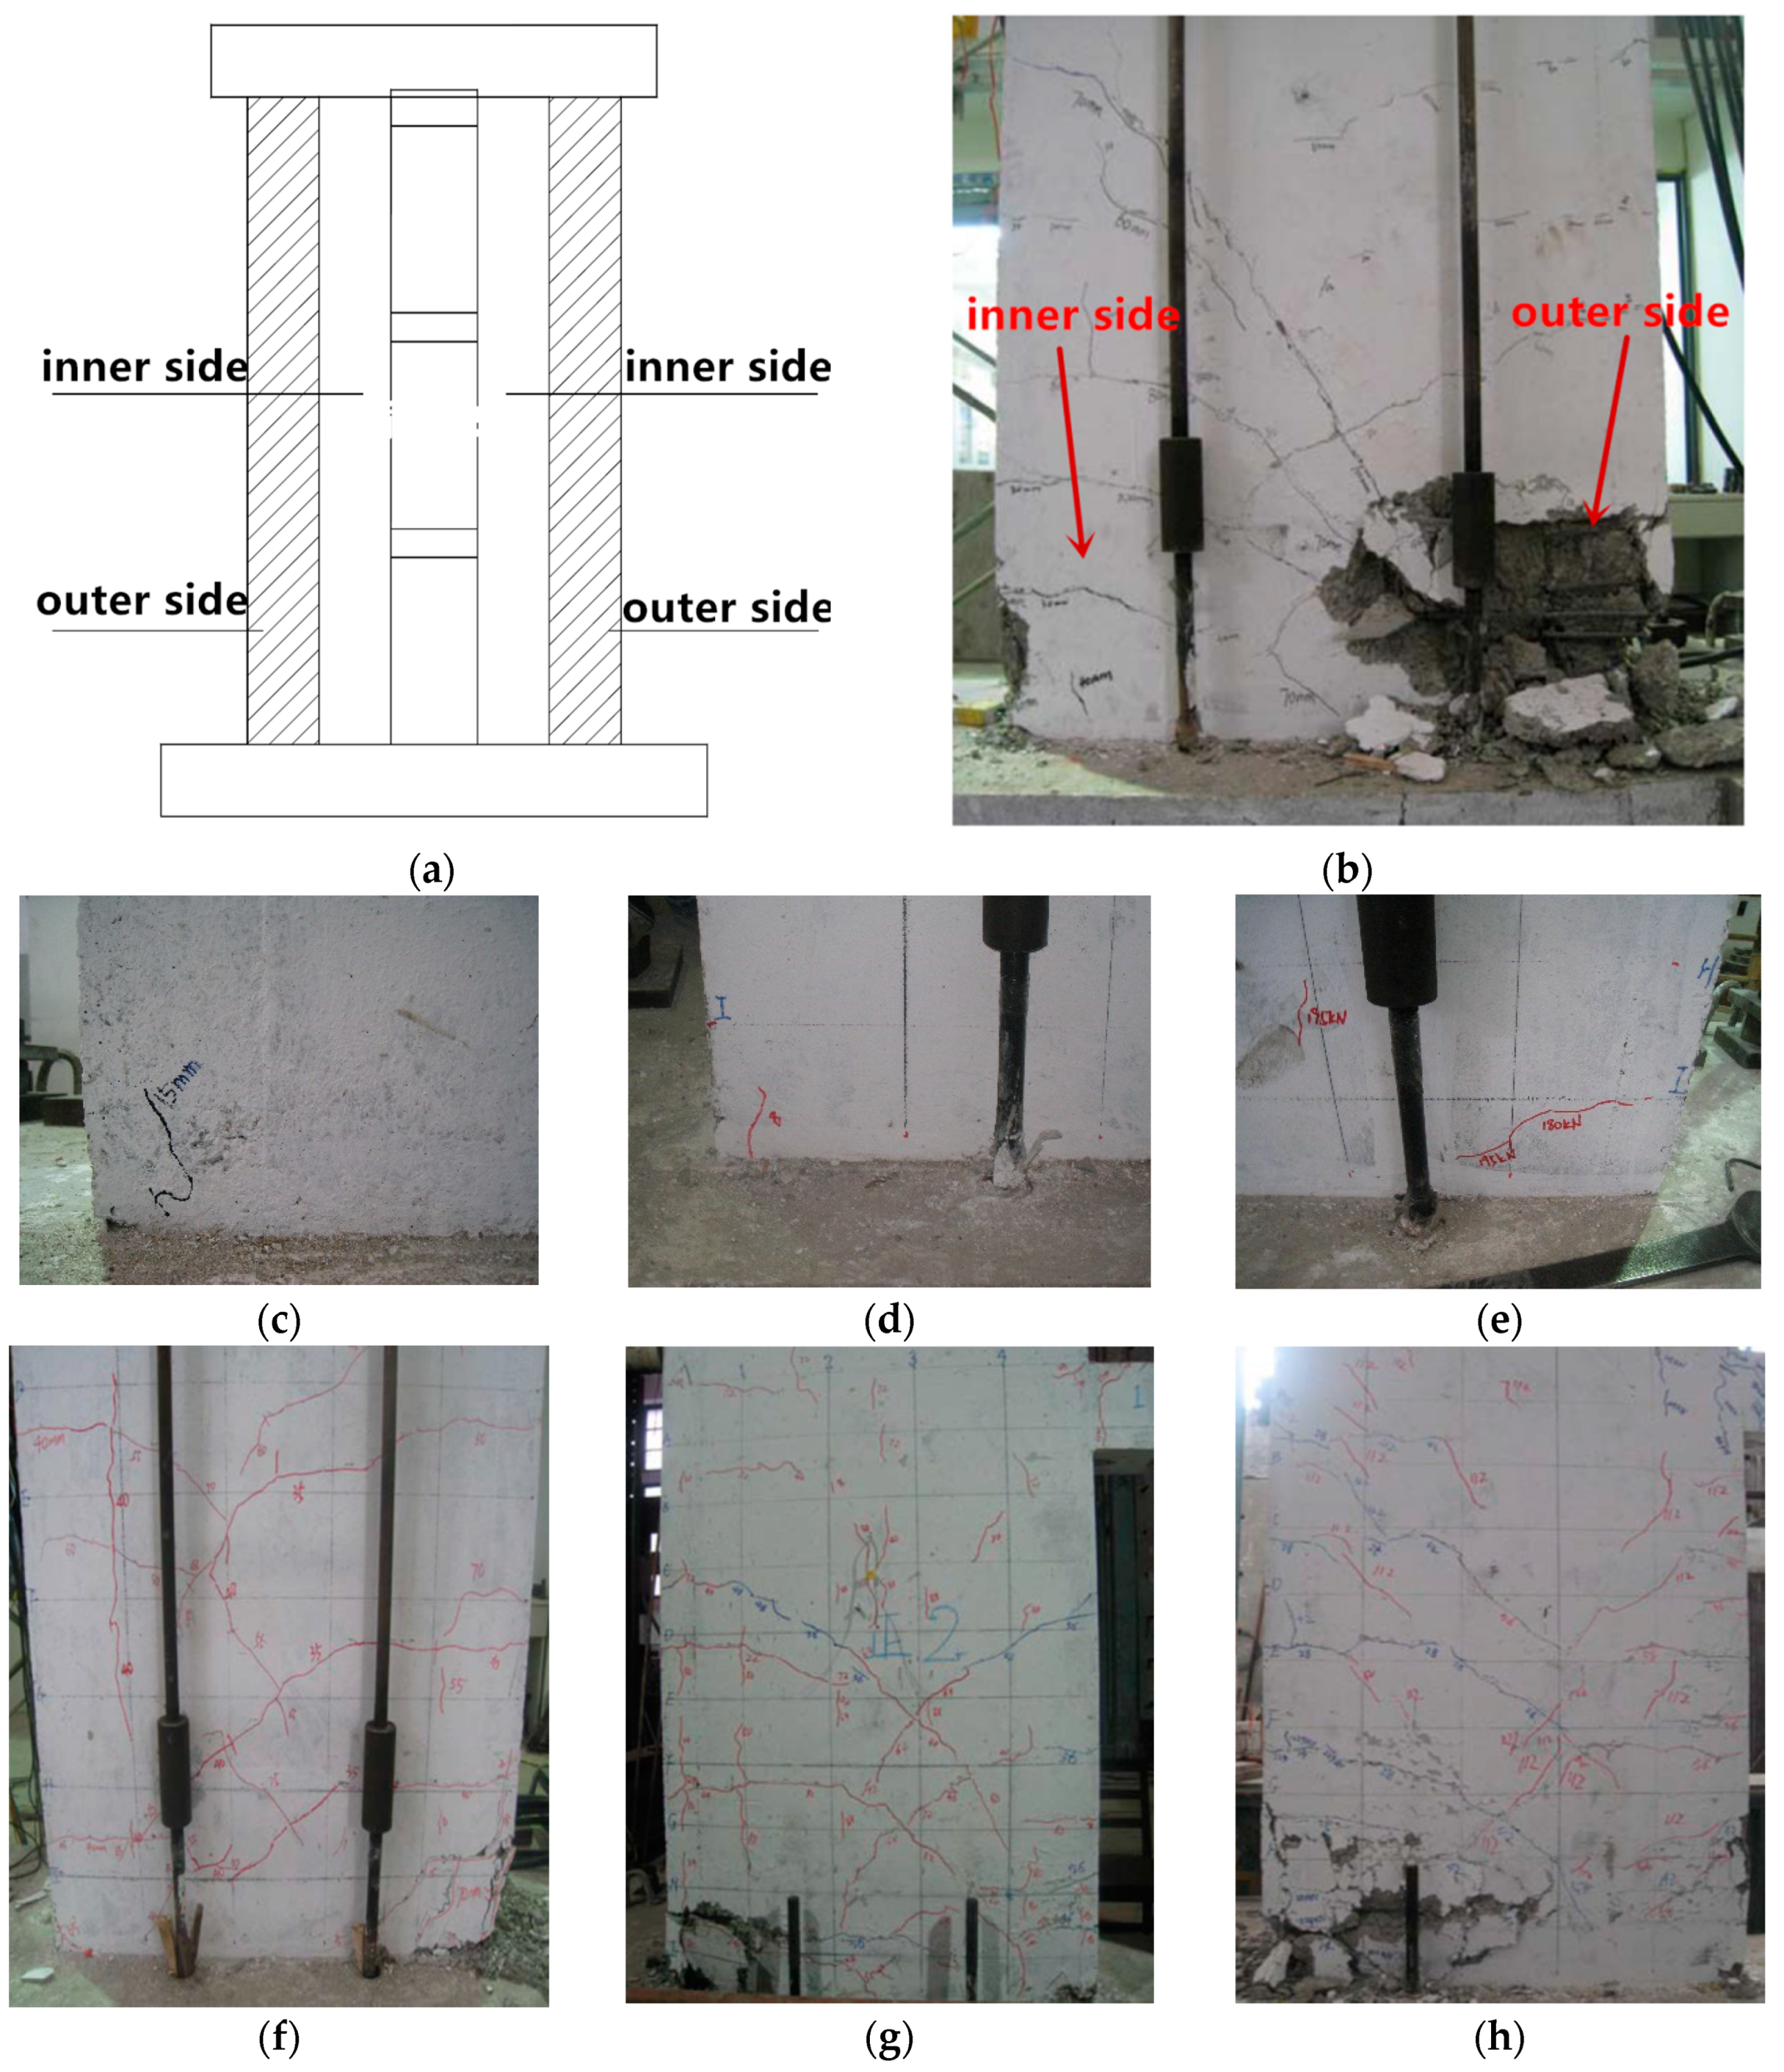
The failure modes of the wall-piers are basically the same, hence the following description is commonly applicable for all specimens. The damages of four specimens are shown in Figure 6. To better describe the experimental phenomena, the wall is divided into the outer side and the inner side as shown in Figure 6a.
At the beginning, small horizontal cracks appeared at the bottom of the outer side, and then those cracks extended obliquely downward. With the increase in loading displacement, some parallel horizontal cracks gradually formed at the outer side. After the coupling beams yielded, horizontal cracks also started to form at the inner side. Those cracks extended obliquely downward as well, and then intersected with the cracks from the outer side. As for CSW, eventually, a concealed column was crushed. Two longitudinal bars of the concealed column were broken while the other two were completely buckled. In addition, the four longitudinal distributing bars near the concealed column were also completely buckled and the concrete was severely crushed. The horizontal length of the crushed part was about 1/2 of the wall-pier’s width. Compared to the outer side, concrete at the inner side was crushed very slightly and the steel bars were not exposed. As for HSWs, the wall-piers had quite similar phenomena to that of CSW, with a ductile failure mode. However, compared to CSW, the damages of HSWs were much lighter.
3.2. Hysteretic Curve and Skeleton Curve
The lateral force and the displacement of the loading point are measured. The hysteretic curves and skeleton curves of the four specimens are drawn in Figure 7 and Figure 8. Because the experiment of CSW is first carried out and the anti-slip measures on the base are not taken in this loading process, the hysteretic curve and skeleton curve of CSW are not symmetrical. After that, anti-slip measures are adopted for the other remaining tests. As for F3SW, Figure 7d depicts the curve before the out-of-plane buckling.
To make a comprehensive comparison of four specimens in terms of bearing capacity, yield displacement, ultimate displacement, etc., Table 2 summarizes the relevant experimental results. The yield displacement is determined by the method put forward by Park [26]. The ultimate bearing capacity equals the damage load or the load when the maximum bearing capacity decreases by 15%. The ductility ratio is the ratio of ultimate deformation to initial yield deformation.
All specimens have similar strength. The yield loads of F1SW, F2SW, and F3SW differ from that of CSW by 0.66%, 6.13% and −6.59%, respectively. At the same time, the peak loads of F1SW, F2SW, and F3SW differ from that of CSW by 0.45%, 6.4% and 1.2%, respectively. In general, the bearing capacities of HSWs are similar to that of CSW.
The ductility ratios of four specimens are also calculated, shown in Table 2. Considering the average ratios of positive and negative directions, the ductility ratio of CSW is 2.75 while those of F1SW, F2SW, and F3SW are 2.86, 2.51 and 3.45. The ratios of F1SW, F2SW, and F3SW differ from that of CSW by 4.00%, −8.73% and 25.45%, respectively. In general, HSW also has desirable ductility, which is very important for earthquake resilience. Among the three HSWs, F3SW possesses the best ductility. However, because F3SW is only loaded in the negative direction after the out-of-plane buckling, the experimental results of F3SW are not sufficiently comparable to that of other specimens. In addition to F3SW, the ductility of F1SW is also satisfactory. The reason is that the rhombic opening at the web of Fuse 1 can enhance the deformability of the fuse by enlarging the yield range of the web.
3.3. Strength Degradation and Stiffness Degradation
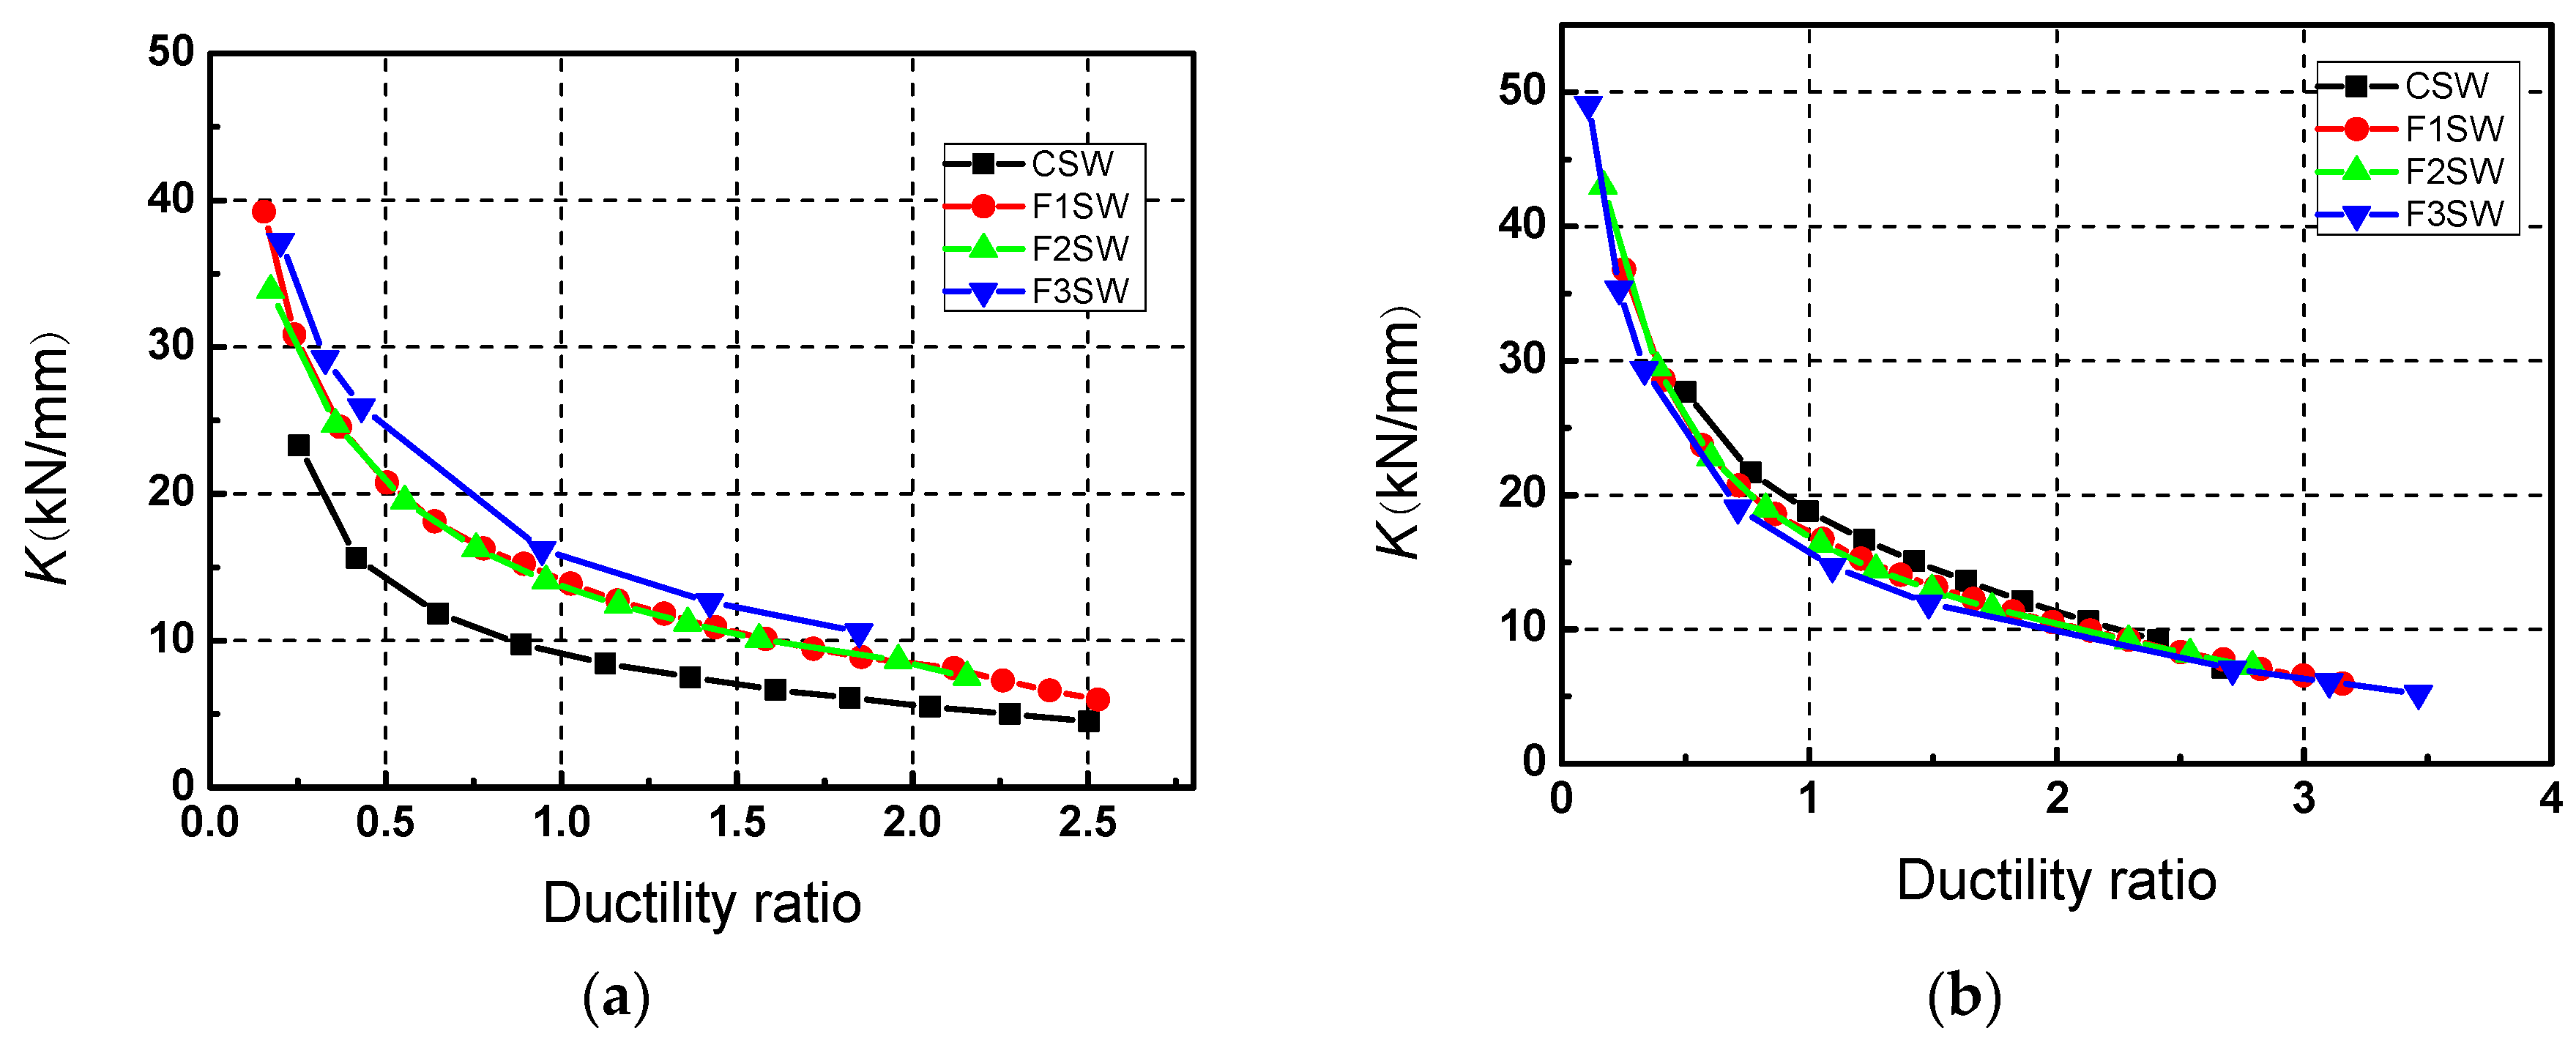
In the experiment, the actuator cycles 3 times at each displacement level. To fully evaluate the load retention capacity of the HSWs, the strength degradation ratio is calculated. The degradation ratio is equal to the ratio of the peak load of the third cycle to that of the first cycle. The secant stiffness is used to calculate the stiffness degradation ratio. The degradation curves of the four specimens are shown in Figure 9 and Figure 10.
In the comparison of strength degradation in positive direction, F3SW is not considered because it is only tested in the negative direction after out-of-plane buckling. From Figure 9a, in the early stage, the strength degradation of F1SW and F2SW are lower than that of CSW. After that, the degradation of F1SW and F2SW are accelerated and exceed CSW temporarily. At last, the strength of CSW degrades rapidly and the degradation ratio eventually reaches 12% while those of F1SW and F2SW are 8.9% and 8%, respectively. When loading in the negative direction, the four curves are very close before the ductility ratio (displacement/yield displacement) reaches 2.14, with the degradation ratios less than 5%. However, CSW’s strength degradation becomes severer after that, and ultimately reaches 21%. Compared to CSW, the degradation curves of HSWs are gentler and the ultimate degradation ratio are less than 10%. In general, the strength retention capacities of HSWs are close or even better than that of CSW. Among the three HSWs, it can be seen that the strength retention capacity of F1SW is relatively better. As for stiffness degradation, the degradation trends of the four specimens are generally the same. However, due to the foundation slip, CSW has some differences in initial stiffness.
3.4. Energy Dissipation Capacity
Equivalent viscous damping coefficient is adopted to evaluate the energy dissipation of the specimens. The calculation of the coefficient is shown in Figure 11a and Equation (1). The viscous damping coefficients of the four specimens are shown in Figure 11b. It can be seen that the equivalent viscous damping coefficients of the specimens are generally very close. Because the lead core in Fuse 2 can dissipate much energy and prevent the webs from buckling, the energy dissipation capacity of F2SW is better. As for F3SW, the coefficient curve is incomplete because of the out-of-plane buckling. In general, HSWs have desirable energy dissipation capacities.
where represents the area of the oval; and represent the area of the triangle OBE and ODE, respectively.
3.5. Strain Analysis
According to the design purpose of the RCB, the non-yield section of the beam should remain intact during the deformation process of the shear wall. The strain analysis can reveal the damage of the coupling shear walls. Hence, strain gauges are embedded in the concrete to examine the strains at critical locations. By analyzing the strain of the embedded steel and reinforcements, it is shown that the non-yield section does not yield although there are some micro cracks in the test. The strains of the longitudinal bars, the stirrups, and the embedded steel (flange and web) are quite small. The absolute values of the strains for F1SW, F2SW, and F3SW are less than 500 × 10−6, 1200 × 10−6 and 300 × 10−6 respectively, which are much lower than the yield strains.
In addition, the strains of the longitudinal reinforcements of the concealed columns are also measured. All specimens have plastic hinges at the wall foots. As for CSW, the plastic area extends to the second floor. However, as for HSWs, the plastic area is only within the first floor and the longitudinal reinforcements on the second floor do not yield. Because the “fuses” can dissipate much energy, the wall foots of HSWs do not dissipate as much energy as CSW does. The strain analysis shows that the damage area of wall-piers for HSWs is smaller than that of CSW, which is consistent with the experimental phenomena.
3.6. Discussions and Suggestions
The following discussions are based on the experimental phenomena and test data. In addition, some preliminary suggestions for the conceptual design of HSWs with RCBs are proposed. In general, this experiment proves that although the three fuses are different in working mechanism, the three HSWs exhibit similar global performance in terms of failure mode, hysteretic behavior, etc. However, the three HSWS still have some differences in specific properties.
As for F1SW, Fuse 1 is an I-shape steel with a rhombic opening at the web. Compared to CSW, although the equivalent viscous damping coefficient of F1SW is slightly smaller, the coupling beams of F1SW are still considered to be good at dissipating energy considering that the wall-piers of F1SW dissipate much less energy. In addition, the ductility and load retention capacity of F1SW are also desirable. Considering the simple construction of Fuse 1, this type of RCBs can be widely used in engineering. Besides, if the opening at the web is more rounded to reduce the stress concentration, the anti-cracking ability of Fuse 1 will be enhanced.
As for F2SW, Fuse 2 is a double-web I-shape steel and the gap between the two webs is filled by lead to dissipate more energy. Compared to CSW, the stress of the longitudinal reinforcement of the concealed column is smaller and the plastic area is also smaller, which indicates that the energy dissipated by the wall-piers of F2SW is less. However, the equivalent viscous damping coefficient of F2SW is even larger, which proves that the RCBs of F2SW can dissipate much energy. This proves that installing components with high energy dissipation capacity at mid-span of the coupling beam is practical to improve the energy dissipation capacity of the coupled wall system. In addition, because the cracks of Fuse 2 almost formed at the intersections of the stiffeners and web due to stress concentration, improving the welding quality of the stiffeners might enhance the ductility of F2SW.
As for F3SW, due to the out-of-plane buckling, the experimental data is incomplete in positive direction. Although the remaining data is not sufficiently comparable to that of other specimens, it still reflects the performance of F3SW. The failure mode is similar to that of F1SW and F2SW, and the ductility and load retention ability in the negative direction are satisfactory. In addition, F3SW possesses the best energy dissipation capacity before the out-of-plane buckling. The experiment indicates F3SW still has a good researching prospect. In the further research, improvements such as adding longitudinal stiffeners at the fuse should be taken to prevent out-of-plane buckling.
4. Finite Element Implementation
To further study the seismic behavior of HSWs with RCBs, finite element models are established by ABAQUS software. The same loading conditions as the experiment are applied. The deformations and damage distribution are properly simulated. The skeleton curves of the four specimens are also obtained, which are compared to the experimental results.
4.1. Modeling Method
The wall-piers and coupling beams are modeled by 8-node reduced integrated solid element C3D8R [27]. C3D8R has one less integration point in each direction compared to the fully integrated element. Hence, even if torsional deformation appears, the accuracy of the analysis will not be greatly affected. In addition, this element is not prone to shear locking under bending moment. The three “fuses” and the embedded steel are also modeled by C3D8R. The slip between the lead core and steel plate in Fuse 2 and Fuse 3 is neglected. Furthermore, the reinforcements are modeled by the truss element T3D2. The reinforcements and embedded steel members are embedded into the concrete elements using the command *Embedded Element, neglecting the slip between steel and concrete.
In the simulation, the strengths of the steel and concrete are consistent with the measured values in the experiment, shown in Table 3. The constitutive model of the steel is isotropic hardening model [28] while that of the concrete is plastic-damage model [29]. In ABAQUS software, Concrete Damaged Plasticity model is chosen. Command *Concrete Damaged Plasticity defines some critical parameters of the concrete model shown in Table 4.
The uniaxial compressive stress-strain relationship of the concrete is defined by Hognestad model [30]. Furthermore, the tensile stress-strain relationship of the concrete is assumed to be linear elastic before the peak stress. After that, post-peak tensile model given by Reinhardt and Cornelissen is applied [31]:
where represents the tensile strength; represents the ultimate tensile strain; and .
According to previous research [32], the compressive and tensile damage factors are obtained by equations as follows:
where and represent the compressive and tensile strain while and represent the corresponding stress; and represent the compressive and tensile plastic strain; and represent the compressive and tensile inelastic strain (considering concrete damage, ); represents the initial elastic modulus; and represent the compressive and tensile damage factors, respectively.
4.2. Simulated Deformation
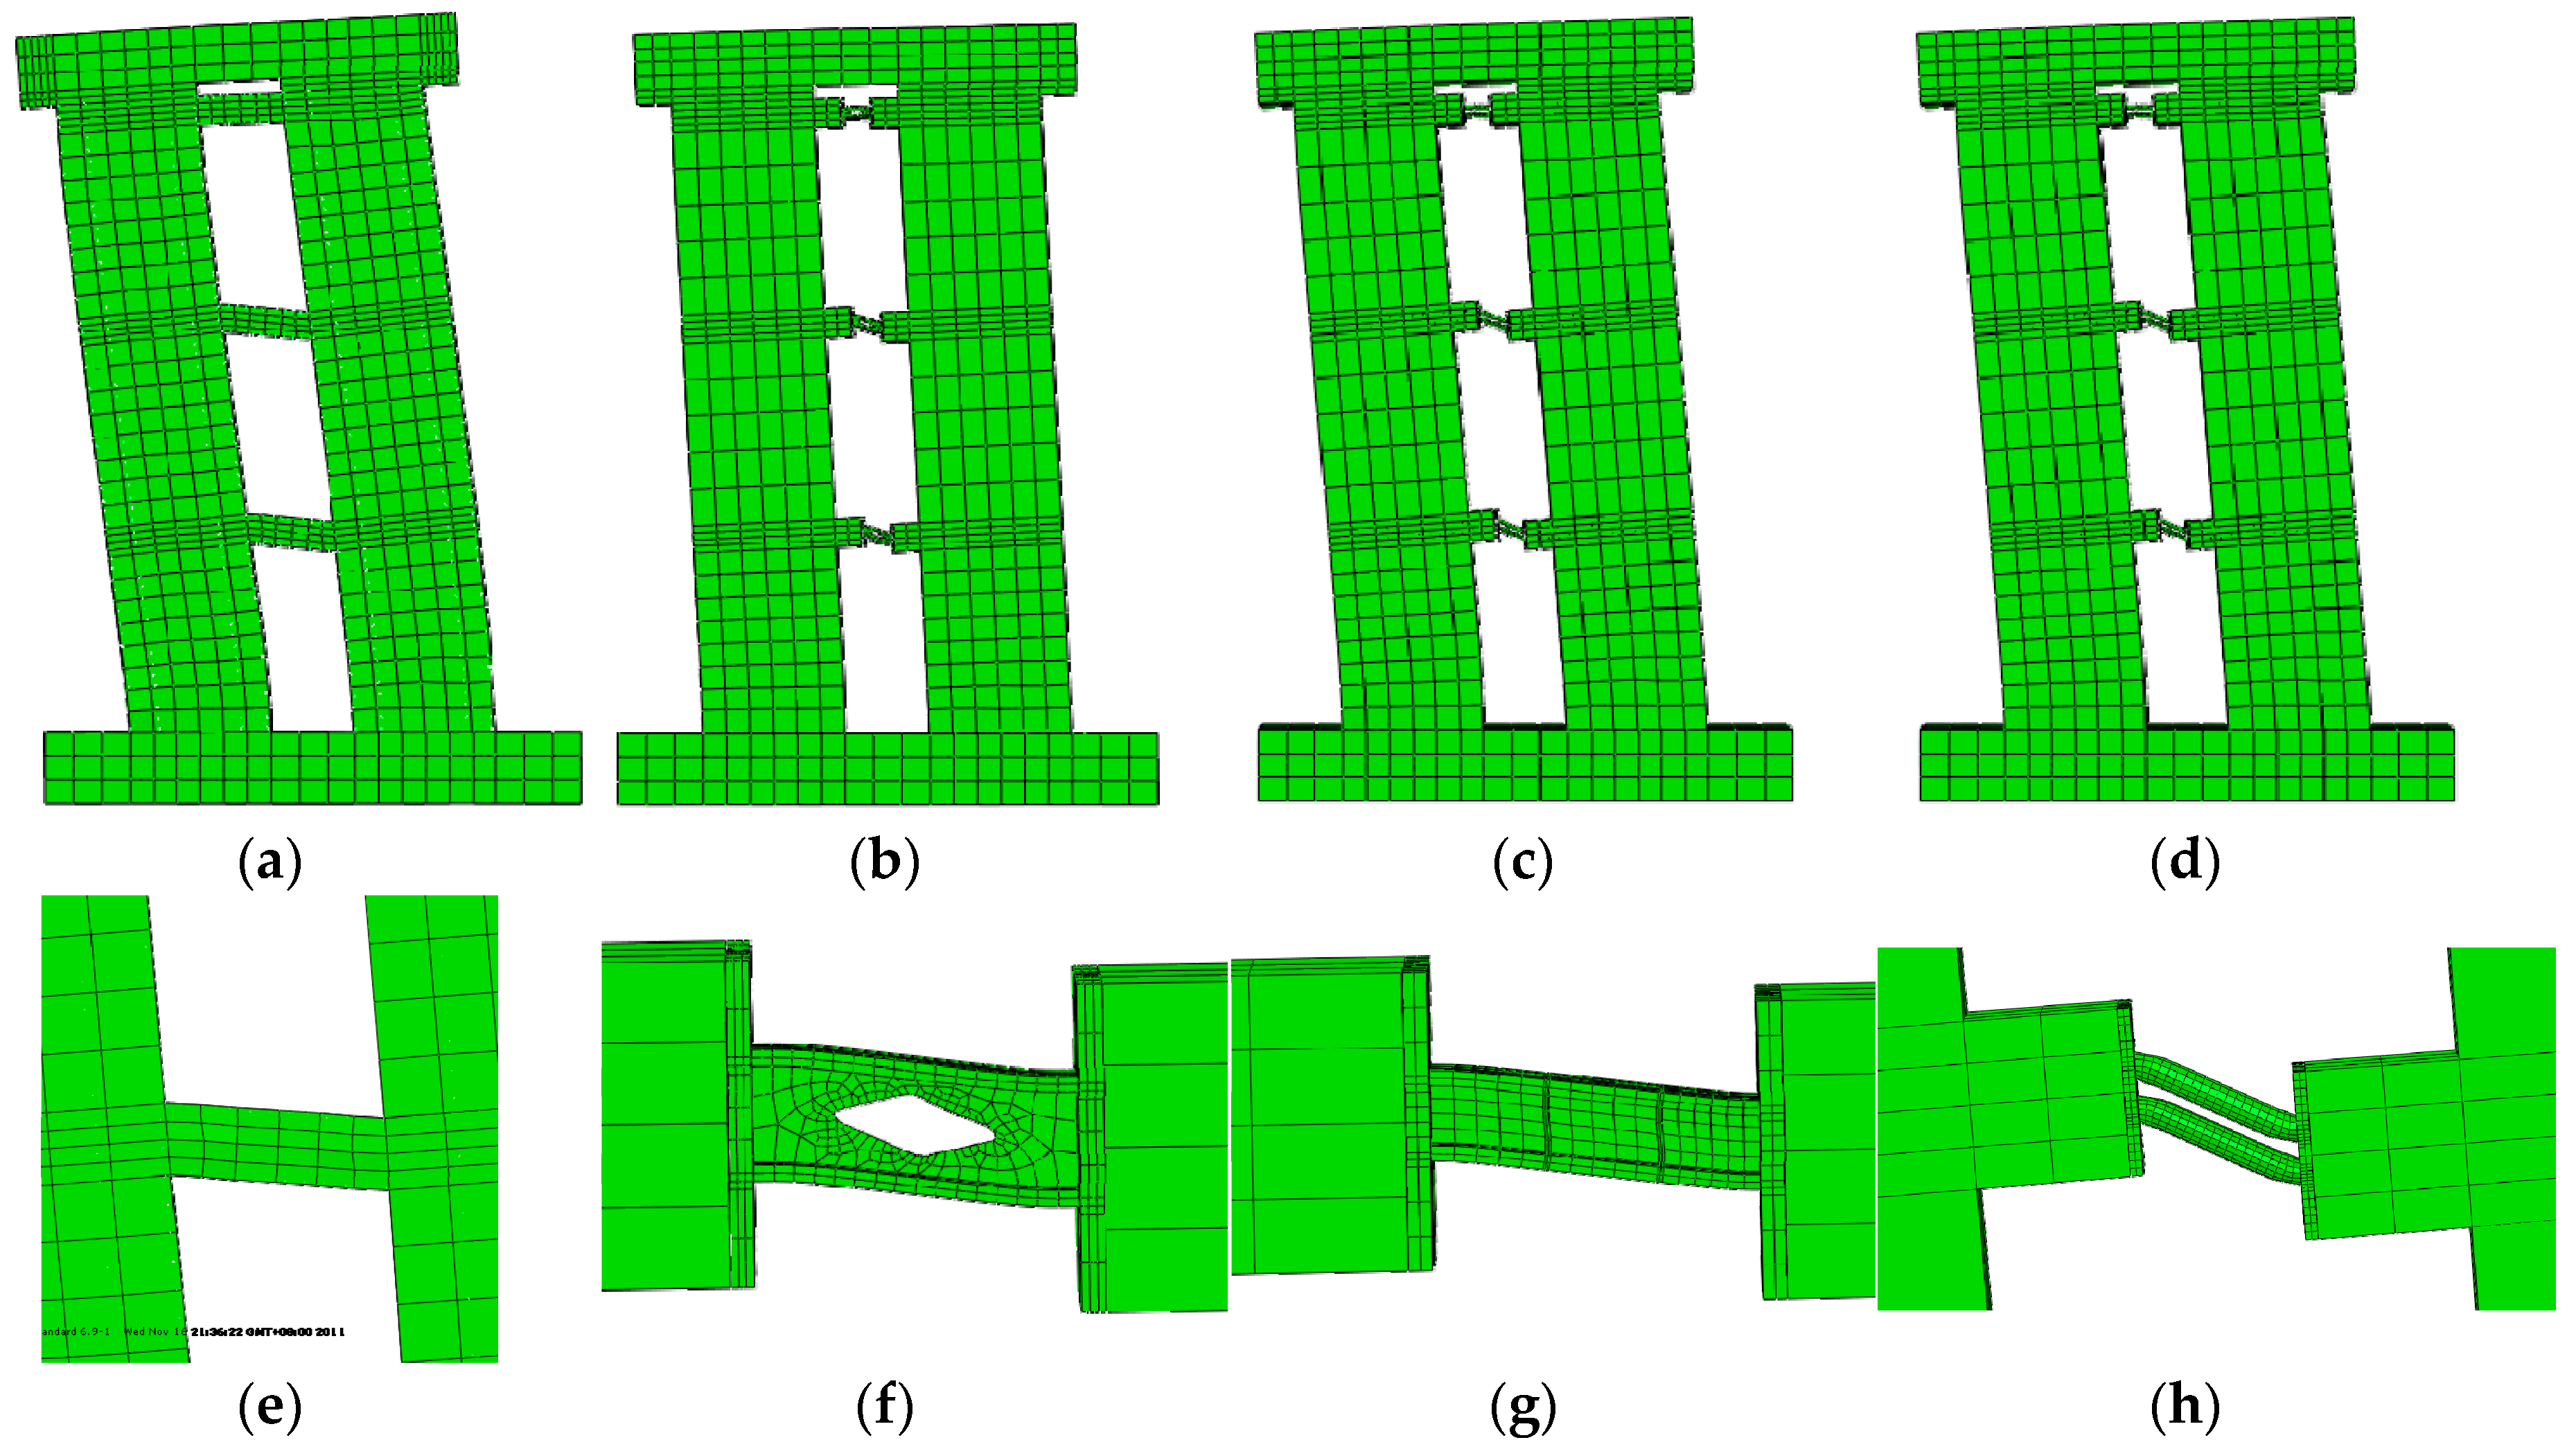
The simulated deformations of the four specimens are obtained. The coupling beams of CSW suffer typical bending deformation, which is identical to the experimental phenomenon that plastic hinges form at the ends of the coupling beam. As for F1SW, F2SW, and F3SW, the deformations of the coupling beams are concentrated at the “fuses”. The non-yield sections have almost no deformation and remain vertical to the wall-piers. The deformations are shown in Figure 12. For more obvious demonstration, the deformations are magnified three times in this figure.
4.3. Yield Sequence
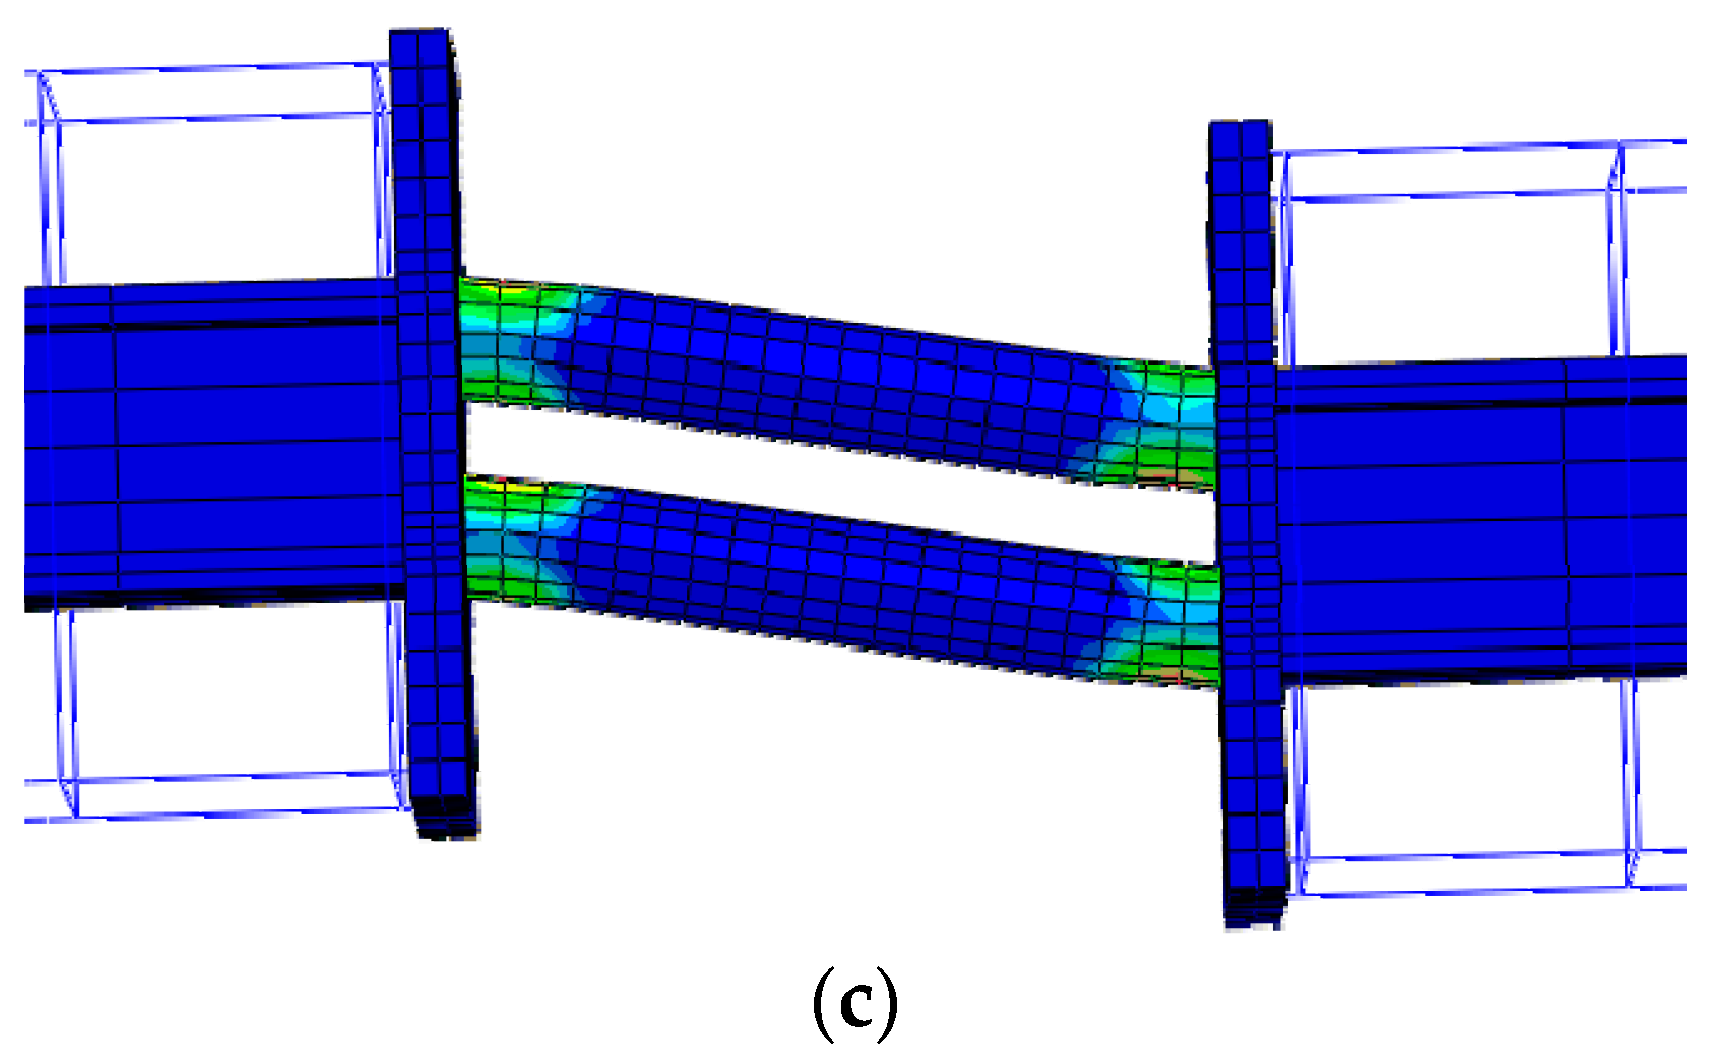
By observing the equivalent plastic strains of the reinforcements and fuses at different loading steps, the yield sequence of different parts of the shear wall is determined. As for F1SW, the loading process includes 307 steps. At step 7, the “fuses” of the first and second floor first yield while the longitudinal reinforcements at wall foots remain elastic. At step 20, the longitudinal reinforcements at the wall foots start to yield. As for F2SW and F3SW, the yield sequences of different parts are the same as F1SW in that the “fuses” yield first and then the longitudinal reinforcements inside the wall yield. The ideal yield sequence is achieved. The final equivalent plastic strain diagrams of the RCBs are shown in Figure 13. The plastic strains of the “fuses” are much larger than those of the longitudinal reinforcement, stirrups and embedded steels, which are consistent with the experimental phenomena.
4.4. Concrete Damage Analysis
By extracting the tensile damage factor , the cracking of the concrete can be visually reflected, shown in Figure 14.
From Figure 14a, it can be seen that the tensile parts of the wall-piers and coupling beams are suffering severe damages. The damage area has extended to the second floor and the top of the wall also has severe damages due to stress concentration. The damage condition is consistent with the experimental phenomenon. Compared to CSW, HSWs are much less damaged at the coupling beams. Although the tensile parts of the wall-piers also have visible damages, the damage areas of the three HSWs are smaller and do not extend to the second floor. In general, the damage distribution of the finite element simulation agrees well with the experimental results discussed in Section 3.5.
4.5. Skeleton Curve
The simulated and experimental skeleton curves of the four specimens are shown in Figure 15. It can be seen that the simulated peak bearing capacities of the four specimens all agree well with the experimental results, with the maximum deviation less than 5%. In addition, the simulated curves and the experimental curves are very consistent in terms of initial stiffness as well. However, some differences between the simulated and experimental yield bearing capacities are still noticed. As for CSW, the simulated yield bearing capacity is visibly larger than the experimental result especially in the positive direction, which is probably due to the base slip in the experiment. As for F1SW and F2SW, the simulated yield bearing capacities are also slightly larger than experimental results, but the deviations are acceptable. As for F3SW, the skeleton curve of is incomplete in positive direction due to out-of-plane buckling but the simulated curve is close to the experimental curve in negative direction.
In conclusion, the skeleton curves of HSWs can be well simulated by ABAQUS software. However, the descending stage of the curve is hard to simulate. It is very difficult to simulate the hysteretic response of reinforced concrete low shear wall with ABAQUS. Firstly, it is difficult to converge, and secondly, the pinching effect of hysteretic curve is hard to simulate. Hence, in Ref [22], the authors apply OpenSEES software to simulate the hysteretic curves, which are in good agreement with the experimental curves.
5. Conclusions
This paper compares the seismic performance of HSWs with RCBs and a concrete shear wall (CSW) in terms of bearing capacity, deformability, energy consumption, and damage distribution, etc. Based on the results of cyclic reversal test and finite element analysis, the following conclusions are drawn.
- (1)
- Although the three fuses are different in working mechanism, the three HSWs exhibit similar global seismic performance. Under cyclic lateral forces, the plastic deformations of conventional coupling beams are concentrated at the beam ends, which are also the most vulnerable to damage. As for the three HSWs, the deformations of the beams are concentrated at the “fuses”, which can be easily replaced. The wall foots of CSW are severely crushed while those of HSWs are not.
- (2)
- It is proved that HSWs meet the design requirements as CSW, with many desirable properties. The strength, ductility, energy dissipation capacity, and stiffness degradation rules of HSWs are similar to those of CSW. At the same time, the load retention capacity of HSWs are also close or even better than that of CSW.
- (3)
- Strain analysis shows that the plastic area of the wall-piers of CSW extends to the second floor, causing widespread damage. As for HSW, the plastic area is only within the first floor. At the same time, the embedded steel, and longitudinal steel bars of the non-yield sections are far from yielding.
- (4)
- The deformation, yield sequence, hysteretic behavior, and damage distribution of HSWs can be well simulated in ABAQUS software. In addition, nonlinear finite element analysis proves that HSWs have ideal yield sequence that the “fuses” yield earlier than the wall foots. More importantly, numerical simulation verifies that the damage of the RCBs is concentrated at the “fuses” and the concrete damage of HSWs is visibly alleviated.
- (5)
- Among the three HSWs, F1SW is better in ductility and load retention ability, while F2SW is better in energy consumption. In general, both F1SW and F2SW have good application prospects, with desirable seismic properties. The cracks of Fuse 1 and 2 first appear at the place where the stress is concentrated. If the stress concentration can be alleviated by optimizing the opening angle and improving the welding quality, the anti-cracking capacity of Fuse 1 and 2 may be improved. As for F3SW, despite the out-of-plane buckling, it still has ideal failure mode and good seismic performance. In the further research, improvements such as adding longitudinal stiffeners at the fuse should be taken to prevent out-of-plane buckling. In the authors’ opinion, F1SW is the easiest one to be designed and fabricated in engineering applications because the configuration of Fuse 1 is relatively simpler, hence engineers can easily simulate its mechanical behavior and further obtain the practical design methods. Compared to Fuse 1, the configurations of Fuse 2 and 3 are more complicated. The interaction mechanism between lead core and steel plate is complicated, which will need more works to solve it.
Author Contributions
Funding acquisition, Z.L.; Investigation, Y.C.; Project administration, Y.C. and Z.L.; Software, J.L. and Z.L.; Writing—original draft, J.L.; Writing—review and editing, Z.L.
Funding
Financial supports from the National Key Research and Development Program of China (2017YFC1500701) and the Program of Shanghai Academic Research Leader (18XD1403900) are highly appreciated. The financial supports from the National Natural Science Foundation of China (51408170), the Academic Innovation Plan of Hainan Science and Technology Association for Young Scientists (201601), Hainan Key R & D Program (ZDYF2016151), and the Midwest Key Areas Construction Project Plan of Hainan University under (ZXBJH-XK011) are also gratefully appreciated.
Conflicts of Interest
The authors declare no conflict of interest.
References
- Ang, H.S. Seismic Damage Analysis of Reinforced Concrete Buildings. J. Struct. Eng. 1985, 111, 740–757. [Google Scholar]
- Takeda, T. Reinforced Concrete response to simulated earthquakes. J. Struct. Div. Proc. Am. Soc. Civil Eng. 1970, 96, 2557–2573. [Google Scholar]
- Lu, Z.; Chen, X.; Lu, X.; Yang, Z. Shaking table test and numerical simulation of an RC frame-core tube structure for earthquake-induced collapse. Earthq. Eng. Struct. Dyn. 2016, 45, 1537–1556. [Google Scholar] [CrossRef]
- El-Tawil, S.; Kuenzli, C.; Hassan, M.; Kunnath, S. Inelastic Behavior of Hybrid Coupled Walls. J. Struct. Eng. 2004, 130, 285–296. [Google Scholar]
- Aristizabal-Ocfaoa, J.D. Seismic Behavior of Slender Coupled Wall Systems. J. Struct. Eng. 1987, 113, 2221–2234. [Google Scholar] [CrossRef]
- Paulay, T. Coupling Beams of Reinforced Concrete Shear Walls. J. Struct. Div. 1971, 97, 843–862. [Google Scholar]
- Hindi, R.A.; Hassan, M.A. Shear capacity of diagonally reinforced coupling beams. Eng. Struct. 2004, 26, 1437–1446. [Google Scholar] [CrossRef]
- Galano, L.; Vignoli, A. Seismic behavior of short coupling beams with different reinforcement layouts. Struct. J. 2000, 97, 876–885. [Google Scholar]
- Ding, D.; Cao, Z.; Zhang, S. Experimental studies of new ductile coupling beams and multi-storey shear walls. Mater. Struct. 1997, 30, 566–573. [Google Scholar]
- Parramontesinos, G.J.; Canbolat, B.A. Experimental Study on Seismic Behavior of High-Performance Fiber-Reinforced Cement Composite Coupling Beams. Struct. J. 2005, 102, 159–166. [Google Scholar]
- Lu, X.; Mao, Y.; Chen, Y.; Liu, J.; Zhou, Y. New structural system for earthquake resilient design. J. Earthq. Tsunami 2013, 7, 1350013. [Google Scholar] [CrossRef]
- Vargas, R.; Bruneau, M. Experimental Response of Buildings Designed with Metallic Structural Fuses. II. J. Struct. Eng. 2009, 135, 394–403. [Google Scholar] [CrossRef]
- Vargas, R.; Bruneau, M. Analytical Response and Design of Buildings with Metallic Structural Fuses. I. J. Struct. Eng. 2009, 135, 386–393. [Google Scholar] [CrossRef]
- Fortney, P.J.; Shahrooz, B.M.; Rassati, G.A. Large-Scale Testing of a Replaceable “Fuse” Steel Coupling Beam. J. Struct. Eng. 2007, 133, 1801–1807. [Google Scholar] [CrossRef]
- Li, X.; Lv, H.L.; Zhang, G.C.; Ding, B.-D. Seismic behavior of replaceable steel truss coupling beams with buckling restrained webs. J. Constr. Steel Res. 2015, 104, 167–176. [Google Scholar] [CrossRef]
- Ji, X.; Liu, D.; Sun, Y.; Hutt, C.M. Cyclic Behavior of Replaceable Steel Coupling Beams. Earthq. Eng. Struct. Dyn. 2017, 46, 517–535. [Google Scholar] [CrossRef]
- Wang, L.; Mao, C.; Dong, J. Seismic performance of shear wall structure with shape memory alloy dampers in coupling beams. World Earthq. Eng. 2011, 27, 101–107. [Google Scholar]
- Kurama, Y.C.; Shen, Q. Posttensioned Hybrid Coupled Walls under Lateral Loads. J. Struct. Eng. 2004, 130, 297–309. [Google Scholar] [CrossRef]
- Kurama, Y.C.; Shen, Q. Nonlinear Behavior of Posttensioned Hybrid Coupled Wall Subassemblages. J. Struct. Eng. 2002, 128, 1290–1300. [Google Scholar]
- Ji, X.; Liu, D.; Sun, Y.; Hutt, C.M. Seismic performance assessment of a hybrid coupled wall system with replaceable steel coupling beams versus traditional RC coupling beams. Earthq. Eng. Struct. Dyn. 2017, 46, 517–535. [Google Scholar] [CrossRef]
- Shahrooz, B.M.; Fortney, P.J.; Harries, K.A. Steel Coupling Beams with a Replaceable Fuse. J. Struct. Eng. 2018, 144, 04017210. [Google Scholar] [CrossRef]
- Lu, X.; Chen, Y.; Jiang, H. Earthquake resilience of reinforced concrete structural walls with replaceable “fuses”. J. Earthq. Eng. 2016, 22, 801–825. [Google Scholar] [CrossRef]
- Lu, X.; Jiang, H. Recent progress of seismic research on tall buildings in China Mainland. Earthq. Eng. Eng. Vib. 2014, 13, 47–61. [Google Scholar] [CrossRef]
- GB50011. Code for Seismic Design of Buildings in China; China Architecture & Building Press: Beijing, China, 2010.
- GB50010. Code for Design of Concrete Structures; China Architecture & Building Press: Beijing, China, 2015.
- Park, R.; Paulay, T. Reinforced Concrete Structures; John Wiley & Sons.: New York, NY, USA, 1975. [Google Scholar]
- Hibbit, Karlsson & Sorensen, Inc. ABAQUS User’s Manual; Hibbit, Karlsson & Sorensen, Inc.: Johnston, RI, USA, 2018. [Google Scholar]
- Håkansson, P.; Wallin, M.; Ristinmaa, M. Comparison of isotropic hardening and kinematic hardening in thermoplasticity. Int. J. Plast. 2005, 21, 1435–1460. [Google Scholar] [CrossRef]
- Lubliner, J.; Oliver, J.; Oller, S.; Oñate, E. A plastic-damage model for concrete. Int. J. Solids Struct. 1989, 25, 299–326. [Google Scholar] [CrossRef]
- Wight, J.K.; Macgregor, J.G. Reinforced Concrete-Mechanics and Design; Pearson Prentice Hall: Upper Saddle River, NJ, USA, 2009. [Google Scholar]
- Reinhardt, H.W.; Cornelissen, H.A.W. Post-peak cyclic behaviour of concrete in uniaxial tensile and alternating tensile and compressive loading. Cem. Concr. Res. 1984, 14, 263–270. [Google Scholar] [CrossRef]
- Zhang, J.; Wang, Q.; Hu, S. Parameters Verification of Concrete Damaged Plastic Model of ABAQUS. Build. Struct. 2008, 38, 127–130. [Google Scholar]
Figure 1.
Dimensions of the specimens.

Figure 2.
Details of the beams: (a) conventional coupling beam; (b) replaceable coupling beam; (c) embedded steel; (d) pictures of three types of fuses.
Figure 2.
Details of the beams: (a) conventional coupling beam; (b) replaceable coupling beam; (c) embedded steel; (d) pictures of three types of fuses.


Figure 3.
Experimental setup: (a) loading device; (b) loading history; (c) test configuration.


Figure 4.
Failure mode of coupling beams: (a) initial cracking of CSW; (b) ultimate state of CSW; (c) initial cracking of F1SW; (d) ultimate state of F1SW; (e) remove the “fuse”.
Figure 4.
Failure mode of coupling beams: (a) initial cracking of CSW; (b) ultimate state of CSW; (c) initial cracking of F1SW; (d) ultimate state of F1SW; (e) remove the “fuse”.

Figure 5.
Failure mode of “fuses”: (a) Fuse 1; (b) Fuse 2; (c) Fuse 3.


Figure 6.
Failure mode of wall-piers: (a) two sides of the wall-pier; (b) CSW’s failure mode; (c) initial cracking of F1SW; (d) initial cracking of F2SW; (e) initial cracking of F3SW; (f) F1SW’s failure mode; (g) F2SW’s failure mode; (h) F3SW’s failure mode.
Figure 6.
Failure mode of wall-piers: (a) two sides of the wall-pier; (b) CSW’s failure mode; (c) initial cracking of F1SW; (d) initial cracking of F2SW; (e) initial cracking of F3SW; (f) F1SW’s failure mode; (g) F2SW’s failure mode; (h) F3SW’s failure mode.

Figure 7.
Hysteretic curves: (a) CSW; (b) F1SW; (c) F2SW; (d) F3SW.
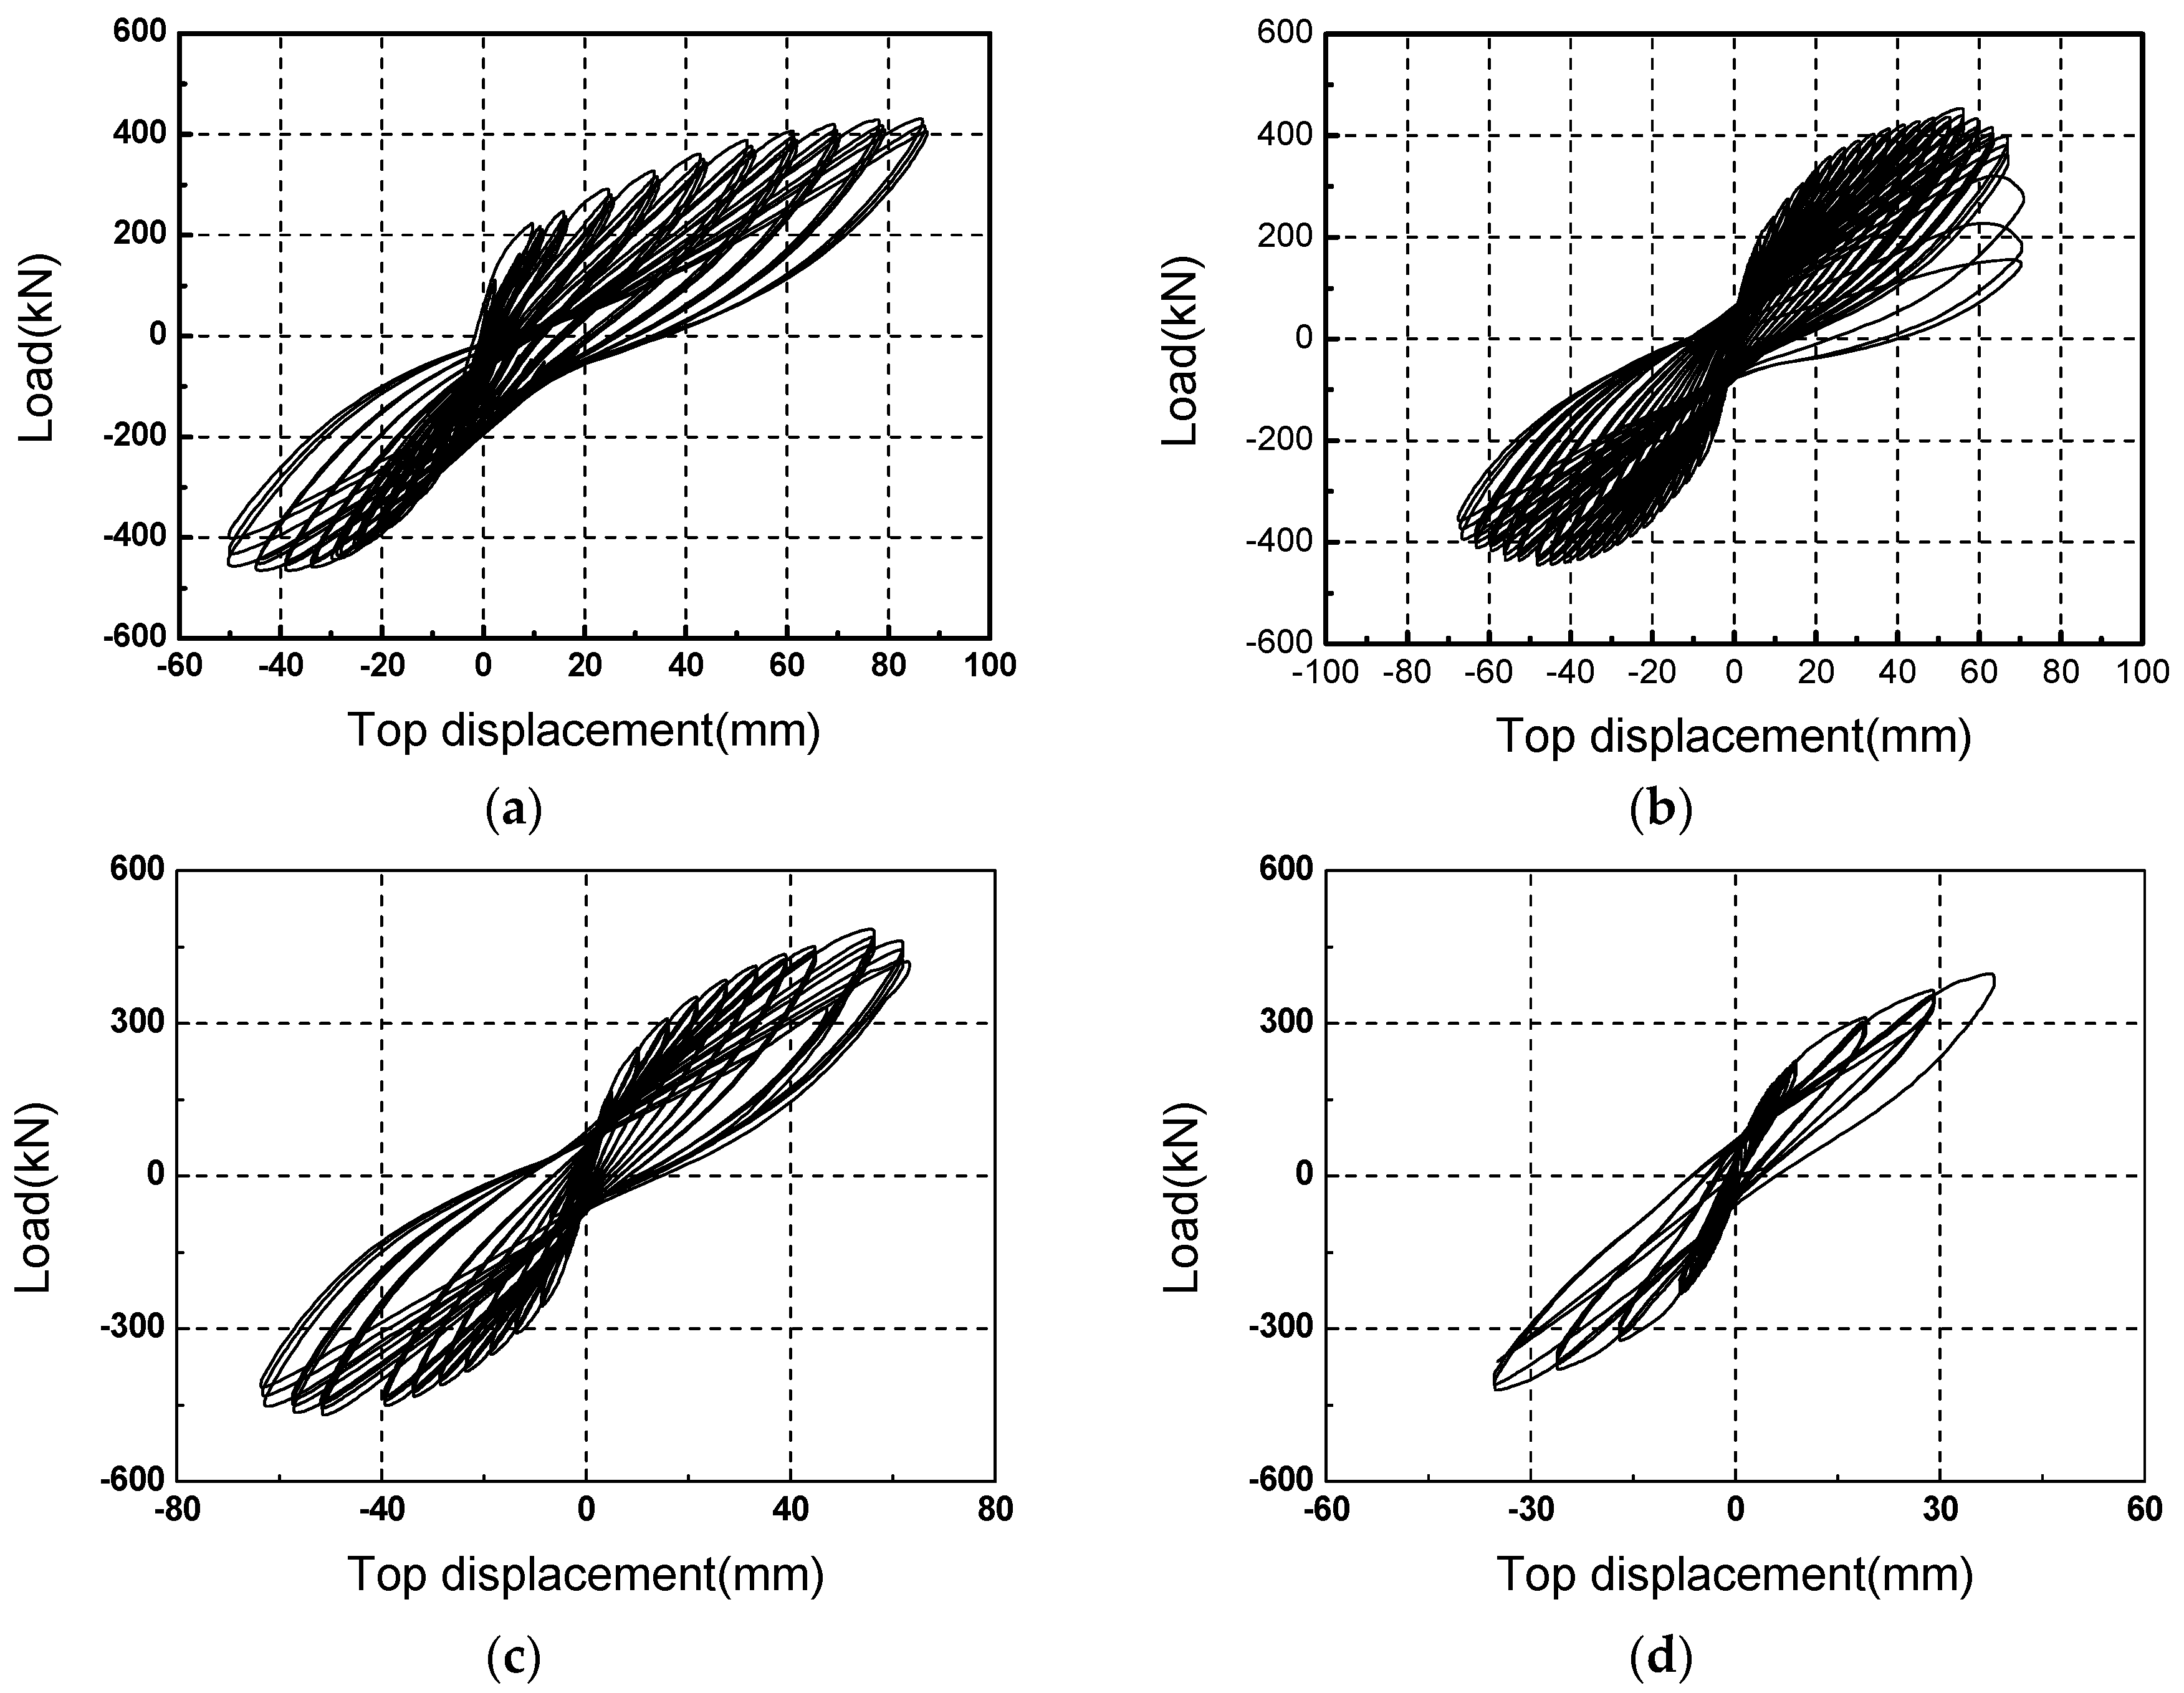
Figure 8.
Skeleton curves: (a) CSW; (b) F1SW; (c) F2SW; (d) F3SW.
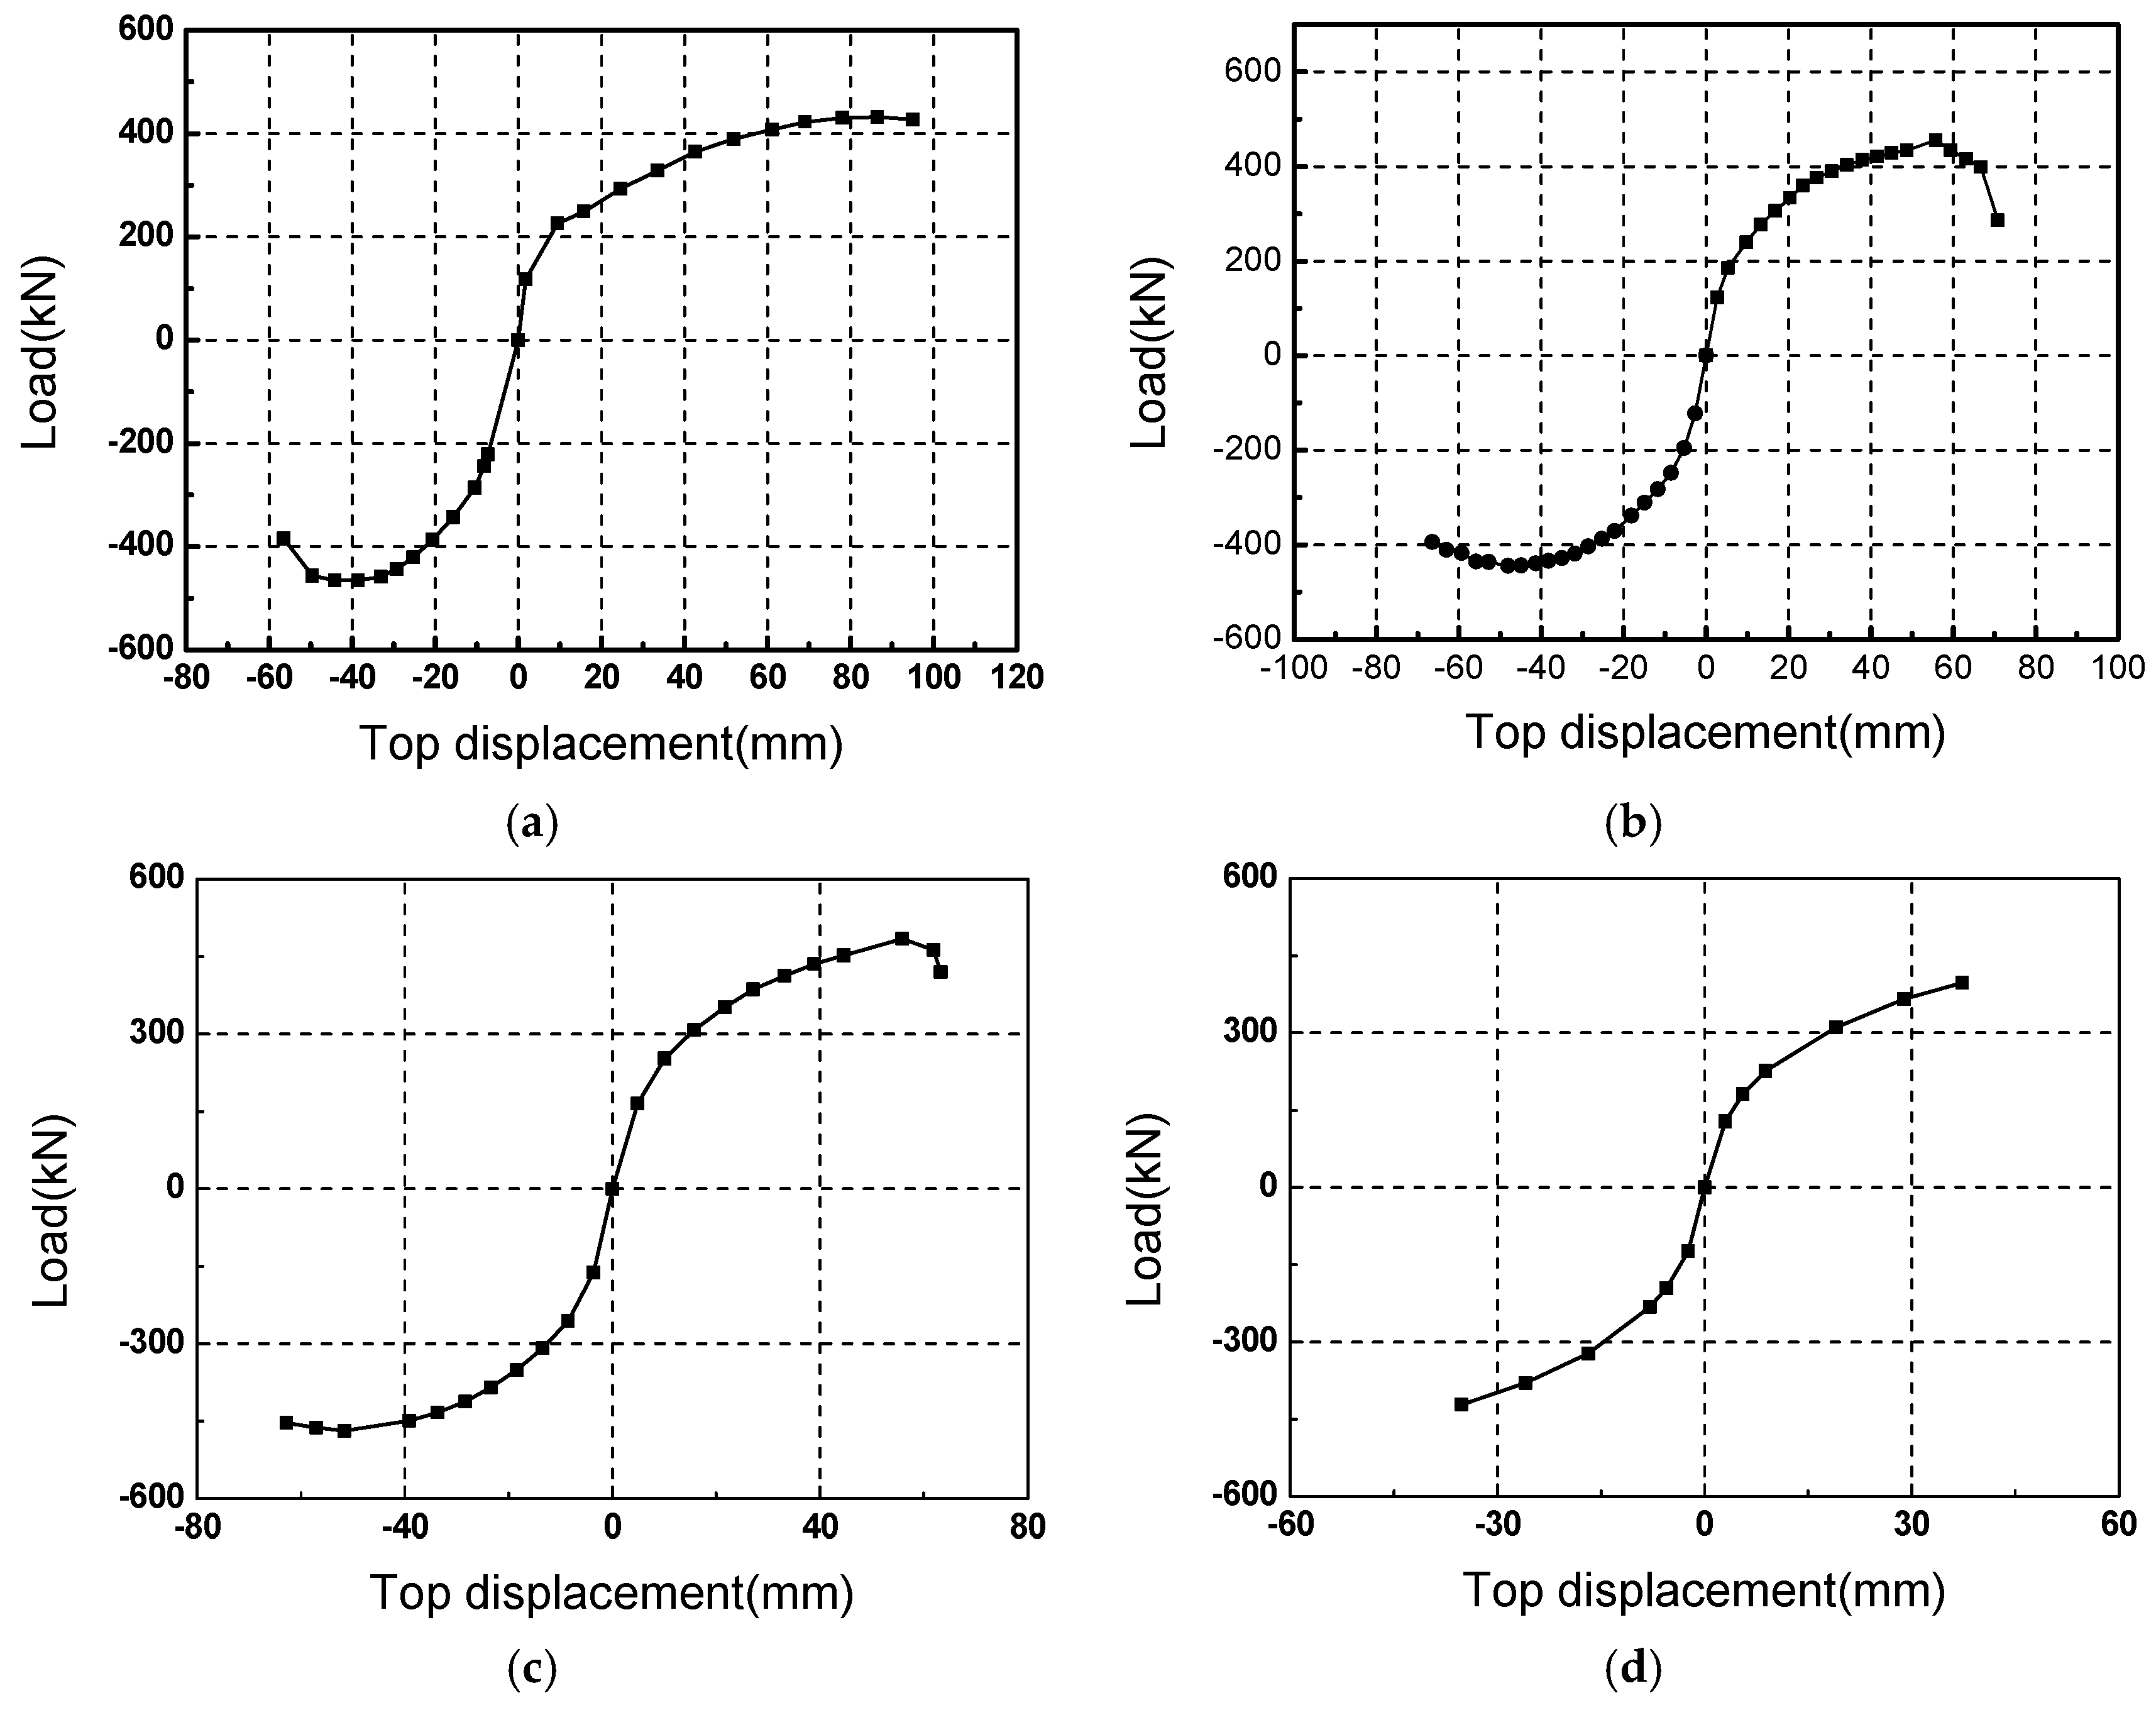
Figure 9.
Strength degradation: (a) positive direction; (b) negative direction.

Figure 10.
Stiffness degradation: (a) positive direction; (b) negative direction.

Figure 11.
Energy dissipation capacity: (a) graphics for Equation (1); (b) equivalent viscous damping coefficient.
Figure 11.
Energy dissipation capacity: (a) graphics for Equation (1); (b) equivalent viscous damping coefficient.
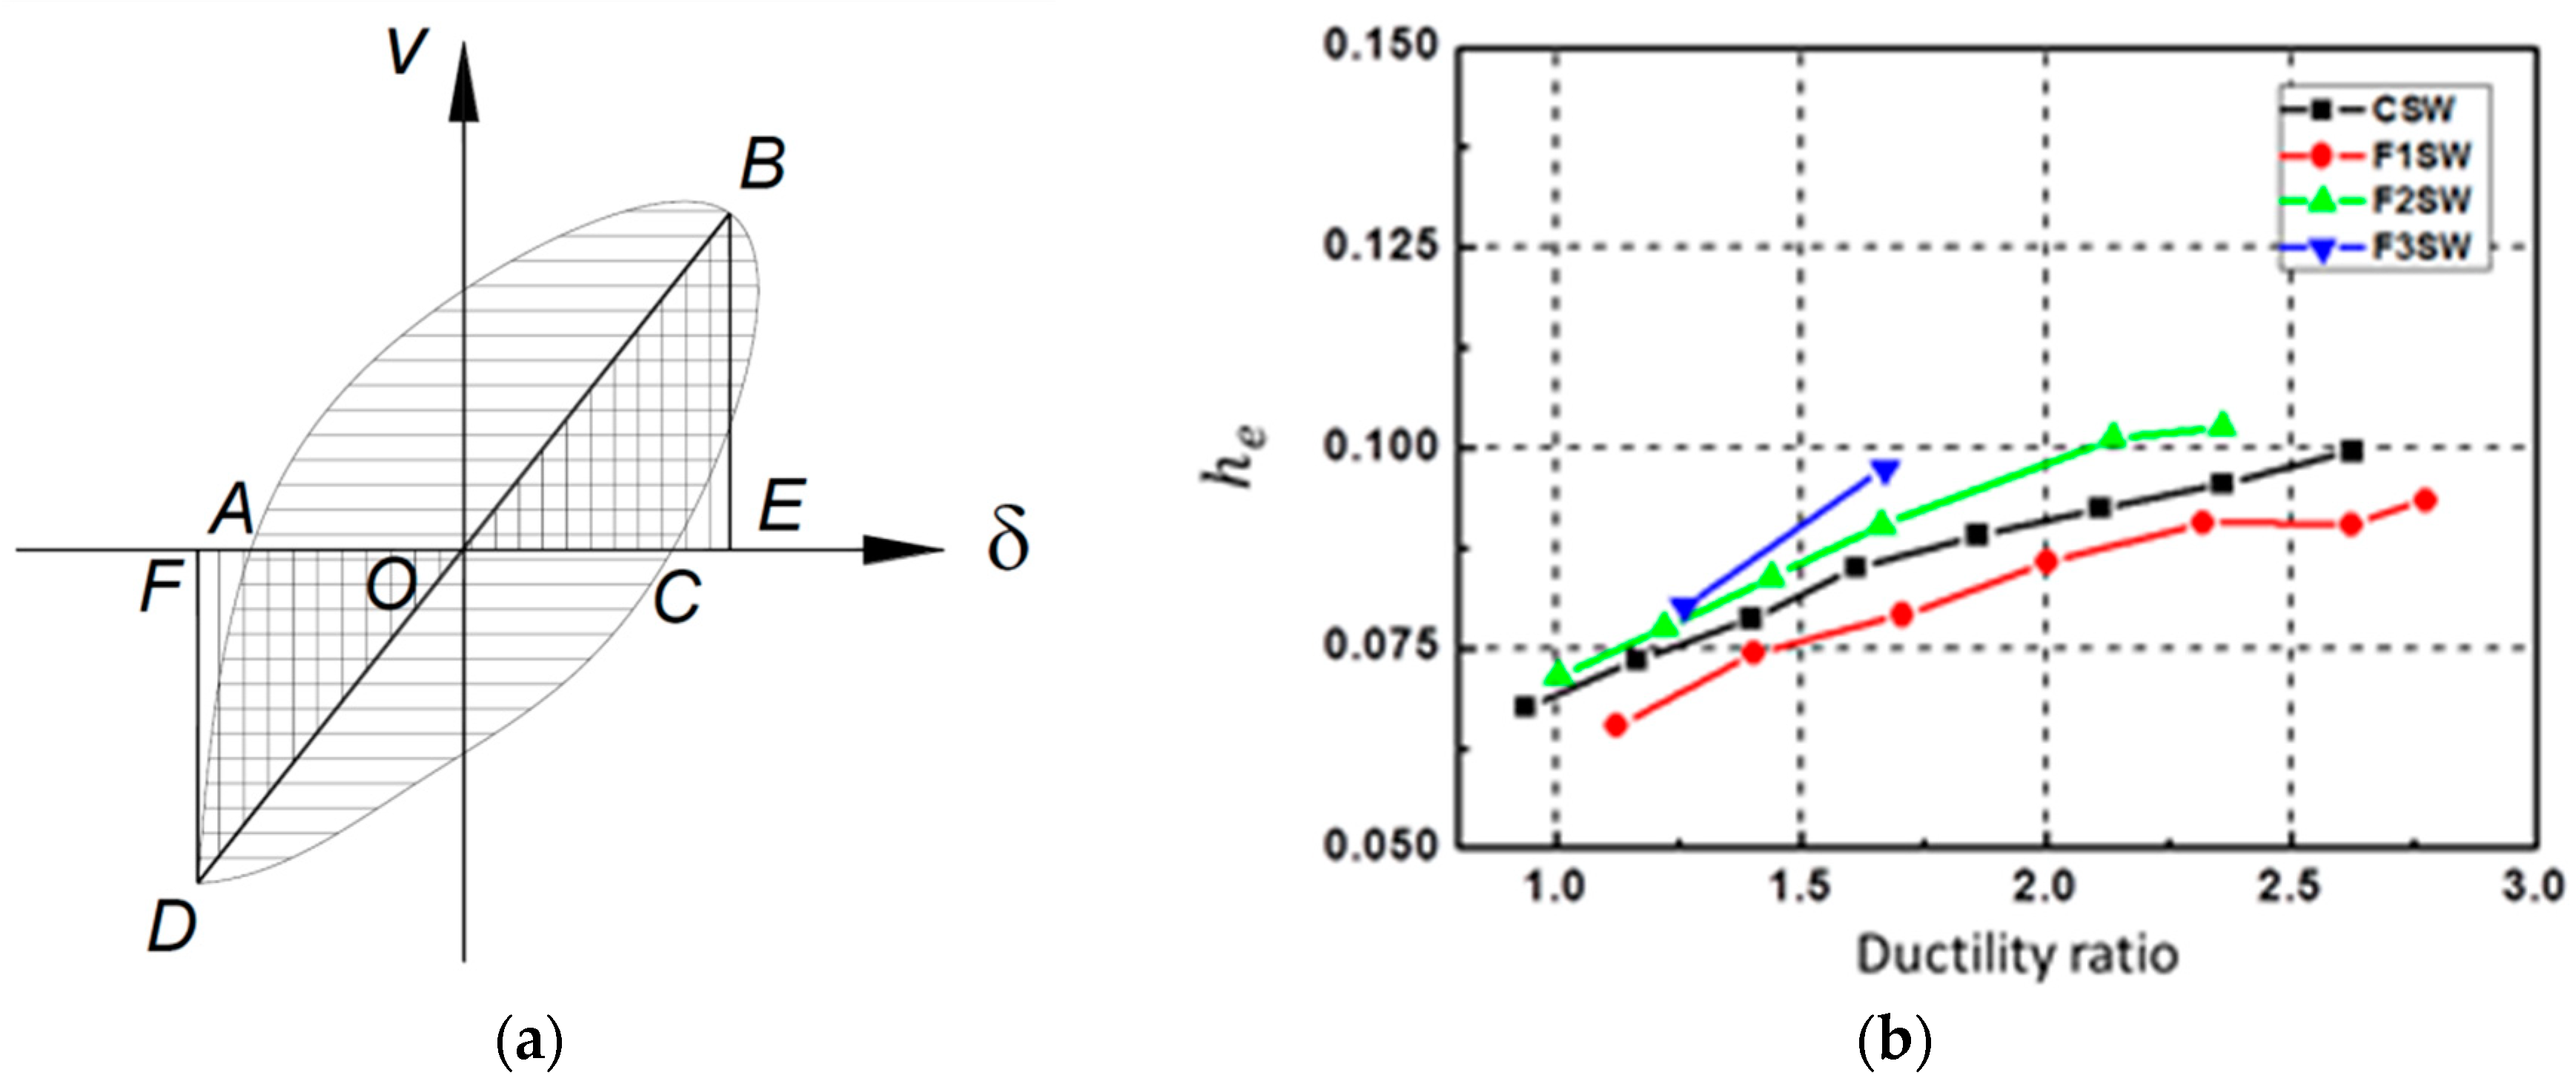
Figure 12.
Simulated deformations for: (a) CSW; (b) F1SW; (c) F2SW; (d) F3SW; (e) the coupling beam of CSW; (f) the “fuse” of F1SW; (g) the “fuse” of F2SW; (h) the “fuse” of F3SW.
Figure 12.
Simulated deformations for: (a) CSW; (b) F1SW; (c) F2SW; (d) F3SW; (e) the coupling beam of CSW; (f) the “fuse” of F1SW; (g) the “fuse” of F2SW; (h) the “fuse” of F3SW.

Figure 13.
Final equivalent plastic strain: (a) F1SW; (b) F2SW; (c) F3SW.
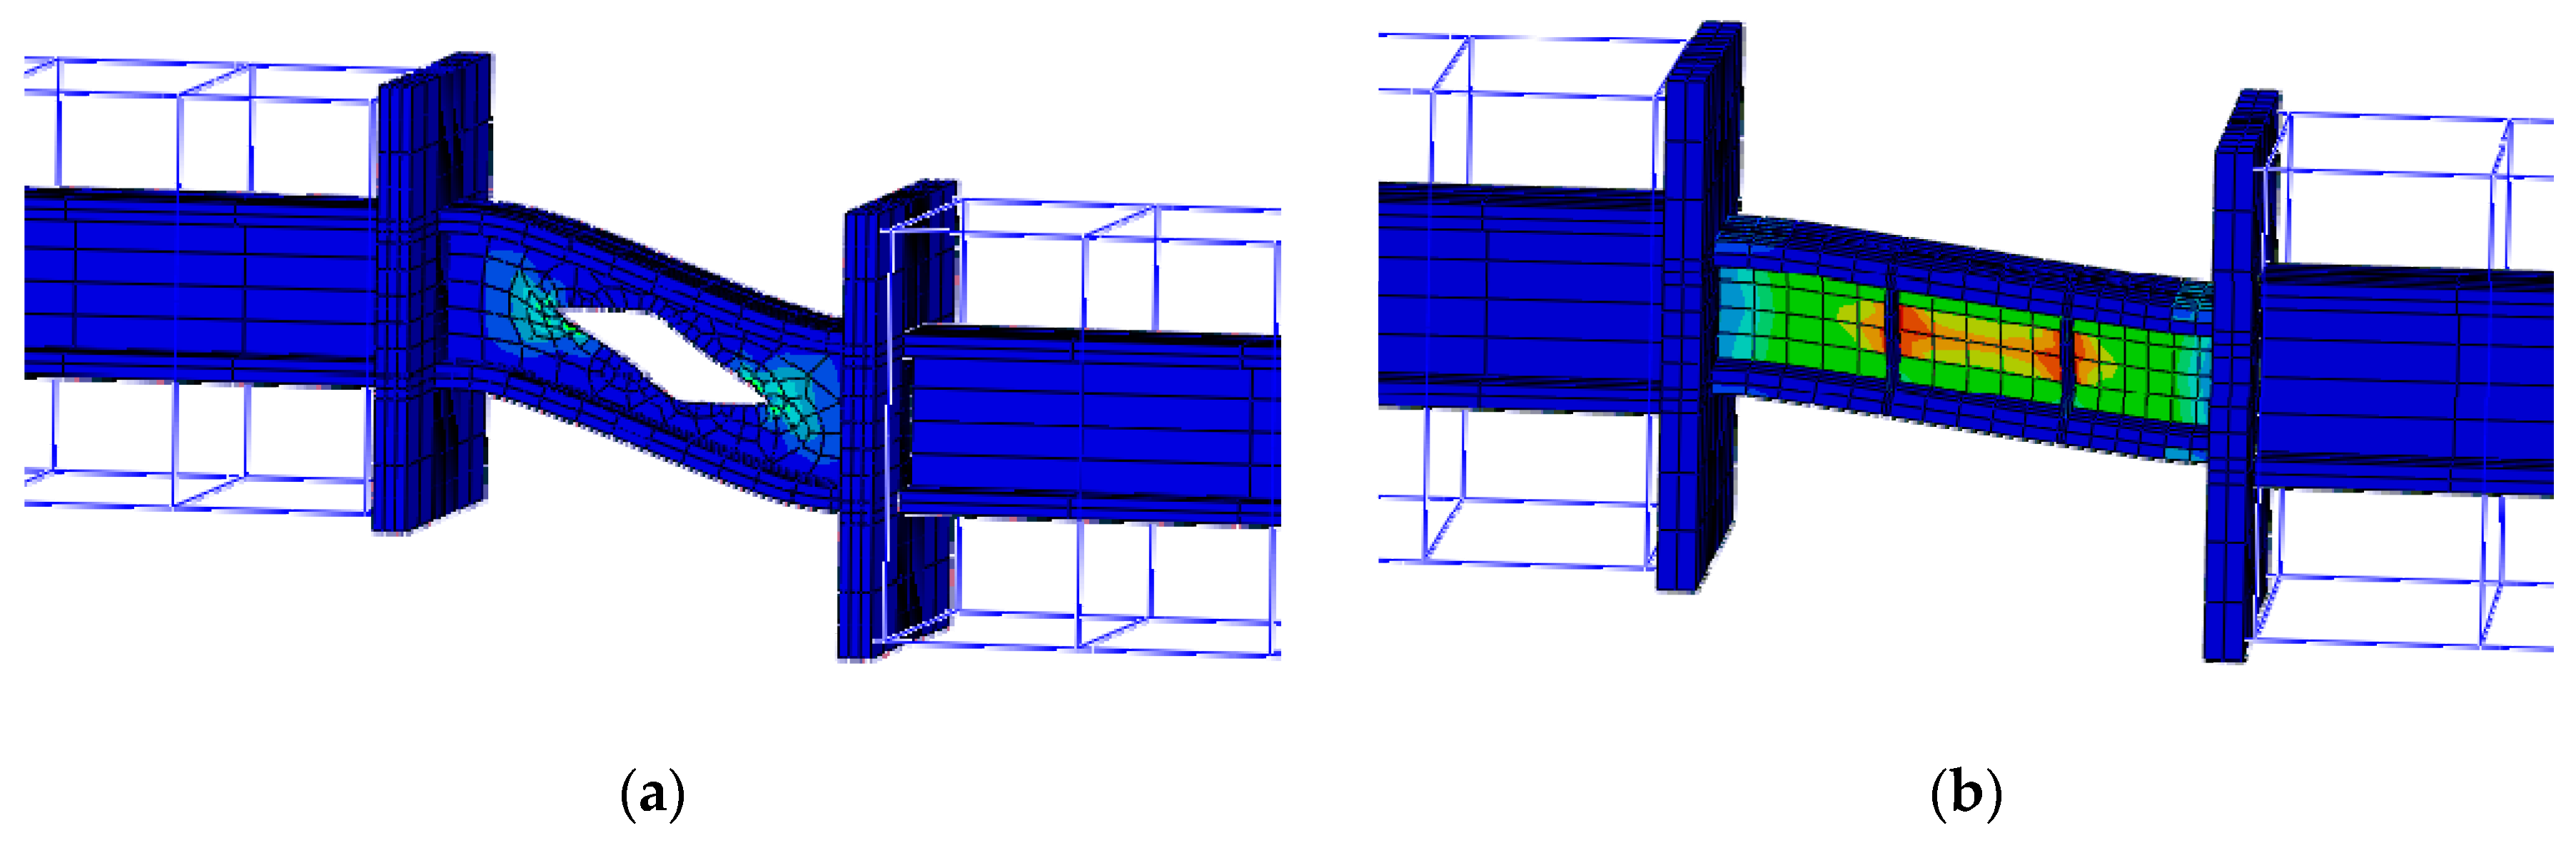

Figure 14.
Damage condition of: (a) CSW; (b) F1SW; (c) F2SW; (d) F3SW.

Figure 15.
Simulated and experimental skeleton curves. (a) CSW; (b) F1SW; (c) F2SW; (d) F3SW.


Table 1.
Design bearing capacity of the specimens.
| Design Shear Force | Design Bending Moment | |
|---|---|---|
| Conventional coupling beam | ||
| Replaceable coupling beam |
Table 2.
Experimental data.
| Specimen | CSW | F1SW | F2SW | F3SW | ||||
|---|---|---|---|---|---|---|---|---|
| Loading direction (+: Positive; −: Negative) | + | − | + | − | + | − | + | − |
| Yield displacement (mm) | 34.07 | −24.73 | 26.36 | −20.97 | 28.57 | −22.41 | 20.30 | −23.70 |
| Yield load (kN) | 351.69 | −376.30 | 374.16 | −358.65 | 393.71 | −378.88 | 317.12 | −362.70 |
| Peak displacement (mm) | 73.75 | −55.10 | 55.75 | −48.06 | 55.84 | −51.63 | --- | −54.27 |
| Peak load (kN) | 431.46 | −463.82 | 455.06 | −444.27 | 484.04 | −468.54 | --- | −453.03 |
| Ultimate displacement (mm) | 81.80 | −77.43 | 67.29 | −66.46 | 63.27 | −62.80 | --- | −81.73 |
| Ultimate load (kN) | 426.74 | −388.99 | 386.80 | −393.71 | 419.32 | −453.03 | --- | −429.44 |
| Ductility ratio | 2.38 | 3.13 | 2.55 | 3.17 | 2.21 | 2.80 | --- | 3.45 |
Table 3.
Strengths of the steel and concrete.
| Steel Grade | Diameter (mm) | Yield Strength (MPa) | Ultimate Strength (Mpa) |
| HPB235 | 6 | 330 | 405 |
| HPB235 | 8 | 340 | 400 |
| HRB335 | 12 | 400 | 530 |
| HRB335 | 20 | 355 | 500 |
| Concrete Grade | Cubic Compressive Strength fcu (Mpa) | Elastic Modulus E (Mpa) | |
| C25 | 21.16 | 21375 | |
Note: The steel and concrete grades are regulated by Chinese code [25].
Table 4.
Parameters of the concrete model
| 32 | 0.1 | 1.16 | 0.6667 | 0.003 |
Notes: : dilatancy angle; : plastic potential eccentricity; : viscosity coefficient; : the ratio of biaxial compressive strength to uniaxial compressive strength; : the ratio of the second stress invariant on tensile meridian plane to that on compressive meridian plane;
© 2019 by the authors. Licensee MDPI, Basel, Switzerland. This article is an open access article distributed under the terms and conditions of the Creative Commons Attribution (CC BY) license (http://creativecommons.org/licenses/by/4.0/).
Share and Cite
MDPI and ACS Style
Chen, Y.; Li, J.; Lu, Z. Experimental Study and Numerical Simulation on Hybrid Coupled Shear Wall with Replaceable Coupling Beams. Sustainability 2019, 11, 867. https://doi.org/10.3390/su11030867
AMA Style
Chen Y, Li J, Lu Z. Experimental Study and Numerical Simulation on Hybrid Coupled Shear Wall with Replaceable Coupling Beams. Sustainability. 2019; 11(3):867. https://doi.org/10.3390/su11030867
Chicago/Turabian StyleChen, Yun, Junzuo Li, and Zheng Lu. 2019. "Experimental Study and Numerical Simulation on Hybrid Coupled Shear Wall with Replaceable Coupling Beams" Sustainability 11, no. 3: 867. https://doi.org/10.3390/su11030867
Note that from the first issue of 2016, this journal uses article numbers instead of page numbers. See further details here.