Article

Land Use/Cover Change Effects on River Basin Hydrological Processes Based on a Modified Soil and Water Assessment Tool: A Case Study of the Heihe River Basin in Northwest China’s Arid Region

Key Laboratory of Physical Geography and Environmental Processes, School of Geographical Science, Qinghai Normal University, Xining 810016, China
*
Author to whom correspondence should be addressed.
Sustainability 2019, 11(4), 1072; https://doi.org/10.3390/su11041072
Submission received: 4 January 2019 / Revised: 12 February 2019 / Accepted: 14 February 2019 / Published: 19 February 2019

Abstract

:
Land use/cover change (LUCC) affects canopy interception, soil infiltration, land-surface evapotranspiration (ET), and other hydrological parameters during rainfall, which in turn affects the hydrological regimes and runoff mechanisms of river basins. Physically based distributed (or semi-distributed) models play an important role in interpreting and predicting the effects of LUCC on the hydrological processes of river basins. However, conventional distributed (or semi-distributed) models, such as the soil and water assessment tool (SWAT), generally assume that no LUCC takes place during the simulation period to simplify the computation process. When applying the SWAT, the subject river basin is subdivided into multiple hydrologic response units (HRUs) based on the land use/cover type, soil type, and surface slope. The land use/cover type is assumed to remain constant throughout the simulation period, which limits the ability to interpret and predict the effects of LUCC on hydrological processes in the subject river basin. To overcome this limitation, a modified SWAT (LU-SWAT) was developed that incorporates annual land use/cover data to simulate LUCC effects on hydrological processes under different climatic conditions. To validate this approach, this modified model and two other models (one model based on the 2000 land use map, called SWAT 1; one model based on the 2009 land use map, called SWAT 2) were applied to the middle reaches of the Heihe River in northwest China; this region is most affected by human activity. Study results indicated that from 1990 to 2009, farmland, forest, and urban areas all showed increasing trends, while grassland and bare land areas showed decreasing trends. Primary land use changes in the study area were from grassland to farmland and from bare land to forest. During this same period, surface runoff, groundwater runoff, and total water yield showed decreasing trends, while lateral flow and ET volume showed increasing trends under dry, wet, and normal conditions. Changes in the various hydrological parameters were most evident under dry and normal climatic conditions. Based on the existing research of the middle reaches of the Heihe River, and a comparison of the other two models from this study, the modified LU-SWAT developed in this study outperformed the conventional SWAT when predicting the effects of LUCC on the hydrological processes of river basins.

1. Introduction

Resulting from the long-term interaction between human needs and natural processes [1,2,3], land use/cover change (LUCC) affects canopy interception, soil infiltration, land-surface evapotranspiration (ET), and other hydrological parameters during rainfall, which in turn affects the hydrological regimes and runoff mechanisms of river basins [4,5,6,7]. The effects of LUCC on hydrological processes vary based on unique site characteristics. For example, the presence of forest is related to the occurrence of different hydrological functions under a region’s unique climate, soil type, geomorphology, and topography [8,9,10,11].
The U.S. Geological Survey (USGS) identified the study of ‘land use and land cover change rates, causes, and consequences’ (including their effect on hydrological processes) as one of its seven major goals in its 2013 Climate and Land Use Change Science Strategy, which is to be implemented over a period of 10 years. Moreover, Future Earth—a global platform sponsored by the International Council for Science (ICSU), the International Conference on Sustainability Science (ICSS), and other international organizations—identified a ‘dynamic planet’ theme as one of its three major research areas, which aims to understand the interactions between natural and social components and their effect on the Earth’s systems. As a result of these targeted areas of focus, LUCC effects on hydrological processes in river basins has garnered recent attention and emerged as a critical frontier of international geo-scientific research [1,2,3,4].
Several methods exist for the determination of LUCC effects on hydrological processes in river basins, including (1) experimental paired-watershed methods, (2) lumped hydrological models, and (3) distributed hydrological models [12,13,14]. The experimental paired-watershed method is typically applied only to small river basins, requires a long-term study period, and has limited comparability [15]. Lumped hydrological models, which treat the entire river basin as a single unit, often fail to reflect the variability of river basin parameters and the associated regional differences in LUCC effects on hydrological processes [16,17,18]. Physically based distributed (or semi-distributed) models more accurately reflect the spatial variability of hydrological processes than lumped models and thus play an important role in interpreting and predicting LUCC effects on hydrological processes in river basins [19,20,21,22,23]. However, distributed models generally assume that no LUCC occurs during the simulation period to simplify the computation process.
The soil and water assessment tool (SWAT), supported by the U.S. Department of Agriculture, is an example of a semi-distributed hydrological model. Because of its open-source code, strong functionality, and excellent simulation results in multiple watersheds, the SWAT has been applied worldwide [24,25,26]. When applying the SWAT, the subject river basin is subdivided into multiple hydrologic response units (HRUs) based on the land use/cover type, soil type, and surface slope. The land use/cover type is assumed to remain constant throughout the simulation period [27], which limits the ability to interpret and predict the effects of LUCC on hydrological processes in the subject river basin.
To overcome this limitation, select researchers have divided the entire simulation period into uniform time intervals (e.g., 5 years intervals) and performed interval simulations using land use/cover data from a single year within each interval [21,22,23]. Although this method provides some of the necessary variability in LUCC, it also complicates the model development and simulation processes and may fail to reflect year-to-year changes in land use/cover.
This study sought to improve upon these prior efforts. In this study, a modified SWAT (LU-SWAT) was developed that incorporates annual land use/cover data to simulate LUCC effects on hydrological processes under different climatic conditions. To validate this approach, this modified model together with two other conventional SWAT models (SWAT 1 and SWAT 2) based on different land use maps in different years (2000, the middle year of the study period, and 2009, the last year of the study period) was applied to the middle reaches of the Heihe River in northwest China.
In northwest China’s arid region, inland river basins form the main hydrological system and occupy 35% of the total land area of the country. Most of the runoff in this region comes from the mountains and dissipates in the piedmont basin [24,28]. The Heihe River Basin is a typical inland river basin and is the second largest river basin in northwest China. The entire runoff of the Heihe River Basin dissipates in its middle reaches, which is also the region most affected by human activity. The ecosystem of the Heihe River Basin is presently at risk [29]. Before 2000, a number of human disturbances, including deforestation, overgrazing, and urbanization, caused drastic changes in the Heihe River Basin’s land use/cover, destabilizing its entire ecosystem. For example, some downstream terminal lakes disappeared as the groundwater table in the basin’s middle reaches dropped [28]. Since 2000, China has implemented a series of environmental protection measures, such as reforestation and regrassing of farmland, causing further spatial and temporal LUCC in the Heihe River Basin. These changes have affected the basin’s hydrological cycle in a very complex and multifaceted way [9].
Finding an effective means for studying LUCC effects on the hydrological processes in the middle reaches of the Heihe River is particularly crucial for this region. However, the results of this study will more generally reveal how LUCC affects hydrological processes in the water consumption areas of inland river basins in arid regions, providing a scientific basis for the effective management and sustainable use of all inland river basin water resources.

2. Materials and Methods

2.1. Study Area

The middle reaches of the Heihe River are located between the Qilian Mountains and the Beishan Mountains. After passing through the Yingluoxia hydrometric station, the Heihe River flows through the plains of the Hexi Corridor, passing through Zhangye City to the Zhengyixia hydrometric station. Figure 1 shows a map of the Heihe River Basin study area.
The topography of the middle reaches of the Heihe River slopes from south to north. The terrain is higher in the south and west and lower in the north and east, with an average altitude of 1400–1700 m. This 185-km section of the Heihe River is a primary area for runoff utilization and water consumption [24].
The middle reaches of the Heihe River experiences abundant heat and sunlight, making it suitable for crop growth and agricultural development. This region is designated as an irrigated agro-economic zone. Approximately 61% of the soil in this region is grey-brown desert soil. Other soil types in this region include chestnut soil, light chestnut soil, brown desert soil, desert sandy soil, and a small number of azonal soils, such as anthropogenic-alluvial soil, meadow soil, and marsh soil [29].
Due to the impact of human activity, many irrigation oases are distributed throughout the piedmont alluvial fan and alluvial plain in the lower middle reaches and upper river basin, respectively, forming a landscape dominated by artificially grown vegetation [9]. Precipitation in the plains is high in the east (~250 mm) and low in the west (≤50 mm) [29]. According to the Köppen Geiger classification, the climate in the study area is BSK (cold semi-arid).

2.2. Land Use/Cover Data Acquisition

To support this study, annual land use/cover data—in the form of Landsat Thematic Mapper (TM) images—were obtained for the middle reaches of the Heihe River from 1990 to 2009.
Using a 1:50,000 topographic map as the datum and the Albers projection, the remote sensing images were geometrically corrected using a quadratic polynomial model. The interpretation keys of the remote sensing images were established using land use maps and observed data (we have 30 ground control points to check the accuracy) corresponding to the same period. Next, supervised human-machine classifications and image interpretations were performed using ArcGIS 10.0 (ESRI, Redlands, CA, USA) and ENVI 5.1 (Harris Geospatial Solutions, Inc., Broomfield, CO, USA) image processing software, and the results were compared with land use maps of the study area for the corresponding period. On-site verification revealed that the qualitative accuracy of the data classification exceeded 95%. Compared with the existing land use maps of the study area, the kappa coefficients of the interpreted land use maps in this study are all over 0.93.
Finally, based on China’s Land Use Classification System and the land use classification system used by the SWAT, the land use categories selected for use in this study included farmland, forest, grassland, water, residential, and bare land.

2.3. Conventional SWAT Assessment

The conventional SWAT is a semi-distributed hydrological model that first subdivides the entire river basin into a number of sub-basins based on factors, such as topography and river-network distribution [27]. Next, the SWAT further subdivides the sub-basins into HRUs based on the land use classifications, soil classifications, and terrain slopes in the river basin. The land use/cover in the study area is assumed to remain constant throughout the simulation period. For each individual HRU, a conceptual model is used to estimate its precipitation, runoff, sediment, and other factors. After completing these calculations, river confluence calculations are made [27].
Based on the water balance principle, the SWAT calculates the water volume as follows [27]:
S t = S 0 + i = 1 t ( R d a y Q s u r f E t S s e e p Q g w ) ,
where St is the soil water content (mm), S0 is the initial soil water content (mm), t is the total simulation time (days), Rday is the precipitation on day i (mm), Qsurf is the surface runoff on day i (mm), Et is the actual ET rate on day i (mm), Sseep is the soil permeability on day i (mm), and Qgw is the baseflow (mm).

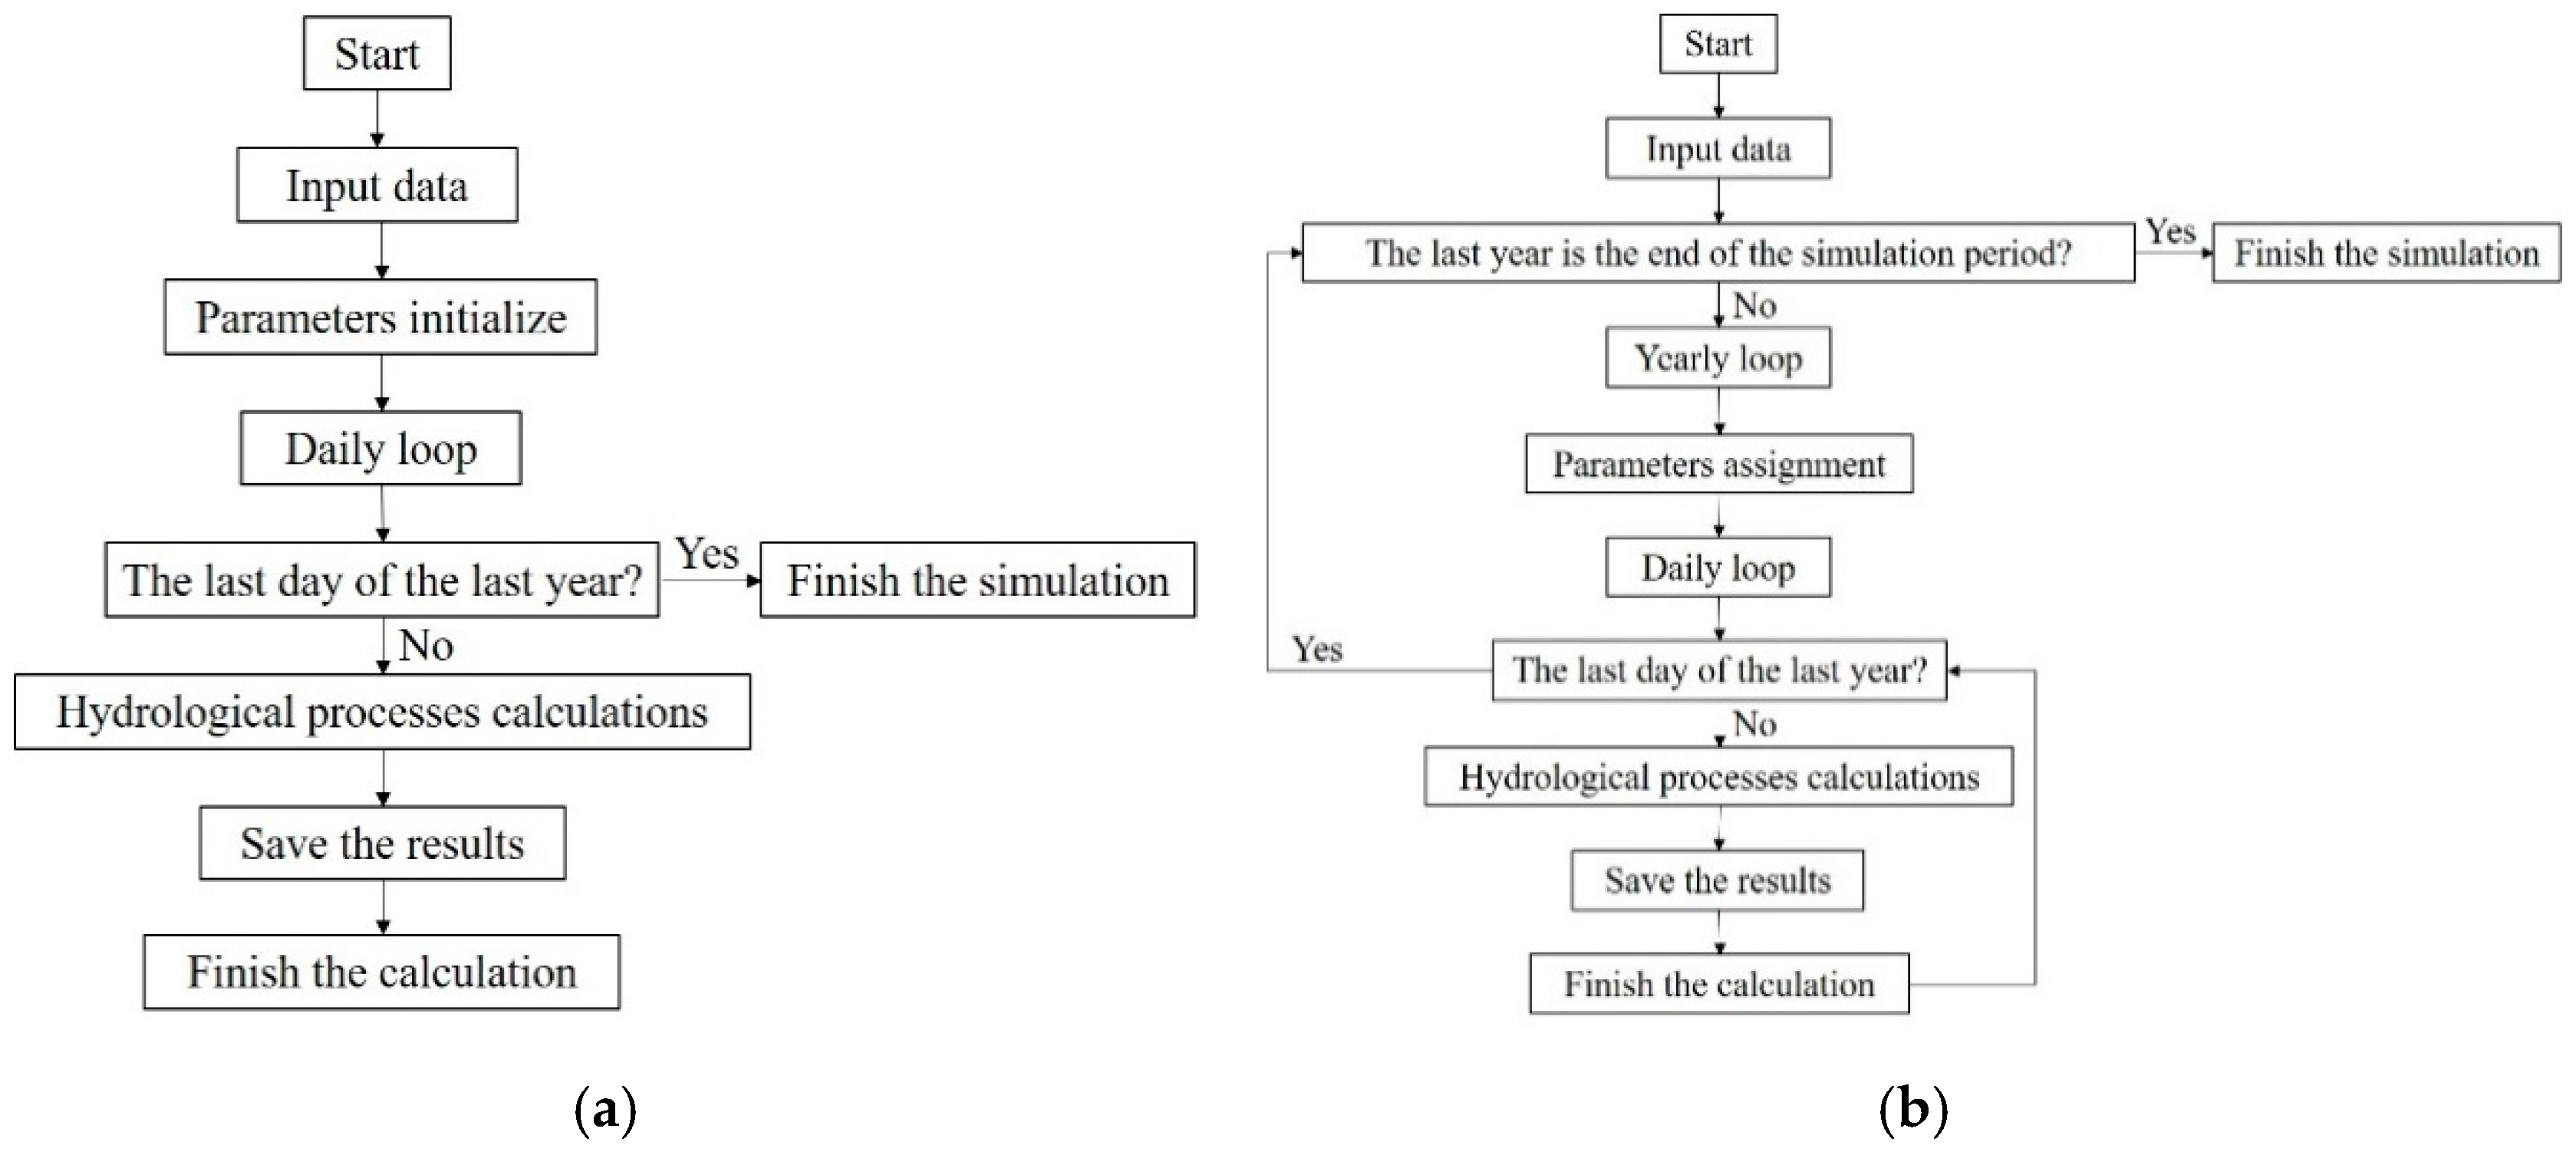
2.4. Conventional SWAT Modification

In the conventional SWAT, HRUs are the basic computation elements, each with a commonly defined land use, soil type, and slope. An individual HRU consists of multiple grid units that can be spatially adjacent or apart from one another. The number, surface areas, and spatial locations of HRUs are determined based on the combined number, surface areas, and spatial locations of patches on the land use, soil type, and slope maps.
In the present study, the soil type and slope data used to generate HRUs remained constant, whereas the land use data changed from year to year. To incorporate annual land use/cover data in the conventional SWAT (via a modified SWAT or LU-SWAT), the number, surface areas, and spatial locations of the HRUs generated from the multi-year land use/cover data must remain unchanged. To ensure that this condition is met in the LU-SWAT, the land use datasets for each year in the study period are spatially superimposed (based on successive years) to generate a land use overlay map and obtain its corresponding attribute table showing each patch number and its corresponding attribute (e.g., land use type) for each year prior to generating the HRUs.
The spatially superimposed land use map is next superimposed with the soil type and terrain slope maps. During this superimposition process, the annual land use types corresponding to each patch listed in the attribute table are invoked by year to generate annual HURs. By matching the original land use maps for each year to their corresponding superimposed maps, the number, surface areas, and locations of patches for each year remain identical, but the patch attributes (e.g., land use types) may vary from year to year. Concurrently, the number, surface areas, and spatial distributions of the previously generated HRUs for each year remain constant, enabling the SWAT to carry out subsequent calculations based on land use changes. Figure 2 shows this modified HRU generation process based on the annual land use/land cover (LULC) maps.
In addition to modifying the HRU generation process in the conventional SWAT, its computation flow also required modification. The conventional SWAT performs parameter initialization on a daily cycle, which prevents the use of annual land use data. Unlike the conventional SWAT model, the LU-SWAT runs the yearly loop subroutine prior to parameter initialization, allowing the current year’s data (HRUs) to be input prior to initializing the parameters and running the daily loop subroutine. After the last day in a year has been simulated, results are saved in a file and used as input data for the subsequent year. Specifically, the data are reloaded and initialized with the corresponding initialization parameters, and the daily loop subroutine is run again. If the preceding year of the current input year is the last year of the simulation period, the simulation is finished. Figure 3 compares the computation flows of the conventional SWAT and the LU-SWAT developed in this study.
To implement this modified computation flow, the conventional SWAT code was rewritten using Fortran language in the Microsoft Visual Studio 2010 programming environment (Rev. 635). After successful code modification and compilation, the original SWAT.exe file was replaced with a new executable file.

2.5. Conventional and Modified SWAT Application

To validate this approach, the modified SWAT or LU-SWAT together with two other conventional SWAT models based on different land use maps in different years (2000 and 2009) were applied to the middle reaches of the Heihe River in northwest China. To develop the hydrological model for this region, soil type data was obtained from a 1:1,000,000 soil map of Gansu Province. A digital elevation model (DEM) with a spatial resolution of 30 × 30 m provided topographic data. To account for the impact of human activity on the river network, supplemental topographic survey data digitized from a 1:100,000 topographic map was used to adjust the DEM’s river channel data.
Meteorological data, including the precipitation, temperature, wind speed, relative humidity, and sunshine duration, were obtained from the Cold and Arid Regions Science Data Centre (http://westdc.westgis.ac.cn). These data were measured at 12 meteorological stations in the Heihe River Basin, including the Gaotai, Jinta, Jiuquan, Linze, Minyue, Shandan, Sunan, Zhangye, Qilian, Tuolei, Yeniugou, and Yongchang stations.
Because the middle reaches of the Heihe River offer abundant sunlight, rich natural resources, and a flat topography, approximately 97.6% of the entire Heihe River Basin’s population and 98.5% of the cultivated land in the upper and middle reaches are concentrated here. As such, agricultural (farmland) management measures and domestic water consumption in the study area were deemed important to this study. Farmland management data included irrigation measures and cultivation/harvesting times in the river basin. In the middle reaches of the Heihe River, the amount of water used for irrigation and the corresponding water sources vary among the different irrigational districts. The proposed LU-SWAT accounts for this time and spatial heterogeneity when defining the irrigation measures because of the dynamic HRUs. The two other conventional SWAT models only account for spatial heterogeneity in the irrigation.

2.6. Simulation Evaluation

The validity of the proposed LU-SWAT in this application was evaluated using the Nash-Sutcliffe efficiency (NSE) parameter, percent bias (PBIAS), and the ratio of the root mean square error (RSME) to the standard deviation of observations (RSR) [30]. The NSE parameter ranges from −∞ to 1. An optimal NSE value of 1 indicates good model performance and high model credibility. As the NSE value approaches 0.5, the simulation results approach the average observed values, indicating satisfactory model performance. Similarly, PBIAS values ranging from −10% to 10% indicate good model performance. Finally, smaller RSR values indicate better model performance. An existing research [30] details the calculation processes and significance of these three simulation evaluation parameters.

3. Results and Discussion

3.1. Historic Land Use/Cover Changes in the Heihe River Basin

Table 1 shows the land areas by use type in the middle reaches of the Heihe River measured annually from 1990 to 2009. Farmland, forest, grassland, and bare land consistently accounted for most of the land area in this region. From 1990 to 2009, farmland, forest, and urban areas all showed increasing trends. Urban areas developed most rapidly and extensively, doubling in surface area over this period. However, urban areas accounted for only a small portion of the total study area. Forest areas also grew steadily, increasing in surface area by 55.70% over this period. Figure 4 shows the land use changed and no changed area of the study region from 1990 to 2009. It is obvious that most of the study area experienced land use changes in this 20-year period.
Implementation of the Heihe Water Diversion Project (HWDP) and the farmland reforestation and regrassing measures in 2000 directly affected land use and cover in this region. From 1990 to 2000, farmland and water areas increased by 10.65% and 16.24%, respectively. Grassland and bare land areas decreased over this same period; grassland areas decreased by 9.13%. From 2000 to 2009, farmland areas continued to increase, but at a much slower rate of 3.45% and water areas gradually decreased by 0.37%. In response to the reforestation and regrassing measures implemented in 2000, grassland areas continued to decrease, but at a much slower rate of 0.90%.
Spatial overlay analysis of the land use data in the middle reaches of Heihe River revealed that the significant land use conversion trends from 1990 to 2009 were from grassland to farmland and from bare land to forest. From 2001 to 2009, a single significant land use conversion trend from bare land to forest was observed in the study area.

3.2. Calibration and Validation of the Models

In this study, the HRU area ratio (land use percentage) was set to 2%. For the LU-SWAT model, the number of HRUs is 100,168. For SWAT 1 and SWAT 2, the number is 2314 and 2540, respectively. The LU-SWAT has more HRUs than the conventional SWAT model, which is due to the use of the overlaid land use map in LU-SWAT, which has more patches than the single year land use maps. The large numbers of HRUs may lead to model complexity.
The conventional SWAT and proposed LU-SWAT are based on the same physical processes. As such, the sensitivities of their respective model parameters were assumed as consistent. This assumption enabled the use of the conventional SWAT to support the calibration of the proposed LU-SWAT. We set 1988–1989 as the initial period for model initialization, 1990–2000 as the calibration period, and 2000–2009 as the validation period. Referring to the existing study [31], a sensitivity analysis was performed using the conventional SWAT and was based on 22 parameters related to the water cycle process. Table 2 shows the results of the model parameter sensitivity analysis, where t is the sensitivity of each parameter (as |t| increases, the parameter sensitivity increases), and p is the statistical significance of the parameter sensitivity (as p approaches 0, the parameter sensitivity increases.
The 10 most sensitive model parameters from Table 2 were selected for use in the initial calibration of the proposed LU-SWAT. These include the effective hydraulic conductivity of the main channel alluvium (CH_K2), initial Soil Conservation Service (SCS) runoff curve number for moisture condition II (CN2), baseflow recession constant (ALPHA_BF), Manning’s n value for the main channel (CH_N2), threshold water level in the shallow aquifer for the base flow (GWQMN), melt factor on 21 December (SMFMN), groundwater revaporization coefficient (GW_REVAP), delay time for the aquifer recharge (GW_DELAY), snowfall temperature (SFTMP), and snow temperature lag factor (TIMP).
The calibration process for a hydrological model is not as simple as fitting the selected parameters to observed data. Rather, based on a comprehensive consideration of the river basin characteristics, the simulated data is closely calibrated to fit the observed data, without exceeding a reasonable range of parameter values. In this study, a two-step process was followed: (1) A reasonable range of parameter values was defined based on the existing research of the Heihe River Basin and (2) a subsequent multi-step manual calibration method [27] was followed. The ranges of the 10 parameters are listed in Table 3.
The SWAT 1 and SWAT 2 models were calibrated using observed runoff data at the Zhengyixia station based on the parameters listed in Table 3 according to the existing study [27]. The proposed LU-SWAT uses annual land use/cover data to reflect the LUCC effects on model parameters, this study used a subsequent dynamic parameter calibration method following initial parameter calibration to match the various land use data with the optimal parameter combinations. Of the 10 most sensitive model parameters identified in the initial calibration of the LU-SWAT, only four of these parameters (CH_K2, CN2, ALPHA_BF, and GW_REVAP) were potentially affected by LUCC. These four parameters were subsequently selected for calibration of the LU-SWAT, while all other parameter values remained unchanged. Ultimately, 20 sets of optimal parameters were identified based on LU-SWAT simulations that considered annual land use/cover data from 1990 to 2009 and that were corrected using runoff data measured at the Zhengyixia station. The calculation time of the SWAT 1 and SWAT 2 were about 20–25 s (10 years) and for the LU-SWAT model, the time was 2.5–3 min.
Figure 5 compares the estimated and observed monthly runoff in the middle reaches of the Heihe River based on simulations from the proposed LU-SWAT, SWAT 1, and SWAT 2 following calibration and measurements from the Zhengyixia station. Figure 6 presents the same comparisons for the annual runoff in the region. Simulated results from the proposed LU-SWAT were generally consistent in both magnitude and direction when compared with the measured data, demonstrating its validity for broader applications. The performance of the SWAT 1 and SWAT 2 models was sufficient, but their NSE values are lower and RSR values are higher than the LU-SWAT model.
For the LU-SWAT, the NSE are higher and RSR are lower than SWAT 1 and SWAT 2, and the PBIAS are all between −10% and 10%. That means the performance of the LU-SWAT was the best. Relative to the SWAT 1 and SWAT 2, the proposed LU-SWAT achieved NSE values of 0.75 and 0.82, PBIAS values of 4.43% and 4.43%, and RSR values of 0.50 and 0.42 in the calibration period when simulating the monthly and annual runoff in the middle reaches of the Heihe River, respectively. Additionally, NSE values of 0.72 and 0.80, PBIAS values of 7.97% and 7.97%, and RSR values of 0.53 and 0.45 in the calibration period when simulating the monthly and annual runoff were found. For the LU-SWAT model, NSE, RSR, and PBIAS values were better for the calibration periods than the validation periods. Table 4 summarizes these results, which are possibly due to the fact that the LU-SWAT accounted for the time and spatial heterogeneity in LUCC and irrigation, whereas SWAT 1 and SWAT 2 only used one-year land use data. In addition, the performance of SWAT 1 and SWAT 2 were similar.
When compared with the existing research of the middle reaches of the Heihe River [32,33], the proposed LU-SWAT also outperformed the conventional SWAT model (Table 4): The NSE value increased 0%–20% and the RSR value decreased by about 0%–31%. In addition, the calibration and validation period (5 years) in the previous research were shorter than that in this study. The runoff measured at the Zhengyixia station is mainly affected by agricultural irrigation in the middle reaches of the Heihe River. The annual water volume used for agricultural irrigation is in turn affected by the farmland surface area and annual crop varieties. Unlike the conventional SWAT, the LU-SWAT proposed in this study incorporates both annual land use/cover data and detailed annual agricultural irrigation data for different irrigation districts and crops in the HRUs. As noted previously, agricultural irrigation is an important factor affecting this region’s water cycle. By incorporating detailed agricultural irrigation data and accounting for inherent spatial variation, the proposed LU-SWAT provided better simulation of the runoff in the middle reaches of the Heihe River.
The proposed LU-SWAT was next applied more broadly to estimate various hydrological parameters over time (from 1990 to 2009). Table 5 summarizes these simulation results. The variations in the surface runoff, groundwater runoff, lateral flow, infiltration, and ET differed from that of the precipitation. The hydrological processes in the middle reaches of the Heihe River are primarily affected by human activity (e.g., agricultural irrigation) rather than by precipitation.
The recharge of river water in this region occurs primarily through groundwater runoff and lateral flow; surface runoff recharge is lower, especially during dry years (years with low precipitation). During wet years, recharge through surface runoff increases. The conventional SWAT model reflects this by using the SCS runoff curve number method to compute surface runoff. In addition, the total water yield in the middle reaches of the Heihe River accounts for only a small proportion of the total rainfall. These water consumption characteristics are consistent with the hydrological characteristics of inland river basins in northwest China’s arid region [28,34].

3.3. Land Use/Cover Change Effects on the Hydrological Processes in the Heihe River Basin

Following the initial calibration and validation of the proposed LU-SWAT, the model was used to simulate the effects of LUCC on hydrological processes in the middle reaches of the Heihe River. The control variable method was used to eliminate any confounding climatic factor effects on the hydrological processes.
Prior to simulation, climatic conditions in this region were classified as dry, wet, and normal based on annual precipitation volumes (listed previously in Table 5). From 1990 to 2009, 1997, 1998, and 1995 were identified as representative dry, wet, and normal years, respectively, with corresponding precipitations of 133.55, 250.29, and 202.70 mm. Climatic data (precipitation, temperature, relative humidity, wind speed, and solar radiation in this model) was combined with irrigation data for the middle reaches of the Heihe River, and inflow runoff data from the Yingluoxia station in the upper reaches of the Heihe River for these three years to simulate the runoff at the Zhengyixia station in the middle reaches of the Heihe River from 1990 to 2009. Based on these simulations, the effects of LUCC on the river basin hydrological processes under dry, wet, and normal climatic conditions were determined.
Figure 7, Figure 8 and Figure 9 show the variations over time (from 1990 to 2009) in the annual surface runoff, lateral flow, groundwater runoff, ET volume, and total water yield in the middle reaches of the Heihe River under dry, wet, and normal climatic conditions, respectively.
As described previously in Section 3.1, the extent of land use conversion was lower from 2001 to 2009 than from 1990 to 2000 because of the HWDP and farmland reforestation and regrassing measures. Implementation of the HWDP and farmland reforestation and regrassing measures in 2000 also directly affected the hydrological processes in the region. Similar to the land use conversion trends, the magnitudes of changes in the estimated hydrological parameters were lower from 2001 to 2009 than from 1990 to 2000. Despite this variation before and after 2000, the overall trends for the hydrological parameters were consistent over time (from 1990 to 2009). As such, this study considered the overall changes in hydrological parameters from 1990 to 2009.
Under dry conditions, surface runoff, groundwater runoff, and total water yield showed decreasing trends over time, while lateral flow and ET volume showed increasing trends. Surface runoff, groundwater runoff, and total water yield decreased by 75.93%, 45.73%, and 33.74%, respectively, from 1990 to 2009. Lateral flow and ET volume increased by 99.93% and 35.11%, respectively, during this same period.
Similar trends over time were observed under wet conditions, but smaller changes in the hydrological parameters were estimated. Under wet conditions, surface runoff, groundwater runoff, and total water yield decreased by 23.61%, 11.42%, and 4.23%, respectively, from 1990 to 2009. Lateral flow and ET volume increased by 30.22% and 13.10%, respectively, during this same period.
Under normal conditions, similar trends over time were again observed, but the magnitudes of changes in the hydrological parameters differed from those under dry and wet conditions. Surface runoff, groundwater runoff, and total water yield decreased by 40.44%, 49.55%, and 18.47%, respectively, from 1990 to 2009. Lateral flow and ET volume increased by 120.21% and 23.60%, respectively, during this same period.
The primary water consumption zone of the Heihe River Basin lies in the middle reaches of the Heihe River. The water consumption of this area mainly occurs through agricultural irrigation, and flooding irrigation, which requires the extraction of large amounts of water from the river and underground runoff, is the most commonly used method of irrigation in this area. The agricultural irrigation module in the SWAT model provides a realistic model of flooding irrigation: Water losses from the water source to the soil (including transfer losses and evaporation losses) are indicated by the irrigation efficiency. The surface runoff flowing away from the farmlands as a percentage of the irrigation water is indicated by the “surface runoff ratio”. The remaining water either seeps into the soil or is evaporated into the air, and the soil water module in the SWAT model is used to model the movement of water in the soils. During the irrigation season, large amounts of river water and underground water are extracted to irrigate the farmlands. A considerable amount of water is not used by the crops; this water either evaporates into the air, seeps into the soil to form lateral flows, or seeps through the ground to supplement underground water sources. Therefore, the increase in evaporation and lateral flows in the basin is mainly caused by the continuous increase of the farmland area. The effects of this change in farmland area on the surface runoff are relatively small. This is because the “surface runoff ratio” for agricultural irrigation was set to 0 according to the information queries that were made during this study; in other words, irrigation water does not flow from the farmlands into the river via surface runoff. Furthermore, the interception of rainfall by the canopy of the woodlands will reduce surface runoff. Therefore, the surface runoff of the basin decreases due to the continuous increase in farmland (in the middle reaches of the Heihe River) and woodland areas, and the continuous decrease in barren land and grassland areas. Underground runoff in the middle reaches of the Heihe River is decreasing over time, because river water and varying amounts of groundwater are being extracted for agricultural irrigation in the irrigation zones of this area; this is compounded by the increase in farmland area over time.
Therefore, the increase in farmland area is the main cause of the increase in lateral flows and evaporation in the middle reaches of the Heihe River. The increase in woodland area and the continuous decrease in barren land and grassland areas are the main reasons for the decrease in surface runoff. The increase in farmland area and the corresponding increase in irrigation water are the main causes of the decrease in underground runoff. Furthermore, it may be observed that the decrease in underground runoff is the greatest in drought and normal rainfall conditions. This is because very large amounts of water are still being extracted from groundwater sources and the river during drought and normal rainfall conditions. Since the amount of rainfall in these conditions is less than that in wet conditions, the groundwater sources do not receive a large amount of replenishment. Therefore, the significant decrease in underground runoff during drought and normal rainfall conditions may be attributed to the aforementioned causes.
As shown in Figure 7, Figure 8 and Figure 9, changes in the hydrological processes in the middle reaches of the Heihe River were most evident under dry and normal climatic conditions. This finding concurrently indicates that LUCC has a greater effect on the hydrological processes in this region under dry and normal conditions.
Figure 10 shows the spatial heterogeneity and spatial-time variation of the hydrological parameters in the study area from 1990 to 2009 during dry climate conditions. Surface runoff, in sub-basins No. 6, 7, 9, 13, 16, 18, 28, 35, 41, and 78, shows a clear decline for the period from 1990 to 2009. In these sub-basins, the areas of bare land decreased, which is possibly indicative of the main reason that causes a decrease in the surface runoff in the entire watershed. Groundwater increased in sub-basins 13, 29, 35, 41, 52, and 62. In these sub-basins, we observed an increase in farmland area, while in sub-basins 6, 7, 9, 28, 37, 50, 57, and 78, groundwater decreased for the period from 1990 to 2009. In these sub-basins, we observed a decrease in bare land area. Lateral flow increased in sub-basins 13, 41, 53, and 62. In these sub-basins, we observed an increase in farmland area. This may indicate that the main cause of increased lateral flow in the entire watershed is the increase in farmland. We observed increased ET in sub-basins 13, 18, 29, 53, and 62, as well as other sub-basins with increased areas of farmland. Areas of bare land decreased in sub-basins 6, 7, 9, and 28, as well as other sub-basins, which are all characterized by decreasing ET. The main land use change that impacts hydrological processes in the study area is the increasing amount of farmland and the decreasing amount of bare land.
Similar studies using the SWAT model reveal the impacts that LUCC has on hydrological processes. However, these studies may fail to reflect year-to-year changes in land use/cover. Some studies [23,33] divided entire simulation periods into uniform time intervals (e.g., 5-yr intervals) and performed interval simulations using land use/cover data from a single year within each interval. An existing study [35] found that, in the SWAT model, HRUs are lumped together and there is no interaction among HRUs in one sub-basin. Therefore, they improved the SWAT model to allow the distribution of HRUs. In this study, HRUs were also lumped, but we have divided large numbers of HRUs based on patches in the overlain multiple year land use maps, which may reduce the defects of lumped HRUs. However, future research requires the true HRU position to avoid defects from the lumped HRUs. Moreover, the number of HRUs in our study is high compared with similar studies. This may add more complexity to hydrological modeling and require more effort to calibrate the model. Setting a proper HRU threshold is a necessary step to solve these problems.

4. Conclusions

In conventional distributed or semi-distributed hydrological models, such as the SWAT, land use/cover type is assumed to remain constant throughout the simulation period, which limits the ability to interpret and predict the effects of LUCC on hydrological processes in a river basin. To overcome this limitation, a modified SWAT (LU-SWAT) was developed that incorporates annual land use/cover data to simulate LUCC effects on hydrological processes under different climatic conditions. To validate this approach, this modified model was applied to the middle reaches of the Heihe River in northwest China. Key findings from this efforts are as follows.
  • Implementation of the HWDP and farmland reforestation and regrassing measures in 2000 directly affected land use and cover in this region. From 1990 to 2000, farmland areas increased by 10.65% while grassland areas decreased by 9.13%. From 2000 to 2009, farmland areas continued to increase and grassland areas continued to decrease, but at much slower rates of 3.45% and 0.90%, respectively. Primary land use changes in the study area were from grassland to farmland and from bare land to forest.
  • From 1990 to 2009, surface runoff, groundwater runoff, and total water yield showed decreasing trends, while lateral flow and ET volume showed increasing trends under dry, wet, and normal conditions. Under dry, wet, and normal conditions, surface runoff decreased by 75.93%, 23.61%, and 40.44%; groundwater runoff decreased by 45.73%, 11.42%, and 49.55%; and total water yield decreased by 33.74%, 4.23%, and 18.47%; respectively. Lateral flow increased by 99.93%, 30.22%, and 120.21%; and ET volume increased by 35.11%, 13.10%, and 23.60%; respectively. Changes in the various hydrological parameters were most evident under dry and normal climatic conditions.
  • The increase in farmland area is the main cause of the increase in lateral flows and evaporation in the middle reaches of Heihe River. The continuous decrease in barren land and grassland areas are the main reasons for the decrease in surface runoff. The increase in farmland area and the corresponding increase in irrigation water are the main causes of the decrease in underground runoff.
  • Based on the existing research of the middle reaches of the Heihe River and the performance of SWAT 1 and SWAT 2, the modified LU-SWAT developed in this study outperformed the conventional SWAT when predicting the effects of LUCC on the hydrological processes of river basins. Relative to the conventional SWATs, the proposed LU-SWAT achieved NSE values of 0.75 and 0.82, PBIAS values of 4.43% and 4.43%, and RSR values of 0.50 and 0.42 in the calibration period and NSE values of 0.72 and 0.80, PBIAS values of 7.97% and 7.97%, and RSR values of 0.53 and 0.45 in the validation period when simulating monthly and annual runoff in the middle reaches of the Heihe River, respectively.
The results of this study substantially contribute to the state of knowledge regarding LUCC effects on river basin hydrologic processes. The results of this study also advance the state of practice for hydrologic assessments through the development and validation of a modified SWAT (LU-SWAT) that incorporates annual land use/cover data to simulate LUCC effects on hydrological processes under different climatic conditions. Future research will consider opportunities to enhance or more widely apply the LU-SWAT.

Author Contributions

Model development, X.J.; Y.J.; Formal analysis, X.J.; writing—original draft preparation, X.J.; writing—review and editing, Y.J.; X.M.; supervision, X.M.

Funding

This research was funded by grants from the National Natural Science Foundation of China [No. 41,801,094 & 51669028] and Natural Science Foundation of Qinghai Province [No. 2017-ZJ-961Q & 2019-ZJ-939Q].

Conflicts of Interest

The authors declare no conflict of interest.

References

  1. Bonan, G.B. Forests and climate change: Forcings, feedbacks, and the climate benefits of forests. Science 2008, 320, 1444–1449. [Google Scholar] [CrossRef] [PubMed]
  2. Liu, J.; Dietz, T.; Carpenter, S.R.; Alberti, M.; Folke, C.; Moran, E.; Pell, A.; Deadman, P.; Kratz, T.; Lubchenco, J.; et al. Complexity of coupled human and natural systems. Science 2007, 317, 1513–1516. [Google Scholar] [CrossRef]
  3. National Research Council. Advancing Land Change Modeling: Opportunities and Research Requirements; National Academies Press: Washington, DC, USA, 2014. [Google Scholar]
  4. Hansen, J.; Nazarenko, L.; Ruedy, R.; Sato, M.; Willis, J.; Genio, A.; Koch, D.; Lacis, A.; Lo, K.; Menonn, S.; et al. Earth’s Energy Imbalance: Confirmation and Implications. Science 2005, 308, 1431–1434. [Google Scholar] [CrossRef] [PubMed]
  5. IPCC: Climate Change 2013: The physical science basis. In Contribution of Working Group I to the Fifth Assessment Report of the Intergovernmental Panel on Climate Change; Cambridge University Press: New York, NY, USA, 2013.
  6. Paeth, H.; Born, K.; Girmes, R.; Podzun, R.; Jacob, D. Regional climate change in tropical and Northern Africa due to greenhouse forcing and land use changes. J. Clim. 2009, 22, 114–132. [Google Scholar] [CrossRef]
  7. Tilman, D.; Fargione, J.; Wolff, B.; D’Antonio, C.; Dobson, A.; Howwarth, R.; Schindler, D.; Schlesinger, W.; Simberloff, D.; Swackhamer, D. Forecasting Agriculturally Driven Global Environmental Change. Science 2001, 292, 281–284. [Google Scholar] [CrossRef] [PubMed]
  8. Harr, R.; Fredriksen, R.; Rothacher, J. Changes in Streamflow Following Timber Harvest in Southwestern Oregon; USDA Forest Service Research Paper PNW (USA); USDA: Washington, DC, USA, 1979; p. 249.
  9. Liu, Z.; Chen, R.; Song, Y.; Han, C.; Yang, Y. Estimation of aboveground biomass for alpine shrubs in the upper reaches of the Heihe River Basin, Northwestern China. Environ. Earth. Sci. 2015, 73, 5513–5521. [Google Scholar] [CrossRef]
  10. Ngah, M.; Reid, I. The Impact of Land Use Change on Water Yield: The Case Study of Three Selected Urbanised and Newly Urbanised Catchments in Peninsular Malaysia. In Land Degradation and Desertification: Assessment, Mitigation and Remediation; Springer: Dordrecht, The Netherlands, 2010; pp. 347–354. [Google Scholar]
  11. Pearce, A.; Rowe, L.; O’Loughlin, C. Water yield changes after harvesting of mixed evergreen forest, Big Bush State Forest, New Zealand. Presented at Soil and Plant Water Symposium, Bulls, New Zealand, 20–27 September 1982. [Google Scholar]
  12. Mao, D.; Cherkauer, K. Impacts of land-use change on hydrologic responses in the Great Lakes region. J. Hydrol. 2009, 374, 71–82. [Google Scholar] [CrossRef]
  13. Schilling, K.; Jha, M.; Zhang, Y.; Gassman, P.; Wolter, C. Impact of land use and land cover change on the water balance of a large agricultural watershed: Historical effects and future directions. Water. Resour. Res. 2008, 44, 636–639. [Google Scholar] [CrossRef]
  14. Woodward, C.; Shulmeister, J.; Larsen, J.; Jacobsen, G.; Zawadzki, A. The hydrological legacy of deforestation on global wetlands. Science 2014, 346, 844–847. [Google Scholar] [CrossRef]
  15. Brown, A.; Zhang, L.; McMahon, T.; Western, A.; Vertessy, R. A review of paired catchment studies for determining changes in water yield resulting from alterations in vegetation. J. Hydrol. 2005, 310, 28–61. [Google Scholar] [CrossRef]
  16. Choi, W.; Deal, B. Assessing hydrological impact of potential land use change through hydrological and land use change modeling for the Kishwaukee River basin (USA). J. Environ. Manag. 2008, 88, 1119–1130. [Google Scholar] [CrossRef] [PubMed]
  17. Hundecha, Y.; Bárdossy, A. Modeling of the effect of land use changes on the runoff generation of a river basin through parameter regionalization of a watershed model. J. Hydrol. 2004, 292, 281–295. [Google Scholar] [CrossRef]
  18. Motevalli, S.; Mahdi Hosseinzadeh, M.; Esmaili, R. Assessing the Effects of Land use Change on Hydrologic Balance of Kan Watershed using SCS and HEC-HMS Hydrological Models—Tehran, IRAN. Aust. J. Basic Appl. Sci. 2012, 6, 510–519. [Google Scholar]
  19. Bormann, H.; Elfert, S. Application of WaSiM-ETH model to Northern German lowland catchments: Model performance in relation to catchment characteristics and sensitivity to land use change. Adv. Geosci. 2010, 27, 1–10. [Google Scholar] [CrossRef]
  20. Li, Z.; Liu, W.; Zhang, X.; Zheng, F. Impacts of land use change and climate variability on hydrology in an agricultural catchment on the Loess Plateau of China. J. Hydrol. 2009, 377, 35–42. [Google Scholar] [CrossRef]
  21. Li, J.; Zhou, Z. Coupled analysis on landscape pattern and hydrological processes in Yanhe watershed of China. Sci. Total Environ. 2015, 505, 927–938. [Google Scholar] [CrossRef]
  22. Liu, M.; Li, C.; Hu, Y.; Sun, F.; Xu, Y.; Chen, T. Combining CLUE-S and SWAT models to forecast land use change and non-point source pollution impact at a watershed scale in Liaoning Province, China. Chin. Geogr. Sci. 2014, 24, 540–550. [Google Scholar] [CrossRef]
  23. Zhou, F.; Xu, Y.; Chen, Y.; Xu, C.; Gao, Y.; Du, J. Hydrological response to urbanization at different spatio-temporal scales simulated by coupling of CLUE-S and the SWAT model in the Yangtze River Delta region. J. Hydrol. 2013, 485, 113–125. [Google Scholar] [CrossRef]
  24. Jin, X.; Zhang, L.; Gu, J.; Zhao, C.; Tian, J.; He, C. Modeling the impacts of spatial heterogeneity in soil hydraulic properties on hydrological process in the upper reach of the Heihe River in the Qilian Mountains, Northwest China. Hydrol. Process. 2015, 29, 3318–3327. [Google Scholar] [CrossRef]
  25. Luo, Y.; He, C.; Sophocleous, M.; Yin, Z.; Ren, H.; Zhu, O. Assessment of crop growth and soil water modules in SWAT2000 using extensive field experiment data in an irrigation district of the Yellow River Basin. J. Hydrol. 2008, 352, 139–156. [Google Scholar] [CrossRef]
  26. Vigiak, O.; Malagó, A.; Bouraoui, F.; Vanmaercke, M.; Obreja, F.; Poesen, J.; Habersack, H.; Feher, J.; Groselj, S. Modelling sediment fluxes in the Danube River Basin with SWAT. Sci. Total Environ. 2017, 599–600, 992–1012. [Google Scholar] [CrossRef] [PubMed]
  27. Arnold, J.; Allen, P.; Volk, M.; Williams, J.; Bosch, D. Assessment of different representations of spatial variability on SWAT model performance. Trans. ASABE 2010, 53, 1433–1443. [Google Scholar] [CrossRef]
  28. Wang, G.; Liu, J.; Kubota, J.; Chen, L. Effects of land-use changes on hydrological processes in the middle basin of the Heihe River, northwest China. Hydrol. Process. 2007, 21, 1370–1382. [Google Scholar] [CrossRef]
  29. Wang, C.; Wang, X.; Liu, D.; Wu, H.; Lv, X.; Fang, Y.; Cheng, W.; Luo, W.; Jiang, P.; Shi, J.; et al. Aridity threshold in controlling ecosystem nitrogen cycling in arid and semi-arid grasslands. Nat. Commun. 2014, 5, 1–8. [Google Scholar] [CrossRef] [PubMed]
  30. Moriasi, D.; Arnold, J.; VanLiew, M.; Binger, R.; Harmel, R.; Veith. Model evaluation guidelines for systematic quantification of accuracy in watershed simulations. Trans. ASABE 2007, 50, 885–900. [Google Scholar] [CrossRef]
  31. White, K.; Chaubey, I. Sensitivity analysis, calibration, and validations for a multisite and multivariable SWAT model 1. J. AWRA 2010, 41, 1077–1089. [Google Scholar] [CrossRef]
  32. Lai, Z.; Li, S.; Li, C.; Nan, Z.; Yu, W. Improvement and Applications of SWAT Model in the Upper-middle Heihe River Basin. J. Nat. Resour. 2013, 28, 1404–1413. (In Chinses) [Google Scholar]
  33. Zhang, L.; Nan, Z.; Wu, Y.; Ge, Y. Modeling Land-Use and Land-Cover Change and Hydrological Responses under Consistent Climate Change Scenarios in the Heihe River Basin, China. Water. Resour. Manag. 2015, 29, 4701–4717. [Google Scholar] [CrossRef]
  34. Xu, C.; Chen, Y.; Chen, Y.; Zhao, R.; Ding, H. Responses of surface runoff to climate change and human activities in the arid region of Central Asia: A case study in the Tarim River Basin, China. Environ. Manag. 2013, 51, 926–938. [Google Scholar] [CrossRef]
  35. Meng, F.; Liu, T.; Wang, H.; Luo, M.; Duan, Y.; Bao, A. An Alternative Approach to Overcome the Limitation of HRUs in Analyzing Hydrological Processes Based on Land Use/Cover Change. Water 2018, 10, 434. [Google Scholar] [CrossRef]
Figure 1. Map of the Heihe River Basin study area.
Sustainability 11 01072 g001
Figure 2. Modified hydrological response unit (HRU) generation process based on annual land use/land cover (LULC) maps.
Sustainability 11 01072 g002
Figure 3. Comparative computation flows: (a) Conventional SWAT and (b) proposed LU-SWAT.
Sustainability 11 01072 g003
Figure 4. Land use changed and unchanged area in the study region.
Sustainability 11 01072 g004
Figure 5. Estimated and observed monthly runoff in the middle reaches of the Heihe River based on LU-SWAT simulations and Zhengyixia hydrometric station measurements.
Sustainability 11 01072 g005
Figure 6. Estimated and observed annual runoff in the middle reaches of the Heihe River.
Sustainability 11 01072 g006
Figure 7. Hydrological parameter variation in the middle reaches of the Heihe River under dry conditions from 1990 to 2009.
Sustainability 11 01072 g007
Figure 8. Hydrological parameter variation in the middle reaches of the Heihe River under wet conditions from 1990 to 2009.
Sustainability 11 01072 g008
Figure 9. Hydrological parameter variation in the middle reaches of the Heihe River under normal conditions from 1990 to 2009.
Sustainability 11 01072 g009
Figure 10. Hydrological parameter spatial variation in the middle reaches of the Heihe River.
Sustainability 11 01072 g010
Table 1. Land areas by use type in the middle reaches of the Heihe River from 1990 to 2009 (units: km2).
YearFarmlandForestGrasslandWaterUrbanBare land
19903812.582766.747590.15585.397325.229936.87
19913847.612791.937492.58570.387375.2959939.16
19923887.592859.447385.07725.492415.3229744.04
19933932.62911.937292.58650.441442.8079786.60
19943975.112981.937277.57612.916495.3029674.14
19954015.223049.437170.06567.885525.3099689.05
19964057.323110.027094.67647.96578.1029528.89
19974105.413200.056999.68685.465620.6049405.75
19984145.183285.076907.18692.97688.1099298.45
19994187.213355.116889.67682.963728.1169173.89
20004218.523410.636897.18680.461758.1229052.05
20014230.223530.166881.83670.455783.1338921.16
20024245.243662.696882.17667.953838.1368720.78
20034268.633795.216867.16682.963843.1398559.86
20044283.553835.246864.65685.465868.1568479.90
20054305.313972.766842.14682.963888.178325.62
20064319.424015.296837.14672.956928.1778243.98
20074335.114147.816824.63670.455955.6828083.28
20084358.224277.836827.13662.949983.1877907.64
20094376.224307.856819.62667.9531005.697839.62
Table 2. Initial model parameter sensitivity analysis results using the conventional SWAT.
Hydrological Parametertp
ESCOSoil evaporation compensation coefficient0.390.86
CANMXMaximum canopy storage−0.410.85
HRU_SLPAverage slope of the sub-basin0.440.81
RCHRG_DPAquifer percolation coefficient0.490.78
SURLAGSurface runoff lag coefficient0.520.76
OV_NManning’s n value for overland flow−0.550.68
EPCOPlant uptake compensation factor0.60.67
BIOMIXBiological mixing efficiency−0.630.63
SLSUBBSNAverage slope length0.640.6
SMTMPSnow melting accumulated temperature1.860.06
SMFMXMelt factor on 21 December−0.740.41
REVAPMNThreshold water level in shallow aquifer for revaporization0.920.37
TIMPSnow temperature lag factor0.970.34
SFTMPSnowfall temperature−0.990.32
GW_DELAYDelay time for aquifer recharge1.020.31
GW_REVAPGroundwater revaporization coefficient−1.150.25
SMFMNMelt factor on 21 December−1.370.17
GWQMNThreshold water level in shallow aquifer for base flow0.70.45
CH_N2Manning’s n value for the main channel−2.490.01
ALPHA_BFBaseflow recession constant6.110
CN2Initial Soil Conservation Service (SCS) runoff curve number for moisture condition II8.590
CH_K2Effective hydraulic conductivity of main channel alluvium−14.090
Note: For each parameter, t is the sensitivity (as |t| increases, parameter sensitivity increases), and p is the statistical significance of the sensitivity (as p approaches 0, parameter sensitivity increases.
Table 3. Ranges of the calibrated parameters.
ParametersMax ValueMin Value
TIMP v10.01
SFTMP v0.51.5
GW_DELAY v0300
GW_REVAP v0.20.02
SMFMN v100
GWQMN v150350
CH_N2 v0.20.01
ALPHA_BF v0.300.00
CN2 r0.50−0.50
CH_K2 v3000
v Parameter value is replaced by a given value; r Parameter value is multiplied by (1 + a given value).
Table 4. Evaluation parameters for SWAT 1, SWAT 2, and LU-SWAT when simulating monthly and annual runoff in the middle reaches of the Heihe River.
SWAT 1SWAT 2LU-SWAT[32][33]
MonthlyNSECalibration0.630.580.750.630.75
Validation0.690.680.720.600.70
PBIASCalibration−8.97−4.714.43NaNa
Validation5.0510.707.97NaNa
RSRCalibration0.610.650.500.610.50
Validation0.560.570.530.770.55
YearlyNSECalibration0.700.770.82NaNa
Validation0.770.750.80NaNa
PBIASCalibration−8.97−4.714.43NaNa
Validation5.0510.707.97NaNa
RSRCalibration0.550.480.42NaNa
Validation0.480.590.45NaNa
Table 5. Hydrological parameters in the middle reaches of the Heihe River from 1990 to 2009 estimated using the proposed LU-SWAT (units: mm).
YearPrecipitationSurface RunoffLateral FlowGroundwater RunoffETTotal Water Yield
1990206.486.239.3517.78231.6033.36
1991149.231.943.6015.62182.4121.16
1992207.282.673.6812.71209.8819.06
1993249.879.3015.1715.40233.3539.87
1994181.932.894.1617.34201.6424.39
1995202.703.716.0516.97213.0526.73
1996204.416.3911.8714.82201.8933.09
1997133.552.232.8414.21180.6419.28
1998250.2915.7514.5413.71233.5444.00
1999172.335.166.8413.91198.0925.91
2000206.684.116.7113.03221.0023.85
2001168.843.194.5912.62186.4320.40
2002212.577.4612.1714.21211.7733.85
2003234.0810.0618.6815.19206.0243.93
2004161.147.657.0611.75206.7326.47
2005229.2911.2214.8714.52226.2640.61
2006137.3511.2718.3916.06166.4645.72
2007247.7713.3920.0814.77209.7348.24
2008178.139.7518.1117.14203.0045.00
2009143.5411.1915.4615.04170.0041.69

