Assessing Freshwater Provision and Consumption in the Alpine Space Applying the Ecosystem Service Concept
by
 , , and
Claude Meisch
1 ,
,
Uta Schirpke
1,* ,
,
Lisa Huber
1,
Johannes Rüdisser
1,† and
and
Ulrike Tappeiner
1,2,† 1
Department of Ecology, University of Innsbruck, Sternwartestrasse 15, 6020 Innsbruck, Austria
2
Institute for Alpine Environment, Eurac Research, Viale Druso 1, 39100 Bozen/Bolzano, Italy
*
Author to whom correspondence should be addressed.
†
Both authors contributed equally to this work.
Sustainability 2019, 11(4), 1131; https://doi.org/10.3390/su11041131
Submission received: 11 January 2019
/
Revised: 13 February 2019
/
Accepted: 18 February 2019
/
Published: 21 February 2019
(This article belongs to the Special Issue Application of the Ecosystem Service Concept in Social–Ecological Systems—from Theory to Practice)
Abstract
:A key challenge in the sustainable management of freshwater is related to non-stationary processes and transboundary requirements. The assessment of freshwater is often hampered due to small-scale analyses, lacking data and with the focus on only its provision. Based on the ecosystem service (ES) concept, this study aims at quantitatively comparing potential water supply with the demand for freshwater in the European Alps and their surrounding lowlands. We propose an easy-to-use combination of different mapping approaches, including a large-scale hydrologic model to estimate water supply and the downscaling of regional data to the local scale to map demand. Our results demonstrate spatial mismatches between supply and demand and a high dependency of the densely populated lowlands from water providing mountain areas. Under expected climate variations and future demographic changes, our results suggest increasing pressures on freshwater in the south of the Alps. Hence, sustainable water management strategies need to assure the supply of freshwater under changing environmental conditions to meet the increasing water demand of urbanized areas in the lowlands. Moreover, national water management strategies need to be optimally concerted at the international level, as transboundary policies and frameworks can strengthen future water provision.
1. Introduction
In many parts of the world, mountains play an indispensable role in providing water for households, irrigation, hydropower production and other uses [1,2,3,4]. When focussing on Central Europe, it is the Alps with its apparently inexhaustible water resources, with an environmental, economic and cultural importance beyond measure [5], that provide water resources not only for the mountain regions but also for the surrounding lowlands [6,7]. Therefore, Alpine water management strategies potentially affect an important part of Europe. For the long-term protection of water resources, a transboundary approach is needed to ensure the sustainable use of water resources as well as the protection of vital ecosystems enhancing water quality [8] and mitigating the impacts of global change on water resources and related benefits [9].
The EU Water Framework Directive (Directive 2000/60/EC) aims to address the challenge of reaching a good ecological and chemical status for surface and groundwater through River Basin Management Plans. The development and adaptation of those plans could be supported by natural-resource assessments based on the ecosystem service (ES) concept. ES are defined as the benefits that people obtain from ecosystems [10] and their provision depends on the state of the ecosystem, the abiotic and biophysical conditions, and anthropogenic activities [11,12]. As assessments of ES are increasingly inferred or modelled from both key ecosystem properties such as vegetation, topography and climatic variables [13] and socio-economic information such as population and land use, this concept recognises the multi-functionality of ecosystems and provides information on social and economic aspects, which are highly important for complex decisions in water management [8]. This holistic approach is especially important in the light of global change, affecting high-elevated mountain regions and their freshwater resources more seriously than lowlands [14]. By providing solutions that foster ecosystem functions and related services, the integration of the ES concept in water resources management seems capable of tackling this challenge [15]. ES related to water such as “freshwater for domestic use” are among the most important ES for human wellbeing [16]. To guarantee their sustainable use as well as to protect relevant ecosystem properties such as the capacity to regulate and store water, a systematic approach combining geographical (catchments) and institutional borders is needed for the Alpine region.
Many efforts have been made at the European scale in integrated water management; see for example the river basin wide approach in the water framework directive 2000/60/EC. However, cities and municipalities are usually in charge of the actually used part of the supplied water resource, which is delivered by thousands of local and regional water companies in a decentralised manner [17]. A recent study from the Swiss Alps suggests that socio-economic changes could have a greater impact on water resources than climate change [18]. To cope with increasing water distribution conflicts, we need to rethink current water and land-management practices to achieve a more sustainable water management [19], within the basin and across geographical and institutional borders. Furthermore, the identification of potential mismatches between the supply and demand of ES is an important prerequisite to facilitate a sustainable management of natural resources [20,21].
Although many studies have addressed current or future water provision at different levels [17,19,22,23,24], most studies quantify water provision in mountain regions as an ES and analysing future impacts of global change concentrated on the water supply at the watershed level, applying complex hydrological models [9,25]. These studies require various input data that are usually not available at larger scales and provide therefore only limited information for developing cross-national strategies. To overcome these constraints related to data collection and modelling, methods are needed to quantify supply and demand using openly available data and tools. Therefore, to support a sustainable use of water resources from mountain regions, this study aimed at spatially assessing the ES ‘freshwater for domestic use’ at a cross-national level. Specifically, the objectives were:
- To provide a robust methodology to assess the demand and supply of freshwater using simple and openly available data,
- To quantify supply and demand of freshwater for the entire Alpine Space area under current conditions, and
- To estimate impacts of expected future climatic variations and demographic changes on water supply and demand.
We mapped the water supply utilizing a large-scale hydrologic model, whereas the demand for freshwater was based on freely available datasets at European level. By overlaying the resulting maps, we analysed spatial relationships between supply and demand. Based on future scenarios regarding changes in precipitation patterns as well as demographic changes, we assessed the potential implications on water supply and demand until the end of this century.
2. Materials and Methods
2.1. Study Area
The study area corresponds to the area of the Alpine Space programme [26], which covers an area of 390,000 km² and includes the European Alps with its foothills and surrounding lowlands (Figure A1 in Appendix A). The Alpine Space area comprises Austria, Liechtenstein, Slovenia and Switzerland completely as well as the Alpine regions of Germany, France and Italy. The mountainous core zone is mainly covered by natural and semi-natural ecosystems including forests, managed and natural grasslands, rocks and glaciers, whereas the landscape of the surrounding lowlands is characterized by intensive agriculture and urban agglomerations [27]. While the Alpine space area is home to almost 70 million people, living mostly in great urban agglomerations in the lowlands, the Alps represent one of the most important tourist areas globally.
To characterize the climatic conditions and account for the differing hydro-meteorological conditions of the Alps, a differentiation between four sub-regions has been made: (a) the northwest, (b) the northeast, (c) the southwest and (d) the southeast [28]. The central Alpine chain is the most clearly distinguishable climate border, where cloudiness, sunshine, precipitation, temperature and air pressure cohere. A second continental-scale climate border could be anticipated between (western) oceanic influences of the Atlantic and (eastern) continental features of the Eurasian continent [6,28]. Precipitation is high in the north and southeastern region, reaching 1500–2700 mm/year, while relatively low in the South-West 500–950 mm/year, while average yearly temperatures range from −6 °C within the high Alps to 14 °C in the southern foothills [23]. The Alps are widely known as the “water towers of Europe”, which is due to the abundance of water resulting from an uplift and subsequent cooling of air, which turns into precipitation. The lower rate of net radiation, low temperatures, the melting water from snow and ice, and the short vegetation period result in low evapotranspiration and high annual runoff [6].
2.2. Mapping Current Water Supply
The supply of freshwater is the provision of water by ecosystems, regardless of its actual use, referring to a specified period of time [29]. We used the water yield model from the InVEST toolbox (Reservoir Hydropower Production model) [30] to assess the water provisioning capacity within the study area, estimating the annual average quantity of water produced per year and hectare and reported at municipality level.
The InVEST water yield model allows to estimate annual water yield from a catchment. The choice for the InVEST model was based on a compromise between model complexity, computational effort and performance on large scale [31,32]. As such, previous studies suggest that the InVEST model is best used on regional to transnational scales [33]. Moreover, the catchment sizes were parameterized at regional scale, as uncertainties could not be reduced by refining the scale [32].
The model estimates the total annual water yield as the difference between total catchment annual rainfall and total catchment annual actual evapotranspiration at each cell of the underlying raster grid and for every catchment in the study area [30]. Thereby, the assumption is taken that all rainfall minus the evapotranspiration is leaving the catchment and no distinction between a surface and a subsurface flow is made. The model is based on Budyko’s curve, describing the partitioning of precipitation into evapotranspiration and runoff and follows a simple evapotranspiration/potential evapotranspiration scheme [34]. Measurements of annual actual evapotranspiration at catchment scale are an extremely intensive task. These measurements require highly specialised equipment at plot scale and even more uncertainties arise at landscape scale [35]. To minimise the impact of these unknown, the InVEST model relates actual evapotranspiration to potential evapotranspiration following Budyko’s approach [30].
The InVEST model requires five biophysical parameters as georeferenced raster datasets. These are root restricting layer depth (mm), plant available water content (AWC, as a proportion), average annual precipitation (mm), average annual potential evapotranspiration (PET, mm) and land use/land cover (LULC). The datasets were obtained from a variety of sources (Table 2). Nonetheless, one challenge of this study was for the data to be obtainable without restrictions and free of license to ensure reusability by potential decision makers.
The model was parameterized by comparing it to the “Observation-based map of mean runoff” data, which was built to parameterize large-scale models [36]. To measure the statistical quality, regressions were calculated as well as the root mean squared errors. This global dataset was compiled from four sources, whereas in Europe runoff data was aggregated from the Global Runoff Data Centre (GRDC)-database [36]. Assuming that the mean annual volumetric discharge difference between a station and its upstream neighbour represents the mean annual runoff that is generated in the interstation region, it is well suited to spatially evaluate macro-scale hydrological models [36,37]. After carrying out a sensitivity analysis to define the influence of the input variables, the model was calibrated by the mean annual hydraulic conductivity, describing water uptake of biomass.
Furthermore, as it was difficult to determine empirically an annual mean of this seasonally dependant variable, the model was started by estimating this value from leaf-area index (LAI) [38,39] and parameterized on behalf of this value. LAI characterizes the area of green leaf per unit area of ground surface and was obtained from MODIS (Moderate Resolution Imaging Spectroradiometer) Terra Leaf Area Index product. Where monthly LAI ≤ 3, monthly Kc values were derived as LAI ÷ 3; where LAI > 3, LAI values were derived from FAO tables [39]. To get annual Kc Values, a mean value was calculated.
To account for the different climatologic circumstances, we used four climatological sub-regions (Figure A1 in Appendix A), following the concept of coarse resolution regionalisation [28]. For each climatic region, the model was parameterized and individual model runs were started. The model was run within Python from R.
The model is sensitive to precipitation input [40]. As uncertainties in precipitation values are highest in the Alpine region in most data, the Alpine-specific precipitation maps of HISTALP (Historical Instrumental Climatological Surface Time Series of the Greater Alpine Region) were chosen as an input (Table 1).
2.3. Mapping Current Water Demand
The demand for freshwater represents the amount of water that is required (or desired) by society and is often measured by the direct use [45]. The Alpine-wide map was based on water statistics from Eurostat, the statistical office of the European Union [46]. The data is described as “yearly data on freshwater resources, water abstraction and use” and is updated every two years. These datasets were collected by national statistical institutes, then validated and merged by Eurostat [46] and provided to the European Data Centre for Water (WISE). As these data are only available at the regional scale, see level 2 of the nomenclature of territorial units for statistics (NUTS 2) defined as “basic regions for the application of regional policies” [47], we downscaled the data to municipality level using touristic and demographic data. We allocated the water abstraction for public use to tourism occupancy rates and population data at the municipality level. As such, the tourism occupancy rates (overnight stays in hotels) were converted to “permanent resident equivalent” [48,49] before being added to the number of residents within a municipality, representing the potential freshwater consumers.
The dataset “Annual fresh water abstraction by source and by sector and other sources of water” was downloaded using the Eurostat R Package [50]. We filtered the data for the countries and NUTS-2 regions of the study area as well as for households and the tertiary sector. For Austria and Germany, the reference year was 2010, while France and Italy had data available for 2012 and Slovenia’s data is from 2013. The dataset for Switzerland is not delivered in the European statistics and was derived from the provided dataset of Federal Statistical Office of Switzerland for the reference period of 2011 [51].
2.4. Future Scenarios
Although the strong topographic variability of the Alps adds a high complexity and uncertainty to climate predictions in the Alpine region [52,53], many regional climate models (RCMs) agree on a dipolar north–south precipitation pattern with an increase of annual precipitation in Northern Europe and a decrease in Southern Europe [53,54,55]. To cover possible precipitation changes for the time period 2070–2100 for a moderate emission scenario (RCP4.5), we initiated a InVEST water yield model run where the HISTALP precipitation model input (Table 1) was adapted for an increase of 10% in the two climatological sub-regions in the northwest and the northeast and a decrease of 10% in the southwest and southeast [55]. We could not implement a change in evapotranspiration due to future land-use/land-cover changes, as no such dataset was available at the required spatio-temporal scale. However, recent publications indicated that only minor changes in the annual discharge can be expected [56,57].
Eurostat prognoses a population increase of more than 17% in Austria in 2080 in comparison to 2015, and a small decrease of 6% in Slovenia [58]. Switzerland and Liechtenstein are not mentioned, while the big countries of Germany, France and Italy are not further subdivided into Alpine and not-Alpine areas and can therefore not be taken into consideration. The degree of urbanization in the European Union is predicted to increase and consequently the total population in urbanised areas but not in rural regions [53,55]. Therefore, we assumed a moderate increase of 5% for cities with more than 120,000 inhabitants.
2.5. Spatial Analysis
To identify spatial clusters of high and low water yield classes, a Getis–Ord Gi* statistic using the spatial statistics extension of ESRI ArcGIS 10.4 was calculated [59,60]. The Getis–Ord Gi* statistic calculates for each municipality a z-score, which allows to identify hot spots (municipalities clustered by high values) and cold spots (municipalities clustered by low values) within the context of neighbouring municipalities. All classifications applied in the maps were based on the mean values of significant hot and cold spots based on the hot spot analysis.
To visualize spatial mismatches between supply and demand at the municipality level, the discrepancy between the maps of supply and demand was computed by subtracting water use from water supply.
3. Results
3.1. Current Supply and Demand
The water supplies formed clusters in mountain areas (Figure 1), while municipalities in the lowlands had access to considerably less water. About 68% of all water supply within the Alpine Space area came from municipalities within the European Alps. The model performance was considerably lower in the north than in the south and the overall mean error rate for the different regions spanned from 10.2% to 17.7% (Table 2). The model mainly underestimated the actual observations for catchments of the model setups for the northern climate regions, in combination with large runoffs (Figure 2).
The spatial pattern of the demand followed the large-scale topographic heterogeneities (Figure 1). Whereas the mountain areas were characterised by low values, the large urban agglomerations in the Alpine lowlands especially used large water amounts.
3.2. Spatial Relationships
The hot spot analysis with Getis–Ord Gi* statistic confirmed the spatial clustering of municipalities with a significant higher water yield in the core of the European Alps providing large amounts of water, while the surrounding lowlands were characterized by smaller local water yields (Figure 3). Large hot spot areas within mountain areas indicated a positive autocorrelation between water supplying municipalities, while the cold spots refer to clusters of municipalities supplying less water. Accordingly, well-dispersed peaks of the probability distribution functions of the water supply emerged within the European Alps and the lowlands (Figure A2 in Appendix A), indicating larger water provisioning capacities for municipalities in mountain regions compared to those in the lowlands.
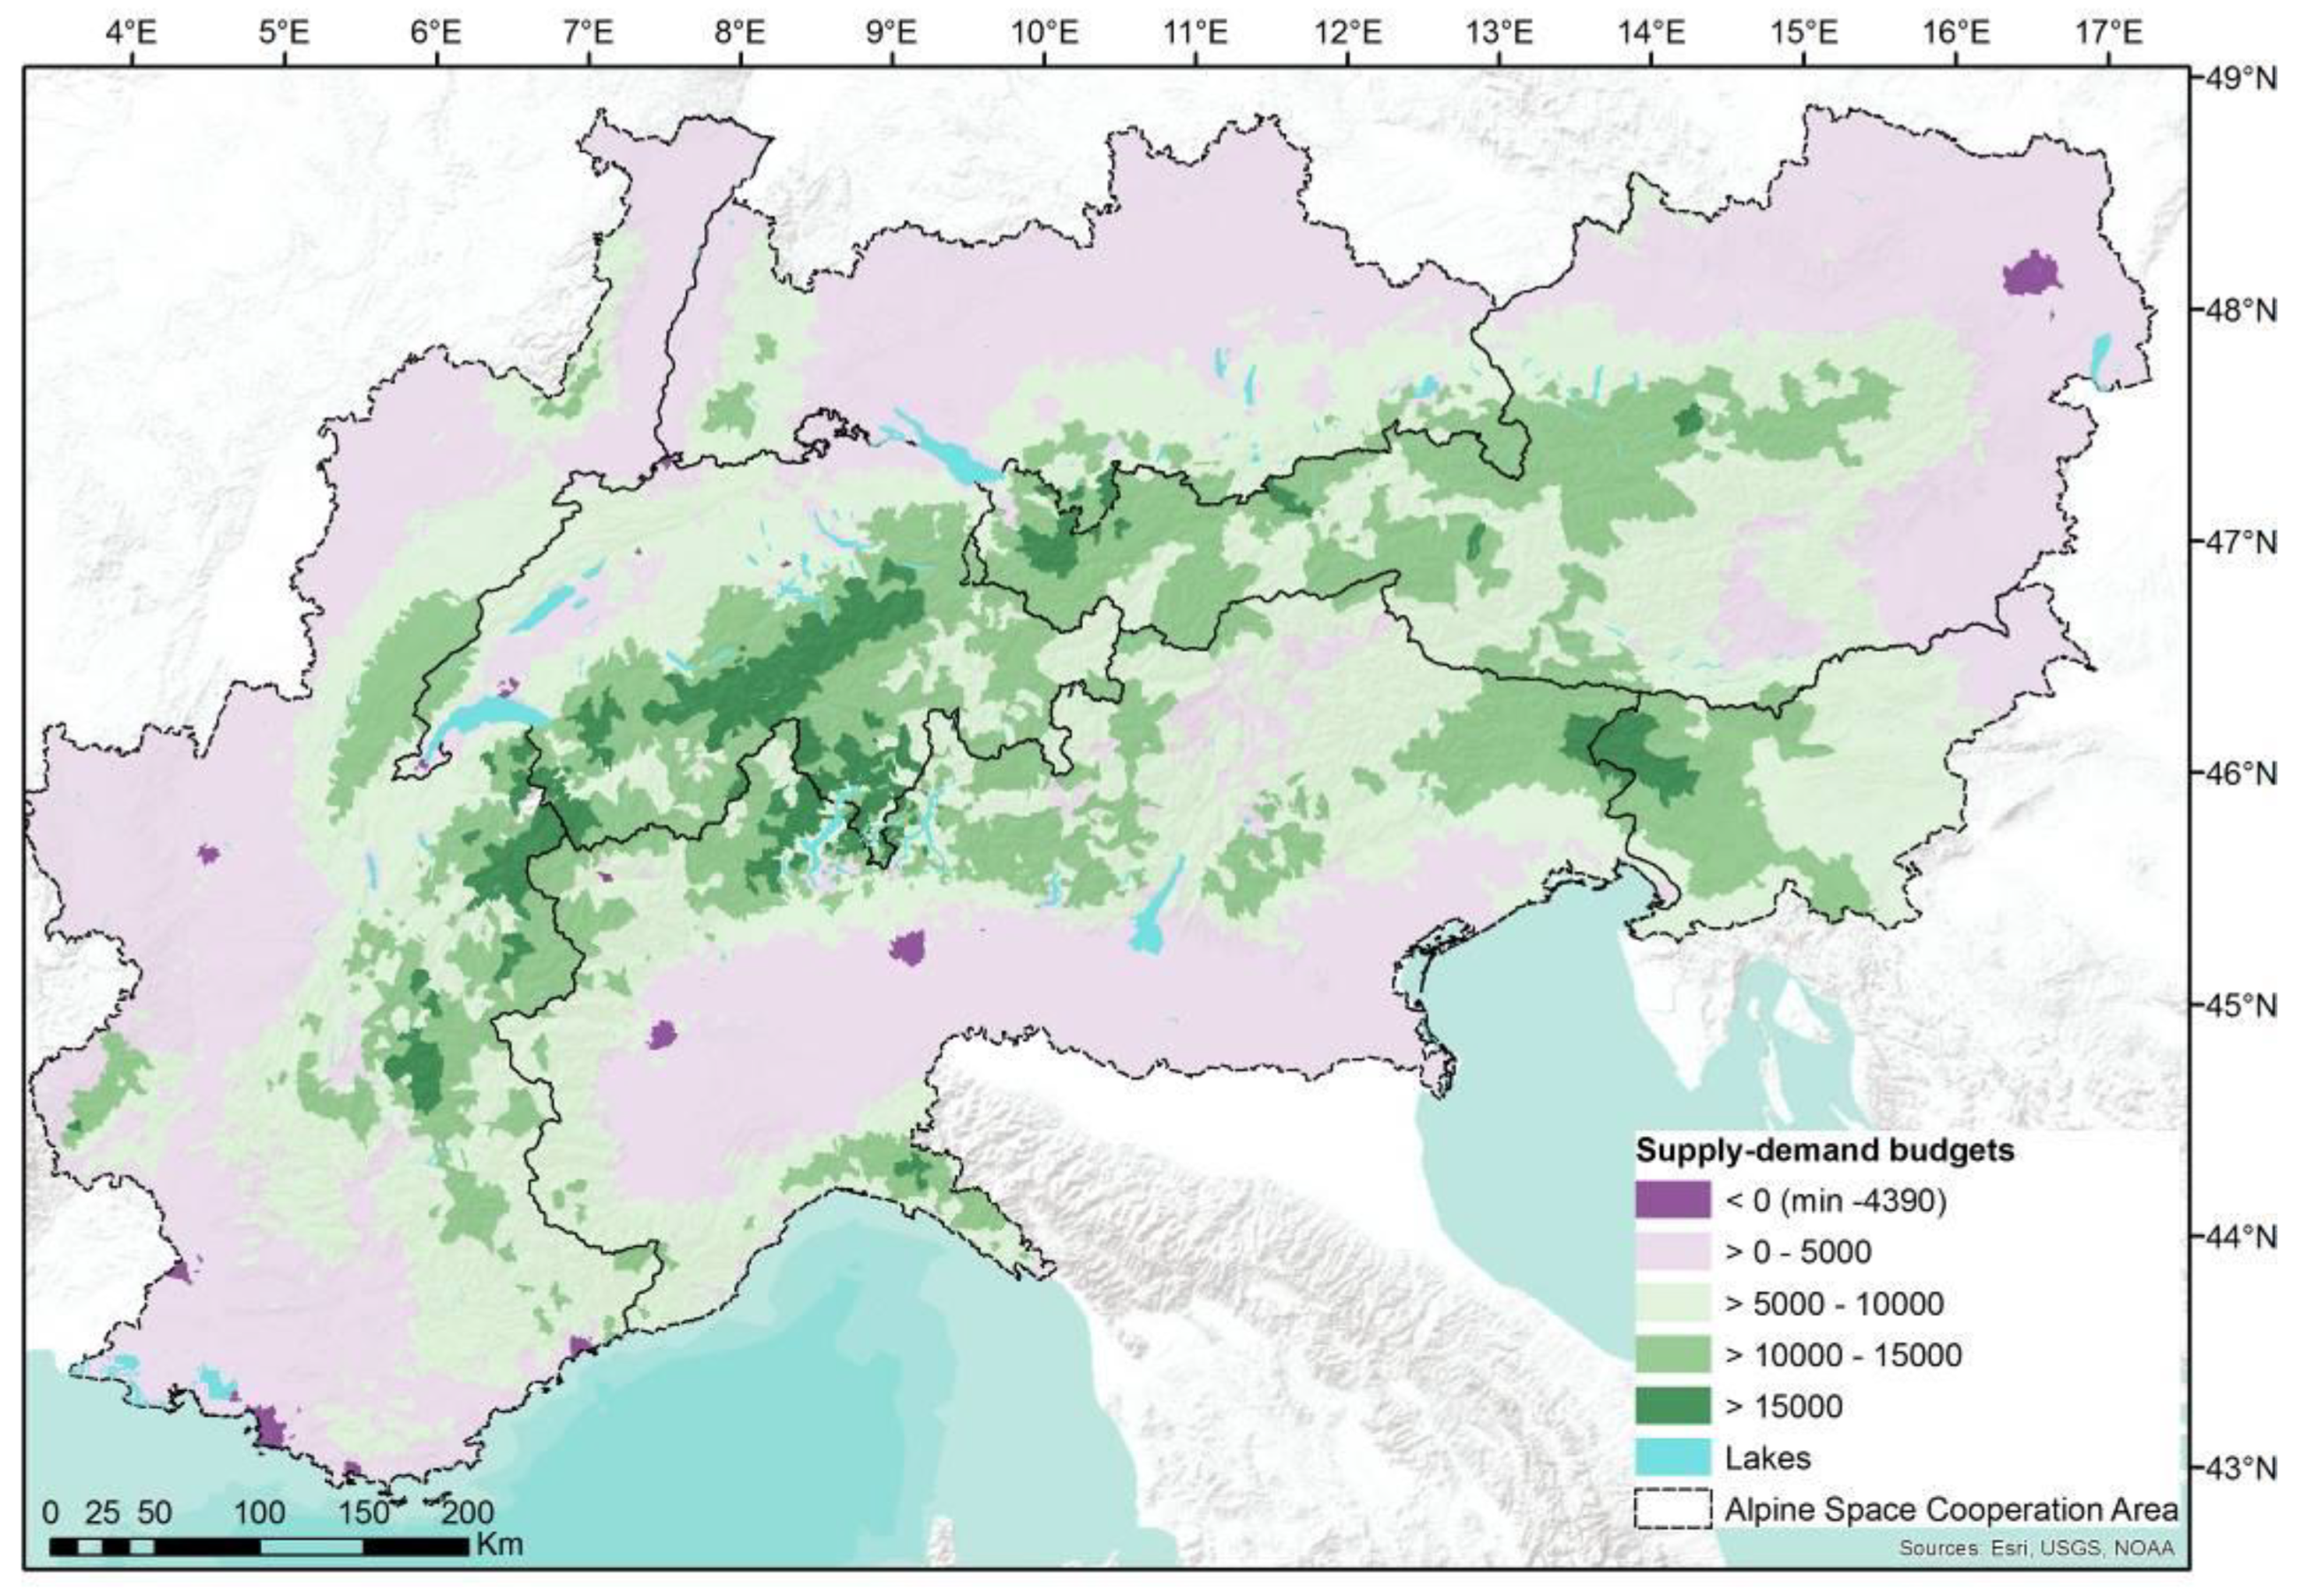
The supply-demand budgets at the municipality level for the Alpine Space area revealed the dependency of the densely populated lowlands from water providing mountain areas. While the largest cities already depend on water yield from surrounding areas to provide enough freshwater as consumed by their inhabitants, there is enough water yield in the remaining municipalities to supply the freshwater demanded by households and the tertiary sector, at least on an annual resolution, and not considering water used for agriculture (Figure 4).
3.3. Future Trends
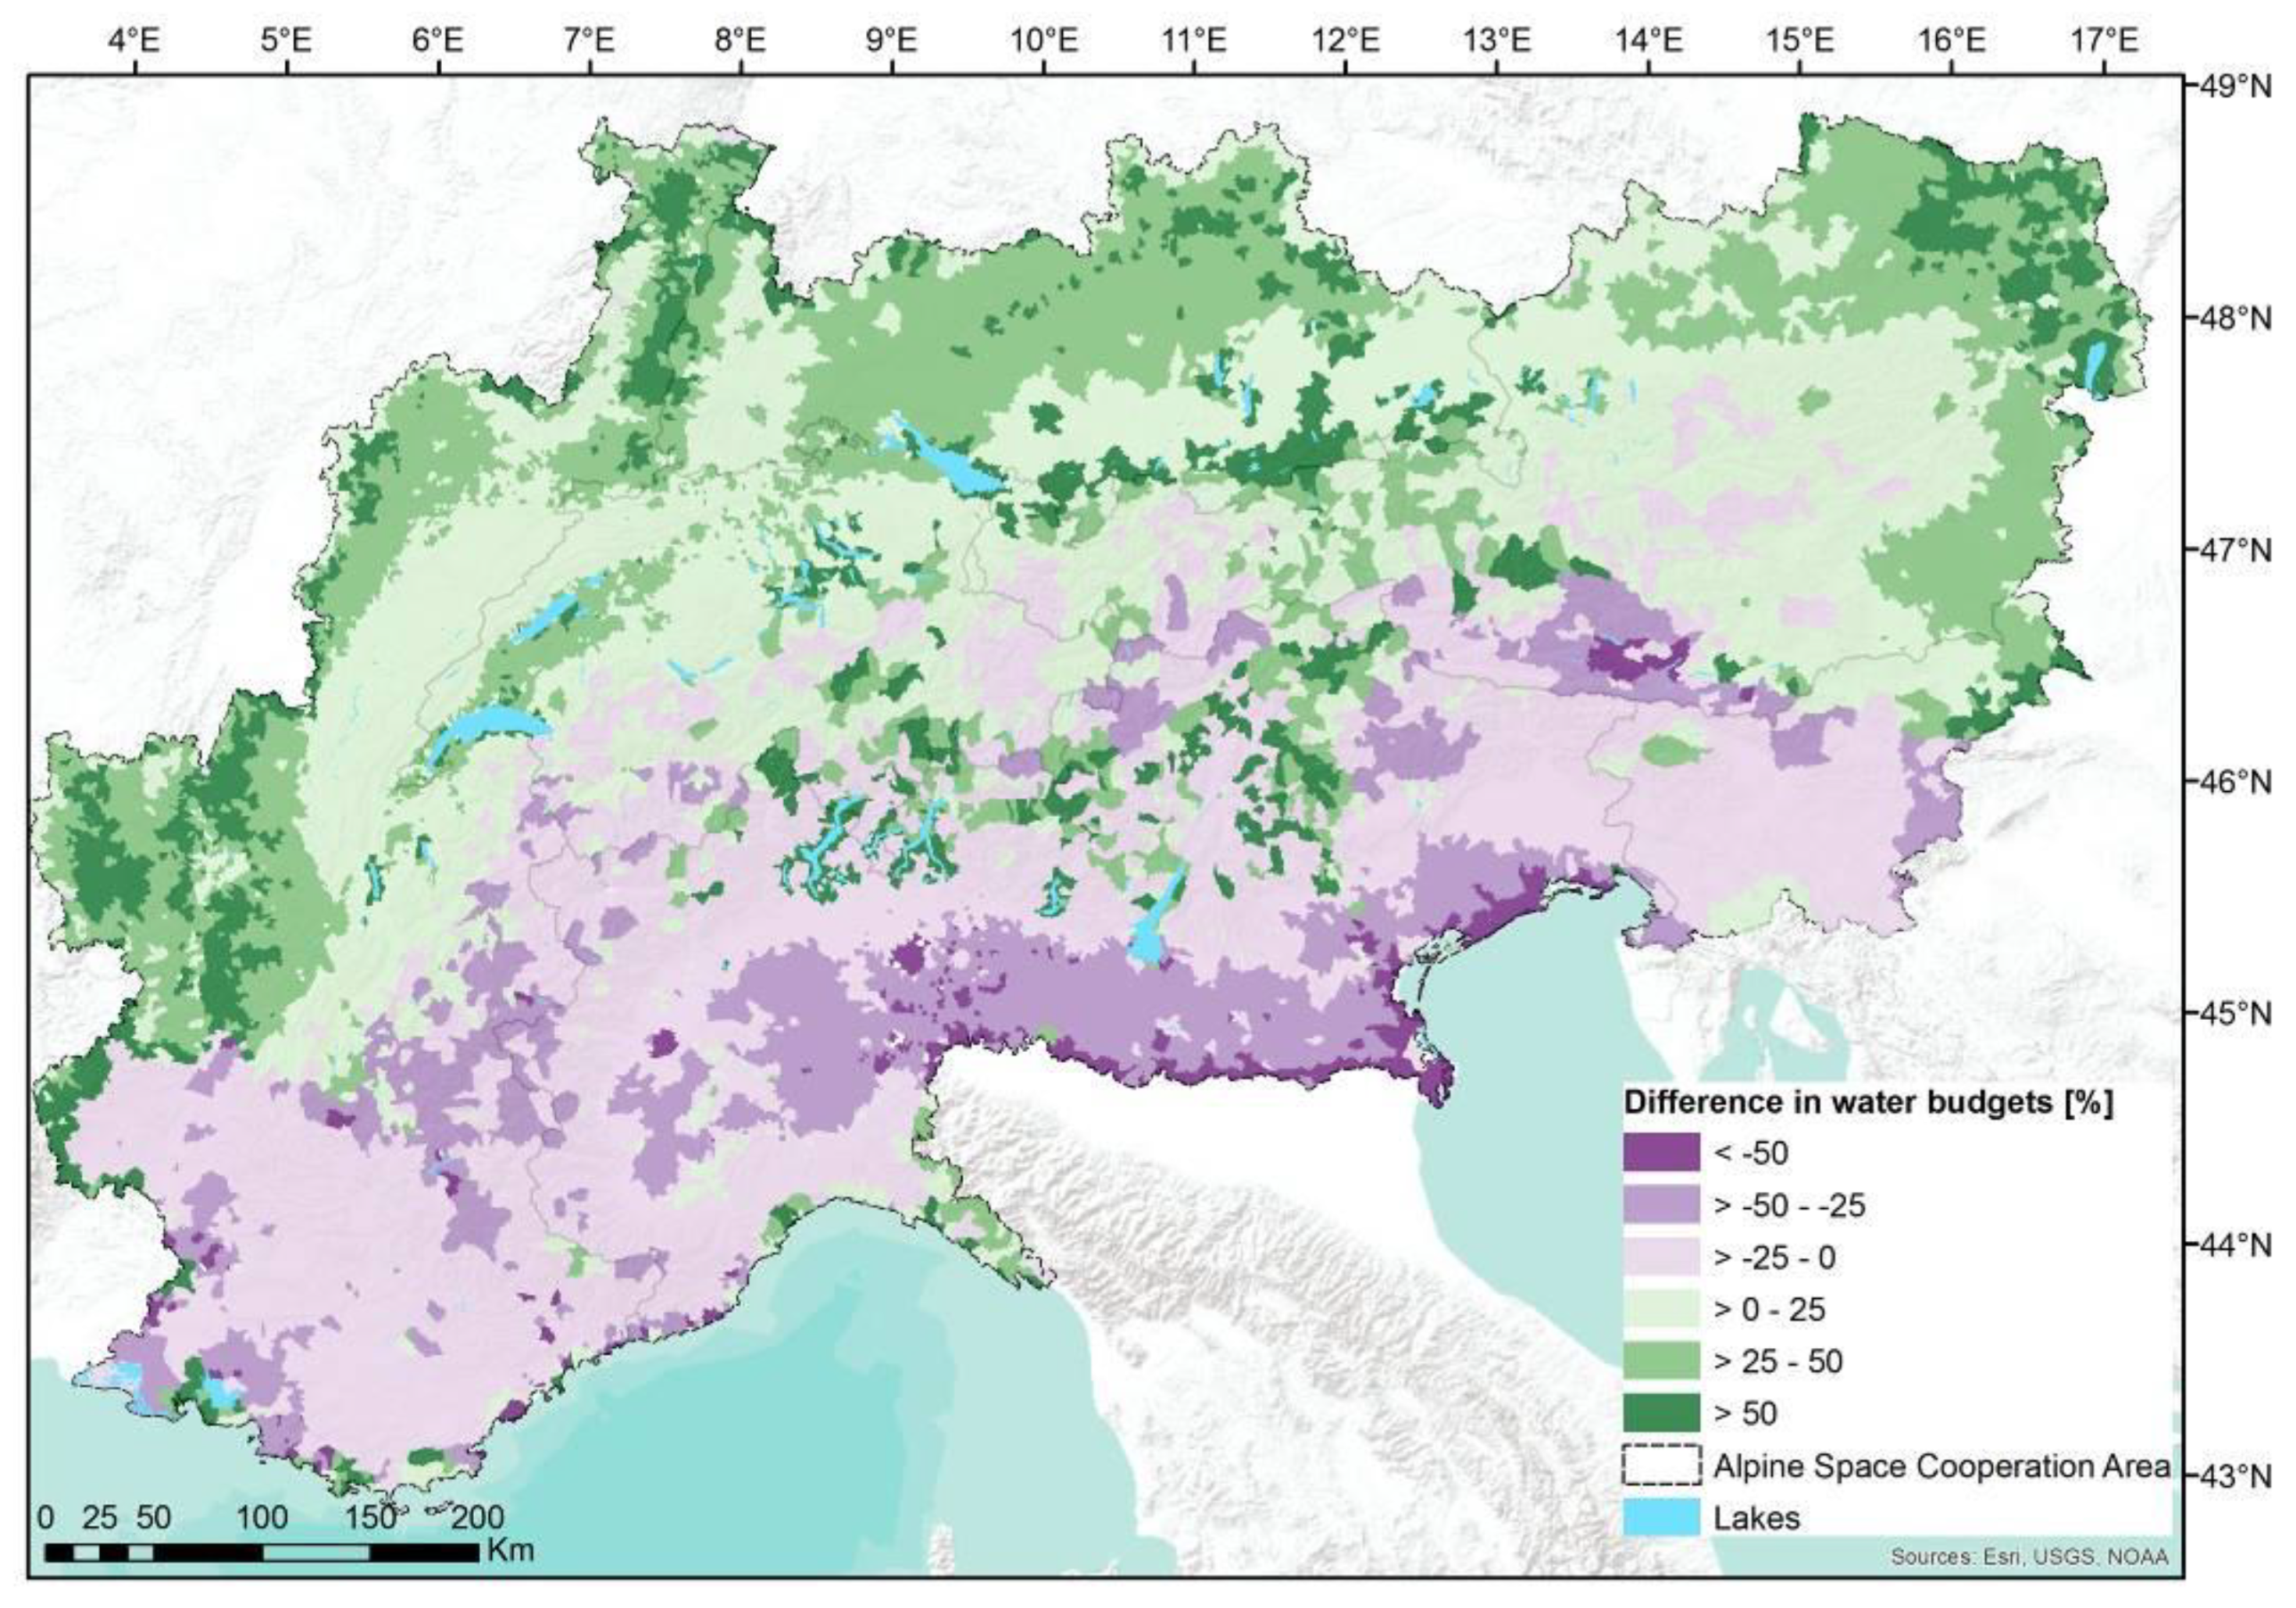
Under the assumed scenarios, the north-south discrepancy of the rainfall pattern becomes apparent, increasing water stress in the south while potentially soothing water stress in the north (Figure 5). Water yield in the north will increase but decrease in the south. Additionally, the increased water demand of the urban population will lead to increasing water stress of the southern lowlands. In contrast, northeastern cities like Munich and Vienna are potentially decreasing water stress, not considering issues of water quality. In summary, it becomes apparent that under the assumed scenario the southern water stress issues worsen while the northern water stress could potentially be limited.
4. Discussion
4.1. Spatial Dependencies of Freshwater and Future Trends
In line with other studies [1,2,3,6], our results emphasise the importance of mountain areas in the supply of freshwater not only for the local population but especially for the people in the surrounding lowland regions. As such, the biggest agglomerations such as Vienna, Milan, Marseille, and Munich, are dependent on the water supply and, hence, vulnerable to change in water resources quantity and maybe water quality in the European Alps. This dependency has huge management implications, ranging from the local to the cross-national level; i.e. in mountainous municipalities, ecosystems need to be managed in a sustainable way to assure the long-term provision of freshwater also of the whole watershed that may extent over more than one country. This is of particular importance in the light of climate change [2]. To meet the water demands of the urbanised areas in the lowlands, managers operate the distribution of the water at regional scales [6]. Moreover, the Alps extent over several countries, thus national water management strategies need to be optimally concerted internationally, as transboundary policies and frameworks can strengthen future water provision [61].
At the current situation, important quantitative freshwater depletions are not to be expected on an annual time scale. When considering future climate changes in the next 100 years, the situation of water availability is likely to deteriorate and sustainable water management is required to avoid socio-economic conflicts and scarcity situations [4,19,62]. By including scenarios of demographic and environmental change, the presented approach can act as a powerful tool to assess future trends in water supply and demand. In line with other studies [7,9,17,19], our results suggest that in the southern parts of the European Alps water stress will be an increasing issue, while the northern parts are less likely affected by water scarcity. Despite increasing pressure on freshwater provision for domestic use, water scarcity has wide-ranging impacts on agriculture and industry [4,19,63] and affects many other ES, which are related to the availability of precipitation or stored water, such as erosion control, forage production, flood mitigation [9,25]. These ES are not only influenced by the total amount of available water, but they are greatly affected by the intensity of extreme events that are likely to occur more often and with higher intensity in the future [64].
4.2. Methodological Considerations
The proposed method facilitates a transboundary comparison between supply and demand of freshwater, enabling the analysis of potential impacts of increased social demand as well as negative effects on ecosystems [65]. By processing openly available information with InVEST and R, we were able to derive inherent knowledge from freely available information. As water managers need to fully grasp the impacts of a large range of decisions on water, they need specific tools that simplify the communication across a large range of disciplines. The balanced combination of administrative capacity and specialized expertise supports advancing the sustainable management of water resources and interdisciplinary approaches displaying ecological, economic and social aspects of the information improve the overarching communication with different stakeholders [8]. The approach is particularly suitable for scenario assessment, including climate variations as demonstrated in this study. Disentangling the water system into supply and demand components in a spatially delineated way allows management to quickly assess potential impacts on the delivery of ES for the water-depending population. Thus, the resulting maps, visualising complex interactions, are highly important as a supporting tool in sustainability assessments and integrative planning [21]. Furthermore, this approach allows for comparability with other ES. In future studies, the mapping and assessment of multiple ES in the supply and demand concept, enables an integrative assessment of mismatches between ES and management options [27,66]. For example, it can be assumed that large parts of the European Alps have a larger positive influence on the nexus with more ES, than only the water-related ones [27]. Alpine ecosystems play a significant part in the area and can, for example, positively influence cultural values also of the lowlands [48,67].
However, there are several limitations that should be addressed in future research and for more specific analyses. Although the annual assessment of water supply in our approach guarantees the comparability with the water demand, the temporal resolution for the water supply model might in some regions not be sufficient for ecological considerations as pointed out by Hallouin et al. [65]; for example, to assess the occurrence of drought events and water scarcity in the European Alps, which is often restricted to short time periods and small distinct areas, in particular in the southern and southeastern parts of the Alpine range [6]. Furthermore, the complexity of the terrain raises uncertainties in daily or monthly streamflow models, increasing the demand for computational resources, and thus challenging the utility for water resources managers [33]. Like the majority of precipitation runoff models [68], the InVEST water yield model does not include glacier melt. Although periods of glacier mass loss can lead to increased glacier runoff in the short- to midterm and effects of glacier shrinkage are extremely variable depending on the degree of current glaciation, in highly glaciered catchments this may result in a reduction of the annual runoff volumes of up to 40% by the end of the century [69].
Given the large spatial extent and the transnational setting of the Alpine Space area, we defined parameter sets for four major climatic regions and consolidated the water supply model to the municipality level allowing the direct comparison with the water demand. Nonetheless, limitations exist for in-depth analysis below municipality level. Guswa et al. [70] argued that for impact studies of land management on water resources, the hydrological model needs to be able to include this heterogeneity. The accurate representation of the spatial distribution from water use to water supply and abstraction site by means of water stream routes and water pipes is not possible at a scale other than local. However, at the transnational scale, this task represents a research gap that would need to be filled by installing international databases. Consequently, the results here need to be used with caution, as the produced maps might mask the complexity of underlying processes [71].
For assessing future impacts, we could not include LULC scenarios, but future assessments, especially on long-term effects, should consider these changes, as vegetation generally plays a significant and dynamic role in determining catchment evapotranspiration [72]. Consequently, the hydrological regime will be affected. Siriwardena et al. [73] showed that past LULC changes increased the annual runoff by approximately 40% when forest vegetation was reduced from 83% to 38% of the total area in a large catchment in Central Queensland, Australia. However, expected LULC changes for the Alpine Space area until 2100 are much smaller. LULC changes during the last century consisted mainly in the abandonment of alpine grassland and subsequent but slow reforestation [74,75]. Although natural reforestation processes have already led to an increase in forest area and past LULC changes will have further effects in the future [76,77], differences in evapotranspiration by changed vegetation are often masked by other major climate driven factors such as snowmelt and increased glacier discharge [56]. Moreover, future LULC changes are expected to be of minor magnitude compared to past dynamics in many parts of the European Alps [78,79,80]. Climate change may also alter the spatial distribution of LULC leading, for example, to an upshift of the treeline, however, a significant increase in forest area due to temperature changes will take up to 700–800 years [76].
Water availability is not only a matter of water quantity but also of water quality, and many development countries have water scarcity problems not because of quantity but rather due to insufficient water quality [81]. Here, water quality is not being accounted for; the lack of available data for calibrating a pollutant transport model at this scale dissuaded us from including the quality element in the analysis even though potentially having a large impact on water resource availability. This might overestimate water supply if parts of the water mapped as available might actually be below quality standards for freshwater. However, important lessons might be learned, for example that growing water demand might be a bigger challenge than decreasing water availability. As such, it could be shown that a demand and supply approach with regional water coordination efforts and transfer solutions could potentially mitigate climate change impacts in water-sensitive regions of the Alps.
Previous literature emphasised the difficulties of assessing water demand across boundaries due to discrepancies in the definition of household water demand or uncertainties in the definition of related indicators [82], and no datasets exists for single households [22]. Water is provided in a decentralised manner and often data on water supply and network losses are not openly shared [22]. Therefore, we downscaled the water demand from regional datasets. Nevertheless, data on water abstraction rates and consumption should become more accessible to overcome and improve the management of water resources.
5. Conclusions
We were able to show an effective approach to visualize water supply, demand and de facto use in a spatially explicit manner. Our results can support the implementation of spatially explicit, basin-wide practices, in order to conserve and use water more efficiently in an integrated approach. As such, we demonstrate that with simple means and freely available tools and data, it is possible to develop water budgets on large scales. One of the main advantages is that with only three maps a cross-boundary assessment and linked effects can be visualized. Through open-data collection we improved basic knowledge of the whole system which supports decision-makers on adaption management. Integrated water management needs strategies that go beyond country boundaries to be effective. On a transnational scale, our results indicate where sources and main water-consuming areas are located. This allows, through an easy and quick visual assessment, the evaluation of the spatial variability for water management. Cross-sectoral considerations, ES, pressures from land use, transfer efforts, and through this, nature conservation and land cover management can thus be coordinated in a climate change adaptation effort.
Future research needs to account for the water usage of industry and agriculture, as these sectors are major consumers. The seasonal differences in supply might need to be combined with seasonal changes in demand. Lastly, the spatial mapping approaches would greatly profit if they could be represented on several scales, including also a finer resolution and smaller extent, to enhance practical management at the farm or landscape scale.
Author Contributions
Data curation, C.M. and L.H.; Formal analysis, C.M. and L.H.; Funding acquisition, U.T.; Methodology, C.M., J.R. and U.T.; Software, C.M.; Supervision, J.R. and U.T.; Validation, C.M.; Visualization, C.M.; Writing—original draft, U.S. and J.R.; Writing—review and editing, U.S., L.H., J.R. and U.T.
Funding
This research was co-financed by the European Regional Development Fund through the Interreg Alpine Space programme (“AlpES” project, CUP: D52I16000220007) and the Austrian Federal Ministry of Science, Research and Economy with the HRSM–cooperation project KLIMAGRO.
Acknowledgments
J.R. and U.T. are part of the Interdisciplinary Research Center ‘Ecology of the Alpine Region’ within the major research focus ‘Alpine Space’ at the University of Innsbruck.
Conflicts of Interest
The authors declare no conflict of interest.
Appendix A
Figure A1.
Alpine Space area of Alpine countries, topographic complexity and the main four climatic regions: (a) northwest, (b) northeast, (c) southwest and (d) southeast.
Figure A1.
Alpine Space area of Alpine countries, topographic complexity and the main four climatic regions: (a) northwest, (b) northeast, (c) southwest and (d) southeast.
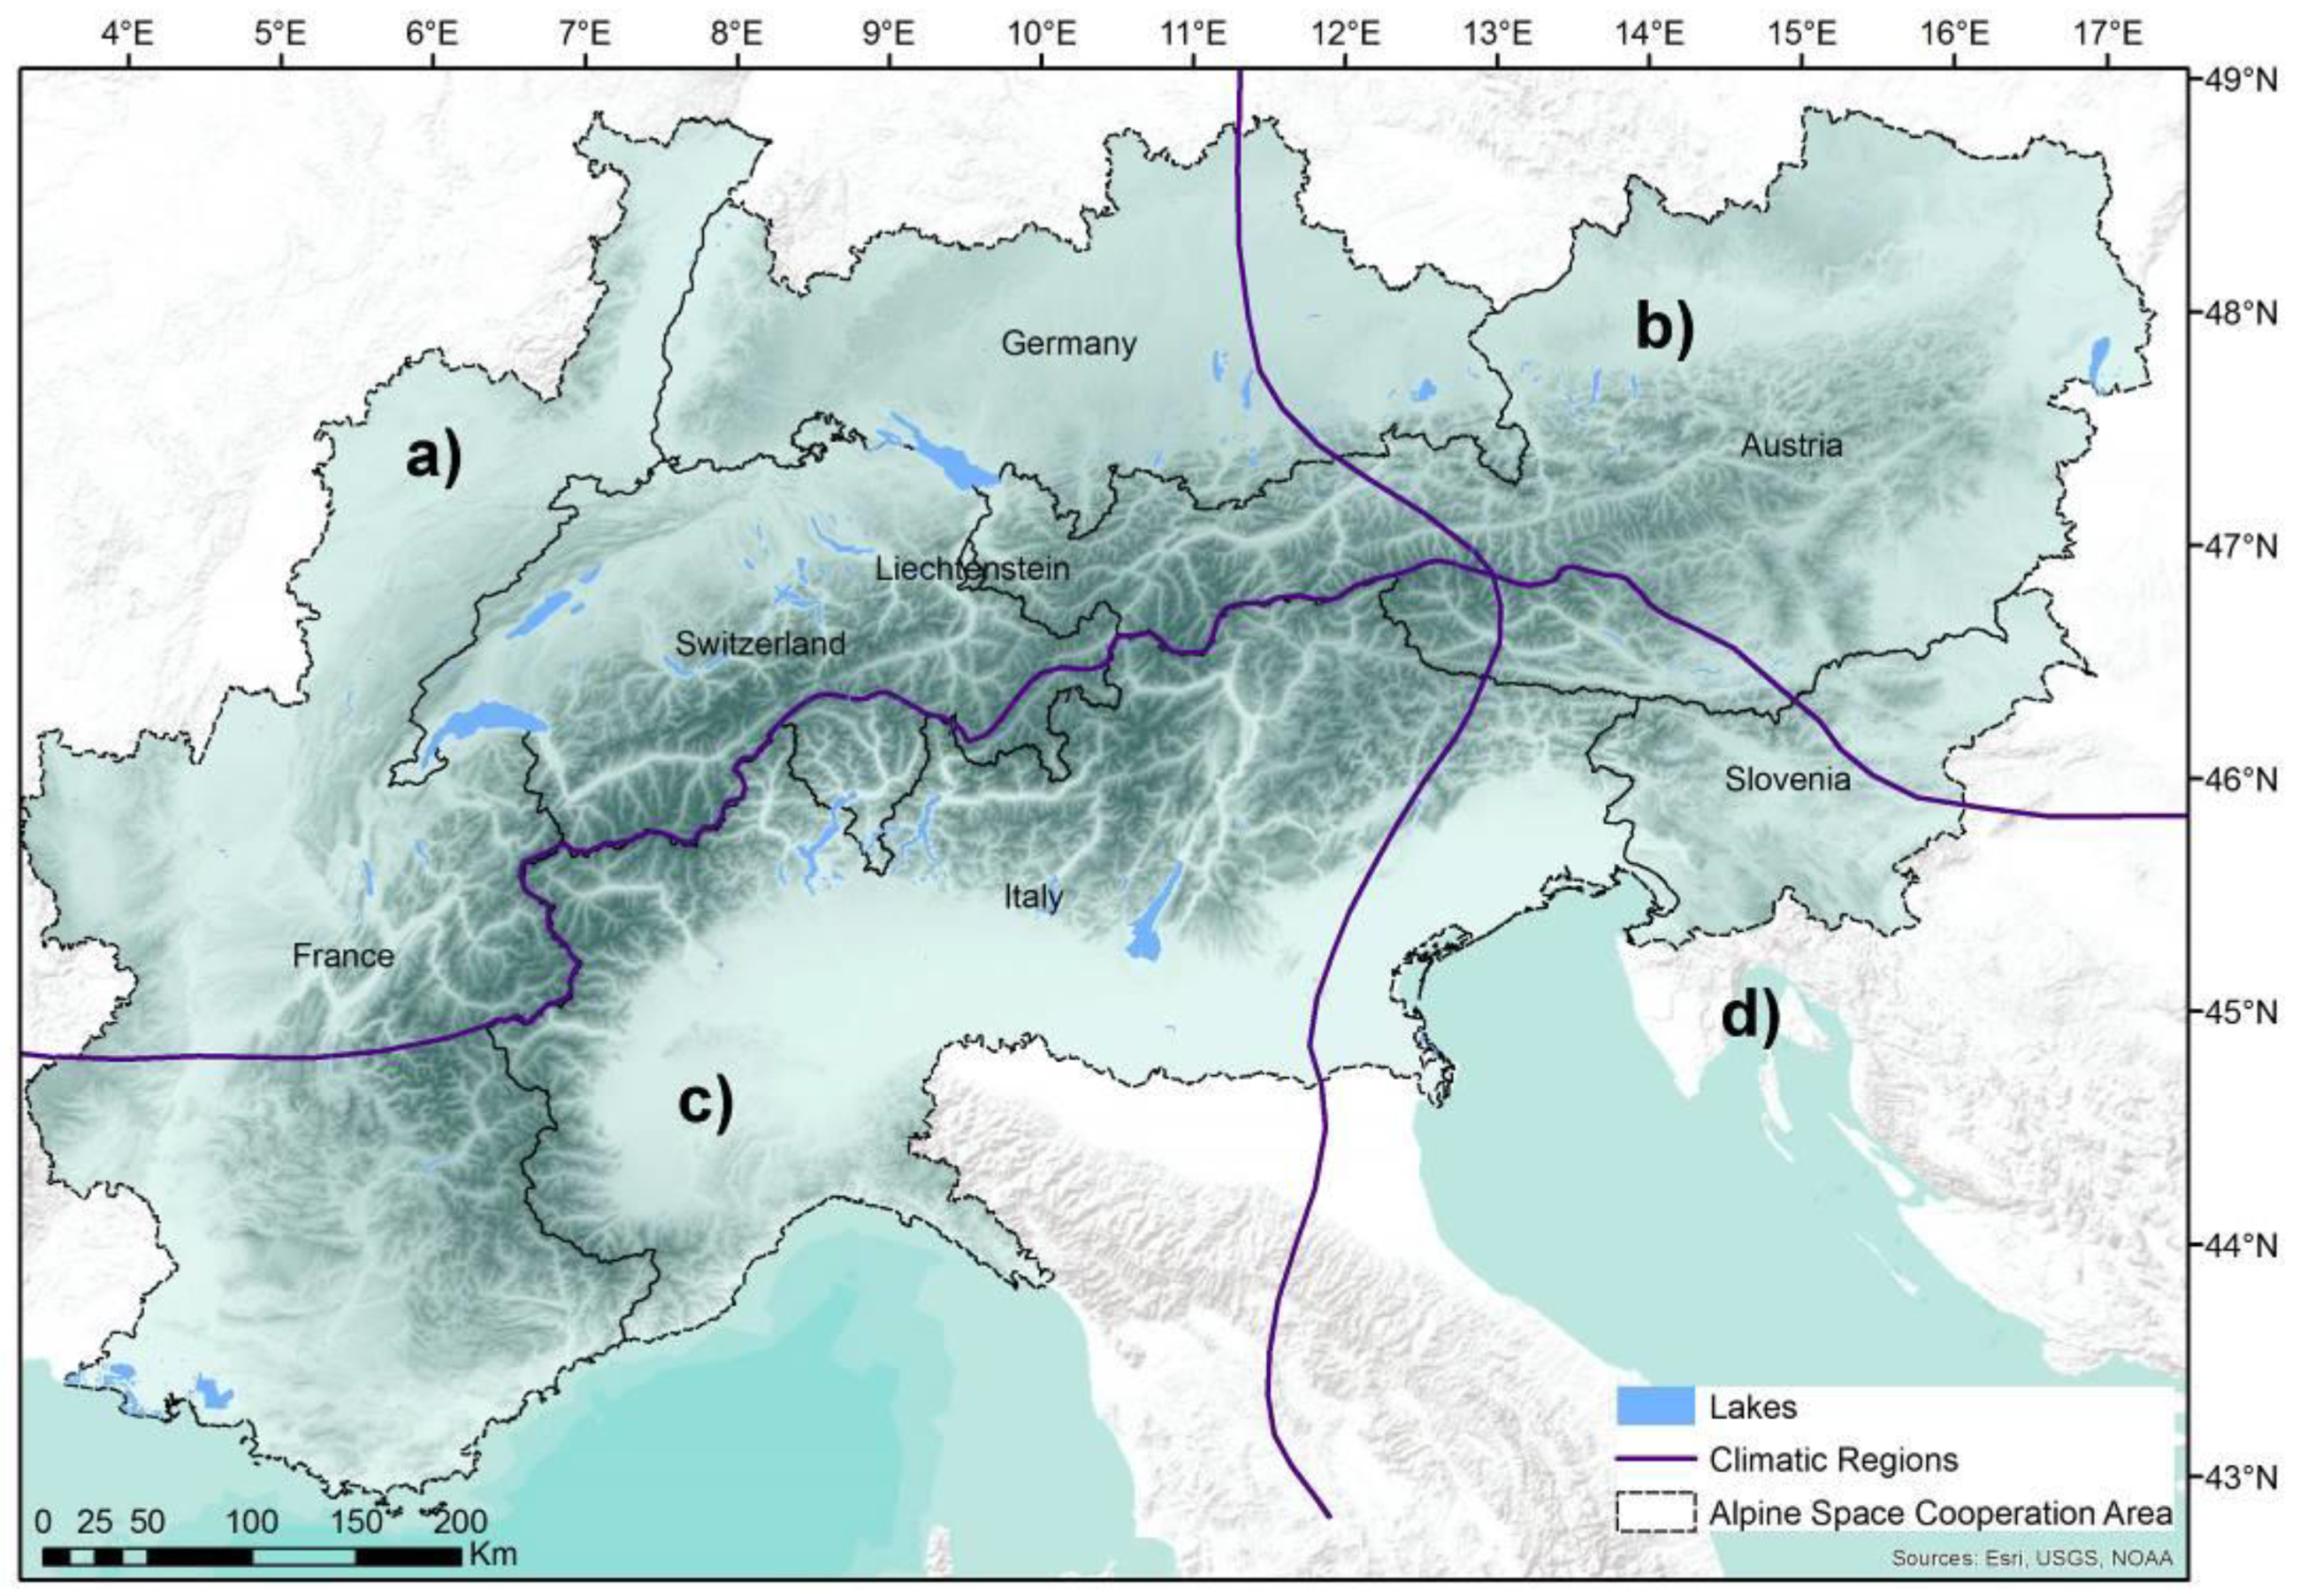
Figure A2.
Probability distribution function of relative water yield of municipalities within and outside the European Alps.
Figure A2.
Probability distribution function of relative water yield of municipalities within and outside the European Alps.

References
- Grêt-Regamey, A.; Brunner, S.H.; Kienast, F. Mountain ecosystem services: Who cares? Mt. Res. Dev. 2012, 32. [Google Scholar] [CrossRef]
- Viviroli, D.; Archer, D.R.; Buytaert, W.; Fowler, H.J.; Greenwood, G.; Hamlet, A.F.; Huang, Y.; Koboltschnig, G.; Litaor, I.; López-Moreno, J.I. Climate change and mountain water resources: Overview and recommendations for research, management and policy. Hydrol. Earth Syst. Sci. 2011, 15, 471–504. [Google Scholar] [CrossRef]
- Barnett, T.P.; Adam, J.C.; Lettenmaier, D.P. Potential impacts of a warming climate on water availability in snow-dominated regions. Nature 2005, 438, 303. [Google Scholar] [CrossRef]
- Fuhrer, J.; Smith, P.; Gobiet, A. Implications of climate change scenarios for agriculture in alpine regions—A case study in the Swiss Rhone catchment. Sci. Total Environ. 2014, 493, 1232–1241. [Google Scholar] [CrossRef]
- Martin-Ortega, J.; Ferrier, R.C.; Gordon, I.J.; Khan, S. Water Ecosystem Services: A Global Perspective; UNESCO Publishing: Paris, France, 2015. [Google Scholar]
- Permanent Secretariat of the Alpine Convention (Ed.) Water and Water Management Issues. Report on the State of the Alps: Alpine Convention: Summary; (Alpine Signals. Special Edition 2); Permanent Secretariat of the Alpine Convention: Bolzano, Italy, 2009. [Google Scholar]
- Beniston, M.; Stoffel, M.; Hill, M. Impacts of climatic change on water and natural hazards in the Alps: Can current water governance cope with future challenges? Examples from the European “ACQWA” project. Environ. Sci. Policy 2011, 14, 734–743. [Google Scholar] [CrossRef] [Green Version]
- Anzaldua, G.; Gerner, N.V.; Lago, M.; Abhold, K.; Hinzmann, M.; Beyer, S.; Winking, C.; Riegels, N.; Jensen, J.K.; Termes, M. Getting into the water with the Ecosystem Services Approach: The DESSIN ESS evaluation framework. Ecosyst. Serv. 2018, 30, 318–326. [Google Scholar] [CrossRef]
- Jorda-Capdevila, D.; Gampe, D.; Huber García, V.; Ludwig, R.; Sabater, S.; Vergoñós, L.; Acuña, V. Impact and mitigation of global change on freshwater-related ecosystem services in Southern Europe. Sci. Total Environ. 2019, 651, 895–908. [Google Scholar] [CrossRef]
- Millennium Ecosystem Assessment. Ecosystems and Human Well-Being: Synthesis; Island Press: Washington, DC, USA, 2005; p. 137. [Google Scholar]
- Kremen, C. Managing ecosystem services: What do we need to know about their ecology? Ecol. Lett. 2005, 8, 468–479. [Google Scholar] [CrossRef]
- Burkhard, B.; Kroll, F.; Nedkov, S.; Müller, F. Mapping ecosystem service supply, demand and budgets. Ecol. Ind. 2012, 21, 17–29. [Google Scholar] [CrossRef]
- Andrew, M.E.; Wulder, M.A.; Nelson, T.A.; Coops, N.C. Spatial data, analysis approaches, and information needs for spatial ecosystem service assessments: A review. GISci. Remote Sens. 2015, 52, 344–373. [Google Scholar] [CrossRef]
- Beniston, M. Mountain weather and climate: A general overview and a focus on climatic change in the Alps. Hydrobiologia 2006, 562, 3–16. [Google Scholar] [CrossRef]
- Grizzetti, B.; Lanzanova, D.; Liquete, C.; Reynaud, A.; Cardoso, A. Assessing water ecosystem services for water resource management. Environ. Sci. Policy 2016, 61, 194–203. [Google Scholar] [CrossRef] [Green Version]
- Hackbart, V.C.; de Lima, G.T.; dos Santos, R.F. Theory and practice of water ecosystem services valuation: Where are we going? Ecosyst. Serv. 2017, 23, 218–227. [Google Scholar] [CrossRef]
- European Environment Agency. Water Resources Across Europe. Confronting Water Scarcity and Drought; (EEA Report, 2/2009); European Environment Agency: Luxembourg; Copenhagen, Denmark, 2009. [Google Scholar]
- Weingartner, R. MontanAqua: Wasserbewirtschaftung in Zeiten von Knappheit und Globalem Wandel. Wasserbewirtschaftungsoptionen für die Region Crans-Montana-Sierre im Wallis: Forschungsbericht des Nationalen Forschungsprogramms NFP 61; Schweizerischer Nationalfonds: Bern, Switzerland, 2014. [Google Scholar]
- Kumar, V.; Del Vasto-Terrientes, L.; Valls, A.; Schuhmacher, M. Adaptation strategies for water supply management in a drought prone Mediterranean river basin: Application of outranking method. Sci. Total Environ. 2016, 540, 344–357. [Google Scholar] [CrossRef] [PubMed]
- Geijzendorffer, I.R.; Martín-López, B.; Roche, P.K. Improving the identification of mismatches in ecosystem services assessments. Ecol. Ind. 2015, 52, 320–331. [Google Scholar] [CrossRef]
- Syrbe, R.; Grunewald, K. Ecosystem service supply and demand–the challenge to balance spatial mismatches. Int. J. Biodivers. Sci. Ecosyst. Serv. Manag. 2017, 13, 148–161. [Google Scholar] [CrossRef]
- Klug, H.; Dabiri, Z.; Hochwimmer, B.; Zalavari, P. Assessing drinking water consumption by inhabitants and tourists in the Alps using a WebGIS for information distribution. Int. J. Biodivers. Sci. Ecosyst. Serv. Manag. 2012, 8, 50–70. [Google Scholar] [CrossRef]
- European Environment Agency. Regional Climate Change and Adaptation. The Alps Facing the Challenge of Changing Water Resources; (EEA Report, 8/2009); European Environment Agency: Luxembourg; Copenhagen, Denmark, 2009. [Google Scholar]
- Karabulut, A.; Egoh, B.N.; Lanzanova, D.; Grizzetti, B.; Bidoglio, G.; Pagliero, L.; Bouraoui, F.; Aloe, A.; Reynaud, A.; Maes, J.; et al. Mapping water provisioning services to support the ecosystem–water–food–energy nexus in the Danube river basin. Ecosyst. Serv. 2016, 17, 278–292. [Google Scholar] [CrossRef] [Green Version]
- Leitinger, G.; Ruggenthaler, R.; Hammerle, A.; Lavorel, S.; Schirpke, U.; Clement, J.; Lamarque, P.; Obojes, N.; Tappeiner, U. Impact of droughts on water provision in managed alpine grasslands in two climatically different regions of the Alps. Ecohydrology 2015, 8, 1600–1613. [Google Scholar] [CrossRef] [Green Version]
- What Is the Alpine Space Programme? Available online: https://www.alpine-space.eu/about/the-programme/what-is-the-alpine-space-programme (accessed on 1 July 2019).
- Schirpke, U.; Candiago, S.; Egarter Vigl, L.; Jäger, H.; Labadini, A.; Marsoner, T.; Meisch, C.; Tasser, E.; Tappeiner, U. Integrating supply, flow and demand to enhance the understanding of interactions among multiple ecosystem services. Sci. Total Environ. 2019, 651, 928–941. [Google Scholar] [CrossRef]
- Auer, I.; Böhm, R.; Jurkovic, A.; Lipa, W.; Orlik, A.; Potzmann, R.; Schöner, W.; Ungersböck, M.; Matulla, C.; Briffa, K. HISTALP—Historical instrumental climatological surface time series of the Greater Alpine Region. Int. J. Climatol. 2007, 27, 17–46. [Google Scholar] [CrossRef]
- Burkhard, B.; Kandziora, M.; Hou, Y.; Müller, F. Ecosystem service potentials, flows and demands–concepts for spatial localization, indication and quantification. Landsc. Online 2014, 34, 1–32. [Google Scholar] [CrossRef]
- Sharp, R.; Tallis, H.T.; Ricketts, T.; Guerry, A.D.; Wood, S.A.; Chaplin-Kramer, R.; Nelson, E.; Ennaanay, D.; Wolny, S.; Olwero, N.; et al. InVEST 3.5.0.post356+n4e98368ac2f6 User’s Guide; The Natural Capital Project; Stanford University, University of Minnesota, The Nature Conservancy, and World Wildlife Fund: Minneapolis, MN, USA, 2018. [Google Scholar]
- Malinga, R.; Gordon, L.J.; Jewitt, G.; Lindborg, R. Mapping ecosystem services across scales and continents—A review. Ecosyst. Serv. 2015, 13, 57–63. [Google Scholar] [CrossRef]
- Dennedy-Frank, P.J.; Muenich, R.L.; Chaubey, I.; Ziv, G. Comparing two tools for ecosystem service assessments regarding water resources decisions. J. Environ. Manag. 2016, 177, 331–340. [Google Scholar] [CrossRef] [PubMed] [Green Version]
- Redhead, J.W.; Stratford, C.; Sharps, K.; Jones, L.; Ziv, G.; Clarke, D.; Oliver, T.H.; Bullock, J.M. Empirical validation of the InVEST water yield ecosystem service model at a national scale. Sci. Total Environ. 2016, 569–570, 1418–1426. [Google Scholar] [CrossRef] [PubMed]
- Arora, V.K. The use of the aridity index to assess climate change effect on annual runoff. J. Hydrol. 2002, 265, 164–177. [Google Scholar] [CrossRef]
- Gerrits, A.; Savenije, H.; Veling, E.; Pfister, L. Analytical derivation of the Budyko curve based on rainfall characteristics and a simple evaporation model. Water Resour. Res. 2009, 45. [Google Scholar] [CrossRef]
- Beck, H.E. A Global Map of Mean Annual Runoff based on Discharge Observations from Large Catchments; European Commission, Joint Research Centre: Ispra, Italy, 2016. [Google Scholar]
- Beck, H.E.; De Roo, A.; van Dijk, A.I. Global maps of streamflow characteristics based on observations from several thousand catchments. J. Hydrometeorol. 2015, 16, 1478–1501. [Google Scholar] [CrossRef]
- Ganguly, S.; Nemani, R.R.; Zhang, G.; Hashimoto, H.; Milesi, C.; Michaelis, A.; Wang, W.; Votava, P.; Samanta, A.; Melton, F.; et al. Generating global Leaf Area Index from Landsat: Algorithm formulation and demonstration. Remote Sens. Environ. 2012, 122, 185–202. [Google Scholar] [CrossRef]
- Allen, R.G.; Pereira, L.S.; Raes, D.; Smith, M. Crop evapotranspiration-Guidelines for computing crop water requirements-FAO Irrigation and drainage paper 56. FAO Rome 1998, 300, D05109. [Google Scholar]
- Hamel, P.; Guswa, A.J. Uncertainty analysis of a spatially explicit annual water-balance model: Case study of the Cape Fear basin, North Carolina. Hydrol. Earth Syst. Sci. 2015, 19, 839–853. [Google Scholar] [CrossRef]
- Panagos, P.; Borrelli, P.; Poesen, J.; Ballabio, C.; Lugato, E.; Meusburger, K.; Montanarella, L.; Alewell, C. The new assessment of soil loss by water erosion in Europe. Environ. Sci. Policy 2015, 54, 438–447. [Google Scholar] [CrossRef] [Green Version]
- Friedl, M.A.; Sulla-Menashe, D.; Tan, B.; Schneider, A.; Ramankutty, N.; Sibley, A.; Huang, X. MODIS Collection 5 global land cover: Algorithm refinements and characterization of new datasets. Remote Sens. Environ. 2010, 114, 168–182. [Google Scholar] [CrossRef]
- Zomer, R.J.; Trabucco, A.; Bossio, D.A.; Verchot, L.V. Climate change mitigation: A spatial analysis of global land suitability for clean development mechanism afforestation and reforestation. Agric. Ecosyst. Environ. 2008, 126, 67–80. [Google Scholar] [CrossRef]
- Lehner, B.; Grill, G. Global river hydrography and network routing: Baseline data and new approaches to study the world’s large river systems. Hydrol. Process. 2013, 27, 2171–2186. [Google Scholar] [CrossRef]
- Wolff, S.; Schulp, C.; Verburg, P. Mapping ecosystem services demand: A review of current research and future perspectives. Ecol. Ind. 2015, 55, 159–171. [Google Scholar] [CrossRef]
- Water Statistics on National and Subnational Level. Available online: https://ec.europa.eu/eurostat/web/environment/water/database (accessed on 1 April 2019).
- NUTS (Nomenclature of Territorial Units for Statistics). Available online: https://ec.europa.eu/eurostat/web/nuts/background (accessed on 1 April 2019).
- Schirpke, U.; Meisch, C.; Marsoner, T.; Tappeiner, U. Revealing spatial and temporal patterns of outdoor recreation in the European Alps and their surroundings. Ecosyst. Serv. 2018, 31, 336–350. [Google Scholar] [CrossRef]
- Roca, Z. Second Home Tourism in Europe: Lifestyle Issues and Policy Responses; Routledge: London, UK, 2016. [Google Scholar]
- Lahti, L.; Huovari, J.; Kainu, M.; Biecek, P. Retrieval and analysis of Eurostat open data with the eurostat package. Version 3.1.5. R J. 2017, 9, 385–392. [Google Scholar]
- Trinkwasserverbrauch Schweiz. Available online: https://www.bfs.admin.ch/bfs/de/home/statistiken/raum-umwelt/ressourcen/umweltindikatorensystem/nutzung-natuerliche-ressourcen/trinkwasserverbrauch.html (accessed on 1 April 2019).
- Beniston, M. Mountain Climates and Climatic Change: An Overview of Processes Focusing on the European Alps. Pure Appl. Geophys. 2005, 162, 1587–1606. [Google Scholar] [CrossRef] [Green Version]
- Gobiet, A.; Kotlarski, S.; Beniston, M.; Heinrich, G.; Rajczak, J.; Stoffel, M. 21st century climate change in the European Alps—A review. Sci. Total Environ. 2014, 493, 1138–1151. [Google Scholar] [CrossRef] [PubMed] [Green Version]
- Jacob, D.; Petersen, J.; Eggert, B.; Alias, A.; Christensen, O.B.; Bouwer, L.M.; Braun, A.; Colette, A.; Déqué, M.; Georgievski, G. EURO-CORDEX: New high-resolution climate change projections for European impact research. Reg. Environ. Chang. 2014, 14, 563–578. [Google Scholar] [CrossRef]
- Heinrich, G.; Gobiet, A.; Truhetz, H.; Mendlik, T. Expected Climate Change and Its Uncertainty in the Alpine Region. Extended Uncertainty Assessment of the Reclip: Century and ENSEMBLES Multi-Model Dataset; Scientific Report No. 50-2013; Wegener Center Verlag Graz: Graz, Austria, 2013. [Google Scholar]
- Alaoui, A.; Willimann, E.; Jasper, K.; Felder, G.; Herger, F.; Magnusson, J.; Weingartner, R. Modelling the effects of land use and climate changes on hydrology in the Ursern Valley, Switzerland. Hydrol. Process. 2014, 28, 3602–3614. [Google Scholar] [CrossRef]
- Fatichi, S.; Zeeman, M.J.; Fuhrer, J.; Burlando, P. Ecohydrological effects of management on subalpine grasslands: From local to catchment scale. Water Resour. Res. 2014, 50, 148–164. [Google Scholar] [CrossRef] [Green Version]
- Population Projections. Available online: https://ec.europa.eu/eurostat/web/products-datasets/product?code=tps00002 (accessed on 4 April 2019).
- Getis, A.; Ord, J.K. The analysis of spatial association by use of distance statistics. Geogr. Anal. 1992, 24, 189–206. [Google Scholar] [CrossRef]
- Ord, J.K.; Getis, A. Local Spatial Autocorrelation Statistics: Distributional Issues and an Application. Geogr. Anal. 1995, 27, 286–306. [Google Scholar] [CrossRef]
- Vandecasteele, I.; Bianchi, A.; Batista e Silva, F.; Lavalle, C.; Batelaan, O. Mapping current and future European public water withdrawals and consumption. Hydrol. Earth Syst. Sci. 2015, 18, 407–416. [Google Scholar] [CrossRef]
- Bocchiola, D.; Nana, E.; Soncini, A. Impact of climate change scenarios on crop yield and water footprint of maize in the Po valley of Italy. Agric. Water Manag. 2013, 116, 50–61. [Google Scholar] [CrossRef]
- Bangash, R.F.; Passuello, A.; Sanchez-Canales, M.; Terrado, M.; López, A.; Elorza, F.J.; Ziv, G.; Acuña, V.; Schuhmacher, M. Ecosystem services in Mediterranean river basin: Climate change impact on water provisioning and erosion control. Sci. Total Environ. 2013, 458–460, 246–255. [Google Scholar] [CrossRef] [PubMed]
- Köplin, N.; Rößler, O.; Schädler, B.; Weingartner, R. Robust estimates of climate-induced hydrological change in a temperate mountainous region. Clim. Chang. 2014, 122, 171–184. [Google Scholar] [CrossRef]
- Hallouin, T.; Bruen, M.; Christie, M.; Bullock, C.; Kelly-Quinn, M. Challenges in using hydrology and water quality models for assessing freshwater ecosystem services: A review. Geosciences 2018, 8, 45. [Google Scholar] [CrossRef]
- Deng, X.; Li, Z.; Gibson, J. A review on trade-off analysis of ecosystem services for sustainable land-use management. J. Geogr. Sci. 2016, 26, 953–968. [Google Scholar] [CrossRef] [Green Version]
- Schirpke, U.; Meisch, C.; Tappeiner, U. Symbolic species as a cultural ecosystem service in the European Alps: Insights and open issues. Landsc. Ecol. 2018, 33, 711–730. [Google Scholar] [CrossRef]
- Van Beusekom, A.E.; Viger, R.J. A glacier runoff extension to the Precipitation Runoff Modeling System. J. Geophys. Res. Earth Surf. 2016, 121, 2001–2021. [Google Scholar] [CrossRef]
- Hanzer, F.; Förster, K.; Nemec, J.; Strasser, U. Projected cryospheric and hydrological impacts of 21st century climate change in the Ötztal Alps (Austria) simulated using a physically based approach. Hydrol. Earth Syst. Sci. 2018, 22, 1593–1614. [Google Scholar] [CrossRef] [Green Version]
- Guswa, A.J.; Brauman, K.A.; Brown, C.; Hamel, P.; Keeler, B.L.; Sayre, S.S. Ecosystem services: Challenges and opportunities for hydrologic modeling to support decision making. Water Resour. Res. 2014, 50, 4535–4544. [Google Scholar] [CrossRef] [Green Version]
- Hauck, J.; Schweppe-Kraft, B.; Albert, C.; Gorg, C.; Jax, K.; Jensen, R.; Furst, C.; Maes, J.; Ring, I.; Honigova, I. The promise of the ecosystem services concept for planning and decision-making. GAIA-Ecol. Perspect. Sci. Soc. 2013, 22, 232–237. [Google Scholar] [CrossRef]
- Donohue, R.; Roderick, M.; McVicar, T.R. On the importance of including vegetation dynamics in Budyko’s hydrological model. Hydrol. Earth Syst. Sci. Discuss. 2006, 3, 1517–1551. [Google Scholar] [CrossRef]
- Siriwardena, L.; Finlayson, B.L.; McMahon, T.A. The impact of land use change on catchment hydrology in large catchments: The Comet River, Central Queensland, Australia. J. Hydrol. 2006, 326, 199–214. [Google Scholar] [CrossRef]
- Schneeberger, N.; Bürgi, M.; Kienast, F. Rates of landscape change at the northern fringe of the Swiss Alps: Historical and recent tendencies. Landsc. Urban Plan. 2007, 80, 127–136. [Google Scholar] [CrossRef]
- Tasser, E.; Walde, J.; Tappeiner, U.; Teutsch, A.; Noggler, W. Land-use changes and natural reforestation in the Eastern Central Alps. Agric. Ecosyst. Environ. 2007, 118, 115–129. [Google Scholar] [CrossRef]
- Tasser, E.; Leitinger, G.; Tappeiner, U. Climate change versus land-use change—What affects the mountain landscapes more? Land Use Policy 2017, 60, 60–72. [Google Scholar] [CrossRef]
- Bürgi, M.; Östlund, L.; Mladenoff, D.J. Legacy effects of human land use: Ecosystems as time-lagged systems. Ecosystems 2016, 20, 94–103. [Google Scholar] [CrossRef]
- Briner, S.; Elkin, C.; Huber, R. Evaluating the relative impact of climate and economic changes on forest and agricultural ecosystem services in mountain regions. J. Environ. Manag. 2013, 129, 414–422. [Google Scholar] [CrossRef] [PubMed]
- Egarter Vigl, L.; Schirpke, U.; Tasser, E.; Tappeiner, U. Linking long-term landscape dynamics to the multiple interactions among ecosystem services in the European Alps. Landsc. Ecol. 2016, 31, 1903–1918. [Google Scholar] [CrossRef] [Green Version]
- Bürgi, M.; Silbernagel, J.; Wu, J.; Kienast, F. Linking ecosystem services with landscape history. Landsc. Ecol. 2015, 30, 11–20. [Google Scholar] [CrossRef]
- Keeler, B.L.; Polasky, S.; Brauman, K.A.; Johnson, K.A.; Finlay, J.C.; O’Neill, A.; Kovacs, K.; Dalzell, B. Linking water quality and well-being for improved assessment and valuation of ecosystem services. Proc. Natl. Acad. Sci. USA 2012, 109, 18619–18624. [Google Scholar] [CrossRef] [PubMed] [Green Version]
- Reynaud, A. Modelling Household Water Demand in Europe; EUR. Scientific and Technical Research Series, 27310; Publications Office: Luxembourg, 2015. [Google Scholar]
Figure 1.
Spatial distribution of (a) current water supply (classification quantiles –> best similarity with hotspots) and (b) current water demand.
Figure 1.
Spatial distribution of (a) current water supply (classification quantiles –> best similarity with hotspots) and (b) current water demand.
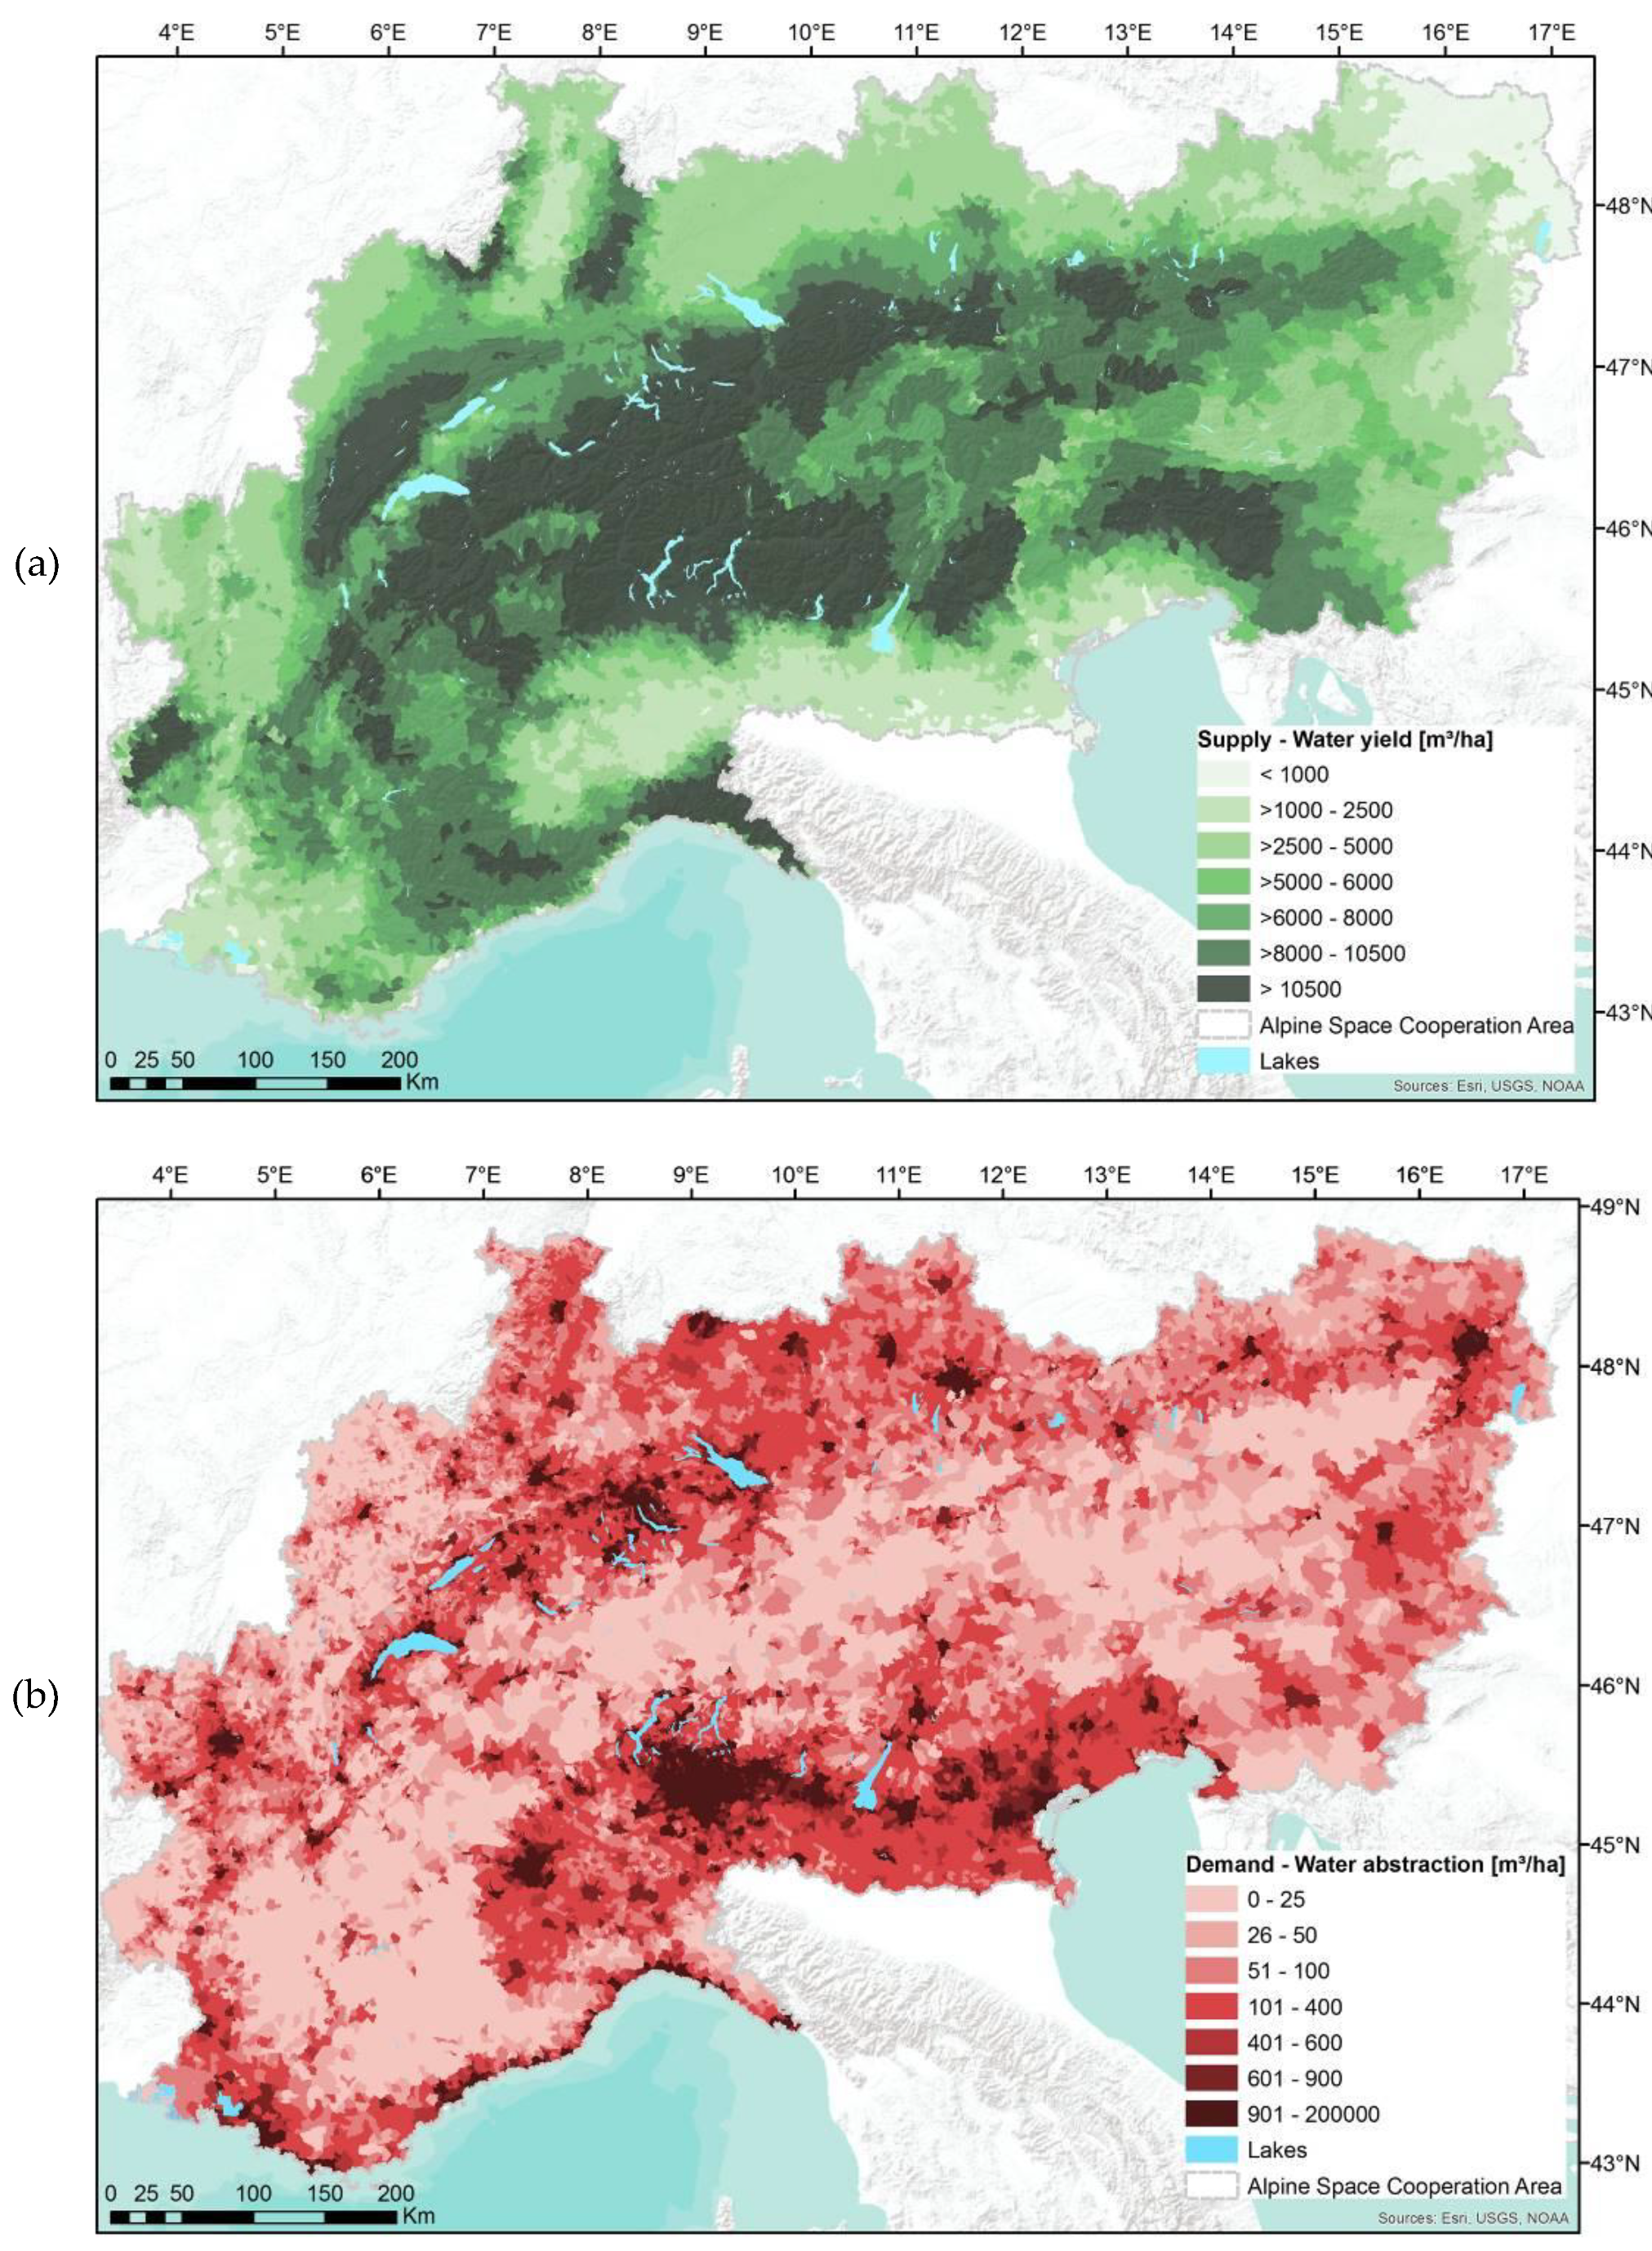
Figure 2.
Comparison of InVEST water yield model with GSCD mean annual runoff map for the model set-ups for the different Alpine climate regions (a–d).
Figure 2.
Comparison of InVEST water yield model with GSCD mean annual runoff map for the model set-ups for the different Alpine climate regions (a–d).

Figure 3.
Hot spots of water supply at the municipality level in the Alpine Space area.
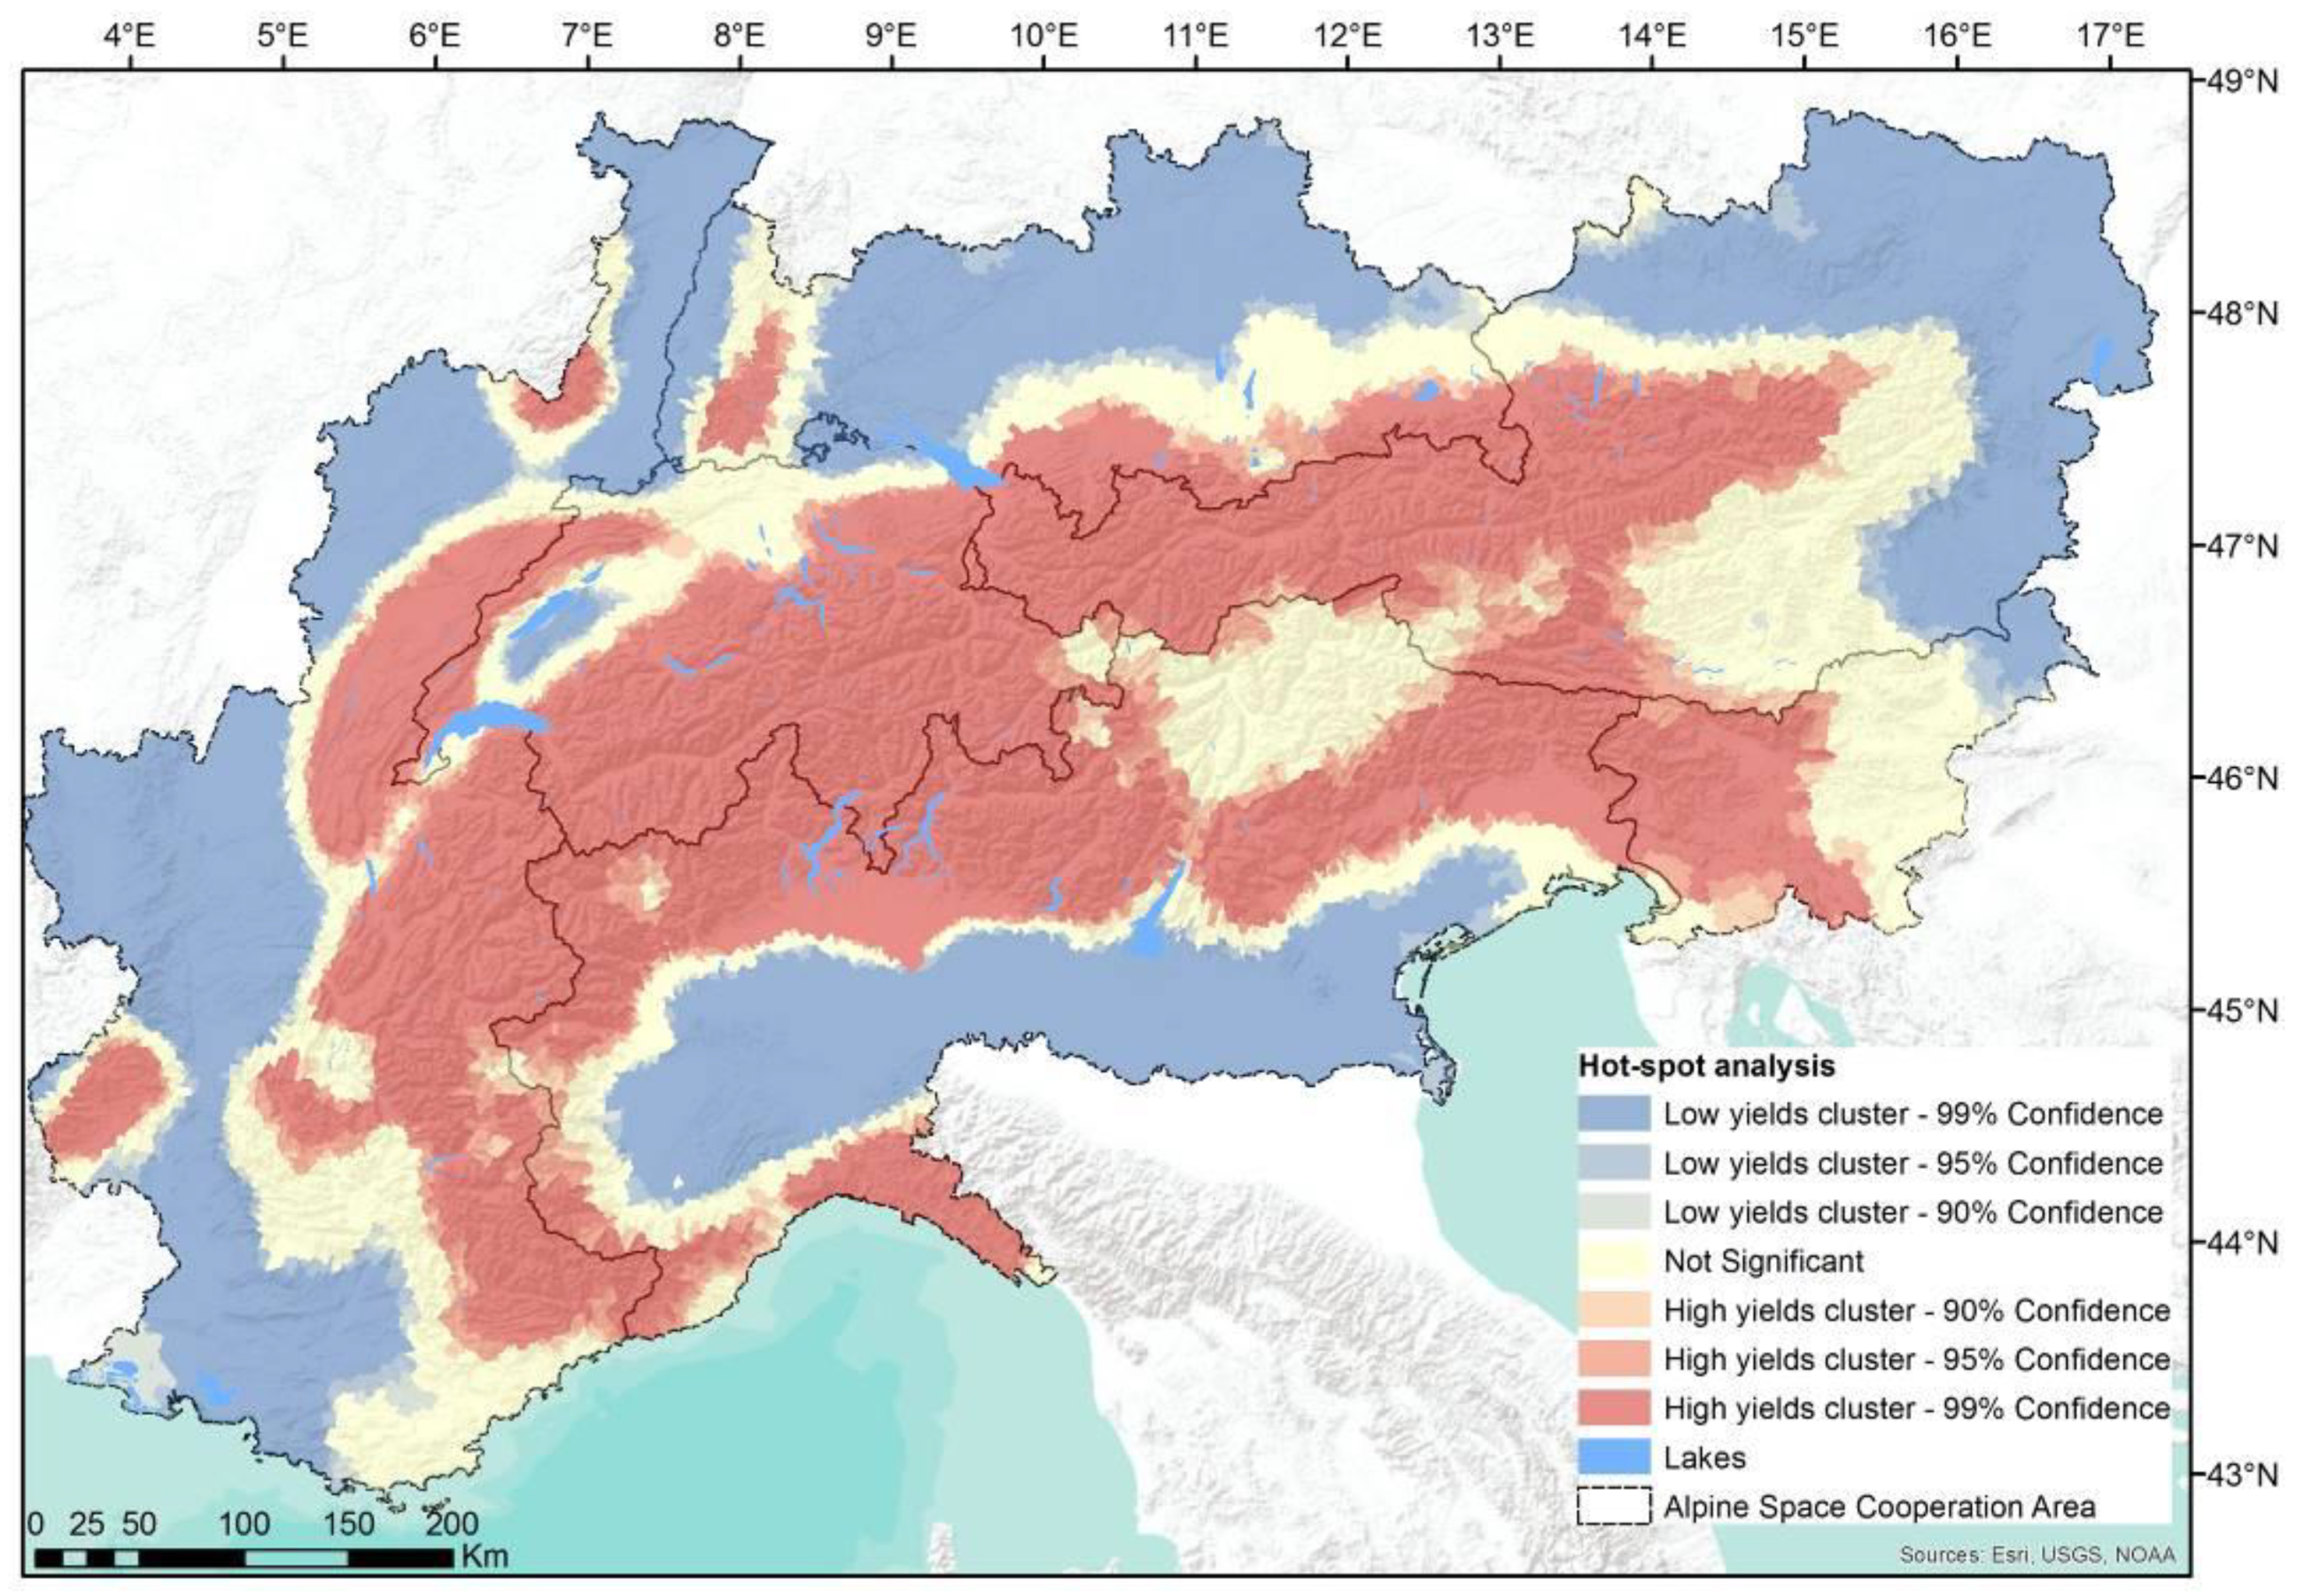
Figure 4.
Supply-demand budget at the municipality level in the Alpine Space area.

Figure 5.
Expected changes in water budget under the assumed future scenario: increasing water demand due to a 5% population increase and changing water supply when annual mean precipitation is increasing by 10% in the north and decreasing by 10% in the south.
Figure 5.
Expected changes in water budget under the assumed future scenario: increasing water demand due to a 5% population increase and changing water supply when annual mean precipitation is increasing by 10% in the north and decreasing by 10% in the south.

Table 1.
Input data for the InVEST model.
| Variable | Model Input | Data Source | Spatial Resolution |
|---|---|---|---|
| Precipitation | HISTALP | [28] | 10 × 10 km |
| Root restricting layer | European Soil Database (ESDB) version 2.0 | [41] | 1:1,000,000 |
| Land use/Land cover | MODIS Land Cover | [42] | 10 × 10 km |
| Plant available water content | European Soil Database (ESDB) version 2.0 | [41] | 1:1,000,000 |
| Potential Evapotranspiration | Global Aridity and PET Database, CGIAR-CSI; | [43] | 1 × 1 km |
| Watershed delineation | HydroSHEDS | [44] | 500 × 500 m |
Table 2.
Models’ performance in the different climate regions.
| Climate Region | Root Mean Square Error | Mean Error Rate (%) |
|---|---|---|
| Northwest (a) | 259.36 | 17.7 |
| Northeast (b) | 212.66 | 13.4 |
| Southwest (c) | 129.21 | 12.3 |
| Southeast (d) | 117.79 | 10.2 |
© 2019 by the authors. Licensee MDPI, Basel, Switzerland. This article is an open access article distributed under the terms and conditions of the Creative Commons Attribution (CC BY) license (http://creativecommons.org/licenses/by/4.0/).
Share and Cite
MDPI and ACS Style
Meisch, C.; Schirpke, U.; Huber, L.; Rüdisser, J.; Tappeiner, U. Assessing Freshwater Provision and Consumption in the Alpine Space Applying the Ecosystem Service Concept. Sustainability 2019, 11, 1131. https://doi.org/10.3390/su11041131
AMA Style
Meisch C, Schirpke U, Huber L, Rüdisser J, Tappeiner U. Assessing Freshwater Provision and Consumption in the Alpine Space Applying the Ecosystem Service Concept. Sustainability. 2019; 11(4):1131. https://doi.org/10.3390/su11041131
Chicago/Turabian StyleMeisch, Claude, Uta Schirpke, Lisa Huber, Johannes Rüdisser, and Ulrike Tappeiner. 2019. "Assessing Freshwater Provision and Consumption in the Alpine Space Applying the Ecosystem Service Concept" Sustainability 11, no. 4: 1131. https://doi.org/10.3390/su11041131
Note that from the first issue of 2016, this journal uses article numbers instead of page numbers. See further details here.