Measuring Environmental Perceptions Grounded on Different Theoretical Models: The 2-Major Environmental Values (2-MEV) Model in Comparison with the New Ecological Paradigm (NEP) Scale


Abstract
:1. Introduction
- (1).
- Milfont and Duckitt [57] coming from a psychometric background confirmed the two-factor second-order structure in spite of including a larger number of items.
- (2).
- Some years later, evaluation efforts for earth education programs in the US provided the second independent confirmation [58], again confirming the secondary higher-order structure of PRE and UTL.
- (3).
- A Flemish study applied the 2-MEV model within an eco-school initiative [59].
- (4).
- A West African sample extracted the two-dimensional structure within the context of evaluating an outreach education program [14]. Thus, the 2-MEV finds itself in the exceptional situation of repeated independent confirmations from a variety of backgrounds and enjoys worldwide usage and close to 30 language versions. Thus, the 2-MEV provides the benefit of allowing inter-study comparisons by simultaneously fitting well with the current psychology of sustainable development [59].
2. Materials and Methods
2.1. Participants
2.2. Earthkeepers Program
2.3. Instruments
2.4. Procedure and Data Analyses
3. Results
4. Discussion
4.1. NEP or 2-MEV?
4.2. Recommendations for Education
5. Conclusions
Author Contributions
Funding
Conflicts of Interest
References
- Eagly, A.H.; Chaiken, S. The Psychology of Attitudes; Harcourt Brace Jovanovich College: Fortworth, TX, USA, 1993. [Google Scholar]
- Dewey, J. Experience and Nature; Open Court: La Salle, IL, USA, 1925. [Google Scholar]
- Dewey, J. The Quest for Certainty: A Study of the Relation of Knowledge and Action; Minton, Balch and Company: New York, NY, USA, 1929. [Google Scholar]
- Muir, J. A Thousand-Mile Walk to the Gulf; Houghton Mifflin: Boston, MA, USA; New York, NY, USA, 1916. [Google Scholar]
- Leopold, A. A Sand County Almanac; Oxford University Press: Oxford, UK, 1949. [Google Scholar]
- Carson, R. The Silent Spring; Houghton Mifflin: Boston, MA, USA, 1962. [Google Scholar]
- Dunlap, R.E.; Van Liere, K.D. The ‘New Environmental Paradigm’. J. Environ. Educ. 1978, 9, 10–19. [Google Scholar] [CrossRef]
- Dunlap, R.E.; Van Liere, K.D.; Mertig, A.G.; Jones, R.E. Measuring endorsement of the New Ecological Paradigm: A revised NEP scale. J. Soc. Issues 2000, 56, 425–442. [Google Scholar] [CrossRef]
- Pirages, D.C.; Ehrlich, P.R. Ark II: Social Responses to Environmental Imperatives; W. H. Freeman: San Francisco, CA, USA, 1974. [Google Scholar]
- Arcury, T.A.; Johnson, T.P.; Scollay, S.J. Ecological Worldview and Environmental Knowledge: The New Environmental Paradigm. J. Environ. Educ. 1986, 17, 35–40. [Google Scholar] [CrossRef]
- Dunlap, R.E. The new environmental paradigm scale: From marginality to worldwide use. J. Environ. Educ. 2008, 40, 3–18. [Google Scholar] [CrossRef]
- De Groot, J.I.M.; Steg, L. Value orientations to explain beliefs related to environmental significant behavior. Environ. Behav. 2008, 40, 330–354. [Google Scholar] [CrossRef]
- Schultz, P.W.; Zelezny, L.C. Values and pro-environmental behavior: A five-country survey. J. Cross-Cult. Psychol. 1998, 29, 540–558. [Google Scholar] [CrossRef]
- Schultz, P.W.; Zelezny, L.C. Values as predictors of environmental attitudes: Evidence for consistency across 14 countries. J. Environ. Psychol. 1999, 19, 255–265. [Google Scholar] [CrossRef]
- Stern, P.C.; Dietz, T.; Abel, T.; Guagnano, G.A.; Kalof, L. A value-belief-norm theory of support for social movements: The case of environmentalism. Hum. Ecol. Rev. 1998, 6, 81–97. [Google Scholar]
- Stern, P.C.; Dietz, T.; Guagnano, G.A. The New Ecological Paradigm in social-psychological context. Environ. Behav. 1995, 27, 723–743. [Google Scholar] [CrossRef]
- Hall, C.; Moran, D. Investigating GM risk perceptions: A survey of anti-GM and environmental campaign group members. J. Rural Stud. 2006, 22, 29–37. [Google Scholar] [CrossRef]
- Slimak, M.W.; Dietz, T. Personal values, beliefs, and ecological risk perception. Risk Anal. 2006, 26, 1689–1705. [Google Scholar] [CrossRef] [PubMed]
- Cooper, P.; Poe, G.L.; Bateman, I.J. The structure of motivation for contingent values: A case study of lake water quality improvement. Ecol. Econ. 2004, 50, 69–82. [Google Scholar] [CrossRef]
- Kotchen, M.J.; Reiling, S.D. Environmental attitudes, motivations, and contingent valuation of nonuse values. Ecol. Econ. 2000, 32, 93–107. [Google Scholar] [CrossRef]
- Evans, G.W.; Brauchle, G.; Haq, A.; Stecker, R.; Wong, K.; Shapiro, E. Young children’s environmental attitudes and behaviors. Environ. Behav. 2007, 39, 645–659. [Google Scholar] [CrossRef]
- Manoli, C.C.; Johnson, B.; Dunlap, R.E. Assessing children’s environmental worldviews: Modifying and validating the new ecological paradigm scale for use with children. J. Environ. Educ. 2007, 38, 3–13. [Google Scholar] [CrossRef]
- Hawcroft, L.J.; Milfont, T.L. The use (and abuse) of the new environmental paradigm scale over the last 30 years: A meta-analysis. J. Environ. Psychol. 2010, 30, 143–158. [Google Scholar] [CrossRef]
- Edgell, M.C.R.; Nowell, D.E. The New Environmental Paradigm scale: Wildlife and environmental beliefs in British Colombia. Soc. Nat. Resour. 1989, 2, 285–286. [Google Scholar] [CrossRef]
- Pierce, J.C.; Steger, M.E.; Steel, B.S.; Lovrich, N.P. Citizens, Political Communication and Interest Groups: Environmental Organizations in Canada and the United States; Praeger: Westport, CT, USA, 1992. [Google Scholar]
- Caron, J.A. Environmental perspectives of Blacks: Acceptance of the ‘new environmental paradigm’. J. Environ. Educ. 1989, 20, 21–26. [Google Scholar] [CrossRef]
- Noe, F.P.; Snow, R. Hispanic cultural influence on environmental concern. J. Environ. Educ. 1990, 21, 27–34. [Google Scholar] [CrossRef]
- Bechtel, R.B.; Verdugo, V.C.; de Q Pinheiro, J. Environmental belief systems: United States, Brazil, and Mexico. J. Cross-Cult. Psychol. 1999, 30, 122–128. [Google Scholar] [CrossRef]
- Furman, A. A note on environmental concern in a developing country: Results from an Istanbul survey. Environ. Behav. 1998, 30, 520–534. [Google Scholar] [CrossRef]
- Gooch, G.D. Environmental beliefs and attitudes in Sweden and the Baltic states. Environ. Behav. 1995, 27, 513–539. [Google Scholar] [CrossRef]
- Pierce, J.C.; Lovrich, N.P., Jr.; Tsurutani, T.; Takematsu, A. Environmental belief systems among Japanese and American elites and publics. Political Behav. 1987, 9, 139–159. [Google Scholar] [CrossRef]
- Widegren, O. The new environmental paradigm and personal norms. Environ. Behav. 1998, 30, 75–100. [Google Scholar] [CrossRef]
- Lundmark, C. The new ecological paradigm revisited: Anchoring the NEP scale in environmental ethics. Environ. Educ. Res. 2007, 13, 329–347. [Google Scholar] [CrossRef]
- Albrecht, D.; Bultena, G.; Hoiberg, E.; Nowak, P. The new environmental paradigm scale. J. Environ. Educ. 1982, 13, 39–43. [Google Scholar] [CrossRef]
- Geller, J.M.; Lasley, P. The new environmental paradigm scale: A reexamination. J. Environ. Educ. 1985, 17, 9–12. [Google Scholar] [CrossRef]
- Noe, F.P.; Snow, R. The new environmental paradigm and further scale analysis. J. Environ. Educ. 1990, 21, 20–26. [Google Scholar] [CrossRef]
- Lefcourt, H.M. Perspective-taking humor and authoritarianism as predictors of anthropocentrism. Humor 1996, 9, 57–71. [Google Scholar] [CrossRef]
- Noe, F.P.; Hammitt, W.E. Environmental attitudes and the personal relevance of management actions in a park setting. J. Environ. Manag. 1992, 35, 205–216. [Google Scholar] [CrossRef]
- Scott, D.; Willits, F.K. Environmental attitudes and behavior: A Pennsylvania survey. Environ. Behav. 1994, 26, 239–260. [Google Scholar] [CrossRef]
- Roberts, J.A.; Bacon, D.R. Exploring the subtle relationships between environmental concern and ecologically conscious consumer behavior. J. Bus. Res. 1997, 40, 79–89. [Google Scholar] [CrossRef]
- Hines, J.M.; Hungerford, H.R.; & Tomera, A.N. Analysis and synthesis of research on responsible environmental behavior: A meta-analysis. J. Environ. Educ. 1987, 18, 1–8. [Google Scholar] [CrossRef]
- Leeming, F.C.; Dwyer, W.O.; Porter, B.E.; Cobern, M.K. Outcome research in environmental education: A critical review. J. Environ. Educ. 1993, 24, 8–21. [Google Scholar] [CrossRef]
- Bogner, F.X.; Wilhelm, M.G. Environmental Perception of Pupils. Development of an Attitude and Behaviour Scale. Environmentalist 1996, 16, 95–110. [Google Scholar]
- Bogner, F.X.; Wiseman, M. Toward measuring adolescent environmental perception. Eur. Psychol. 1999, 4, 139–151. [Google Scholar] [CrossRef]
- Bogner, F.X.; Wiseman, M. Environmental Perception: Factor Profiles of Extreme Groups. Eur. Psychol. 2002, 7, 225–237. [Google Scholar] [CrossRef]
- Bogner, F.X.; Wiseman, M. Adolescents’ attitudes towards nature and environment: Quantifying the 2-MEV model. Environment 2006, 26, 247–254. [Google Scholar] [CrossRef]
- Rokeach, M. Beliefs, Attitudes, and Values; Jossey-Bass: San Francisco, CA, USA, 1968. [Google Scholar]
- Wiseman, M.; Bogner, F.X. A higher-order model of ecological values and its relationship to personality. Personal. Individ. Differ. 2003, 34, 783–794. [Google Scholar] [CrossRef]
- Bogner, F.X.; Wiseman, M. Environmental perception of French and some Western European secondary school students. Eur. J. Psychol. Educ. 2002, 17, 3–18. [Google Scholar] [CrossRef]
- Eysenck, H.J.; Eysenck, S.P.G. The Biological Basis of Personality; Thomas: Springfield, MO, USA, 1967. [Google Scholar]
- Bogner, F.X.; Brengelmann, J.; Wiseman, M. Risk-taking and Environmental Perception. Environmentalist 2000, 20, 49–62. [Google Scholar] [CrossRef]
- Wiseman, M.; Wilson, G.; Bogner, F.X. Environmental values and authoritarianism. Psychol. Res. 2012, 2, 25–31. [Google Scholar]
- Bogner, F.X.; Wiseman, M. Environmental perspectives of Danish and Bavarian pupils: Towards a methodological framework. Scand. J. Educ. Res. 1997, 41, 53–71. [Google Scholar] [CrossRef]
- Bogner, F.X.; Wiseman, M. Environmental perception of Swiss and Bavarian pupils: An empirical evaluation. Schweiz. Z. Für Soziol. 1998, 24, 547–566. [Google Scholar]
- Munoz, F.; Bogner, F.X.; Clement, P.; Carvalho, G.S. Teachers’ conceptions of nature and environment in 16 countries. J. Environ. Psychol. 2009, 29, 407–413. [Google Scholar] [CrossRef]
- Oerke, B.; Bogner, F.X. Social desirability, environmental attitudes, and general ecological behaviour in children. Int. J. Sci. Educ. 2013, 35, 713–730. [Google Scholar] [CrossRef]
- Milfont, T.L.; Duckitt, J. The structure of environmental attitudes: A first- and second-order confirmatory factor analysis. J. Environ. Psychol. 2004, 24, 289–303. [Google Scholar] [CrossRef]
- Johnson, B.; Manoli, C.C. Using Bogner and Wiseman’s Model of Ecological Values to measure the impact of an earth education programme on children’s environmental perceptions. Environ. Educ. Res. 2008, 14, 115–127. [Google Scholar] [CrossRef]
- Boeve-de Pauw, J.; van Petegem, P. The effect of Flemish eco-schools on student environmental knowledge, attitudes, and affect. Int. J. Sci. Educ. 2011, 33, 1513–1538. [Google Scholar] [CrossRef]
- Van Matre, S.; Johnson, B. Earthkeepers: Four Keys for Helping Young People Live in Harmony with the Earth; The Institute for Earth Education: Greenville, WV, USA, 1988. [Google Scholar]
- Johnson, B.; Manoli, C.C. The 2-MEV scale in the United States: A measure of children’s environmental attitudes based on the theory of ecological attitude. J. Environ. Educ. 2010, 42, 84–97. [Google Scholar] [CrossRef]
- Castera, J.; Clement, P.; Munoz, F.; Bogner, F.X. How teachers’ attitudes on GMO relate to their environmental values. J. Environ. Psychol. submitted. [CrossRef]


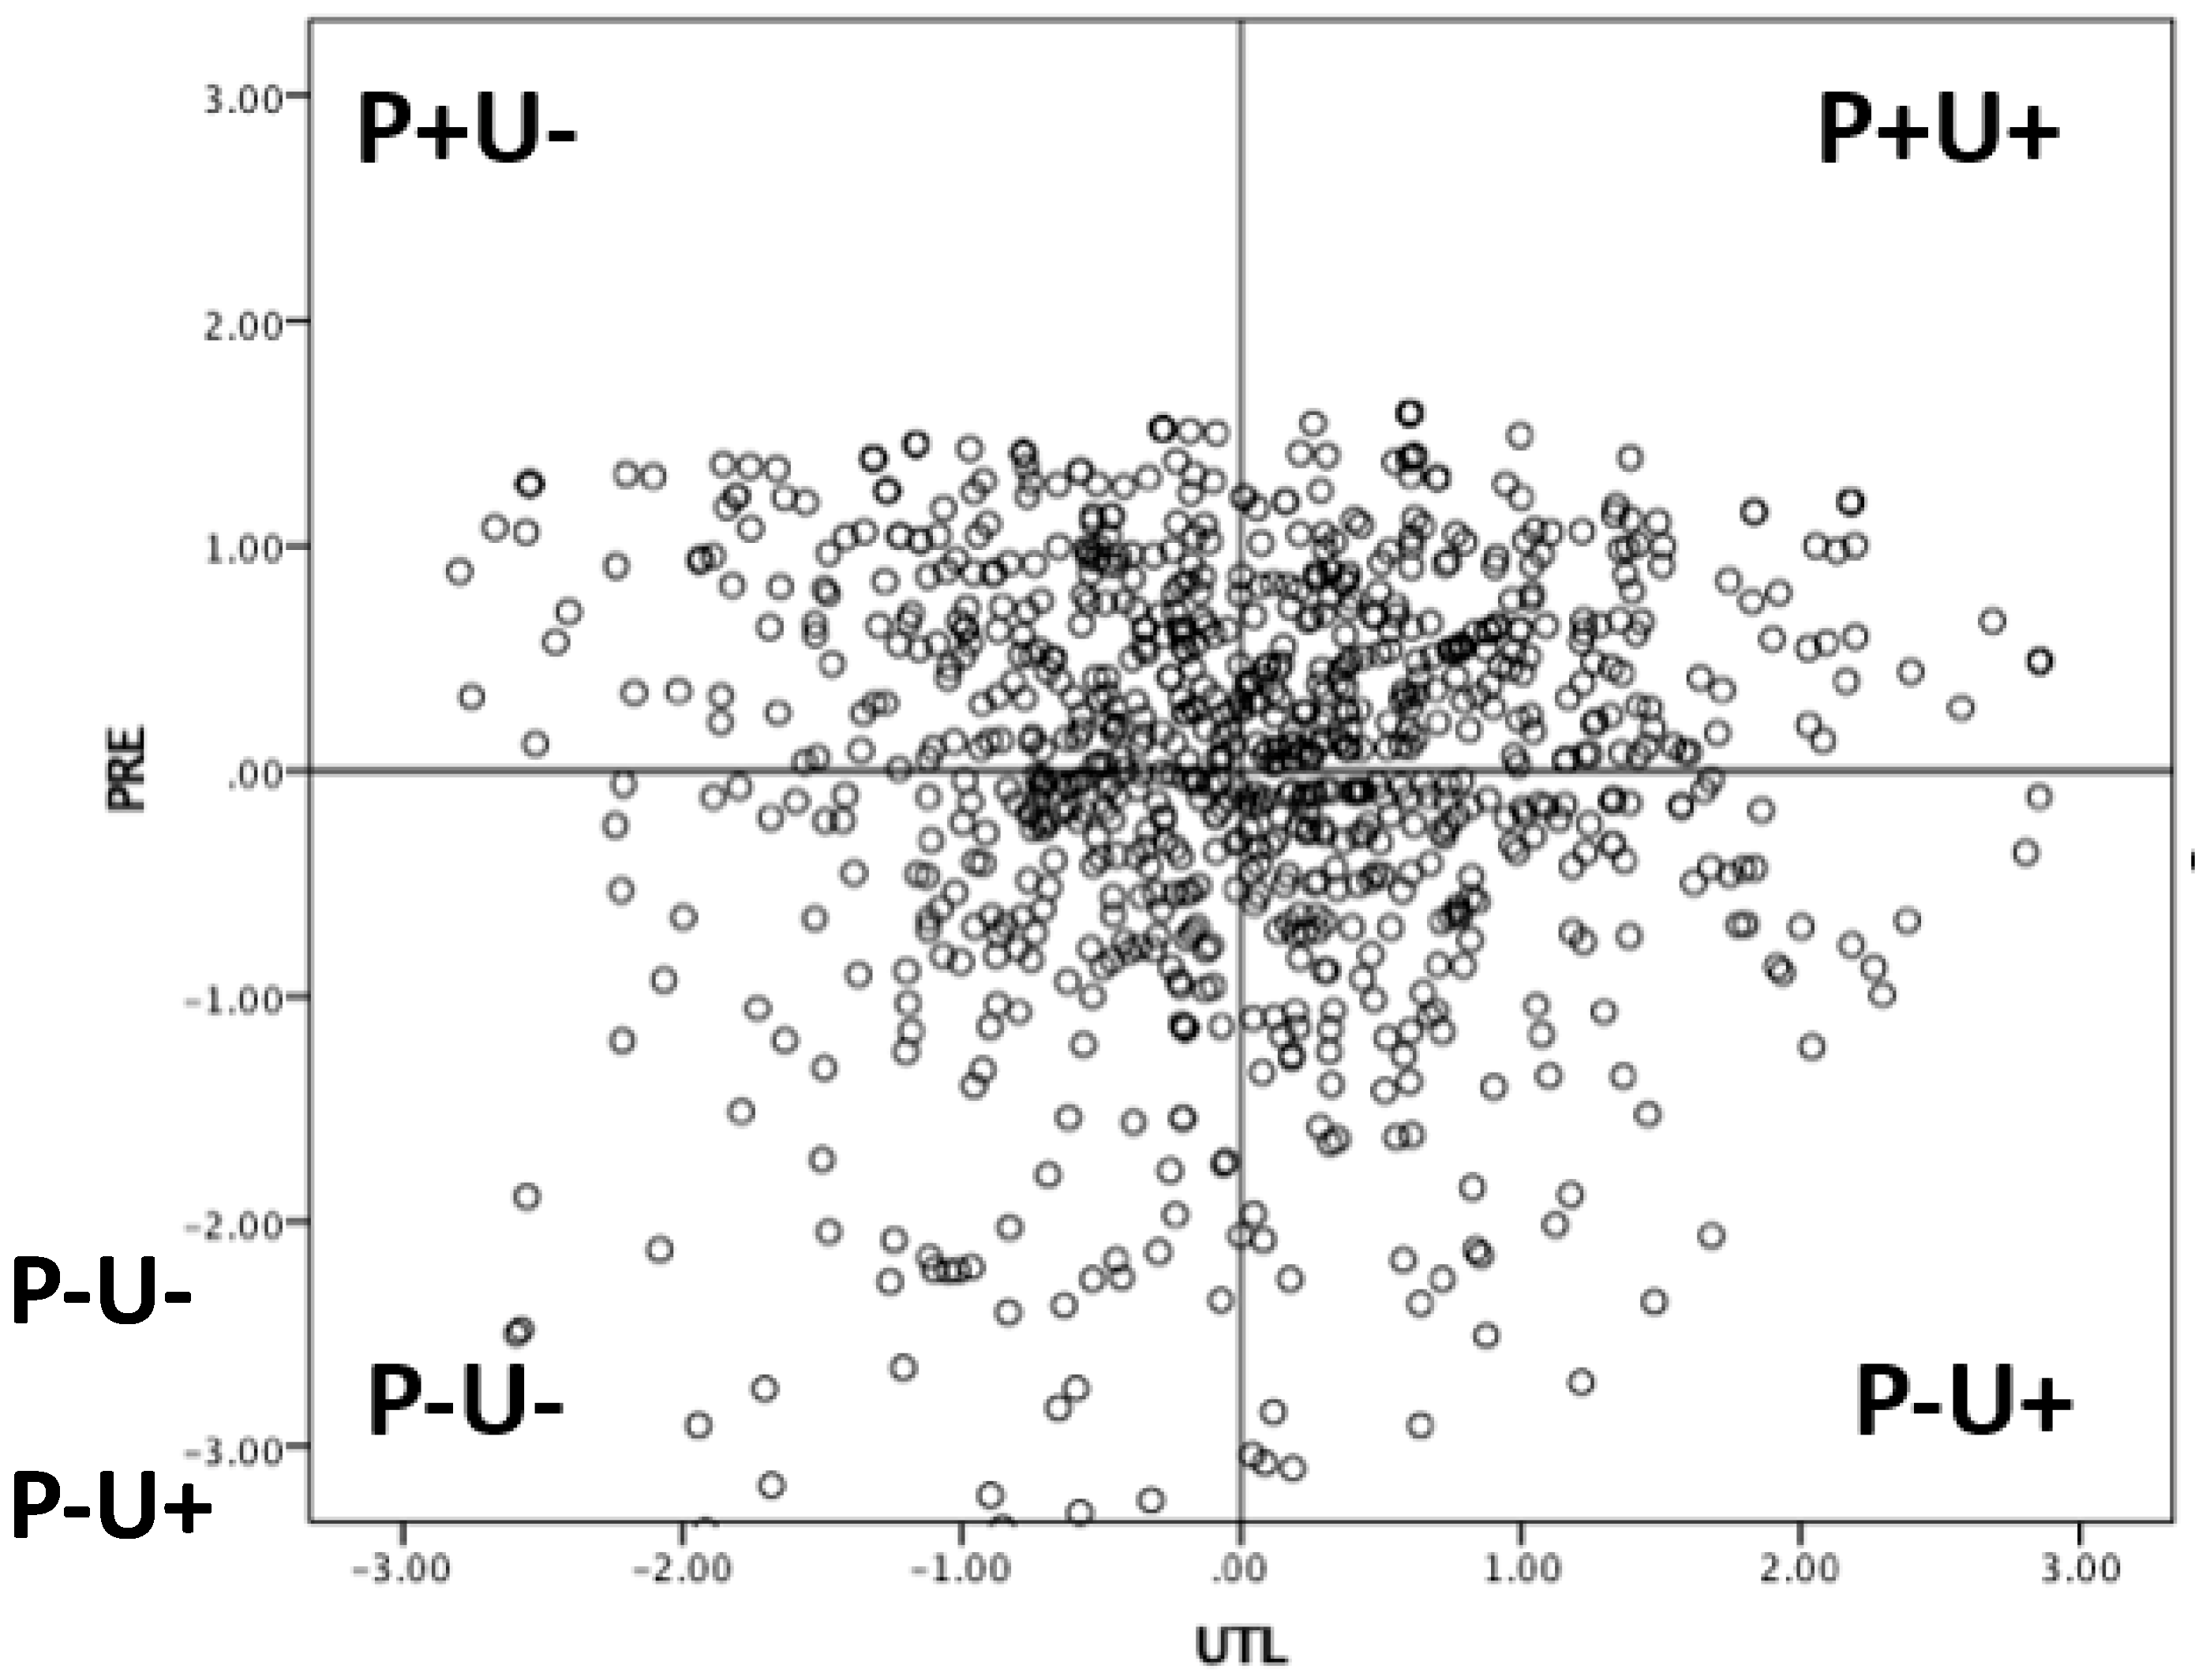
| Quadrant | Mean | N | Std. Dev |
|---|---|---|---|
| PRE+/UTL- | 3.86 | 304 | 0.40 |
| PRE+/UTL+ | 3.44 | 196 | 0.38 |
| PRE-/UTL- | 3.43 | 169 | 0.55 |
| PRE-/UTL+ | 2.95 | 156 | 0.43 |
| Mean Scores | Std. Deviation | ||||||
|---|---|---|---|---|---|---|---|
| Quadrant | PRE+UTL- | PRE-UTL+ | PRE+UTL- | PRE-UTL+ | t | p | Effect size |
| 1-4 | 3.86 | 2.95 | 0.04 | 0.43 | 10.63 | <0.001 | 2.24 |
| Quadrant | PRE+UTL+ | PRE-UTL- | PRE+UTL+ | PRE-UTL- | T | p | Effect size |
| 2-3 | 3.44 | 3.43 | 0.38 | 0.55 | 0.84 | >0.05 | na |
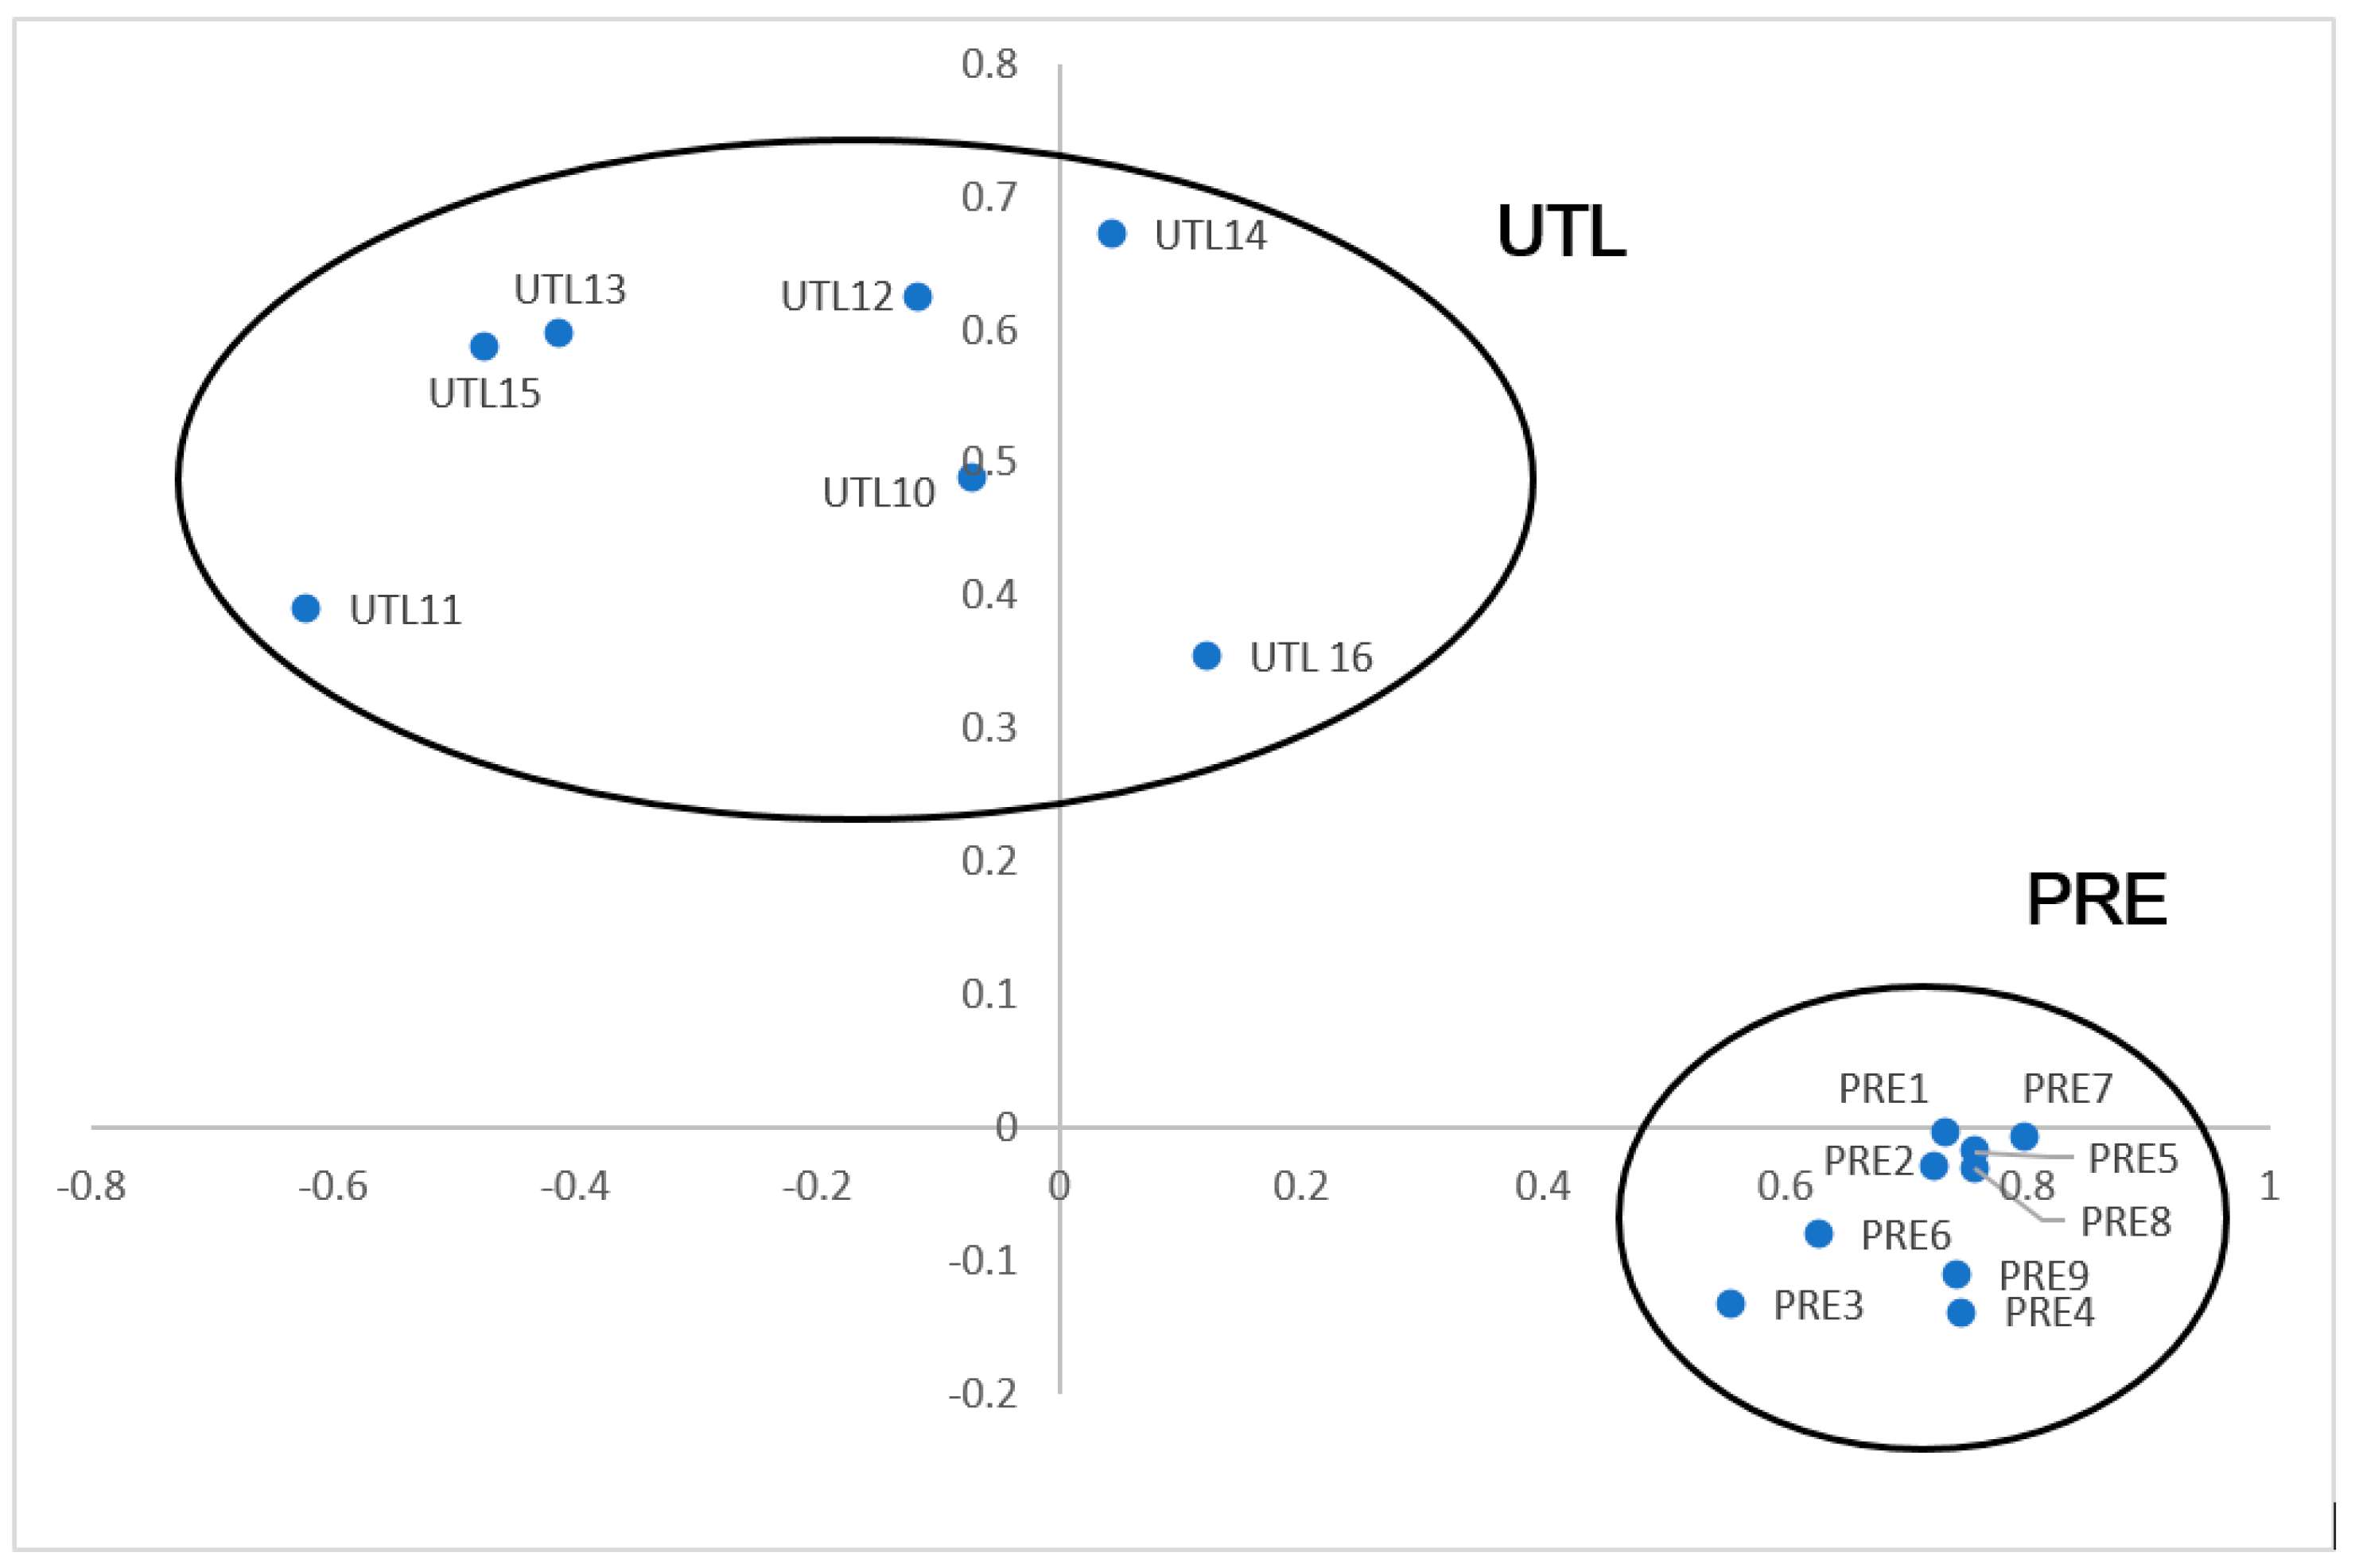
| Preservation Items |
| PRE1. If I ever have extra money, I will give some to help protect nature. |
| PRE2. To save energy in the winter, I make sure the heat in my room is not on too high. |
| PRE3. I would like to sit by a pond and watch dragonflies. |
| PRE4. I would help raise money to protect nature. |
| PRE5. I always turn off the light when I do not need it any more. |
| PRE6. I like to go on trips to places like forests away from cities. |
| PRE7. I try to tell others that nature is important. |
| PRE8. I try to save water by taking shorter showers or by turning off the water when I brush my teeth. |
| PRE9. I like the quiet of nature. |
| Utilization Items |
| UTL10. People have the right to change the environment (nature). |
| UTL11. Building new roads is so important that trees should be cut down. |
| UTL12. I like a grass lawn more than a place where flowers grow on their own. |
| UTL13. Because mosquitoes live in swamps, we should drain the swamps, and use them for farming. |
| UTL14. To feed people, nature must be cleared to grow food. |
| UTL15. People are supposed to rule over the rest of nature. * |
| UTL16. Weeds should be destroyed because they inhibit the full development of useful and ornamental plants. |
| New Ecological Paradigm Items |
| NEP17. Plants and animals have as much right as people to live. |
| NEP18. People are supposed to rule over the rest of nature. * |
| NEP19. There are too many (or almost too many) people on Earth. |
| NEP20. Human cleverness and skill will make sure that we do NOT ruin the earth. |
| NEP21. People must still obey the laws of nature. |
| NEP22. Nature is strong enough to handle the bad effects of modern developed countries. |
| NEP23. When people mess with nature it has bad results. |
| NEP24. Humans will someday learn enough about how nature works to be able to control it. |
| NEP25. Humans are greatly mistreating the environment. |
| NEP26. If things continue on their present course, we will soon experience a major ecological catastrophe. |
© 2019 by the authors. Licensee MDPI, Basel, Switzerland. This article is an open access article distributed under the terms and conditions of the Creative Commons Attribution (CC BY) license (http://creativecommons.org/licenses/by/4.0/).
Share and Cite
Manoli, C.C.; Johnson, B.; Buxner, S.; Bogner, F. Measuring Environmental Perceptions Grounded on Different Theoretical Models: The 2-Major Environmental Values (2-MEV) Model in Comparison with the New Ecological Paradigm (NEP) Scale. Sustainability 2019, 11, 1286. https://doi.org/10.3390/su11051286
Manoli CC, Johnson B, Buxner S, Bogner F. Measuring Environmental Perceptions Grounded on Different Theoretical Models: The 2-Major Environmental Values (2-MEV) Model in Comparison with the New Ecological Paradigm (NEP) Scale. Sustainability. 2019; 11(5):1286. https://doi.org/10.3390/su11051286
Chicago/Turabian StyleManoli, Constantinos C., Bruce Johnson, Sanlyn Buxner, and Franz Bogner. 2019. "Measuring Environmental Perceptions Grounded on Different Theoretical Models: The 2-Major Environmental Values (2-MEV) Model in Comparison with the New Ecological Paradigm (NEP) Scale" Sustainability 11, no. 5: 1286. https://doi.org/10.3390/su11051286