Socioeconomic Development, Demographic Dynamics and Forest Fires in Italy, 1961–2017: A Time-Series Analysis


Abstract
:1. Introduction
2. Methodology
2.1. Study Area
2.2. Indicators
2.3. Data Analysis
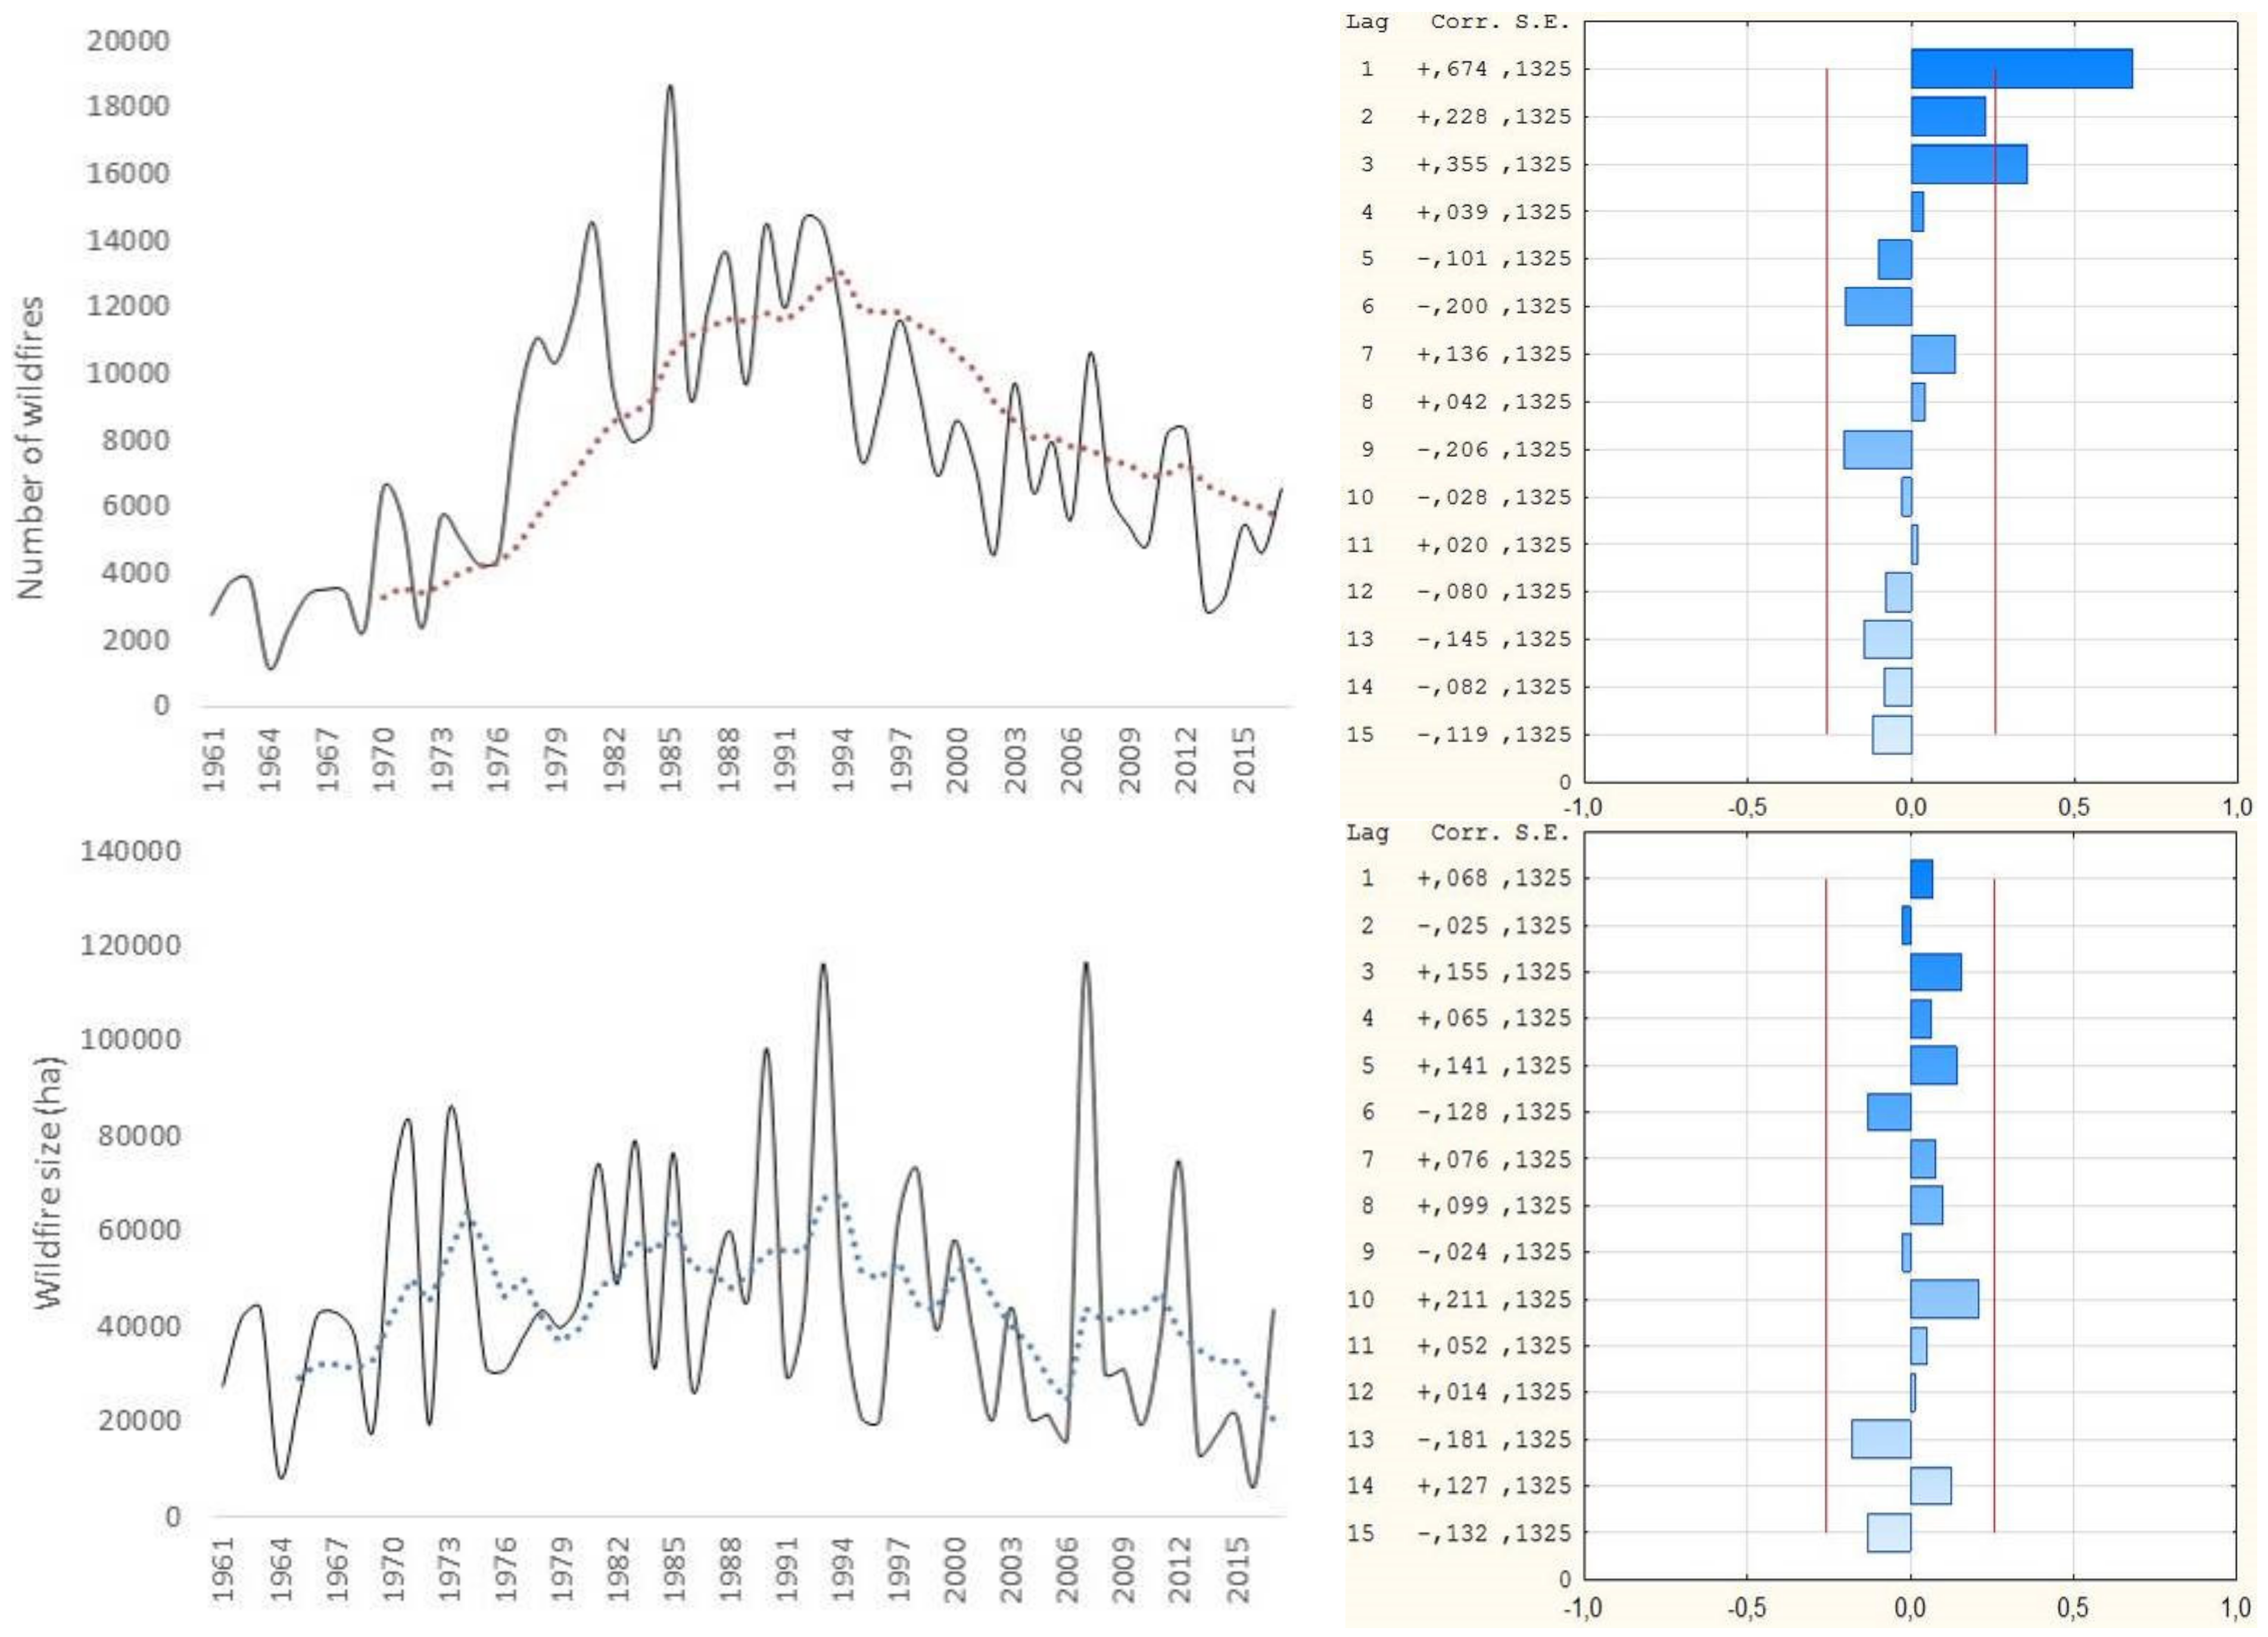
3. Results
3.1. Descriptive Statistics
3.2. Clustering and Ordination
3.3. Multiple Regression
4. Discussion
5. Conclusions
Author Contributions
Funding
Conflicts of Interest
Appendix A

| Theme | Acronym | Indicator | Source |
|---|---|---|---|
| Territory | FOR | Forest land (% in total land) | Forest statistics |
| FOP | Per-capita forest area (m2 per inhabitant) | Forest statistics | |
| GRO | Population growth rate (% per year) | Demographic statistics | |
| POP | Resident population (logarithm) | Demographic statistics | |
| PAR | Protected area (% in total land) | Environmental statistics | |
| RAI | Railway network (km/1000 inhabitants) | Economic statistics | |
| URB | Population residing in urban centers (% in total popul.) | Demographic statistics | |
| Demography | SEX | Sex ratio (males vs females) | Demographic statistics |
| BIR | Crude birth rate (% in total population) | Demographic statistics | |
| DEA | Crude death rate (% in total population) | Demographic statistics | |
| MIG | Migration rate (% in total population) | Demographic statistics | |
| NAT | Natural birth rate (% in total births) | Demographic statistics | |
| STI | Still birth rate (% in total births) | Demographic statistics | |
| BRI | Age difference between groom and bride (years) | Demographic statistics | |
| MAR | Marriage rate (% in total population) | Demographic statistics | |
| SPO | Average age of the groom at the marriage (years) | Demographic statistics | |
| AGE | Median age at death for males (years) | Demographic statistics | |
| MER | Difference in female vs male median age (years) | Demographic statistics | |
| DE0 | Death at age 0–4 years (% in total population) | Demographic statistics | |
| Education | TER | Third-level graduated (% in total population) | University statistics |
| GRA | Second-level graduated (% in total population) | School statistics | |
| SCI | Enrolled at the university in science faculties (%) | University statistics | |
| MED | Enrolled at the university in medicine faculties (%) | University statistics | |
| AGR | Enrolled at the university in agrarian faculties (%) | University statistics | |
| ECO | Enrolled at the university in economy faculties (%) | University statistics | |
| LAW | Enrolled at the university in law faculties (%) | University statistics | |
| Agriculture | WHP | Wheat production (per 1000 quintals) | Agricultural statistics |
| RYE | Rye production (per 1000 quintals) | Agricultural statistics | |
| BAR | Barley production (per 1000 quintals) | Agricultural statistics | |
| OAT | Oat production (per 1000 quintals) | Agricultural statistics | |
| RIC | Rice production (per 1000 quintals) | Agricultural statistics | |
| MAI | Maize production (per 1000 quintals) | Agricultural statistics | |
| BRO | Broad bean production (per 1000 quintals) | Agricultural statistics | |
| BEA | Bean production (per 1000 quintals) | Agricultural statistics | |
| POT | Potatoes production (per 1000 quintals) | Agricultural statistics | |
| TOB | Tobacco production (per 1000 quintals) | Agricultural statistics | |
| GRA | Wine grapes production (per 1000 quintals) | Agricultural statistics | |
| OLI | Olive production (per 1000 quintals) | Agricultural statistics | |
| ORA | Orange production (per 1000 quintals) | Agricultural statistics | |
| TAN | Tangerine and clementine production (per 1000 quintals) | Agricultural statistics | |
| LEM | Lemon production (per 1000 quintals) | Agricultural statistics | |
| OTH | Other agrumes’ production (per 1000 quintals) | Agricultural statistics | |
| ALM | Almond production (per 1000 quintals) | Agricultural statistics | |
| HAZ | Hazel production (per 1000 quintals) | Agricultural statistics | |
| CRO | Per capita agricultural production (quintals) | Agricultural statistics | |
| CAT | Total density of cattle and buffaloes (animals) | Agricultural statistics | |
| SHE | Total density of sheep and goats (animals) | Agricultural statistics | |
| PIG | Total density of pigs (animals) | Agricultural statistics | |
| HOR | Total density of horses (animals) | Agricultural statistics | |
| EGG | Total number of eggs produced (per 1000 units) | Agricultural statistics | |
| Economy | IEU | Imports from Europe (% in total import) | Trade statistics |
| IAM | Imports from north America (% in total import) | Trade statistics | |
| EEU | Exports to Europe (% in total import) | Trade statistics | |
| EAM | Exports to north America (% in total export) | Trade statistics | |
| DEP | Bank deposit amount/total loan amount | Economic statistics | |
| OIL | Imported oil/imported carbon | Trade statistics | |
| WHE | Wheat production/wheat import | National accounts | |
| BAL | Total import/total export | Trade statistics |
References
- Lozano, O.M.; Salis, M.; Ager, A.A.; Arca, B.; Alcasena, F.J.; Monteiro, A.T.; Finney, M.A.; Del Giudice, L.; Scoccimarro, E.; Spano, D. Assessing climate change impacts on wildfire exposure in Mediterranean areas. Risk Anal. 2017, 37, 1898–1916. [Google Scholar] [CrossRef] [PubMed]
- Galiana-Martin, L.; Herrero, G.; Solana, J. A wildland-urban interface typology for forest fire risk management in Mediterranean areas. Landsc. Res. 2011, 36, 151–171. [Google Scholar] [CrossRef]
- Viedma, O.; Moity, N.; Moreno, J.M. Changes in landscape fire-hazard during the second half of the 20th century: Agriculture abandonment and the changing role of driving factors. Agric. Ecosyst. Env. 2015, 217, 126–140. [Google Scholar] [CrossRef]
- Morgan, P.; Hardy, C.C.; Swetnam, T.W.; Rollins, M.G.; Long, D.G. Mapping fire regimes across time and space: Understanding coarse and fine-scale fire patterns. Int. J. Wildland Fire 2001, 10, 329–342. [Google Scholar] [CrossRef]
- Cutter, S.L.; Boruff, B.J.; Shirley, W.L. Social vulnerability to environmental hazards. Soc. Sci. Q. 2003, 84, 242–261. [Google Scholar]
- Cutter, S.L.; Finch, S. Temporal and spatial changes in social vulnerability to natural hazards. Proc. Natl. Acad. Sci. USA 2009, 105, 2301–2306. [Google Scholar] [CrossRef] [PubMed]
- Pereira, M.G.; Malamud, B.D.; Trigo, R.M.; Alves, P.I. The history and characteristics of the 1980–2005 Portuguese rural fire database. Nat. Hazards Earth Syst. Sci. 2011, 11, 3343–3358. [Google Scholar] [CrossRef]
- Spies, T.A.; White, E.M.; Kline, J.D.; Fischer, A.P.; Ager, A.A.; Bailey, J.; Bolte, J.; Koch, J.; Platt, E.; Olsen, C.S.; et al. Examining fire-prone forest landscapes as coupled human and natural systems. Ecol. Soc. 2014, 19, 9. [Google Scholar] [CrossRef]
- Montiel-Molina, C. Comparative assessment of wildland fire legislation and policies in the European Union: Towards a Fire Framework Directive. For. Policy Econ. 2013, 29, 1–6. [Google Scholar] [CrossRef]
- Ager, A.A.; Kline, J.; Fischer, A.P. Coupling the biophysical and social dimensions of wildfire risk to improve wildfire mitigation planning. Risk Anal. 2015, 35, 1393–1406. [Google Scholar] [CrossRef] [PubMed]
- Ager, A.A.; Preisler, H.K.; Arca, B.; Spano, D.; Salis, M. Wildfire risk estimation in the Mediterranean area. Environmetrics 2014, 25, 384–396. [Google Scholar]
- Fischer, A.P.; Spies, T.A.; Steelman, T.A.; Moseley, C.; Johnson, B.R.; Bailey, J.D.; Ager, A.A.; Bourgeron, P.; Charnley, S.; Collins, B.M.; et al. Wildfire risk as a socioecological pathology. Front. Ecol. Environ. 2016, 14, 276–284. [Google Scholar] [CrossRef]
- Nielsen-Pincus, M.; Ribe, R.G.; Johnson, B.R. Spatially and socially segmenting private landowner motivations, properties, and management: A typology for the wildland urban interface. Landsc. Urban Plan. 2015, 137, 1–12. [Google Scholar] [CrossRef]
- Oliveira, S.; Zêzere, J.L.; Queirós, M.; Pereira, J.M. Assessing the social context of wildfire-affected areas. The case of mainland Portugal. Appl. Geogr. 2017, 88, 104–117. [Google Scholar] [CrossRef]
- Olsen, C.S.; Kline, J.D.; Ager, A.A.; Olsen, K.A.; Short, K.C. Examining the influence of biophysical conditions on wildland-urban interface homeowners’ wildfire risk mitigation activities in fire-prone landscapes. Ecol. Soc. 2017, 21. [Google Scholar] [CrossRef]
- Paveglio, T.; Moseley, C.; Carroll, M.S.; Williams, D.R.; Davis, E.J.; Fischer, A.P. Categorizing the social context of the wildland urban interface: Adaptive capacity for wildfire and community “archetypes”. For. Sci. 2015, 61, 298–310. [Google Scholar] [CrossRef]
- Paveglio, T.B.; Edgeley, C.M.; Stasiewicz, A.M. Assessing influences on social vulnerability to wildfire using surveys, spatial data and wildfire simulations. J. Environ. Manag. 2018, 213, 425–439. [Google Scholar] [CrossRef] [PubMed]
- Paveglio, T.B.; Nielsen-Pincus, M.; Abrams, J.; Moseley, C. Advancing characterization of social diversity in the wildland-urban interface: An indicator approach for wildfire management. Landsc. Urban Plan. 2017, 160, 115–126. [Google Scholar] [CrossRef]
- Paveglio, T.B.; Prato, T.; Edgeley, C.; Nalle, D. Evaluating the characteristics of social vulnerability to wildfire: Demographics, perceptions, and parcel characteristics. Environ.Manag. 2016, 58, 534–548. [Google Scholar] [CrossRef] [PubMed]
- Wigtil, G.; Hammer, R.B.; Kline, J.D.; Mockrin, M.H.; Stewart, S.I.; Roper, D.; Radeloff, V.C. Places where wildfire potential and social vulnerability coincide in the coterminous United States. Int. J. Wildland Fire 2016, 25, 896–908. [Google Scholar] [CrossRef]
- Tedim, F.; Xanthopoulos, G.; Leone, V. Forest fires in Europe: Facts and challenges. Wildfire Hazards Risks Disasters 2015, 77–99. [Google Scholar] [CrossRef]
- Leys, B.; Finsinger, W.; Carcaillet, C. Historical range of fire frequency is not the Achilles’ heel of the Corsican black pine ecosystem. J. Ecol. 2014, 102, 381–395. [Google Scholar] [CrossRef]
- Flannigan, M.D.; Stocks, B.J.; Wotton, B.M. Climate change and forest fires. Sci. Total Environ. 2000, 262, 221–229. [Google Scholar] [CrossRef]
- Romero-Calcerrada, R.; Barrio-Parra, F.; Millington, J.D.A.; Novillo, C.J. Spatial modelling of socioeconomic data to understand patterns of human-caused wildfire ignition risk in the SW of Madrid (central Spain). Ecol. Model. 2010, 221, 34–45. [Google Scholar] [CrossRef]
- Rodrigues, M.; Jiménez, A.; de la Riva, J. Analysis of recent spatial-temporal evolution of human driving factors of wildfires in Spain. Nat. Hazards 2016, 84, 2049–2070. [Google Scholar] [CrossRef]
- Rodrigues, M.; De la Riva, J.; Fotheringham, S. Modeling the spatial variation of the explanatory factors of human-caused wildfires in Spain using geographically weighted logistic regression. Appl. Geogr. 2014, 48, 52–63. [Google Scholar] [CrossRef]
- Román, M.V.; Azqueta, D.; Rodrígues, M. Methodological approach to assess the socio-economic vulnerability to wildfires in Spain. For. Ecol. Manag. 2013, 294, 158–165. [Google Scholar] [CrossRef]
- Fardusi, M.J.; Chianucci, F.; Barbati, A. Concept to practice of geospatial-information tools to assist forest management and planning under precision forestry framework: A review. Ann. Silvic. Res. 2017, 41, 3–14. [Google Scholar]
- Ferrara, A.; Kelly, C.; Wilson, G.; Nolè, A.; Mancino, G.; Bajocco, S.; Salvati, L. Shaping the role of ’fast’ and ’slow’ drivers of change in forest-shrubland socio-ecological systems. J. Environ. Manag. 2016, 169, 155–166. [Google Scholar] [CrossRef] [PubMed]
- Manetti, M.C.; Amorini, E.; Becagli, C.; Pelleri, F.; Fratini, R.; Marone, E. Enhancing chestnut coppices: Silvicultural management and socio-economic context. Ann. Silvic. Res. 2010, 36, 97–108. [Google Scholar]
- Zitti, M.; Ferrara, C.; Perini, L.; Carlucci, M.; Salvati, L. Long-term Urban Growth and Land-use Efficiency in Southern Europe: Implications for Sustainable Land Management. Sustainability 2015, 7, 3359–3385. [Google Scholar] [CrossRef]
- Parisien, M.-A.; Miller, C.; Parks, S.A.; DeLancey, E.R.; Robinne, F.-N.; Flannigan, M.D. The spatially varying influence of humans on fire probability in North America. Environ. Res. Lett. 2016, 11, 075005. [Google Scholar] [CrossRef]
- Caldwell, J.C. Demographic Transition Theory; Springer: Berlin, Germany, 2006. [Google Scholar]
- Dudley, K. The Demographic Transition. Popul. Stud. 1996, 50, 361–387. [Google Scholar]
- Lesthaeghe, R.J.; Neidert, L. The second demographic transition in the United States: Exception or textbook example? Popul. Dev. Rev. 2006, 32, 669–698. [Google Scholar] [CrossRef]
- Billari, F.C.; Kohler, H.P.; Andersson, G.; Lundström, H. Approaching the limit: Long-term trends in late and very late fertility. Popul. Dev. Rev. 2007, 33, 149–170. [Google Scholar] [CrossRef]
- Caltabiano, M.; Castiglioni, M.; Rosina, A. Lowest-low fertility: Signs of a recovery in Italy? Demogr. Res. 2009, 21, 681–718. [Google Scholar] [CrossRef]
- Salvati, L.; Carlucci, M. A Composite Index of Sustainable Development at the Local Scale: Italy as a Case Study. Ecol. Indic. 2014, 43, 162–171. [Google Scholar] [CrossRef]
- Pausas, J.; Keeley, J.E. A burning story: The role of fire in the history of life. BioScience 2009, 59, 593–601. [Google Scholar] [CrossRef]
- Bradstock, R.A.; Williams, J.E.; Gill, M.A. Flammable Australia: The Fire Regimes and Biodiversity of a Continent; Cambridge University Press: Cambridge, UK, 2002. [Google Scholar]
- Heyerdahl, E.K.; Brubaker, L.B.; Agee, J.K. Spatial controls of historical fire regimes: A multiscale example from the interior west, USA. Ecology 2011, 82, 660–678. [Google Scholar] [CrossRef]
- Cazzola, A.; Pasquini, L.; Angeli, A. The relationship between unemployment and fertility in Italy: A time-series analysis. Demogr. Res. 2016, 34, 1–38. [Google Scholar] [CrossRef]
- Gil-Romera, G.; Carrión, J.S.; Pausas, J.G.; Sevilla-Callejo, M.; Lamb, H.F. Holocene fire activity and vegetation response in South-Eastern Iberia. Quat. Sci. Rev. 2010, 29, 1082–1092. [Google Scholar] [CrossRef]
- López-Sáez, J.A.; Vargas, G.; Ruiz-Fernández, J.; Blarquez, O.; Alba-Sánchez, F.; Oliva, M.; Pérez-Díaz, S.; Robles-López, S.; Abel-Schaad, D. Paleofire dynamics in Central Spain during the late Holocene: The role of climatic and anthropogenic Forcing. Land. Degrad. Dev. 2011. [Google Scholar] [CrossRef]
- Montiel Molina, C.; Galiana-Martín, L. Fire scenarios in Spain: A territorial approach to proactive fire management in the context of global change. Forests 2016, 7, 273. [Google Scholar] [CrossRef]
- Meyfroidt, P.; Lambin, E.F. Global Forest Transition: Prospects for an End to Deforestation. Annu. Rev. Environ. Resour. 2011, 36, 343–371. [Google Scholar] [CrossRef]
- Christopoulou, A.; Fulé, P.Z.; Andriopoulos, P.; Sarris, D.; Arianoutsou, M. Dendrochronology-based fire history of Pinus nigra forests in Mt Taygetos, Southern Greece. For. Ecol. Manag. 2013, 293, 132–139. [Google Scholar] [CrossRef]
- Sarris, D.; Christopoulou, A.; Angelonidi, E.; Koutsias, N.; Fulé, P.Z.; Arianoutsou, M. Increasing extremes of heat and drought associated with recent severe wildfires in southern Greece. Reg. Envrion. Chang. 2014, 14, 1257–1268. [Google Scholar] [CrossRef]
- Touchan, R.; Baisan, C.; Mitsopoulos, I.D.; Dimitrakopoulos, A.P. Fire history in European black pine (Pinus nigra Arn.) forests of the Valia Kalda, Pinus mountains, Greece. Tree-Ring Res. 2012, 68, 45–50. [Google Scholar] [CrossRef]
- Barbier, E.B.; Burgess, J.C.; Grainger, A. The forest transition: Towards a more comprehensive theoretical framework. Land Use Policy 2009, 27, 98–107. [Google Scholar] [CrossRef]
- Cervera, T.; Pino, J.; Marull, J.; Padró, R.; Tello, E. Understanding the long-term dynamics of forest transition: From deforestation to afforestation in a Mediterranean landscape (Catalonia, 1868-2005). 2016, in press. [Google Scholar] [CrossRef]
- Mather, A.S. The forest transition. Area 1992, 24, 367–379. [Google Scholar]
- Mather, A.S.; Needle, C.; Coull, J. From resource crisis to sustainability: The forest transition in Denmark. Int. J. Sustain. Dev. World Ecol. 1998, 5, 183–192. [Google Scholar] [CrossRef]
- Pagnutti, C.; Bauch, C.T.; Anand, M. Outlook on a Worldwide Forest Transition. PLoS ONE 2013, 8, e75890. [Google Scholar] [CrossRef] [PubMed]
- Redo, D.J.; Graub, H.R.; Aidea, T.M.; Clark, M.L. Asymmetric forest transition driven by the interaction of socio-economic development and environmental heterogeneity in Central America. Proc. Natl. Acad. Sci. USA 2012, 109, 8839–8844. [Google Scholar] [CrossRef] [PubMed]
- Singh, M.P. Forest transition and socio-economic development in India and their implications for forest transition theory. For. Policy Econ. 2015, 76, 65–71. [Google Scholar] [CrossRef]
- Yackulic, C.B.; Fagan, M.; Jain, M.; Jina, A.; Lim, Y.; Marlier, M.; Muscarella, R.; Adame, P.; DeFries, R.; Uriarte, M. Biophysical and socio-economic factors associated with forest transitions at multiple spatial and temporal scales. Ecol. Soc. 2011, 16, 1–22. [Google Scholar] [CrossRef]
- Moreira, F.; Viedma, O.; Arianoutsou, M.; Curt, T.; Koutsias, N.; Rigolot, E.; Barbati, A.; Corona, P.; Vaz, P.; Xanthopoulous, G.; et al. Landscape—Wildfire interactions in southern Europe: Implications for landscape management. J. Environ. Manag. 2011, 92, 2389–2402. [Google Scholar] [CrossRef] [PubMed]
- JRC-IES. Forest Fires in Europe; Scientific and Technical Research Series, ISSN 1018-5593; Office for Official Publications of the European Communities: Luxembourg, 2010. [Google Scholar]
- Arca, B.; Pellizzaro, G.; Duce, P.; Salis, M.; Bacciu, V.; Spano, D.; Ager, AA.; Finney, MA. Climate Change Impact on Fire Probability and Severity in Mediterranean Areas; Viegas, D., Ed.; VI International Conference on Forest Fire Research. 9; University of Coimbra: Coimbra, Portugal, 2010. [Google Scholar]
- Moriondo, M.; Good, P.; Durao, R.; Bindi, M.; Giannakopoulos, C.; Corte-Real, J. Potential impact of climate change on fire risk in the Mediterranean area. Clim. Res. 2006, 31, 85–95. [Google Scholar] [CrossRef]
- Ceccarelli, T.; Bajocco, S.; Perini, L.; Salvati, L. Urbanisation and Land Take of High-Quality Agricultural Soils—Exploring Long-term Land Use Changes and Land Capability in Northern Italy. Int. J. Environ. Res. 2014, 8, 181–192. [Google Scholar]
- Colantoni, A.; Ferrara, C.; Perini, L.; Salvati, L. Assessing Trends in Climate Aridity and Vulnerability to Soil Degradation in Italy. Ecol. Indic. 48, 599–604. [CrossRef]
- Karamesouti, M.; Detsis, V.; Kounalaki, A.; Vasiliou, P.; Salvati, L.; Kosmas, C. Land-use and land degradation processes affecting soil resources: Evidence from a traditional Mediterranean cropland (Greece). Catena 2015, 132, 45–55. [Google Scholar] [CrossRef]
- Munafò, M.; Salvati, L.; Zitti, M. Estimating soil sealing at country scale—Italy as a case study. Ecol. Indic. 2013, 26, 36–43. [Google Scholar] [CrossRef]
- Zambon, I.; Benedetti, A.; Ferrara, C.; Salvati, L. Soil Matters? A Multivariate Analysis of Socioeconomic Constraints to Urban Expansion in Mediterranean Europe. Ecol. Econ. 2018, 146, 173–183. [Google Scholar] [CrossRef]
- Harte, J. Human population as a dynamic factor in environmental degradation. Popul. Environ. 2007, 28, 223–236. [Google Scholar] [CrossRef]
- Kosmas, C.; Karamesouti, M.; Kounalaki, K.; Detsis, V.; Vassiliou, P.; Salvati, L. Land degradation and long-term changes in agro-pastoral systems: An empirical analysis of ecological resilience in Asteroussia—Crete (Greece). Catena 2016, 147, 196–204. [Google Scholar] [CrossRef]
- Salvati, L.; Zitti, M. Land degradation in the Mediterranean basin: Linking bio-physical and economic factors into an ecological perspective. Biota J. Biol. Ecol. 2005, 5, 67–77. [Google Scholar]
- Pausas, J.G. Changes in fire and climate in the eastern Iberian Peninsula (Mediterranean basin). Clim. Chang. 2004, 63, 337–350. [Google Scholar] [CrossRef]
- Schelhaas, M.J.; Nabuurs, G.J.; Schuck, A. Natural disturbances in the European forests in the 19th and 20th centuries. Glob. Chang. Biol. 2003, 9, 1620–1633. [Google Scholar] [CrossRef]
- Thompson, J.N. The Geographic Mosaic of Coevolution; University of Chicago Press: Chicago, IL, USA, 2005. [Google Scholar]
- Keeley, J.E. Fire intensity, fire severity and burn severity: A brief review and suggested usage. Int. J. Wildland Fire 2009, 18, 116–126. [Google Scholar] [CrossRef]
- Salvati, L.; Perini, L.; Sabbi, A.; Bajocco, S. Climate aridity and land use changes: A regional-scale analysis. Geogr. Res. 2012, 50, 193–203. [Google Scholar] [CrossRef]
- Colantoni, A.; Mavrakis, A.; Sorgi, T.; Salvati, L. Towards a ’polycentric’ landscape? Reconnecting fragments into an integrated network of coastal forests in Rome. Rendiconti Accademia Nazionale dei Lincei 2015, 26, 615–624. [Google Scholar] [CrossRef]
- De Meo, I.; Ferretti, F.; Paletto, A.; Cantiani, M.G. An approach to public involvement in forest landscape planning in Italy: A case study and its evaluation. Ann. Silvic. Res. 2017, 41, 54–66. [Google Scholar]
- Moreira, F.; Rego, F.C.; Ferreira, P.G. Temporal (1958–1995) pattern of change in a cultural landscape of northwestern Portugal: Implications for fire occurrence. Landsc. Ecol. 2001, 16, 557–567. [Google Scholar] [CrossRef]
- Tomao, A.; Quatrini, V.; Corona, P.; Ferrara, A.; Lafortezza, R.; Salvati, L. Resilient landscapes in Mediterranean urban areas: Understanding factors influencing forest trends. Environ. Res. 2017, 156, 1–9. [Google Scholar] [CrossRef] [PubMed]
- Carreiras, M.; Ferreira, A.J.D.; Valente, S.; Fleskens, L.; Gonzales-Pelayo, Ó.; Rubio, J.L.; Ritsema, C.J. Comparative analysis of policies to deal with wildfire risk. Land Degrad. Dev. 2014, 25, 92–103. [Google Scholar] [CrossRef]
- Biasi, R.; Colantoni, A.; Ferrara, C.; Ranalli, F.; Salvati, L. In-between Sprawl and Fires: Long-term Forest Expansion and Settlement Dynamics at the Wildland-Urban Interface in Rome, Italy. Int. J. Sustain. Dev. World Ecol. 2015, 22, 467–475. [Google Scholar] [CrossRef]
- Salvati, L.; Zitti, M.; Perini, L. Fifty years on: Long-term patterns of land sensitivity to desertification in Italy. Land Degrad. Dev. 2016, 27, 97–107. [Google Scholar] [CrossRef]
- Ferrara, A.; Salvati, L.; Sabbi, A.; Colantoni, A. Soil resources, land cover changes and rural areas: Towards a spatial mismatch? Sci. Total Environ. 2014, 478, 116–122. [Google Scholar] [CrossRef] [PubMed]
- Salvati, L.; Petitta, M.; Ceccarelli, T.; Perini, L.; Di Battista, F.; Venezian Scarascia, M.E. Italy’s renewable water resources as estimated on the basis of the monthly water balance. Irrig. Drain. 2008, 57, 507–515. [Google Scholar] [CrossRef]
- Salvati, L.; Zitti, M.; Ceccarelli, T. Integrating economic and environmental indicators in the assessment of desertification risk: A case study. Appl. Ecol. Environ. Res. 2008, 6, 129–138. [Google Scholar] [CrossRef]
- Serra, P.; Vera, A.; Tulla, A.F.; Salvati, L. Beyond urban-rural dichotomy: Exploring socioeconomic and land-use processes of change in Spain (1991-2011). Appl. Geogr. 2014, 55, 71–81. [Google Scholar] [CrossRef]
- Stephens, S.L.; McIver, J.D.; Boerner, R.E.J.; Fettig, C.J.; Fontaine, J.B.; Hartsough, B.R.; Kennedy, P.L.; Schwilk, D.W. The effects of forest fuel-reduction treatments in the United States. Biosciences 2012, 62, 549–560. [Google Scholar] [CrossRef]
- Colantoni, A.; Grigoriadis, E.; Sateriano, A.; Venanzoni, G.; Salvati, L. Cities as selective land predators? A Lesson on Urban Growth, (Un)effective planning and Sprawl Containment. Sci. Total Environ. 2016, 545–546, 329–339. [Google Scholar] [CrossRef] [PubMed]
- Kallis, G. Socio-environmental coevolution: Towards an analytical approach. Int. J. Sustain. Dev. World Ecol. 2007, 14, 9–19. [Google Scholar] [CrossRef]
- Levy, M.Jr. Modernization and the Structures of Societies; Princeton University Press: Princeton, NJ, USA, 1966. [Google Scholar]
- Myrskyla, M.; Kohler, H.P.; Billari, F. Advances in development reverse fertility declines. Nature 2009, 460, 741–743. [Google Scholar] [CrossRef] [PubMed]
- Nelson, R.R. Bringing institutions into evolutionary growth theory. J. Evol. Econ. 2002, 12, 17–28. [Google Scholar] [CrossRef]
- Pili, S.; Grigoriadis, E.; Carlucci, M.; Clemente, M.; Salvati, L. Towards Sustainable Growth? A Multi-criteria Assessment of (Changing) Urban Forms. Ecol. Indic. 2017, 76, 71–80. [Google Scholar] [CrossRef]
- Cuadrado Ciuraneta, S.; Durà Guimerà, A.; Salvati, L. Not only tourism: Unravelling suburbanization, second-home expansion and “rural” sprawl in Catalonia, Spain. Urban Geogr. 2017, 38, 66–89. [Google Scholar] [CrossRef]
- Duvernoy, I.; Zambon, I.; Sateriano, A.; Salvati, L. Pictures from the Other Side of the Fringe: Urban Growth and Peri-urban Agriculture in a Post-industrial City (Toulouse, France). J. Rural Stud. 2018, 57, 25–35. [Google Scholar] [CrossRef]
- Recanatesi, F.; Clemente, M.; Grigoriadis, S.; Ranalli, F.; Zitti, M.; Salvati, L. A fifty-years sustainability assessment of Italian Agro-forest Districts. Sustainability 2016, 8, 32. [Google Scholar] [CrossRef]
- Salvati, L.; Carlucci, M. The economic and environmental performances of rural districts in Italy: Are competitiveness and sustainability compatible targets? Ecol. Econ. 2011, 70, 2446–2453. [Google Scholar] [CrossRef]
- Salvati, L.; Gargiulo, V.; Rontos, K.; Sabbi, A. Latent Exurban Development: City Expansion Along the Rural-To-Urban Gradient in Growing and Declining Regions of Southern Europe. Urban Geogr. 2013, 34, 376–394. [Google Scholar] [CrossRef]
- Stockdale, A. Contemporary and ‘Messy’ Rural In-migration Processes: Comparing Counterurban and Lateral Rural Migration. Popul. Space Place 2016, 22, 599–616. [Google Scholar] [CrossRef]
- Carbonaro, C.; Leanza, M.; McCann, P.; Medda, F. Demographic decline, population aging, and modern financial approaches to urban policy. Int. Reg. Sci. Rev. 2016. [CrossRef]
- Discroll, D.A.; Bodea, M.; Bradstockd, R.A.; Keithe, D.A.; Penmand, T.D.; Priced, O.F. Resolving future fire management conflicts using multi-criteria decision making. Conserv. Biol. 2015, 30, 196–205. [Google Scholar]
- Rudel, T.K. Tree farms: Driving forces and regional patterns in the global expansion of forest plantations. Land Use Policy 2009, 26, 545–550. [Google Scholar] [CrossRef]
- Galiana-Martín, L.; Montiel-Molina, C. Landscape changes and wildfire behaviour: New fire scenarios in Spain. Landscape 2011, 9, 13. [Google Scholar]
- Zambon, I.; Colantoni, A.; Cecchini, M.; Mosconi, E.M. Rethinking sustainability within the viticulture realities integrating economy, landscape and energy. Sustainability 2018, 10, 320. [Google Scholar] [CrossRef]
- Colantoni, A.; Marucci, A.; Monarca, D.; Pagniello, B.; Cecchini, M.; Bedini, R. The risk of musculoskeletal disorders due to repetitive movements of upper limbs for workers employed to vegetable grafting. J. Food Agric. Environ. 2012, 10, 14–18. [Google Scholar]
- Cecchini, M.; Zambon, I.; Pontrandolfi, A.; Turco, R.; Colantoni, A.; Mavrakis, A.; Salvati, L. Urban sprawl and the ‘olive’landscape: Sustainable land management for ‘crisis’ cities. GeoJournal 2018, 84, 237–255. [Google Scholar]
- Zambon, I.; Sabbi, A.; Schuetze, T.; Salvati, L. Exploring forest ‘fringescapes’: Urban growth, society and swimming pools as a sprawl landmark in coastal Rome. Rendiconti Lincei 2015, 26, 159–168. [Google Scholar] [CrossRef]
- Jain, P.; Wang, X.; Flannigan, M.D. Trend analysis of fire season length and extreme fire weather in North America between 1979 and 2015. Int. J. Wildland Fire 2018, 26, 1009–1020. [Google Scholar] [CrossRef]


| Predictor | Number of Forest Fires | Burnt Area | Average Fire Size | ||||||
|---|---|---|---|---|---|---|---|---|---|
| b | SE | t | b | SE | t | b | SE | t | |
| BAR | 0.462 | 0.11 | 4.2 ** | ||||||
| GRA | 0.460 | 0.11 | 4.2 ** | ||||||
| OTH | 0.313 | 0.14 | 2.26 * | ||||||
| MAR | 0.893 | 0.35 | 2.58 * | ||||||
| BIR | 0.503 | 0.27 | 3.88 * | ||||||
| LEM | 0.748 | 0.19 | 1.83 * | ||||||
| Adj-R2 | 0.716 | 0.079 | 0.636 | ||||||
| D–W test | 2.11 | 2.11 | 1.91 | ||||||
© 2019 by the authors. Licensee MDPI, Basel, Switzerland. This article is an open access article distributed under the terms and conditions of the Creative Commons Attribution (CC BY) license (http://creativecommons.org/licenses/by/4.0/).
Share and Cite
Carlucci, M.; Zambon, I.; Colantoni, A.; Salvati, L. Socioeconomic Development, Demographic Dynamics and Forest Fires in Italy, 1961–2017: A Time-Series Analysis. Sustainability 2019, 11, 1305. https://doi.org/10.3390/su11051305
Carlucci M, Zambon I, Colantoni A, Salvati L. Socioeconomic Development, Demographic Dynamics and Forest Fires in Italy, 1961–2017: A Time-Series Analysis. Sustainability. 2019; 11(5):1305. https://doi.org/10.3390/su11051305
Chicago/Turabian StyleCarlucci, Margherita, Ilaria Zambon, Andrea Colantoni, and Luca Salvati. 2019. "Socioeconomic Development, Demographic Dynamics and Forest Fires in Italy, 1961–2017: A Time-Series Analysis" Sustainability 11, no. 5: 1305. https://doi.org/10.3390/su11051305