Article

Effectiveness of Arguments Used in the Creation of Protected Areas of Sustainable Use in Brazil: A Case Study from the Atlantic Forest and Cerrado

by
Mariane Paulina Batalha Roque
1,*,
José Ambrósio Ferreira Neto
1,
André Luis Lopes de Faria
2,
Fernanda Machado Ferreira
1,
Thais Helena Teixeira
1 and
Lívia Lopes Coelho
3
1
Department of Rural Economy, Federal University of Viçosa, Viçosa MG 36570-900, Brazil
2
Department of Geography, Federal University of Viçosa, Viçosa MG 36570-900, Brazil
3
Independent Researcher, 2100 Copenhagen, Denmark
*
Author to whom correspondence should be addressed.
Sustainability 2019, 11(6), 1700; https://doi.org/10.3390/su11061700
Submission received: 11 February 2019 / Revised: 3 March 2019 / Accepted: 13 March 2019 / Published: 21 March 2019
(This article belongs to the Special Issue Sustainability, Biodiversity, and Conservation)

Abstract

:
Studies on the effectiveness of the discourse motivating the creation of protected areas (PAs) and their empirical reality are scarce. The lack of knowledge in this area affects programs and policies on the maintenance and creation of protected areas. Thus, we investigated this matter using the case study of the Nascente Geraizeiras Sustainable Development Reserve (NGSDR) in Minas Gerais State, Brazil. The reserve comprises a transition area between Cerrado and the Atlantic Forest, two critical biomes in the world of biodiversity and the only two hotspots in Brazil. Changes in land use were identified over a period of 30 years, from 1987 to 2017, based on a compilation of the arguments associated with the creation of the PA, geographic information system (GIS) techniques, remote sensing (RS) data, and landscape ecology indices. Seven types of land use were identified using Random Forest classifier R software: native forest, silviculture, pasture, bare soil, rocky outcrop, watercourses, and agriculture. The overall mean accuracy of the classification was 90% for all five periods. The results demonstrated that the creation of protected areas is supported by contexts of land use still based on traditional. The case study showed the discourse served as a fundamental strategy in the beginning of the mobilization that culminated in the creation of the NGSDR, in the containment of forestry, in an increase in native forest areas, and in reduced fragmentation, leading to an improvement in the conservation status of the landscape. The present study encourages future researchers to apply the evaluated approach and demonstrates its potential in assessing the formulation of programs and policies on protected areas worldwide, providing valid indicators for the improvement of ecosystem services.

1. Introduction

An acknowledgment of the finiteness of natural resources has caused modifications in conservation and its purpose [1]. These changes refer mainly to the relationship between society and the forms of appropriation of natural resources [2,3,4]. Different sectors of society have increased efforts concerning environmental, social, and economic instances to emphasize the importance of these resources in the sustainability of development [5,6,7,8].
The creation of protected areas (PAs) is one of the primary mechanisms for the conservation of global biodiversity [9,10,11], and they cover around 14% of the land surface in the globe [10]. Brazil has been allocating large amounts of land for conservation purposes, and currently about 11% of its national territory is covered by PAs [12]. Although recent estimates have shown an exponential increase in the number of PAs, it is the consensus that PAs alone cannot guarantee the provision of essential ecosystem services for biodiversity protection and the maintenance of the livelihoods of traditional populations [13]. The effective management of these areas is crucial for the conservation of biodiversity, and therefore the number of studies discussing real factors influencing the effectiveness of the management of PAs worldwide has increased [10]. Moreover, several studies have aimed to monitor the changes occurring in PA landscapes and the advance of deforestation [14].
PAs are established in Brazil by the Brazilian environmental protection policies, which includes the National System of Conservation Units (NSCU). In Brazil, PAs are called conservation units (CUs) and are subdivided into two groups: integral protection (IP), which allows only the indirect use of natural resources; and sustainable use (SU), which combines conservation of nature with the sustainable exploitation of natural resources [15,16,17]. Conservation units for sustainable use (CUSUs) are emerging as a model compatible with the new demands of conservation and sustainable development. Differently from the nature intact model, which prevents direct use of the land, CUSUs reduce pressures on biodiversity and prioritize people as part of the ecosystem [1,17,18].
The real factors underlying the management of PAs have been discussed in some important studies in different locations [10,19]. However, the reasons supporting the creation of PAs in Brazil are still little known. Therefore, the analyses of the arguments used as justification for the creation of PAs and their congruence with reality are necessary to fill this gap. Knowledge on the process of creating PAs provides valid indicators for the improvement of ecosystem services. The study obtained supports future research to understand the effectiveness of the discourse used to create PAs in different contexts.
The arguments used in the process of creating CUSUs usually concern maintenance of the livelihoods of traditional populations, based on self-sustaining exploitation and addressing environmental issues [15]. In addition, environmental debates tend to assume different connotations depending on the local context.
In the Brazilian Amazon, issues related to the creation of CUSUs are commonly associated with resistance, exploratory activities, and the conversion of native forest areas [20,21]. In the Atlantic Forest, the control of irregular occupations and the protection of forest remnants are the main issues [21]. The debates in Cerrado relate to land issues and the conversion of forest areas into pasture, agriculture, and silviculture (especially of Eucalyptus sp.) [21]. In coastal regions, concerns are often associated with combating predatory fishing and real estate speculation, regardless of the biome [15,21,22]. Environmental arguments related to the creation of protected areas generally refer to conflicts at the local level, but also address issues associated with the broader development context in which those territories are located. However, scientific confirmation is lacking on whether the public arguments used to justify the creation of CUSUs are consistent with their empirical reality.
In order to broaden the debate on the creation of PAs, this article provides an approach to the actual effectiveness of PAs in a critical area for biodiversity conservation due to its high biodiversity and strong anthropogenic pressure: Thus it has great importance worldwide [23]. The objective of this study was to evaluate the effectiveness of the arguments used in the creation of PAs using the Nascente Geraizeiras Sustainable Development Reserve (NGSDR) as a case study. Therefore, we analyzed changes in the landscape over the last 30 years, using geographic information systems (GIS), remote sensing data (RS), and landscape ecology indexes. This case study was selected because it is part of the only two areas that are hotspots for the conservation of global biodiversity in Brazil, the Atlantic Forest, and Cerrado.

2. Materials and Methods
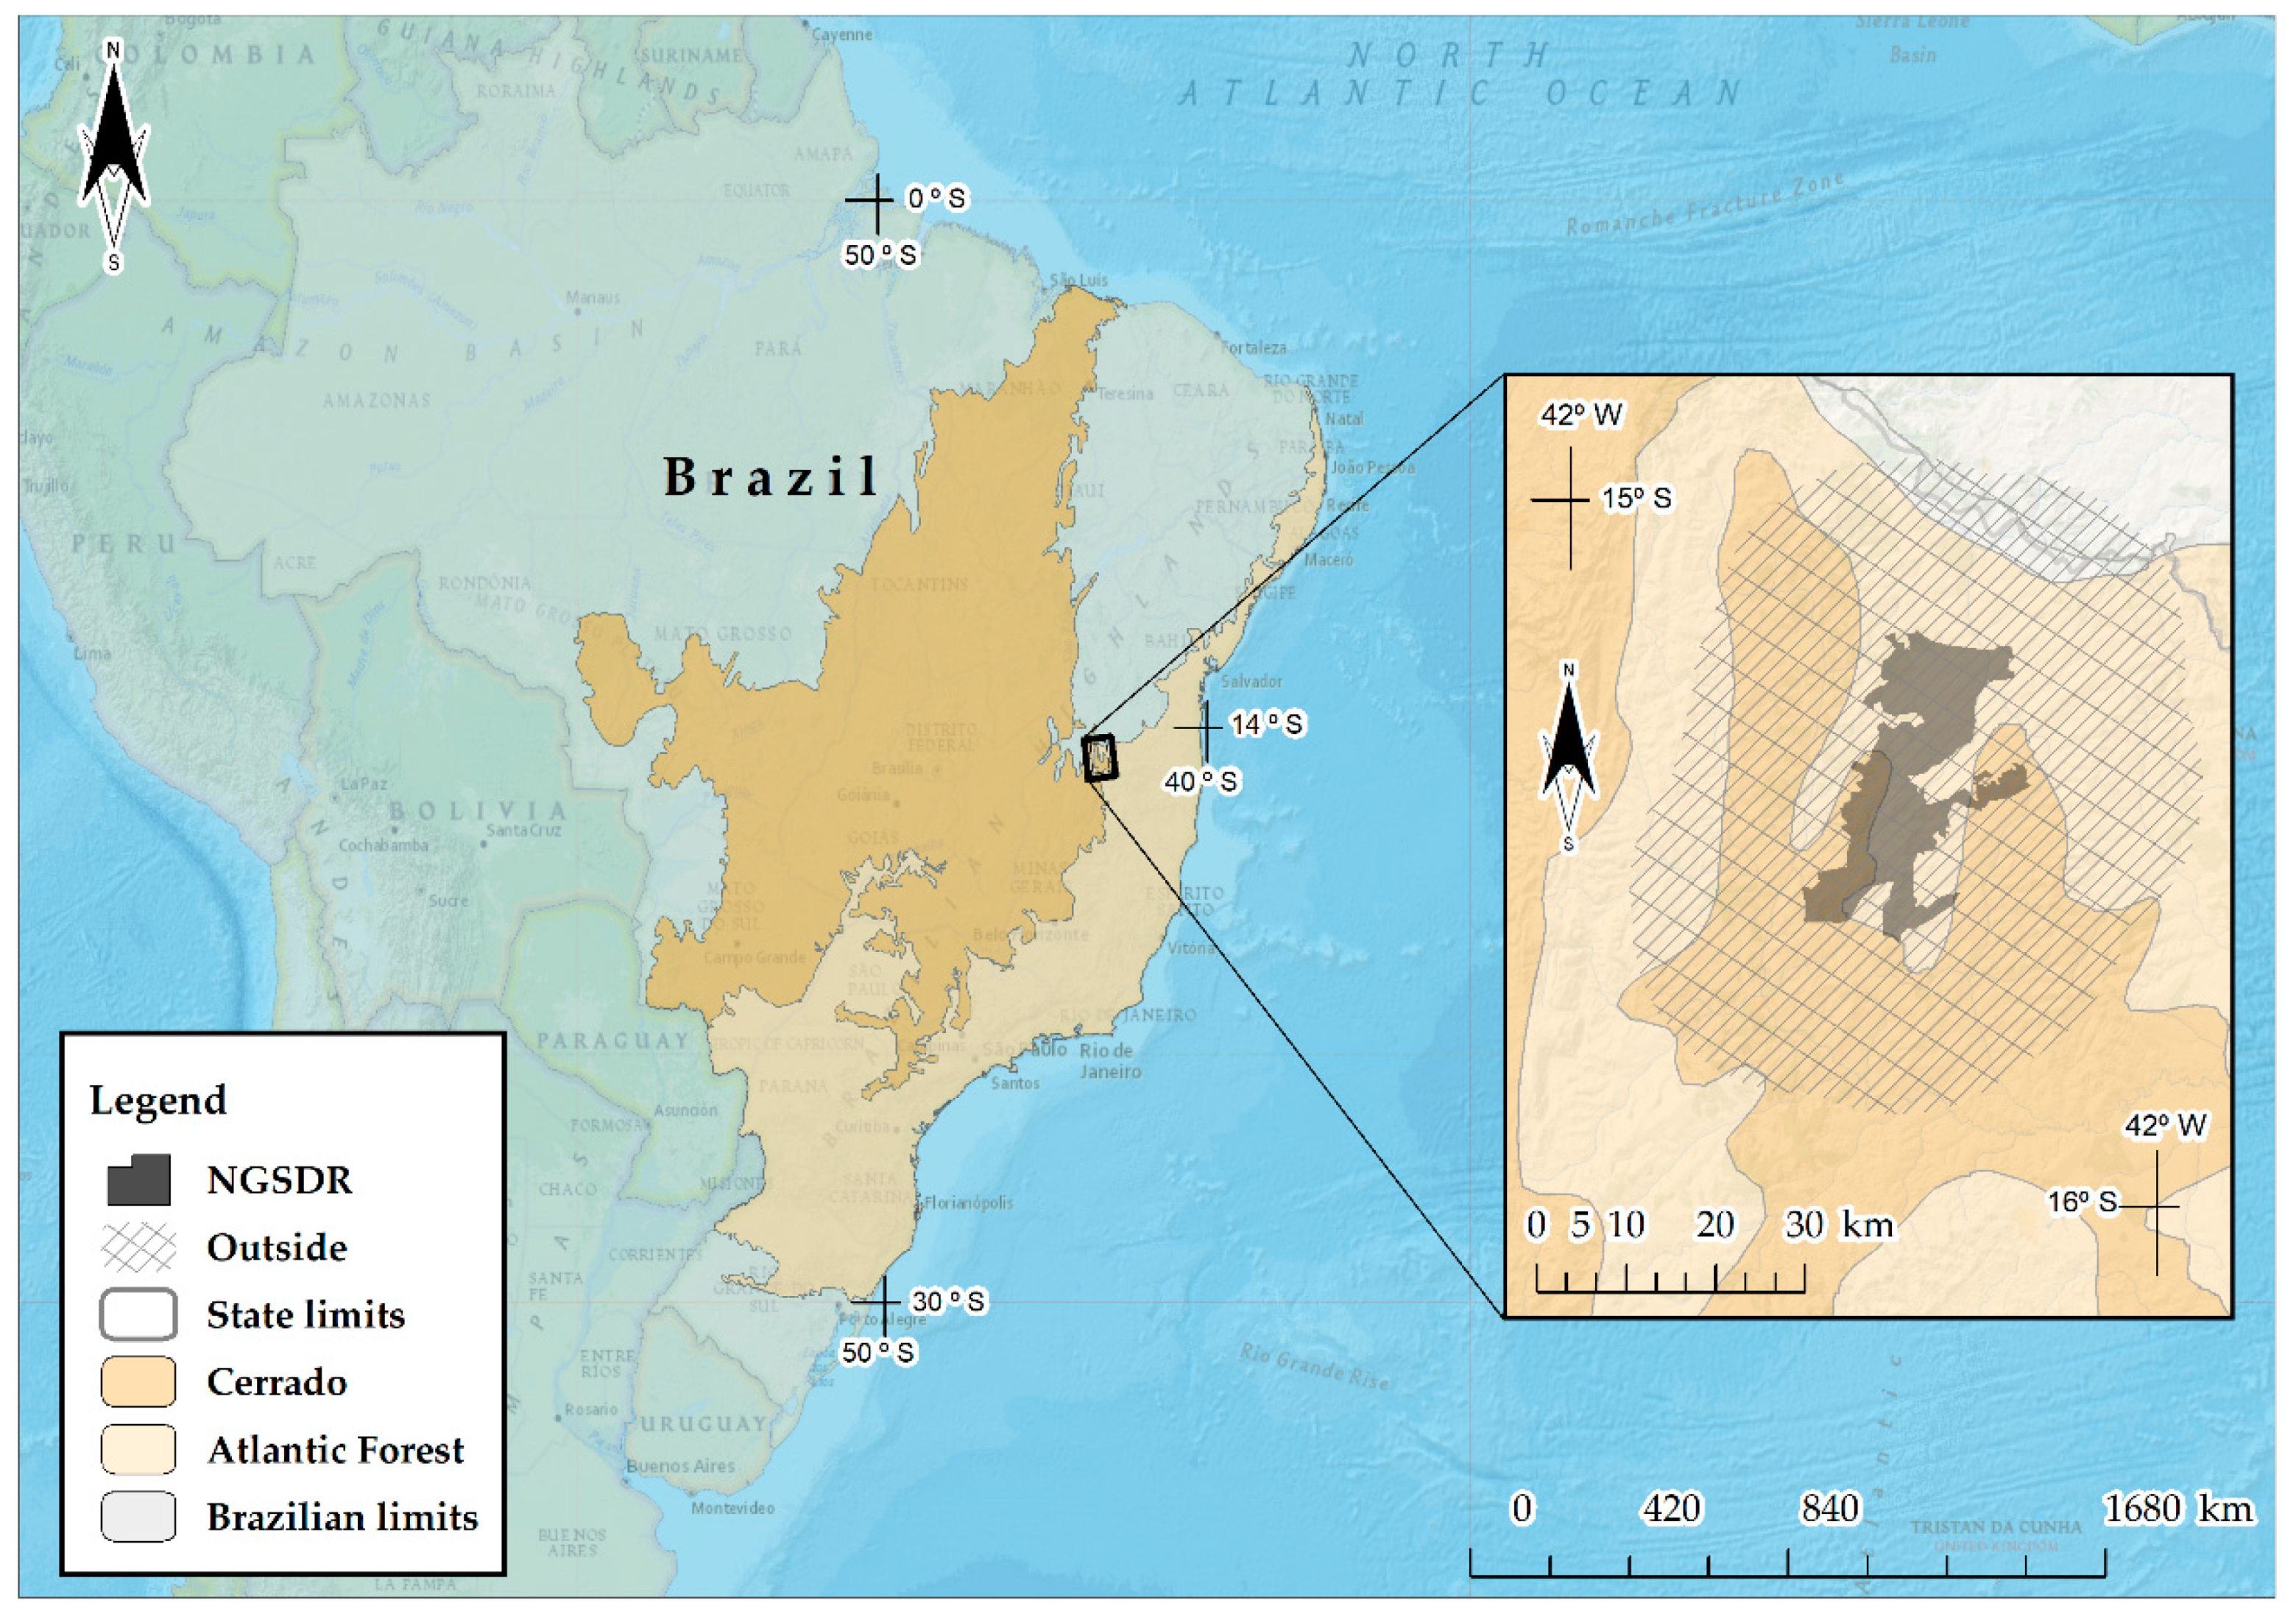
2.1. Study Area

The NGSDR is located in the microregion of Salinas, north of Minas Gerais State, Brazil, and comprises the municipalities of Montezuma, Rio Pardo de Minas, and Vargem Grande do Rio Pardo (Figure 1). It integrates 33 traditional communities, totaling 502 families. The main productive activities within the NGSDR are vegetal extraction and livestock farming based on socioecological systems. The reserve occupies 38,177 hectares around the coordinates 15°30′ S latitude and 42°40′ W longitude [24,25]. The area named as outside comprises the NGSDR plus a 20-km buffer around its borders, totaling an area of 392,176.67 ha. The vegetation is a transition between Cerrado and Atlantic forest biomes, considered to be hotspots for the conservation of the world’s biodiversity [26,27]. The NGSDR was created by Decree S/N of 13 October 2014, which aimed to guarantee the conservation of springs, the preservation of extractive areas, the protection of biodiversity, and the right to land in promoting development for the territory [24,25].

History of the Creation of the NGSDR

Bibliographical research was conducted using the arguments associated with the creation of the NGSDR. Moreover, we used a compilation of a historical database based on a comprehensive review of recent literature, official documents, newspapers, trade union websites, and nongovernmental organizations (NGOs) [28,29].

2.2. Satellite Imagery and Data Processing

Three images from the sensors on board the Land Remote Sensing Satellite (LANDSAT 5 and 8) were obtained from different satellites due to the orbit period of each one. Images from the drought months (June to August) were selected due to lower interference by clouds [30,31]. LANDSAT satellite imagery represents the oldest and longest series of data, being the most used in studies aiming to determine changes in land use and coverage [32,33]. Three scenes were used for each year studied (1987, 1997, 2007, 2014, and 2017), totaling 15 scenes collected in the dry season. The selection of the scenes was based on visual examination using images already corrected atmospherically and converted to surface reflectance, which was processed on demand by the U.S. Geological Survey (USGS) through Earth Resources Observation and Science (EROS) [34,35,36,37,38].

Classification of Land Cover

To portray developments in land usage patterns and land occupation during the study period (1987, 1997, 2007, 2014, and 2017), we performed a “supervised” classification using the classification algorithm Random Forest in Rstudio software. We considered the following land use classes: rock, water bodies, bare soil, native forest, silviculture, agriculture, pasture, and highly degraded areas. Later, the pasture and highly degraded areas classes were merged and denominated pasture.
Before the classification, the database was prepared, and the samples were collected in the software ArcGis® 10.5.1 (Esri, Redlands, CA, USA). LANDSAT 5 and LANDSAT 8 settings were (i) redesigned for the Southern Hemisphere, designed for SIRGAS 2000, and georeferenced to allow for correct overlapping of images with the vector databases; (ii) followed by the process of “mosaic by equalization of histograms.” The equalization allowed for reducing the hue difference between the joined scenes significantly, leading to homogenization and standardization of the colors [39]. Furthermore, the mosaics generated for each year were submitted to (iii) trimming the perimeter of the study area, obtained by IBGE [40] and ICMBio [25], and (iv) a composition of spectral bands: RGB 5 (Mid IR), 4 (Near IR), 3 (Red); RGB 4 (Near IR), 3 (Red), 2 (Green); RGB 3 (Red), 2 (Green), 1 (Blue), corresponding to false color, infrared, and natural color, respectively, using the LANDSAT 5 satellite images, and RGB 6 (SWIR1), 5 (NIR), 4 (Red); RGB 5 (NIR), 4 (Red), 3 (Green); and RGB 4 (Red), 3 (Green), 2 (Blue), corresponding to false color, infrared, and natural color, respectively, using LANDSAT 8 [38,41,42].
Each year, 200 samples were collected, 25 samples per class. Each polygon sampled corresponded to an area of approximately 1.08 ha, and about 12 pixels per sample. The polygons were collected rigorously, respecting architecture and sample size. The samples were collected using high-resolution images from Google Earth, which allowed for greater reliability of the classification [43,44].
In addition to the sampled polygons for each year, 22 variables were generated, which were added to the bands, totaling 28 variables. In total, 15 morphometric covariates were obtained from the interpolation of the Shuttle Radar Topography Mission (SRTM) digital elevation model (SDTM) through the System for Automated Geoscientific in Saga GIS software. The variables were designated as follows: (1) Analytical Calculation of Hills, (2) Capitation Area, (3) Convergence Index, (4) Cross-Curvature, (5) Elevation, (6) Longitudinal Curvature, (7) Soil Loss Factor, (8) Positions of Inclination, (9) Terrain Slope in Radians, (10) Topographic Index of Position, (11) Robustness Land Index, (12) Topographic Moisture Index, (13) Depth of Vales, (14) Wind Effect Index, and (15) Wind Exposure Index. The seven variables obtained from Quantum Gis software were (16) Horizontal Distance of Hydrography, (17) Vertical Hydrograph Distance, (18) Distance from the Pivots, (19) Normalized Difference Vegetation Index (NDVI), (20) Normalized Water Difference Index (NDWI), (21) Soil Adjusted Vegetation Index (SAVI), and (22) Normalized Humidity Difference Index (NDMI). The six LANDSAT-5 (TM) bands were (23i) Band 1 Blue (045–0.52 μm), (24i) Band 2 Green (0.52–0.60 μm), (25i) Band 3 Red (0.63–0.69 μm), (26i) Band 4 Infrared Near (0.76–0.90 μm), (27i) Medium Infrared Band 5 (1.55–1.75 μm), and (28i) Band 7 Infrared Medium (2.08–2.35 μm); and from LANDSAT-8 (OLI), (23ii) Band 2 Blue (0.45–0.51 μm), (24ii) Band 3 Green (0.53–0.59 μm), (25ii) Band 4 Red (0.64–0.67 μm), (26ii) Band 5 Infrared Near (NIR) (0.85–0.88 μm), (27ii) Band 6 SWIR 1 (1.57–1.65 μm), and (28ii) Band 7 SWIR 2 (2.11–2.29 μm) [45,46].
The data were inserted into the Random Forest classifier to generate maps of land use and occupation. Within the statistical software, a routine was developed containing all the steps of the supervised classification, in the form of a script (results not shown) that could be adjusted to the local parameters and applied to other areas [46,47,48,49].

2.3. Accuracy of Assessment

After sorting, the rasters files generated for each year underwent a “filtering” process, which allowed for the elimination of isolated pixels [38,41,50]. Then, qualitative and quantitative postclassification procedures were generated. The qualitative classification was based on a visual approach to ascertain and to correct manually the possible errors caused by the similarity in the spectral response of the classes, based on the high-resolution images from Google Earth [41]. The quantitative approach was based on a calculation of the global and class accuracy indices, to assess the level of agreement and discrimination of the targets more accurately [51,52,53,54,55,56].

2.4. Landscape Indices

Evaluations of the forest fragments were used from the shapefile file generated for each year corresponding to the native vegetation class. Forest fragments were quantified and grouped in small (<5 ha), medium (between 5 and 50 ha), and large (>50 ha) sizes, as well as total fragments over the years [38,57]. Afterward, we calculated the metrics: mean patch size (MPS), number of patches (NP), edge density (ED), and weighted mean shape index (AWMSI), according to the formulae by Paudel and Yuan [58], through the Patch Analyst 4.0 extension of the software ArcGis ® 10.5.1 [59,60].

3. Results

3.1. Historical Analysis of the Creation of the NGSDR

Table 1 summarizes the public, economic, and environmental arguments used to support the creation of the NGSDR. The data obtained in this study evidenced that the beginning of the 2000s was a milestone for social mobilization demanding the creation of the NGSDR. In 2002, several lawsuits were issued against silviculture companies to prevent deforestation of the areas used by traditional communities as a means of subsistence, causing intense conflicts over the years. Later, in 2014, the residents of the local communities occupied the areas used by silviculture companies and performed a hunger and thirst strike, gathering in front of the Palácio do Planalto, in Brasília, Brazil, which culminated in the creation of the reserve. The actions and claims of communities living in that region had the support of nongovernmental organizations (NGOs), other traditional Cerrado communities, civil society, academics, and local authorities [25,61,62].
The compilation of arguments were in agreement with valuations of the ways of life of the traditional populations in the region. The maintenance of extractive activities and animal husbandry has historically been carried out in a sustainable manner, as have the defense of the recognition of regional cultural wealth, gender issues, and guarantees of access to land and the resumption of use of territory [25]. In addition to socioeconomic and cultural arguments, environmental issues were also highlighted in the fight against the conversion of the native forest to eucalyptus (Eucalyptus sp.) monoculture and the drying of watercourses and springs [61,62,63,64,65,66,67].

3.2. Mapping of the Changes in Land Use

Table 2 shows land use and occupation maps of the NGSDR during five evaluation periods between 1987 and 2017. The area of each class in each period is summarized in Figure 2. The area of native forest in the NGSDR remained constant between 1987 and 2007, but increased 3.8% over the last 10 years (2007–2017), currently occupying 60% of the reserve’s area. Outside, the forest area covers an average of 58% of the land, without any increase in vegetation in the last years.
Silviculture areas in the reserve had the highest annual rate of change compared to other classes, representing 0% in 1987, increasing to 10% in 1997, and decreasing in subsequent years (2007, 2014, and 2017), maintaining an average of 1%. In the surrounding area, silviculture increased from 2% in 1987 to 15.7% in 1997, remaining at 5.5% in the last three periods. On the other hand, pasture areas in the NGSDR decreased from 42% in 1987 to 33% in 1997, assuming an average of 38.5% in the last three periods. In the surrounding areas, the same pattern was observed: In 1987, pasture represented 38% of the area, reducing to 25% in 1997 and remaining at an average of 34.6% for the last 10 years. Agriculture areas were only identified around the NGSDR, occupying approximately 0.5% of the land, and did not undergo great oscillations between 1987 and 2017.
Water in the vicinity of the reserve occupied an area of 0.1% of the total during all the evaluated periods. Within the NGSDR, the percentage of land occupation by water was very close to zero. The percent of bare soil land, considering the NGSDR and its surroundings, were 1.5%, 0.6%, 0.5%, 0.6%, and 0.3% for 1897, 1997, 2007, 2014, and 2017, respectively. Rock outcrops occupied around 0.1% of the land throughout the study period.

3.3. Forest Fragmentation Analysis

Table 3 shows the metric values for the period from 1987 to 2017. Four landscape metrics were calculated from the native forest. We observed an uneven fragmentation pattern in the study area, with the presence of smaller fragments in its eastern sector. The class containing smaller fragments represented 1% of the landscape, whereas medium and large fragments represented 4% and 95%, respectively.
The metrics for the number of forest fragments (NP) and their average size (MPS) revealed a reduction in landscape fragmentation within the NGSDR and in its vicinity from 1987 to 2007, followed by an increase from 2014 to 2017, as presented in Table 3. However, NP and MPS calculated according to the size of the fragments had different behaviors. Whereas medium and large fragments maintained a pattern compatible with that observed for total fragments regardless of size, small forest fragments exhibited a considerably reduced NP and increased MPS (Table 3).
Edge density (ED) was stable throughout the years, and the size of the forest fragments influenced its response. Small, medium, and large-size fragments had an average ED of 0.2, 5.1, and 50.6, respectively. The area-weighted mean index (AWMSI) was proportional to the size of the fragments. The mean values were 1.9, 2.1, and 23.8 for small, medium, and large fragments, respectively.

3.4. Validation of the Results

The general precision of the classifications averaged 99% from 1987 to 2017. The kappa index for the years 1987 TM, 1997 TM, 2007 TM, 2014 OLI, and 2017 OLI were 98.5%, 98%, 99%, 99.6%, and 99.7%, respectively (Figure 3). Accuracy ratings by grade ranged from 86% to 1% (Figure 3).

4. Discussion

A review of the case study and the use of GIS, SR, and landscape ecology indices for the period 1987–2017 enabled an understanding of the congruence between the arguments and reality associated with the creation of the NGSDR and a verification of the changes in land use and occupation. Several scientific studies have evidenced the importance of monitoring landscape changes using geotechnology to provide precise landscape measurements [32,41,68,69]. In this context, images from the satellite Landsat are the most used worldwide to determine land use and occupation patterns [54,70,71,72]. This study covered a wide range of physical variables due to the uniqueness of the study area. The approach used in this case study proved to be efficient and can be adapted for use in future studies in other protected areas. Moreover, it has the potential to affect the formulation of programs and policies on preservation and sustainable use around the globe.
Silviculture was the land use class with the most expressive transformations through the years. Between 1987 and 1997, silviculture represented an exponential increase of 685%, followed by a decrease of −184% (2007 to 2017) in the surroundings of the reserve. Within the NGSDR, it represented an exponential increase of 9.700%, followed by a decrease of −950% (2007 to 2017).
Native vegetation areas increased within the NGSDR, and deforestation did not advance in its surroundings, which indicates that there is no significant pressure for the conversion of the native forest, as suggested by the discourse [61,73,74]. The increase in vegetation in the NGSDR could be related to the incentive to maintain the traditional forms of land use historically practiced by the population as a means of subsistence, especially since the beginning of the 2000s, when there was an emergence of initiatives to reduce pressure on natural resources and create a sustainable reserve [61,62,63,64,65,66,67].
Pasture areas reduced from 1987 to 1997 and increased in subsequent years (2007 to 2017) due to conversions to other types of use. This study indicated silviculture was primarily responsible for the conversion of pasture areas. This result is particularly important because it disagrees with the environmental arguments employed in the creation of the NGSDR denouncing the modification of areas of native vegetation to silviculture [73,74,75].
Agriculture areas, especially irrigated ones, were practically unchanged for 30 years, and occurred only in the surroundings of the NGSDR. However, some existing small-scale agriculture areas could not be mapped due to the resolution of the images from the Landsat satellite, which did not allow for the identification of the targets [32].
Small natural water bodies and artificial lakes covered a relatively small area of the landscape, and they were mainly destined for livestock farming and irrigated agriculture [67]. However, this modest expression may have been influenced by the dates of the images, which were taken during the dry period, since the accuracy of the class was notoriously high [41]. Moreover, watercourses only appeared near areas of intensive agriculture, suggesting that other uses may affect them as much as silviculture, which may lead to water scarcity.
This study provided an approach to analyzing the coherence between the environmental arguments used in defense of the creation of protected areas of sustainable use and the realities in which they are inserted. The analyses show their importance as a result of mobilization and as a protected area in curbing the expansion of silviculture. However, there were contradictions in the environmental issues used to justify their creation, since the conversion of areas of silviculture did not occur within the native forest, but in the pasture areas, as evidenced by the data presented in Table 1. This fact does not diminish the importance of the NGSDR, although it may put the impacts usually associated with this activity in relative terms. Moreover, pasture was a very expressive land use class in the reserve’s landscape: It inevitably produces large impacts when not well managed.
The choice of metrics was based on recent literature [58,76,77] addressing the evolution, composition, and structure of the landscape in different contexts, especially in protected areas [77]. Nevertheless, this study presents a quantitative analysis of the structure and evolution of the forest landscape based on a socioenvironmental approach [32]. As expected, we observed a more significant concentration of small and medium forest fragments in the eastern portion of the area, which is compatible with a region marked by highly threatened forest remnants. This result was in agreement with recent studies [44,57] that reported the occurrence of large amounts of small and medium fragments as characteristic of landscapes inserted into the Atlantic Forest domain. This biome extends throughout the eastern sector of the NGSDR landscape, and it is considered one of the most endangered areas in the world, with approximately 90% of its forest landscape having been converted into other types of use [26,44,78].
Although medium forest fragments predominated, the sum of their areas resulted in a relatively small patch of the landscape compared to the large fragments, which despite being smaller in number were responsible for most of the forest cover [78,79]. This result is relevant when assessing the evolution of native vegetation in protected areas, demonstrating that the landscape is still relatively conserved. Similar characteristics have already been evidenced in other protected areas in Brazil [57].
The reduction in forest fragmentation observed over the years (1987 to 2007), followed by a small increase (2007 to 2017), was compatible with other studies that demonstrated the loss of small and medium fragments, although without significant gain in forest areas [32,80]. This fact evidences the importance of NGSDR as a protected area in the promotion of sustainable development, even if it is far from being immune to anthropic pressures [1,81]. Since the beginning of mobilization in the early 2000s, the creation of the NGSDR in 2014, and the collection of the most recent historical records in 2017, a significant gain in biodiversity occurred in a relatively short time. This result indicates that the interaction between traditional communities and the exploitation of natural resources in a sustainable way can be beneficial to environmental conservation [1,82,83,84].
In larger forest fragments, the edge effect was reduced when compared to smaller fragments [85], which was evident by the greater vulnerability of the edges to the impacts from anthropic action [57,78,86]. Therefore, the preservation of smaller fragments, which are in danger of disappearing, is of utmost importance [84,87]. The data from the AWMSI were also highly related to the fragment area and, in agreement with recent research, showed larger fragments had greater heterogeneity than smaller fragments [88], making them essential for the maintenance of biodiversity [78,88,89,90]. Data for ED and AWMSI were generally positive and indicated that impacts on the NGSDR are highly susceptible to change over the years. These changes may be associated with current perspectives on reducing the pressures on biodiversity and promoting the sustainability of ecosystem services to the reserve’s territory (which is already occurring), or they may assume other connotations depending on the purpose of the conservation [1,81,84].
The results obtained in this study validate the classification of land use, since the statistics referring to general classifications and by classes were correct [68,91]. As a postclassification procedure, a filter was applied to the results obtained in this study to reduce isolated pixels and to improve the accuracy of classifications [50]. This procedure, however, influenced the results obtained by the metrics, as the filter reduced the number of small fragments [92]. Although the application of a filter to the calculation of metrics seems to be contradictory, large-impact literature [50,92,93] has portrayed its importance in classification and has shown that the losses of precision in metric calculations are negligible when compared to the gains obtained with the procedure [93].
This study provides a new approach to evaluating the creation of protected areas based on socioenvironmental discourse and reality. The use of GIS, RS, and methodologies using R software is compatible with the most recent and advanced studies in geotechnology. The results obtained in this case study present a comprehensive overview of the changes in the landscape, despite the limitations associated with the unavailability of data with temporal and spatial scaling.
The central element of the creation of the NGSDR and other PAs in Brazil was social mobilization in defense of the maintenance of traditional ways of life and the means for subsistence of traditional communities based on the sustainable use of land. In other words, the contexts in which forms of land use are still based on traditional and nonintensive practices are conducive to the creation of protected areas when the model of development that is underway compromises the livelihoods of populations [94]. A study conducted by Oprsal et al. [95] described significant findings on PAs in other parts of the world. According to these authors, the constitution of protected areas is strongly linked to the level of development of the country [95]: However, in Brazil, the context for the creation of protected areas has differed from these studies.

5. Conclusions

The methodology used was appropriate to reach the objectives of this study. The results obtained contribute to increasing knowledge and the possibility of monitoring the NGSDR. Furthermore, the methodology can support future analyses of environmental discourse in defense of the creation of protected areas, since this kind of study is still scarce.
Impacts were dynamic and subject to alterations over the years. The contribution of the mobilization for the creation of the NGSDR and the consequent reduction in silviculture was verified. The results obtained relativize the environmental arguments that native forest areas are being converted into eucalyptus plantations, leading to the destruction of springs and watercourses. However, pasture was the primary use associated with the conversion of these areas. Thus, the importance of relativizing the attention given to silviculture as the only thing directly responsible for the drying of watercourses and springs in this region is emphasized.
This study evidenced the importance of creating the NGSDR PA, which was inserted into a region historically marked by conflicts, as it is a priority area for conservation in the world, since it is characterized as a transition area between two hotspots. The NGSDR guarantees access to land for traditional populations, where land conflicts are significant and increase pressure on ecosystems. Furthermore, the data evidenced the existence of a still relatively conserved landscape that has been improving over the years, in a highly fragmented area marked by few forest remnants.
Therefore, it is necessary to be attentive to the confrontation of different uses, which, despite being different, are not exclusive, and thus they can be reconciled sustainably. Pasture, silviculture, and agriculture, when properly managed, can contribute to reducing pressure on natural resources and ensuring their sustainable use. Meanwhile, these practices increase the income of families, which influences the well-being of the population and may constitute sustainable forms of land use and exploration of natural resources.

Author Contributions

M.P.B.R. and J.A.F.N. designed the research; M.P.B.R., J.A.F.N., and A.L.L.d.F. performed the analyses; M.P.B.R and J.A.F.N. were responsible for methodology; M.P.B.R. analyzed the data; M.P.B.R. and J.A.F.N. wrote the manuscript; M.P.B.R., T.H.T., F.M.F., and L.L.C. revised the final manuscript; L.L.C. translated; M.P.B.R., J.A.F.N., A.L.L.d.F., T.H.T., F.M.F., and L.L.C. approved the manuscript.

Funding

This research received no external funding.

Acknowledgments

We thank CAPES (Coordenação de Aperfeiçoamento de Pessoal de Nível Superior - Brazil) for the scholarship to MPBR [Finance Code 001].

Conflicts of Interest

The authors declare no conflict of interest.

References

  1. Mace, G.M. Whose conservation? Science 2014, 345, 1558–1560. [Google Scholar] [CrossRef] [PubMed]
  2. Oliveira, U.; Soares-Filho, B.S.; Paglia, A.P.; Brescovit, A.D.; Carvalho, C.J.B.; Silva, D.P.; Rezende, D.T.; Leite, F.S.F.; Batista, J.A.N.; Barbosa, J.P.P.P.; et al. Biodiversity conservation gaps in the Brazilian protected áreas. Sci. Rep. 2017, 7, 1–9. [Google Scholar] [CrossRef]
  3. Moldan, B.; Janoušková, S.; Hák, T. How to understand and measure environmental sustainability: Indicators and targets. Ecol. Indic. 2012, 17, 4–13. [Google Scholar] [CrossRef]
  4. García-Frapolli, E.; Ayala-Orozco, B.; Oliva, M.; Smith, J.R. Different Approaches Towards the Understanding of Socio-Environmental Conflicts in Protected Areas. Sustainability 2018, 10, 2240. [Google Scholar] [CrossRef]
  5. Du, B.; Zheng, Y.; Liu, J.; Mao, D. Threatened Plants in China’s Sanjiang Plain: Hotspot Distributions and Gap Analysis. Sustainability 2018, 10, 194. [Google Scholar] [CrossRef]
  6. Miller, D.C.; Agrawal, A.; Roberts, J.T. Biodiversity, governance, and the allocation of international aid for conservation. Conserv. Lett. 2013, 6, 12–20. [Google Scholar] [CrossRef]
  7. Silva, M. The Brazilian protec áreas program. Conserv. Biol. 2005, 19, 608–611. [Google Scholar] [CrossRef]
  8. Perrino, P.; Laghetti, G.; Terzi, M. Modern concepts for the sustainable use of Plant Genetic Resources in the Mediterranean natural protected areas: The case study of the Alta Murgia Park (Italy). Genet. Resour. Crop Evol. 2006, 53, 695–710. [Google Scholar] [CrossRef]
  9. Brooks, T.M.; Bakarr, M.I.; Boucher, T.; Da Fonseca, G.A.; Hilton-Taylor, C.; Hoekstra, J.M.; Moritz, T.; Olivieri, S.; Parrish, J.; Pressey, R.L. Coverage provided by the global protected-area system: Is it enough? AIBS Bull. 2004, 54, 1081–1091. [Google Scholar] [CrossRef]
  10. Pechanec, V.; Machar, I.; Pohanka, T.; Opršal, Z.; Petrovič, F.; Švajda, J.; Šálek, L.; Chobot, K.; Filippovová, J.; Cudlín, P.; et al. Effectiveness of Natura 2000 system for habitat types protection: A case study from the Czech Republic. Nat. Conserv. 2018, 24, 21–41. [Google Scholar] [CrossRef] [Green Version]
  11. Dearden, P.; Bennett, M.; Johnston, J. Trends in Global Protected Area Governance, 1992–2002. Environ. Manag. 2005, 36, 89–100. [Google Scholar] [CrossRef]
  12. Verburg, R.; Filho, S.R.; Lindoso, D.; Debortoli, N.; Litre, G.; Bursztyn, M. The impact of commodity price and conservation policy scenarios on deforestation and agricultural land use in a frontier area within the Amazon. Land Use Policy 2014, 37, 14–26. [Google Scholar] [CrossRef]
  13. Watson, J.E.M.; Dudley, N.; Segan, D.B.; Hockings, M. The performance and potential of protected áreas. Nature 2014, 515, 67–73. [Google Scholar] [CrossRef]
  14. DeFries, R.; Hansen, A.; Turner, B.L.; Reid, R.; Liu, J. Land use change around protected areas: Management to balance human needs and ecological function. Ecol. Appl. 2007, 17, 1031–1038. [Google Scholar] [CrossRef]
  15. Brasil. Lei No 9.985, de 18 de julho de 2000. Regulamenta o art. 225, § 1o, incisos I, II, III e VII da Constituição Federal, Institui o Sistema Nacional de Unidades de Conservação da Natureza e dá Outras Providências. Brasília: Casa Civil, 2000. Available online: http://www.planalto.gov.br/ccivil_03/leis/L9985.htm (accessed on 13 June 2018).
  16. SNUC. Sistema Nacional de Unidades de Conservação da Natureza Lei no 9.985, de 18 de julho de 2000; decreto no 4.340, de 22 de agosto de 2002. 5. ed. aum. Brasília: MMA/SBF, 56 (2004). Available online: http://aiba.org. br/wpcontent/uploads/2014/10/SNUC-LEI-N-9-985-DE-18-DE-JULHO-DE-2000-livro.pdf (accessed on 1 June 2018).
  17. IBAMA. Instituto Brasileiro do Meio Ambiente e dos Recursos Naturais Renováveis. Lei do Sistema Nacional de Unidades de Conservação No 9.985, do 18 de julho de 2000. Brasília: Ibama, Ministério do Meio Ambiente, 2000. Available online: www.mma.gov.br/port/sbf/dap/doc/snuc.pdf (accessed on 20 November 2018).
  18. Barquet, K. Transboundary Conservation and Conflict. Ph.D. Thesis, Norwegian University of Science and Technology, Trondheim, Norway, 2015. [Google Scholar]
  19. Machar, I.; Simon, J.; Rejsek, K.; Pechanec, V.; Brus, J.; Kilianova, H. Assessment of Forest Management in Protected Areas Based on Multidisciplinary Research. Forests 2016, 7, 285. [Google Scholar] [CrossRef]
  20. Moura, R.A. New Perspectives for Rural Development: A Normative Analysis, Conceptual and Practice of Commom Lands in Galician and Conservation Units in Brazilian. Ph.D. Thesis, Federal University of Viçosa, Viçosa, Brazil, 2016. [Google Scholar]
  21. ICMBio & UFV. Relatório Final. Apoio ao Processo de Identificação das Famílias Beneficiárias e Diagnóstico Socioprodutivo em Unidades de Conservação Federal; ICMBio & UFV: Vicosa, Brazil, 2015; Unpublished.
  22. Pereira, G.P. Community Organization as a Tool of Struggle for the Creation and Consolidation of Extractive Reserves: The Case of Marine Extractive Reserve of Canavieiras-BA. Ph.D. Thesis, Federal University of Viçosa, Viçosa, Brazil, 2016. [Google Scholar]
  23. Wolff, S. Subsídios ao IV Relatório Nacional para a Convenção sobre Diversidade Biológica—CDB: Diagnóstico Sobre a Legislação Ambiental Brasileira, Brasília: MMA, Ministério do Meio Ambiente. Secretaria de Biodiversidade e Florestas. Departamento de Conservação da Biodiversidade, 2009. Available online: http://www.mma.gov.br/estruturas/sbf_chm_rbbio/_arquivos/legistacao_4_relatorio_cdb.pdf (accessed on 15 November 2018).
  24. BRASIL. Decreto de 13 de Outubro de 2014. Cria a Reserva de Desenvolvimento Sustentável Nascentes Geraizeiras, Localizada nos Municípios de Montezuma, Rio Pardo de Minas e Vargem Grande do Rio Pardo, Estado de Minas Gerais. Brasília: Governo Federal, 2014. Available online: http://www.planalto.gov.br/ccivil_03/_Ato 2011-2014/2014/Dsn/Dsn14016.htm (accessed on 15 November 2018).
  25. ICMBio & UFV. Reserva de Desenvolvimento Sustentável Nascentes Geraizeiras. In Relatório Final. Apoio ao Processo de Identificação das Famílias Beneficiárias e Diagnóstico Socioprodutivo em Unidades de Conservação Federal; ICMBio & UFV: Viçosa, Brazil, 2017; Unpublished. [Google Scholar]
  26. Myers, N.; Mittermeier, R.A.; Mitermeier, C.G.; Fonseca, G.A.; Kent, J. Biodiversity hotspots for conservation priorities. Nature 2000, 403, 853–858. [Google Scholar] [CrossRef]
  27. ICMBio. Instituto Chico Mendes de Conservação da Biodiversidade Grupos das Unidades de Conservação. Available online: http://www.icmbio.gov.br/portal/biodiversidade/unidades-deconservacao/grupos.html (accessed on 10 June 2018).
  28. Ketcham, C.; Crawford, J.M. The impacto of review articles. Lab. Investig. 2007, 87, 1174–1185. [Google Scholar] [CrossRef]
  29. Manea, G.; Matei, E.; Vijulie, I.; Tîrlă, L.; Cuculici, R.; Cocoş, O.; Tişcovschi, A. Arguments for integrative management of protected áreas in the cities—Case study in Bucharest city. Procedia Environ. Sci. 2016, 42, 80–96. [Google Scholar] [CrossRef]
  30. Leyton, K. Dynamic of Native Forests in Areas of Eucalyptus Expansion in São Paulo State, Brazil. Master’s Thesis, University of São Paulo, São Paulo, Brazil, 2008. [Google Scholar]
  31. Meneses, P.R.; Almeida, T. Introdução ao Processamento de Imagens de Sensoriamento Remoto; UnB/CNPq: Brasília, Brasil, 2012; 266p. [Google Scholar]
  32. Castilho, E.M.; García-Martin, A.; Aladrén, L.A.L. Evaluation of forest cover change using remote sensing techniques and landscape metrics in Moncayo Natural Park (Spain). Appl. Geogr. 2015, 62, 247–255. [Google Scholar] [CrossRef]
  33. Markham, B.L.; Barker, J.L. Radiometric properties of U.S. processed landsat MSS data. Remote Sens. Environ. 1987, 22, 39–71. [Google Scholar] [CrossRef]
  34. Song, C.; Woodcock, C.; Seto, K.C.; Lenney, M.P.; Macomber, S.A. Classification and change detection using Landsat TM Data- when and how to correct atmospheric effects? Remote Sens. Environ. 2001, 75, 230–244. [Google Scholar] [CrossRef]
  35. Riano, D.; Huvieco, E.; Salas, J.; Aguado, I. Assessment of different topographic corrections in landsat-TM data for mapping vegetation types. IEEE Trans. Geosci. Remote Sens. 2003, 41, 1056–1061. [Google Scholar] [CrossRef]
  36. Pedlowski, M.A.; Matricardi, D.; Skole, D.; Cameron, S.R.; Chomentowski, W.; Fernandes, C.; Lisboa, A. Conservation units: A new deforestation frontier in the Amazonian state of Rondônia, Brazil. Environ. Conserv. 2005, 32, 149–155. [Google Scholar] [CrossRef]
  37. Gonçalves, A.B.; Marcatti, G.E.; Ribeiro, C.A.A.S.; Soares, V.P.; Neto, J.A.A.M.; Leite, H.G.; Gleriani, J.M.; Lana, V.M. Mapping permanent preservation areas and land use conflicts identification at the camapuã/brumado river basin. Rev. Árvore 2012, 36, 759–766. [Google Scholar] [CrossRef]
  38. Barbosa, S.G.; Spletozer, A.G.; Roque, M.P.B.; Ferreira Neto, J.A.; Dias, H.C.T.; Ramos, M.P.; Bonilla, M.A.C.; Ribeiro, W.S.; Alcántara-de la Cruz, R.; Zanuncio, J.C.; et al. Geotechnology in the analysis of forest fragments in northern Mato Grosso, Brazil. Sci. Rep. 2018, 8, 39–59. [Google Scholar] [CrossRef]
  39. Esri. ArcGis Advanced: Realease 10.5.1; Environmental Systems Research Institute: Redlands, CA, USA, 2017; Available online: https://support.esri.com/en/products/desktop/arcgis-desktop/arcmap/10-5-1 (accessed on 14 June 2018).
  40. IBGE. Instituto Brasileiro de Geografia e Estatística Bases e Referências/Bases Cartográficas Malhas Digitais. Available online: https://mapas.ibge.gov.br/bases-e-referenciais/bases-cartograficas/malhas-digitais.html (accessed on 10 November 2018).
  41. Yuan, F.; Sawaya, K.E.; Loeffelholz, B.C.; Bauer, M.E. Land cover classification and change analysis of the Twin Cities (Minnesota) Metropolitan Area by multitemporal Landsat remote sensing. Remote Sens. Environ. 2005, 98, 317–328. [Google Scholar] [CrossRef]
  42. Shaharum, N.S.N.; Shafri, H.Z.M.; Gambo, J.; Abidin, F.A.Z. Mapping of Krau Wildlife Reserve (KWR) Protected Area Using Landsat 8 and Supervised Classification Algorithms. Remote Sens. Appl. 2018, 10, 24–35. [Google Scholar] [CrossRef]
  43. Foody, G.M.; Arora, M.K. An evaluation of some factors affecting the accuracy of classification by an artificial neural network. Int. J. Remote Sens. 1997, 18, 799–810. [Google Scholar] [CrossRef]
  44. Da Ponte, E.; Kuenzer, C.; Parker, A.; Rodas, O.; Oppelt, N.; Fleckenstein, M. Forest cover loss in Paraguay and perception of ecosystem services: A case study of the Upper Parana Forest. Ecosyst. Serv. 2017, 24, 200–212. [Google Scholar] [CrossRef]
  45. Hsu, L.; Hutchison, V.B.; Langseth, M.L.; Wheeler, B. U.S. Geological Survey Community for Data Integration 2017 Workshop Proceedings; Open-File Report 2018-1081; US Geological Survey: Reston, VA, USA, 2018. [CrossRef]
  46. Zheng, B.; Myint, S.; Thenkabail, P.S.; Aggarwal, R. A support vector machine to identify irrigated crop types using time-series Landsat NDVI data. Int. J. Appl. Earth Obs. Geoinf. 2015, 34, 103–112. [Google Scholar] [CrossRef]
  47. Breiman, L. Random Forests; Statistics Department, University of California: Berkeley, CA, USA, 2001; p. 94720. Available online: https://www.stat.berkeley.edu/~breiman/randomforest2001.pdf (accessed on 20 January 2019).
  48. Venturieri, A.; Santos, J.R. Técnicas de classificação de imagens para análise de cobertura vegetal. In Sistema de Informações Geográficas. Aplicações na Agricultura, 2nd ed.; Assad, E.D., Sano, E.E., Eds.; Embrapa-SPI/Embrapa–CPAC: Brasília, Brasil, 1998; pp. 351–371. [Google Scholar]
  49. Vasconcelos, B.N.F. Digital Soil Mapping at Different Scales: Methodological Approach. Ph.D. Thesis, Federal University of Viçosa, Viçosa, Brazil, 2016. [Google Scholar]
  50. Guerschman, J.P.; Paruelo, J.M.; Di Bella, C.; Giallorenzi, M.C.; Pacin, F. Land cover classification in the Argentine Pampas using multi-temporal Landsat TM data. Int. J. Remote Sens. 2003, 24, 3381–3402. [Google Scholar] [CrossRef]
  51. Jensen, J.R.; Lulla, K. Digital change detection. Introductory digital image processing: A remote sensing perspective. Geocarto Int. 2008, 2, 1–65. [Google Scholar] [CrossRef]
  52. Landis, J.R.; Koch, G.G. The measurement of observer agreement for categorical data. Biometrics 1977, 33, 159–174. [Google Scholar] [CrossRef] [PubMed]
  53. Congalton, R.G.; Green, K. Assessing the Accuracy of Remotely Sensed Data Principles and Practices; Lewis Publishers: Boca Raton, FL, USA; London, UK; New York, NY, USA, 1999; 200p. [Google Scholar]
  54. Kim, D.-H.; Sexton, J.O.; Noojipady, P.; Huang, C.; Anand, A.; Channan, S.; Feng, M.; Townshend, J.R. Global, Landsat-based forest-cover change from 1990 to 2000. Remote Sens. Environ. 2014, 155, 178–193. [Google Scholar] [CrossRef] [Green Version]
  55. Prakasam, C. Land use and land cover change detection through remote sensing approach: A case study of Kodaikanal taluk, Tamil nadu. Int. J. Geomat. Geosci. 2010, 1, 150–158. [Google Scholar]
  56. Liu, T.; Yang, X. Monitoring land changes in an urban area using satellite imagery, GIS and landscape metrics. Appl. Geogr. 2015, 56, 42–54. [Google Scholar] [CrossRef]
  57. Pirovani, D.B.; Silva, A.G.; Santos, A.R.; Cecílio, R.A.; Gleriani, J.M.; Martins, S.V. Spatial analysis of forest fragments in the Itapemirim River Basin, ES. Rev. Árvore 2014, 38, 271–281. [Google Scholar] [CrossRef]
  58. Paudel, S.; Yuan, F. Assessing landscape changes and dynamics using patch analysis and GIS modeling. Int. J. Appl. Earth Obs. Geoinf. 2012, 16, 66–76. [Google Scholar] [CrossRef]
  59. Elkie, P.C.; Rempel, R.S.; Carr, A. Patch Analyst User’s Manual: A Tool for Quantifying Landscape Structure; Ontario Ministry of Natural Resources, Boreal Science, Northwest Science & Technology: Thunder Bay, ON, Canada, 1999; p. 22.
  60. Rempel, R.S.; Kaukinen, D.; Carr, A.P. Patch Analyst 4. Centre for Northern Forest Ecosystem Research; Ontario Ministry of Natural Resources, Centre for Northern Forest Ecosystem Research: Thunder Bay, ON, Canada, 2008; p. 99.
  61. Brito, I.C.B. Community, Territory and Forest Industrial Complex—The Case of Vereda Funda, Northern Minas Gerais. Master’s Thesis, University of Montes Claros, Montes Claros, Brazil, 2006. [Google Scholar]
  62. Teixeira; Helena, T. The General is of Those Who Live in It, Not of Those Who Exploit It”: Collective Action for the Common Land of the Geraizeiros in North of Minas Gerais. Master’s Thesis, Federal University of Viçosa, Viçosa, Brazil, 2016. [Google Scholar]
  63. Dayrell, C.A. Geraizeiros e Biodiversidade no Norte de Minas: A Contribuição da Agroecologia e da Etnoecologia nos Estudos dos Agroecossistemas Tradicionais. Master’s Thesis, Universidade Internacional de Andalucia, La Rábida, Spain, 1998. [Google Scholar]
  64. Nogueira, M.C.R. Gerais a Dentro e Fora: Identidade e Territorialidade Entre Geraizeiros do Norte de Minas Gerais. Ph.D. Thesis, University Brasília, Brasília, Brazil, 2009. [Google Scholar]
  65. Magalhães, F.R.; Amorim, R.A. O Movimento dos Geraizeiros e a luta pela terra no Alto Rio Pardo. Rev. Do Cent. De Estud. Rurais Ruris/Unicamp 2015, 9, 209–238. [Google Scholar]
  66. Mazer, S. Potencial Produtivo de Plantas de Importância Socioeconômica da Reserva de Desenvolvimento Sustentável Nascentes Geraizeiras, Minas Gerais, Brasil. Master’s Thesis, University of Brasília, Brasília, Brazil, 2016. [Google Scholar]
  67. Cerqueira, M.C. Use Study and Coverage of Land and Fragmentation Natural Vegetation in Development Reserve Sustainable Nascentes Geraizeiras in General Mines Norte, Brasil. Master’s Thesis, University of Brasília, Brasília, Brazil, 2016. [Google Scholar]
  68. Schulz, J.J.; Cayuela, L.; Echeverria, C.; Salas, J.; Rey Benayas, J.M. Monitoring land cover change of the dryland forest landscape of Central Chile (1975–2008). Appl. Geogr. 2010, 79, 436–447. [Google Scholar] [CrossRef]
  69. Kim, D.H.; Sexton, J.O.; Townshend, J.R. Accelerated deforestation in the humid tropics from the 1990s to the 2000s. Geophys. Res. Lett. 2015, 42, 3495–3501. [Google Scholar] [CrossRef] [Green Version]
  70. Turner, M.G.; Romme, W.H.; Gardner, R.H.; O’Neil, R.V.; Kratz, T.K. A revised concepto os landscape equilibrium: Disturbance and stability on scaled landscapes. Landsc. Ecol. 1993, 8, 213–227. [Google Scholar] [CrossRef]
  71. Townshend, J.; Masek, J.; Huang, C.; Vermont, E.F.; Gao, F.; Channan, S.; Sexton, J.O.; Feng, M.; Narasimhan, R.; Kim, D.; et al. Global characterization and monitoring of forest cover using Landsat data: Opportunities and challenges. Int. J. Digit. Earth 2012, 5, 373–397. [Google Scholar] [CrossRef]
  72. Zhu, Z.; Woodcock, C.E. Continuous change detection and classification of land cover using all available Landsat data. Remote Sens. Environ. 2014, 144, 152–171. [Google Scholar] [CrossRef]
  73. Mazzetto Silva, C.E. Cerrados e Camponeses no Norte de Minas: Um Estudo Sobre a Sustentabilidade dos Ecossistemas e das Populações Sertanejas. Master’s Thesis, University of Minas Gerais, Minas Gerais, Brazil, 1999. [Google Scholar]
  74. Dutra, G.W.L.; Ferreira Filho, H.F. Movement geraizeiro: A crying for the preservation of the savannah. In V International Colloquium: The University and Modes of Knowledge Production—What Developments? Unimontes: Montes Claros, Brazil, 2015; pp. 439–449. [Google Scholar]
  75. Tabarelli, M.; Pinto, L.P.; Silva, J.M.C.; Hirota, M.; Bedê, L. Challenges and opportunities for biodiversity conservation in the Brazilian Atlantic Forest. Conserv. Biol. 2005, 19, 695–700. [Google Scholar] [CrossRef]
  76. Botequilha-Leitão, A.; Miller, J.; Ahern, J.; Mcgarigal, K. Measuring Landscapes: A Planner’s Handbook; Island Press: Washington, DC, USA, 2006. [Google Scholar]
  77. Aguilera, F.; Valenzuelaa, L.M.; Botequilha-Leitão, A.; Bracchetti, L.; Carotenuto, L.; Catorci, A. Land-cover changes in a remote area of central Apennines (Italy) and management directions. Landsc. Urban Plan. 2012, 104, 157–170. [Google Scholar] [CrossRef]
  78. Santos, A.R.; Ribeiro, A.A.S.; de Oliveira Peluzio, T.M.; Esteves Pelusio, J.B.; de Queiroz, V.T.; Branco, E.R.F.; Lorenzon, A.S.; Domingues, G.F.; Marcatti, G.E.; de Castro, N.L.M.; et al. Geotechnology and landscape ecology applied to the selection of potential forest fragments for seed harvesting. J. Environ. Manag. 2016, 183, 1050–1063. [Google Scholar] [CrossRef]
  79. Botequilha Leitão, A.; Ahern, J. Applying landscape ecological concepts and metrics in sustainable landscape planning. Landsc. Urban Plan. 2002, 59, 65–93. [Google Scholar] [CrossRef]
  80. Keles, S.; Sivrikaya, F.; Çakır, G.; Kose, S. Urbanization and forest cover change un regional directorate of Trabzon silviculture from 1975 to 2000 using landsat data. Environ. Monit. Assess. 2008, 140, 1–14. [Google Scholar] [CrossRef]
  81. Mace, G.M.; Norris, K.; Fitter, A.H. Biodiversity and ecosystem services: A multilayered relationship. Trends Ecol. Evol. 2012, 27, 19–26. [Google Scholar] [CrossRef]
  82. McGarigal, K.; Marks, B.J. Fragstats: Spatial Pattern Analysis Program for Quantifying Landscape Structure; Reference Manual; Oregon State University: Corvallis, OR, USA, 1995; p. 134. [Google Scholar]
  83. Bezerra, C.G.; Santos, A.R.; Pirovani, D.B.; Pimentel, L.B.; Eugenio, F.C. Estudo da fragmentação florestal e ecologia da paisagem na sub-bacia hidrográfica do córrego Horizonte, Alegre, ES. Espaço Geogr. 2011, 14, 257–277. [Google Scholar]
  84. Schleicher, J. The environmental and social impacts of protected areas and conservation concessions in South America. Curr. Opin. Environ. Sustain. 2018, 32, 1–8. [Google Scholar] [CrossRef]
  85. Huang, H.; Chen, Y.; Clinton, N.; Wang, J.; Wang, X.; Zhu, Z. Mapping major land cover dynamics in Beijing using all Landsat images in Google Earth Engine. Remote Sens. Environ. 2017, 202, 166–176. [Google Scholar] [CrossRef]
  86. Rodrigues, P.J.F.P.; Nascimento, M.T. Forest fragmentation: Brief theoretical considerations about edge effects. Rodriguésia 2006, 57, 67–74. [Google Scholar] [CrossRef]
  87. Lechner, A.M.; Stein, A.; Jones, S.D.; Ferwerda, J.G. Remote sensing of small and linear features: Quantifying the effects of patch size and length, grid position and detectability on land cover mapping. Remote Sens. Environ. 2009, 113, 2194–2204. [Google Scholar] [CrossRef]
  88. Oliveira Filho, F.J.B.; Metzger, J.P. Threshold in landscape structure for three common deforestation patterns in the Brazilian Amazon. Landsc. Ecol. 2006, 21, 1061–1073. [Google Scholar] [CrossRef]
  89. Forman, R.T.T.; Godron, M. Landscape Ecology; John Wiley and Sons Ltd.: New York, NY, USA, 1986; p. 620. [Google Scholar]
  90. Ribeiro, M.C.; Metzger, J.P.; Martensen, A.C.; Ponzoni, F.J.; Hirota, M.M. The Brazilian Atlantic Forest: How much is left, and how is the remaining forest distributed? Implications for conservation. Biol. Conserv. 2009, 142, 1141–1153. [Google Scholar] [CrossRef]
  91. Conger, A.J. Kappa and Rater Accuracy: Paradigms and Parameters. Educ. Psychol. Meas. 2016, 77, 1019–1047. [Google Scholar] [CrossRef] [Green Version]
  92. Saura, S. Effects of remote sensor spatial resolution and data aggregation on selected fragmentation indices. Landsc. Ecol. 2004, 19, 197–209. [Google Scholar] [CrossRef]
  93. Argañaraz, J.P.; Entraigas, I. Scaling functions evaluation for estimation of landscape metrics at higher resolutions. Ecol. Inform. 2014, 22, 1–12. [Google Scholar] [CrossRef]
  94. Silva, M.X.; Tambosi, L.R.; Paviolo, A.; Pardini, R. Effectiveness of protected áreas for biodiversity conservation: Mammal occupancy patterns in the Iguaçu National Park, Brazil. J. Nat. Conserv. 2018, 41, 51–62. [Google Scholar] [CrossRef]
  95. Opršal, Z.; Harmacek, J.; Pavlík, P.; Machar, I. What Factors can Influence the Expansion of Protected Areas around the World in the Context of International Environmental and Development Goals? Probl. Ekorozw. 2018, 13, 145–157. [Google Scholar]
Figure 1. Geographic location of the Nascente Geraizeiras Sustainable Development Reserve (NGSDR) in a regional context.
Sustainability 11 01700 g001
Figure 2. Evolution of land use and occupation of the NGSDR and its surroundings throughout the years, from 1987 to 2017.
Sustainability 11 01700 g002
Figure 3. Kappa index and the general precisions of the classifications by grade for the years 1987 TM (a), 1997 TM (b), 2007 TM (c), 2014 OLI (d), and 2017 OLI (e).
Sustainability 11 01700 g003
Table 1. Environmental, public, and economic arguments associated with the creation of the NGSDR, Minas Gerais State, Brazil.
Category Argument
EnvironmentalExpansion of silviculture;
Deforestation of the Cerrado areas;
Drying of water springs and a reduction in the volume of watercourses;
Increasing pressure on natural resources and biodiversity.
PublicMaintenance of the traditional lifestyle of the local population;
Appreciation and formation of the cultural local identity;
Guaranteeing a base of resources for present and future generations;
Life quality and well-being of the traditional population;
Incorporation of ethical and gender issues.
EconomicAssurance of land access and regaining territory;
Maintenance of gathering activities and extensive livestock, historically practiced by the traditional population.
Table 2. Percentage of the classification for land use and occupation of the NGSDR, Minas Gerais State, Brazil, and its surrounding area (outside), during the years from 1987 to 2017. Outside comprises the NGSDR plus a 20-km buffer around its borders, totaling an area of 392,176.67 ha. The NGSDR has 38,177 ha, limited by the borders of the protected area.
Classes per Year19871997200720142017
Outside (%)Ngsdr (%)Outside (%)Ngsdr (%)Outside (%)Ngsdr (%)Outside (%)Ngsdr (%)Outside (%)Ngsdr (%)
Native vegetation58.056.057.756.758.260.158.060.057.460.4
Pasture38.042.225.332.933.438.535.338.835.238.4
Silviculture2.00.015.69.84.51.25.50.76.40.9
Agriculture0.30.00.40.00.20.00.20.00.30.0
Rock outcrop0.10.20.10.20.10.10.20.00.10.1
Bare soil1.51.60.80.40.70.10.60.60.50.2
Water0.10.00.10.00.10.00.20.00.20.0
Total100.00100.00100.00100.00100.00100.00100.00100.00100.00100.00
Table 3. Variation of the landscape metrics: number of patches (NP), mean patch size (MPS), area-weighted mean shape index (AWMSI), and edge density (ED) at the class level during the years from 1987 to 2017 in the NGSDR, Minas Gerais State, Brazil, and its surrounding areas.
IndicesNPMPSAWMSIED
(<5 ha) small19871181.32.00.36
1997741.22.10.20
2007601.31.90.21
2014511.61.90.17
2017281.61.70.08
(5–50 ha) medium198730621.82.14.58
199727721.92.03.87
200711122.71.91.51
201441716.41.94.92
201768518.92.210.75
(>50 ha) large19871002206.218.949.31
19971002144.418.548.12
20071002379.816.442.85
20141092021.923.748.08
20171391408.841.964.89
all1987524434.118.454.26
1997451503.918.152.19
2007280844.316.344.58
2014577393.923.053.17
2017852245.139.475.73

