Using the Markov Chain to Analyze Precipitation and Groundwater Drought Characteristics and Linkage with Atmospheric Circulation


Department of Resources Engineering, National Cheng Kung University, Tainan 701, Taiwan
*
Author to whom correspondence should be addressed.
Sustainability 2019, 11(6), 1817; https://doi.org/10.3390/su11061817
Submission received: 18 February 2019
/
Revised: 13 March 2019
/
Accepted: 19 March 2019
/
Published: 26 March 2019
Abstract
:In recent years, Taiwan has been facing water shortages due to the impact of climate change, which has resulted in many serious drought events, especially in southern Taiwan. Long-term records from 25 rainfall stations and 17 groundwater stations in the southern Taiwan basin were used in this study. We used the Standardized Precipitation Index (SPI) and the Standardized Groundwater Level Index (SGI) and employed the first-order Markov chain model and wavelet transform to determine the drought characteristics and propagation, including the steady-state probabilities of drought events and the mean duration for each station. The Drought Index (DI) was also used to investigate the effects of rainfall on groundwater drought. The results show that the steady-state probability of the meteorological drought in the Yanshui River basin in southern Taiwan is higher than that in other basins. The area with the longer mean duration is located in the Yanshui River basin and the Erren River basin, and overall, the mean duration ranges from 3 to 7 months. In addition, the results from the drought proneness analysis indicated that when rainfall causes a longer drought duration, there will be a higher degree of proneness to groundwater drought in the future. Finally, the results show that the mean duration of groundwater droughts are longer than those of meteorological droughts. The results of the wavelet analysis revealed a positive correlation at long-term scales, which may be related to large-scale atmospheric circulation. The information from this research could be used as a reference for water resource management in the future.
1. Introduction
In recent years, climate anomalies have been considered a serious environmental threat. According to the Intergovernmental Panel on Climate Change report [1], the changes in the global water cycle caused by climate warming in the 21st century have very large regional differences. Changes in precipitation between humid and arid areas as well as between wet and dry seasons, are predicted to further expand, leading to numerous extreme hydrological events such as floods and droughts around the world [2,3,4,5,6]. Because of the impact of climate change, water resources are gradually being reduced, and the frequency of drought events is increasing. This indicates that the global rainfall pattern has changed greatly [7]. However, drought events not only cause environmental changes, but also have serious impacts on social economies and agricultural development [8,9,10,11].
Taiwan is located in the subtropical climate zone. It has abundant rainfall, but the uneven distribution of precipitation in time and space causes it to be characterized by distinct wet and dry seasons, especially in southern Taiwan. The Taiwan Integrated Research Program on Climate Change Adaptation Technology [12] used the drought index to analyze the drought conditions in Taiwan. They pointed out that the drought trends between 1960 and 2012 have gradually increased in central and southern Taiwan. According to a report from the Water Resources Agency, Ministry of Economic Affairs, the difference between the high and low flow period is becoming increasingly bigger. They found that 2015 was the worst drought year in the past 67 years in Taiwan, indicating that drought is gradually becoming a serious issue in Taiwan, which means drought analysis is also becoming increasingly important.
Drought events can be analyzed in different ways, and drought indicators are currently the most convenient, effective method. Many drought indicators were developed to assess different types of drought in the past [13,14,15,16,17,18,19,20,21,22]. Among the many drought indicators, the Standardized Precipitation Index (SPI) and the Standardized Groundwater level Index (SGI) are simple and fast and can be used to describe drought conditions both in short and long time scales. Therefore, in this study, these two drought indexes were used for analyses of rainfall and groundwater drought.
Since drought events are random, the severity of drought can be analyzed using a stochastic method. A drought index time series can not only be used to identify the severity of historical or persistent drought events but also can be applied to predict drought using a Markov chain, which has been widely used to analyze hydrometeorological conditions [23]. In the past, many studies have used a Markov chain to identify drought characteristics [10,11,23,24,25,26,27]. Paulo et al. [24] and Paulo and Pereira [23,25] applied the Markov chain model to study the stochastic characteristics of an SPI drought transition. They found that a stochastic model can be used to monitor the evolution of droughts and can be used to generate an early warning system for drought conditions in specific areas. In addition, the Markov chain model is widely used as an agricultural drought index in India to identify proneness toward drought [28], to analyze correlations related to rainfall drought [29], and to predict spells of dry and wet conditions.
In addition, climate changes can seriously affect drought characteristics and propagation. In the past, some researchers used a wavelet analysis to determine whether there were periodical changes in the standardized drought index at different time scales [30,31], and to show that a larger wavelet coefficient could be found at a long-term scale, which reveals a significant periodical change. These results may have been influenced by large-scale atmospheric circulation, thus it is necessary to analyze whether climate factors are related to drought by using a cross wavelet transform. Huang et al. [6] found that the correlations between annual actual evaporation and monthly El Niño-Southern Oscillation (ENSO) and Arctic Oscillation (AO) values were significant at a long time scale in the Wei River Basin (WRB) in China and indirectly affected the propagation time from meteorological drought to hydrological drought. The same result was also found in different studies [30,31,32].
Extreme events may not only cause natural disasters but also lead to economic losses. For example, the United States lost more than $5 million due to weather events in the 1990s [33]. According to Arnell [34], different climate models and emission scenarios had been used to analyze the water stress in different watersheds. The results show that climate change increases water resources stress in some regions and there are 1.4 million people suffering from water scarcity. These studies have shown the loss and impact of an extreme event. Because of the climate condition, drought is the most serious extreme event in Taiwan. Therefore, in this study, the Standardized Precipitation Index (SPI) and the Standardized Groundwater Level Index (SGI) were examined to evaluate the drought characteristics in the study area, and the Markov chain model based on a drought index time series was used to analyze the characteristics of drought events, including the steady-state probability of drought events, the mean duration of the drought, and drought proneness. Finally, a spatial distribution analysis of our results in the study area was carried out.
2. Materials and Methods
2.1. Study Area
The study area was located in southern Taiwan. The administrative district includes Chiayi County, Chiayi City, Tainan City, Kaohsiung city, and Pingtung County. This area is characterized by a tropical monsoon climate, and due to the topography and geographical location, there is abundant rainfall. The precipitation is concentrated in the rainy season in May and June and the typhoon season from July to September, and it is less rainy in winter, thus it is characterized by distinct dry and wet seasons. A topographic map of the study area is shown in Figure 1.
According to historical data, the average annual rainfall in southern Taiwan is 2541 mm. During the wet season (May to October), rainfall accounts for 89% of the annual precipitation, and during the dry season, rainfall accounts for 11% of the annual precipitation. The ratio of wet to dry can be as high as 8:1 [35].
Seven basins in southern Taiwan were selected for this study, including the Pozi River basin, the Bazhang River basin, the Jishui River basin, the Yanshui River basin, the Erren River basin, the Gaoping River basin, and the Linbian River basin from the north to the south. The drainage area comprises 426.60 km2, 474.74 km2, 379.00 km2, 339.74 km2, 339.20 km2, 3256.85 km2, and 343.97 km2, respectively.
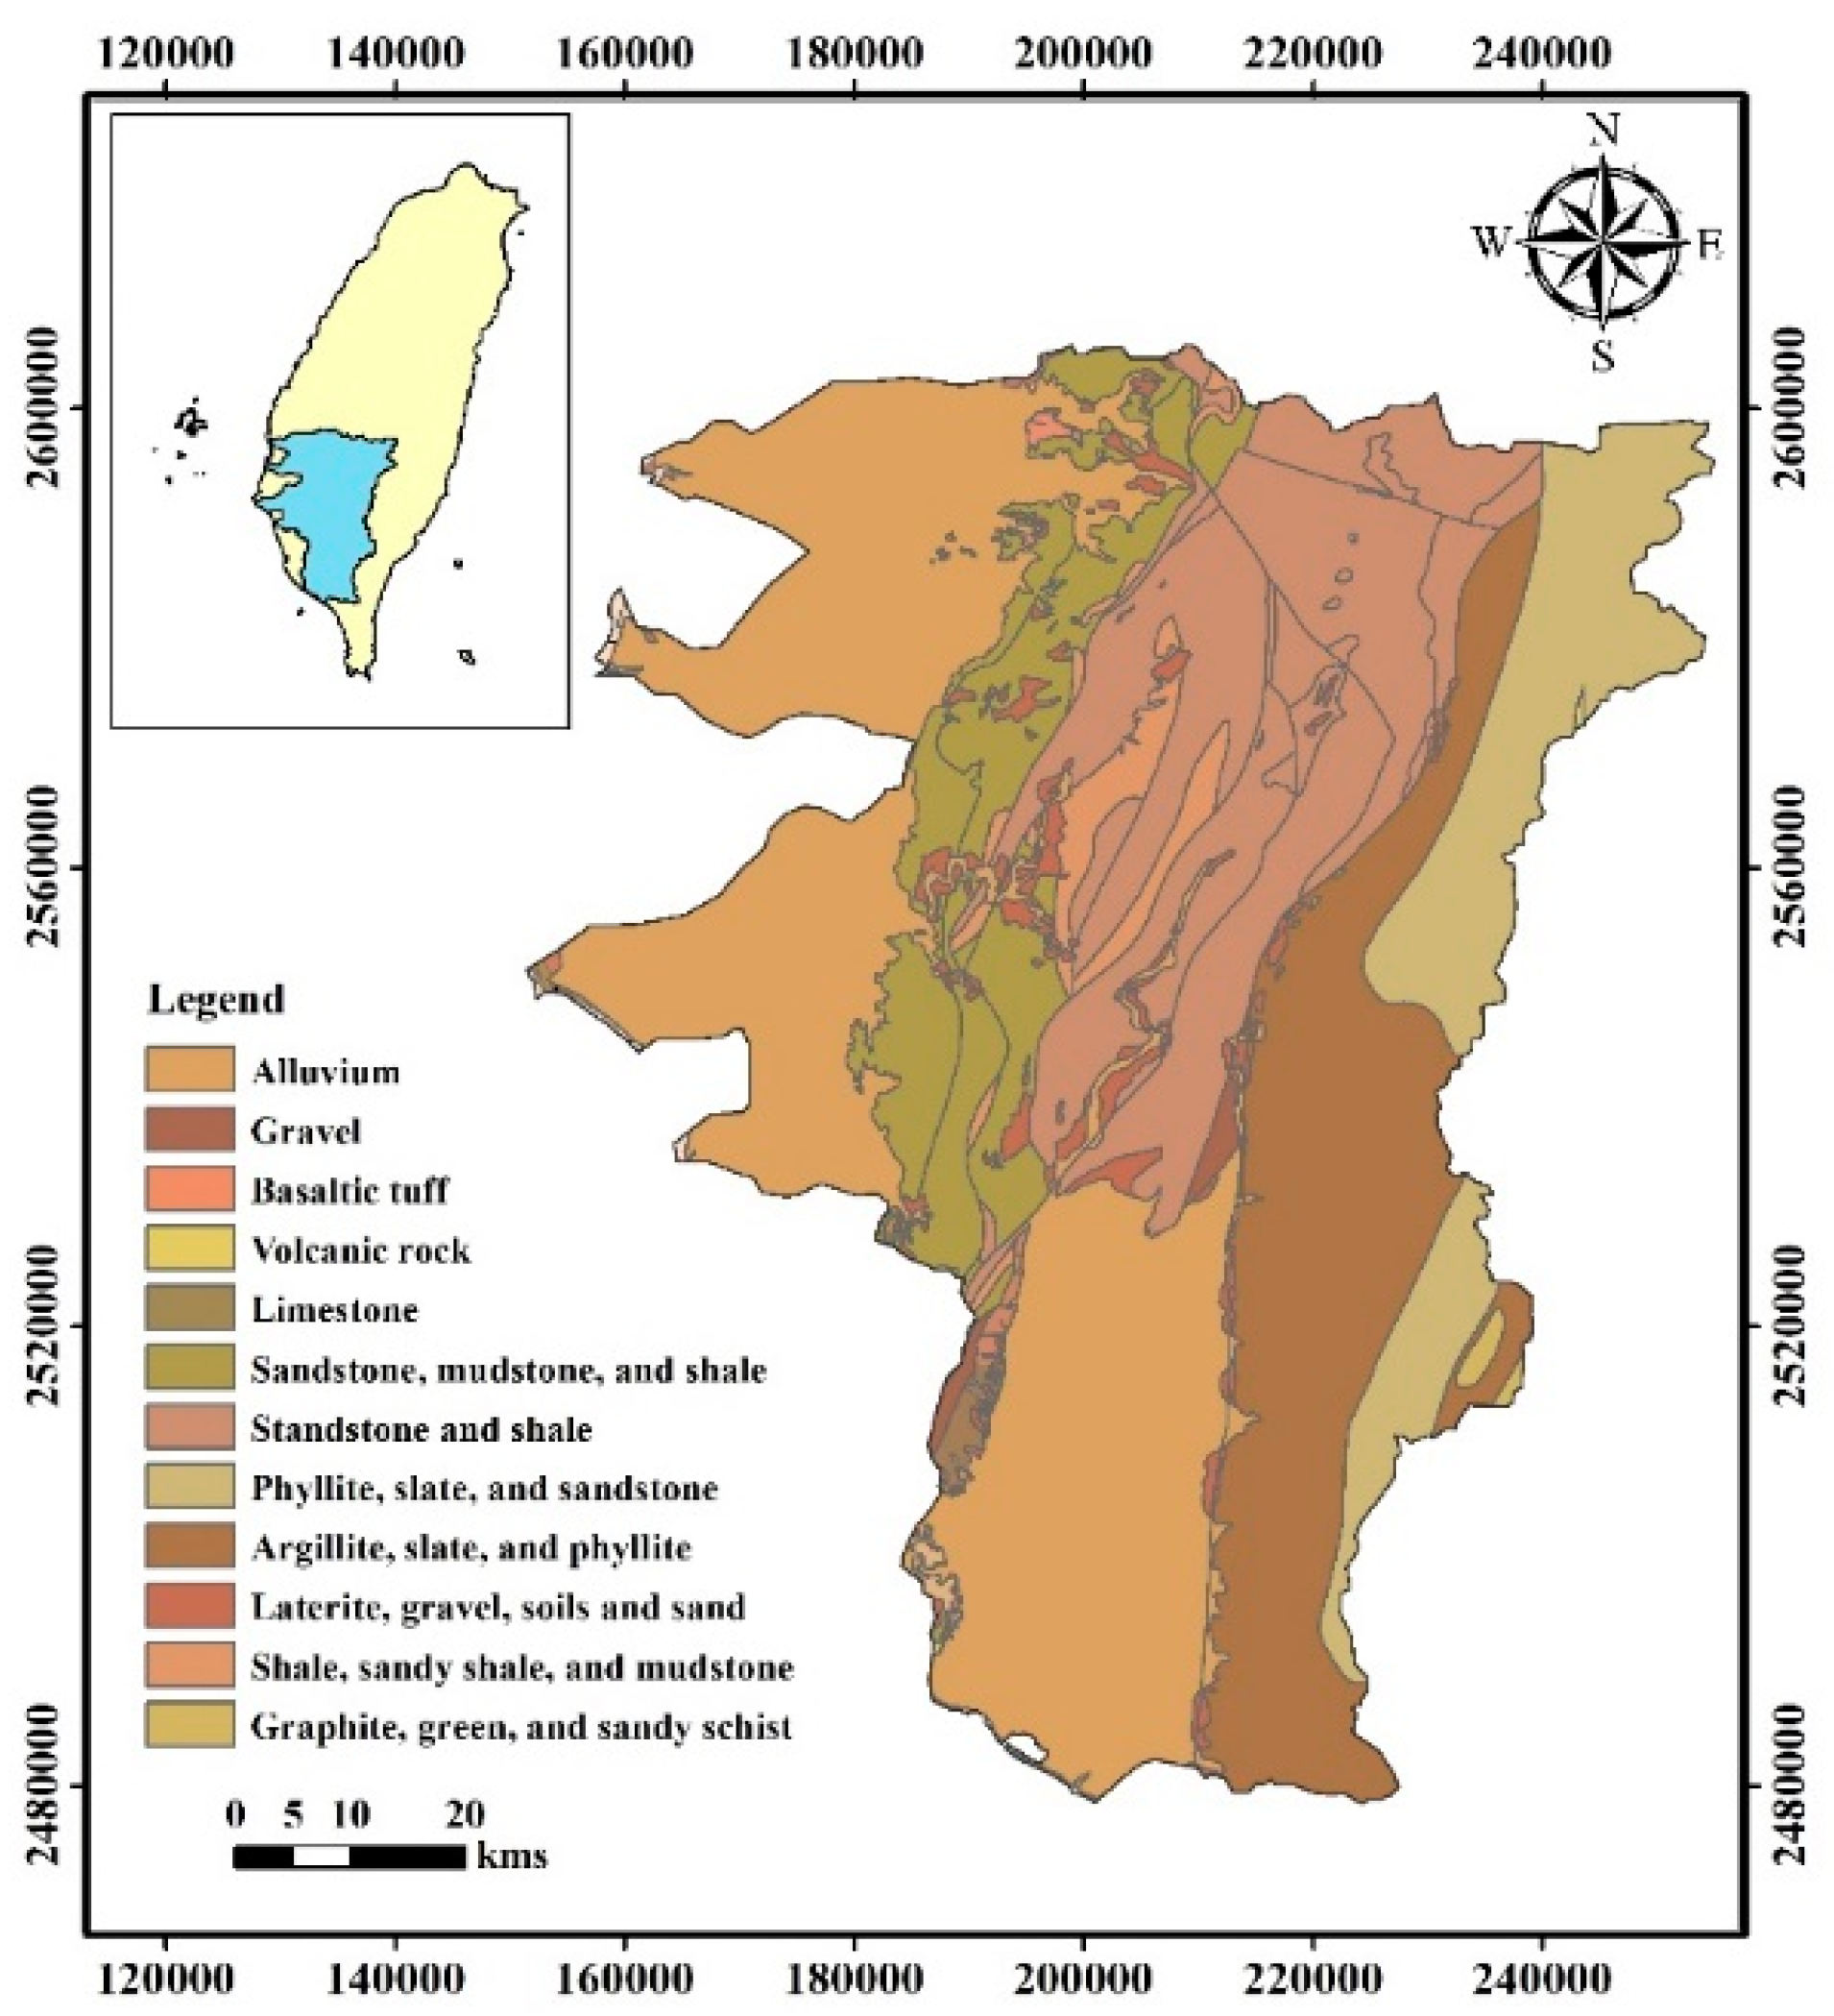
In terms of geology, Taiwan has a sedimentary geology, generally formed by sandstone, shale, mudstone, or combinations of each of these. Southern Taiwan is modern alluvium with the most abundant groundwater. In some areas, mudstone and shale exist, making the groundwater poor. A geological map of southern Taiwan is shown in Figure 2. Long-term monitoring data from 25 rainfall stations and 17 groundwater level stations in the Chianan Plain and Pingtung Plain were collected in this study. The spatial distribution map and station information are shown in Figure 1 and Table 1.
2.2. Methods
2.2.1. Standardized Precipitation Index (SPI)
The Standardized Precipitation Index used in this study was proposed by McKee et al. [15] and has been widely applied to evaluate the intensity of precipitation droughts [6,36,37,38]. It also has been listed by the World Meteorological Organization [39] as the preferred index for describing meteorological droughts. The SPI is only based on long-term rainfall data, which it can be accumulated according to different time scales. Since the precipitation data are usually skewed, it must be converted into a standard normal distribution when performing a statistical analysis. Therefore, in this study, precipitation data were first transformed to a normal distribution using the log-normal transform and then normalized in order to compute the SPI value. The SPI can be defined as shown in Equation (1):
where SPIq represents the SPI value at time scale q; wi,q is the cumulative rainfall after taking the log-normal transform; is the mean of long-term rainfall data after taking the log-normal transform, and Sw,q represents the standard deviation of the long-term rainfall data. After the SPI value is calculated, it can be classified according to its range to define different drought event intensities. This study refers to the classification proposed by McKee et al. [15], where a drought event is considered to have occurred when the SPI value is below −1. The SPI classifications are shown in Table 2.
2.2.2. Standardized Groundwater Level Index (SGI)
McKee et al. [15] suggested that the SPI analysis process can be applied to other drought-related variables, thus Bloomfield and Marchant [20] applied groundwater data to a calculation process similar to that of the SPI and proposed the Standardized Groundwater Level Index method to explore the intensity of groundwater drought and its changes. According to Bloomfield and Marchant [20], the original SGI theory is based on monthly data, and there is no need to accumulate it over different time scales, but considering the difference in climate conditions in Taiwan, if one uses monthly groundwater data to analyze groundwater drought, one can only see the oscillations in the water level. It is thus impossible to effectively distinguish drought events. Therefore, this study refers to the SPI theory of McKee et al. [15], applying the concept of accumulated precipitation to the groundwater level, and then defining the SGI as shown in Equation (3):
where SGIq represents the SGI value at time scale q; Li,q is the cumulative groundwater level; is the mean long-term groundwater data, and Sq represents the standard deviation of long-term groundwater level data. The SGI classifications are shown in Table 2.
2.2.3. Markov Chain
The Markov chain first appeared in a paper in 1906 written by the Russian mathematician Andrei Andreevich Markov [40] describing the stochastic process and providing the probability information on a transition from one state to another. The stochastic process must satisfy the “memorylessness” property; that is, the probability distribution of the future state is based solely on its present state, and is independent on previous events in the time series. The following briefly describes the Markov chain theory:
A Markov chain process is the random variables, where is the state at each time t, then
Let be the transition probability from state i at time t to state j at time t + 1; then pij can define the transition probability matrix
where , and s is the number of states.
In the current study, we consider only two states, i.e., the drought condition and the non-drought/wet condition, where the random variables can be defined as
The transition probability matrix , where , and the following drought characteristics can be obtained by using the transition probability matrix.
Steady-State Probability (p)
Although the transition matrix can only represent the evolution in a given period, the multiplication and the addition law of probability can be used to derive the future state. According to the Markov chain theory, after a long period of evolution, the so-called steady-state probability will be reached. When the steady-state is reached, the probability state is shown as Equation (6):
where p is the steady-state probability of a drought.
Mean Duration (D)
The P11 in Equation (6) represents the probability of transition from a drought to a drought in the Markov chain transition probability matrix, and D is the duration of a drought event. The form of the probability distribution is shown as Equation (7):
where n is the number of months. The equation above follows a geometric distribution with the parameter (1 − P11). Therefore, the mean duration can be expressed by Equation (8):
Drought Proneness Index (DI)
Based on the Markov chain transition probability theory, Jahangir Alam et al. [10] proposed the Drought Index (DI) as a prediction of drought proneness, for which the theory is shown as Equation (9):
The value of DI is bounded by zero and one. The higher the index, the lower the degree of drought proneness. The drought proneness corresponding to different DI values is shown in Table 3.
2.2.4. Wavelet Analysis
French geophysicist Morlet [41] first proposed the concept of the wavelet, and Grossmann and Morlet [42] published the wavelet transform theory. In addition, Mallat [43] and Daubechies [44] and others have contributed to the wavelet theory, making the theory more complete. A wavelet analysis is an extension of a Fourier analysis. In recent years, it has become a common method for analyzing the time series of hydrological and meteorological variables in a frequency domain. A wavelet analysis, also known as a wavelet transform, can be categorized into two types: A continuous wavelet transform (CWT) and a discrete wavelet transform (DWT). The continuous wavelet transform was used in this study. The basic principle of the wavelet transform is briefly described below.
A wavelet analysis is a way to use a mathematical transformation by dividing the original data into several frequency components and decomposing them into time and frequency spaces [45]. Compared to the traditional Fourier transform, a continuous wavelet transform can simultaneously take care of the resolution in both the time domain and the frequency domain, and it is a powerful tool for analyzing non-stationary time series. The theoretical basis is shown as Equation (10):
where Ψ(t) is called a wavelet; a is a scale parameter, and b is a shift parameter. The scale parameter is used to compress or stretch the wavelet function and is inversely proportional to the frequency; that is, the larger the a value, the smaller the frequency. The shift parameter moves the wavelet function to include the entire real range. When a = 1 and b = 0, it is called the mother wavelet.
There are many different forms of wavelet functions. Common wavelets include the Haar wavelet, the Mexican hat wavelet, the Meter wavelet, and the Morlet wavelet, among others. When a different wavelet is used, the resolution in time-frequency is also different. The Morlet wavelet is widely used in meteorology and hydrology [46,47]. The shape of a hydrological signal can be well described because it doesn’t have orthogonality, and the positioning effect of time-frequency localizations is better than is the case for other wavelet functions [48].
3. Results and Discussion
3.1. Drought Characteristics
3.1.1. Drought Steady-State Probability (p)
In this study, the Markov chain model based on the Standardized Precipitation Index (SPI) was used to analyze the precipitation drought steady state probability in the southern basin. The steady state probability of each station is shown in Table 4. The results show that the steady state probability ranges from 0.13 to 0.21, and the highest probability is located at the Hu Tou Pi rainfall station (YR1) in the Yanshui River basin. Figure 3 depicts the spatial distribution of drought probability, where it can be seen that the drought probability in the Yanshui River basin is higher than that in the other basins, where the average drought probability of this basin is 0.18. The lowest drought probability is located in the upstream of Gaoping River basin. The spatial distribution of the drought probability is consistent with the climatic conditions. Because the rainfall in mountainous areas in Taiwan is more abundant than that in the coastal areas, it is reasonable to assume that the drought probability caused by precipitation should be lower in the mountainous areas. According to the results of this study, the drought probability in the upstream part of the Gaoping River is between 0.13 to 0.14, which is lower than that in other coastal areas. Therefore, the results show the reliability of the method used in the present study.
3.1.2. Drought Mean Duration (D)
The precipitation drought and groundwater drought mean duration are described in this section. The results are shown in Table 5. From the precipitation drought mean duration results, it can be seen that the overall drought mean duration ranges from 3 to 7 months, and there are 5 stations where it is more than 6 months, and about 56% of the stations have a drought mean duration of more than 5 months. The highest drought mean duration occurred on the Gu Ting Keng rainfall station (RR2) in the Erren River basin with a duration of 6.9 months, while the Hu Tou Pi rainfall station (YR1) in the Yanshui River basin also was found to have a drought mean duration of 6.7 months. The spatial distribution of the drought mean duration is shown in Figure 4. The Yanshui River basin and the Erren River basin have longer drought duration than the other basins.
The groundwater drought mean duration results in the southern Taiwan basin show that most of the groundwater drought duration ranges from 7 to 30 months. Among these, it is worth noting that the groundwater level at the Zhong Zhuang groundwater level station (BG2) in the Bazhang River basin has continued to decline in recent years. According to the Zhong Zhuang groundwater level station historic data, the point at which this change occurred in 2012. The average groundwater level before the change point was −4 m, and the average groundwater level fell to −7 m after this change point. The Zhong Zhuang groundwater level station is located in Chiayi County, where, due to improper land use such as over-extraction of groundwater for agricultural water, aquaculture, industrial water, and water required for human livelihoods, the groundwater level may have been lowered in the coastal areas, resulting in continuous groundwater drought from 2012 to 2016. However, the real reason is worth investigating.
The drought duration of groundwater is much longer than the drought duration caused by rainfall, which means that once the groundwater is affected by drought, it will take more time to return to normal. Thomas et al. [49] found that groundwater drought became more serious during the dry season. They suggested that the possible reason was the reduction of surface water resource, resulting in the increased use of groundwater. In addition, the functionality of groundwater wells and regular maintenance are also reasons. In Taiwan, groundwater resources are closely related to livelihoods, the economy, and agricultural water usage. In this study, we explored the impact of precipitation change on groundwater drought but other causes have not been pointed out. However, groundwater resource is one of the important water resources in Taiwan. Therefore, a comprehensive understanding of groundwater drought is a significant issue at the present time, including how to resist and mitigate groundwater loss or even the maintenance of groundwater wells.
3.1.3. Drought Proneness Index
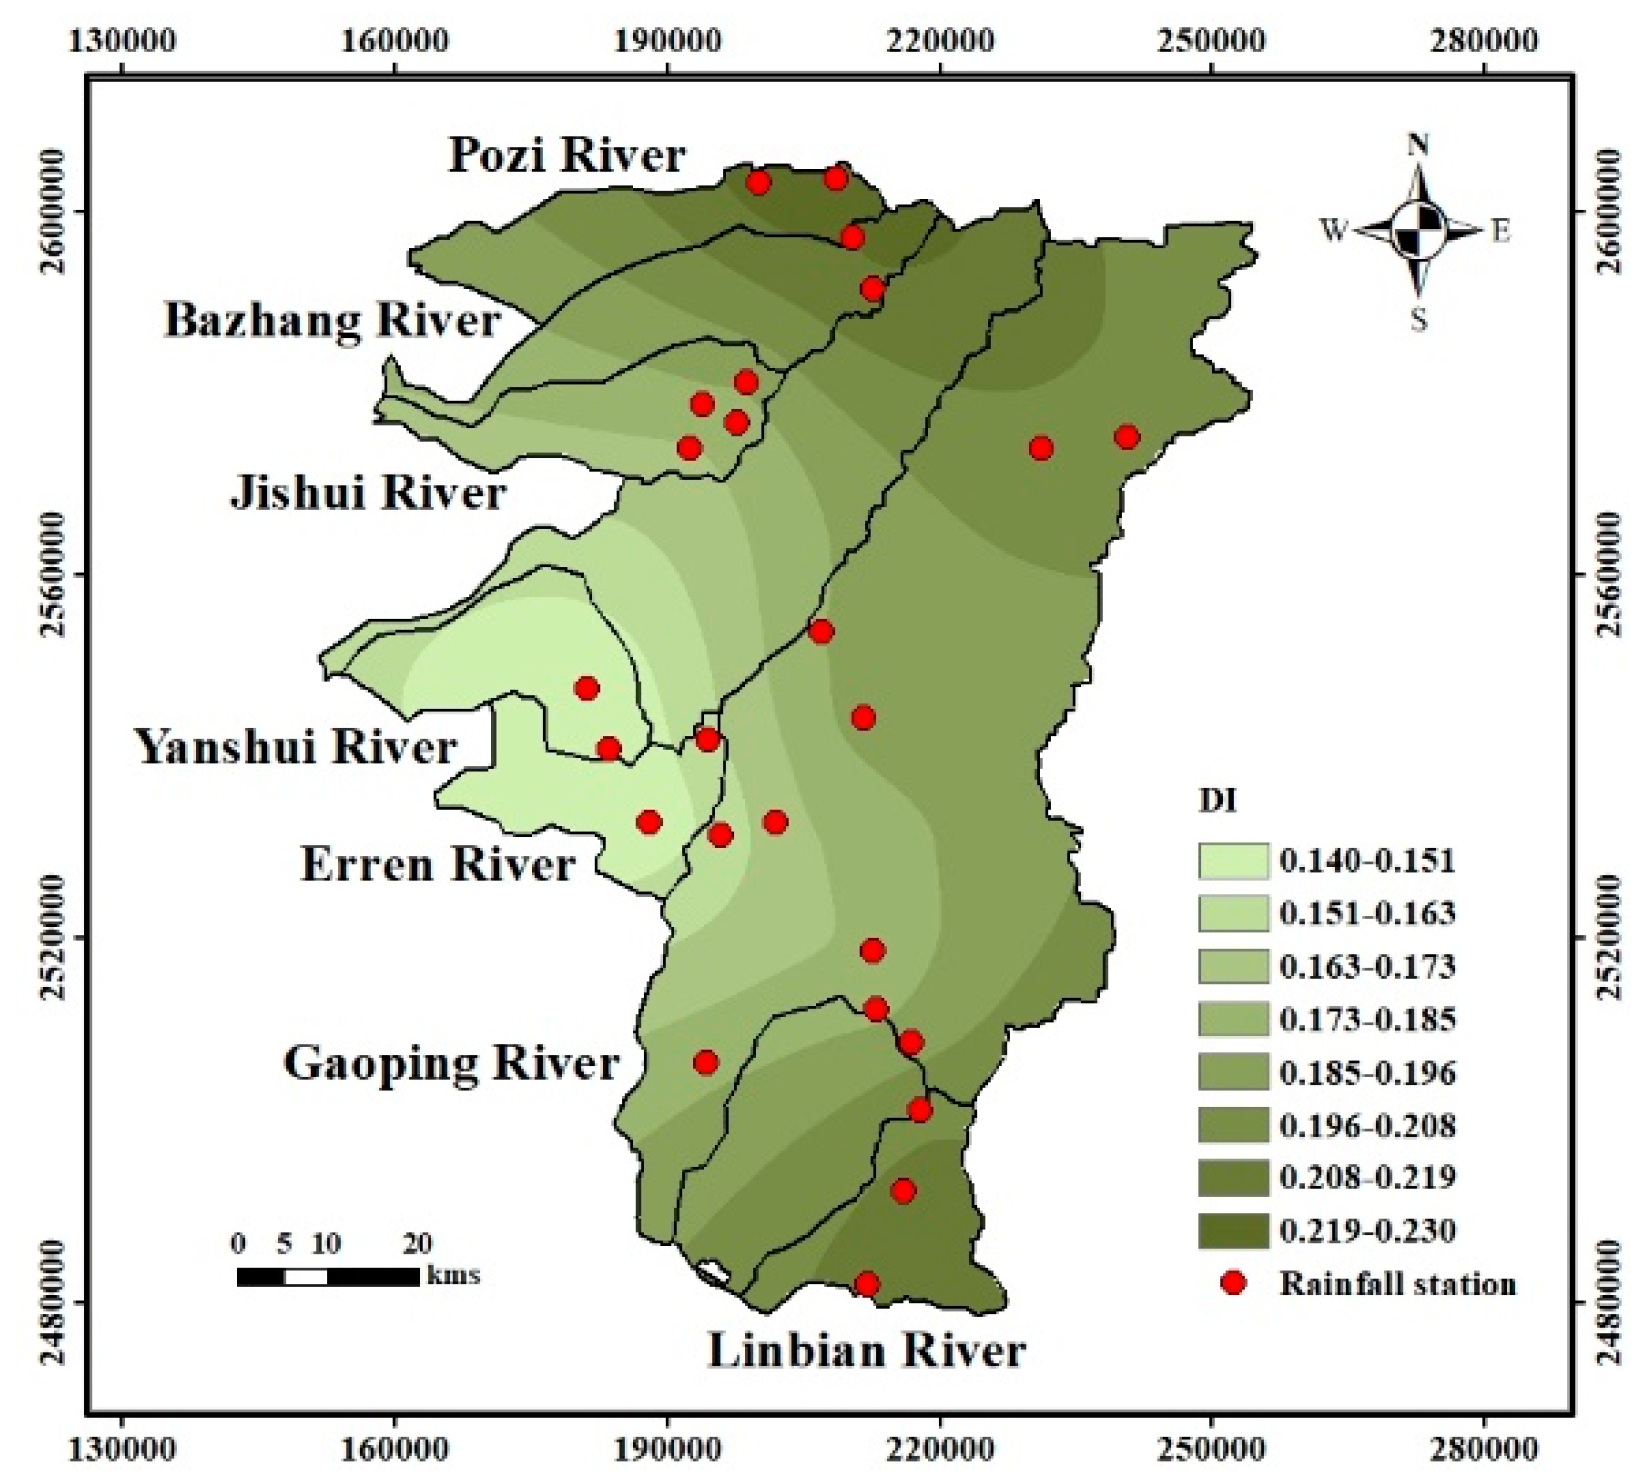
According to Jahangir Alam et al. (2013), the drought index (DI) value can be used as an assessment criterion by which to measure agricultural drought. Since the fundamental cause of agricultural drought and the groundwater drought analyzed in this study is a lack of precipitation, in this study, the DI value was used as the proneness toward groundwater drought. The drought proneness corresponding to different DI values is shown in Table 3. The results for drought proneness at each station are shown in Table 6. The results show that there are three basins with a tendency toward severe drought among the seven basins under examination: The Erren River basin, the Yanshui River basin, and the Gaoping River basin. The remaining basins are also prone to mild to moderate drought, indicating that the southern Taiwan basin may be threatened by groundwater drought in the future. The spatial distribution of DI values is shown in Figure 5.
In addition, it was found that the precipitation drought mean duration is highly linearly correlated with the DI value, and the correlation coefficient is as high as 0.99 (Figure 6), indicating that a longer duration of precipitation drought may lead to more serious groundwater drought events in the future.
3.2. Links between Precipitation and Groundwater Drought
In order to understand the relationship between hydrological drought (groundwater drought) and meteorological drought (precipitation drought), a wavelet analysis was used here to explore the linkage between groundwater and precipitation. We used the monthly SGI time series and the SPI time series at specific time scales as the input data. The results are shown in Figure 7, where the arrow indicates the phase relationship between the two time series (a negative correlation points to the left, and a positive correlation points to the right). It can be seen that the correlations among the different basins are different. The response of hydrological drought to meteorological drought is correlated with both long and short time scales. For example, Figure 7b shows that the Bazhang River basin has a high correlation on a short time scale from 1993 to 1998 and from 2010 to 2013 (2 years and 1 year, respectively). It also has a high intensity correlation during all observation periods on the long time scale (16 years). Similar results were found for the Jishui River basin, the Gaoping River basin, and the Linbian River basin (Figure 7c,f,g,i). In the past, relevant research pointed out that the relationships at short time scales may be related to local underlying surfaces, while those in long time scales may be closely associated with large-scale atmospheric circulation [6,50]. The next section further explores the effect of atmospheric circulation on drought and the relationship between them.
3.3. Links between Climate Indices and Drought
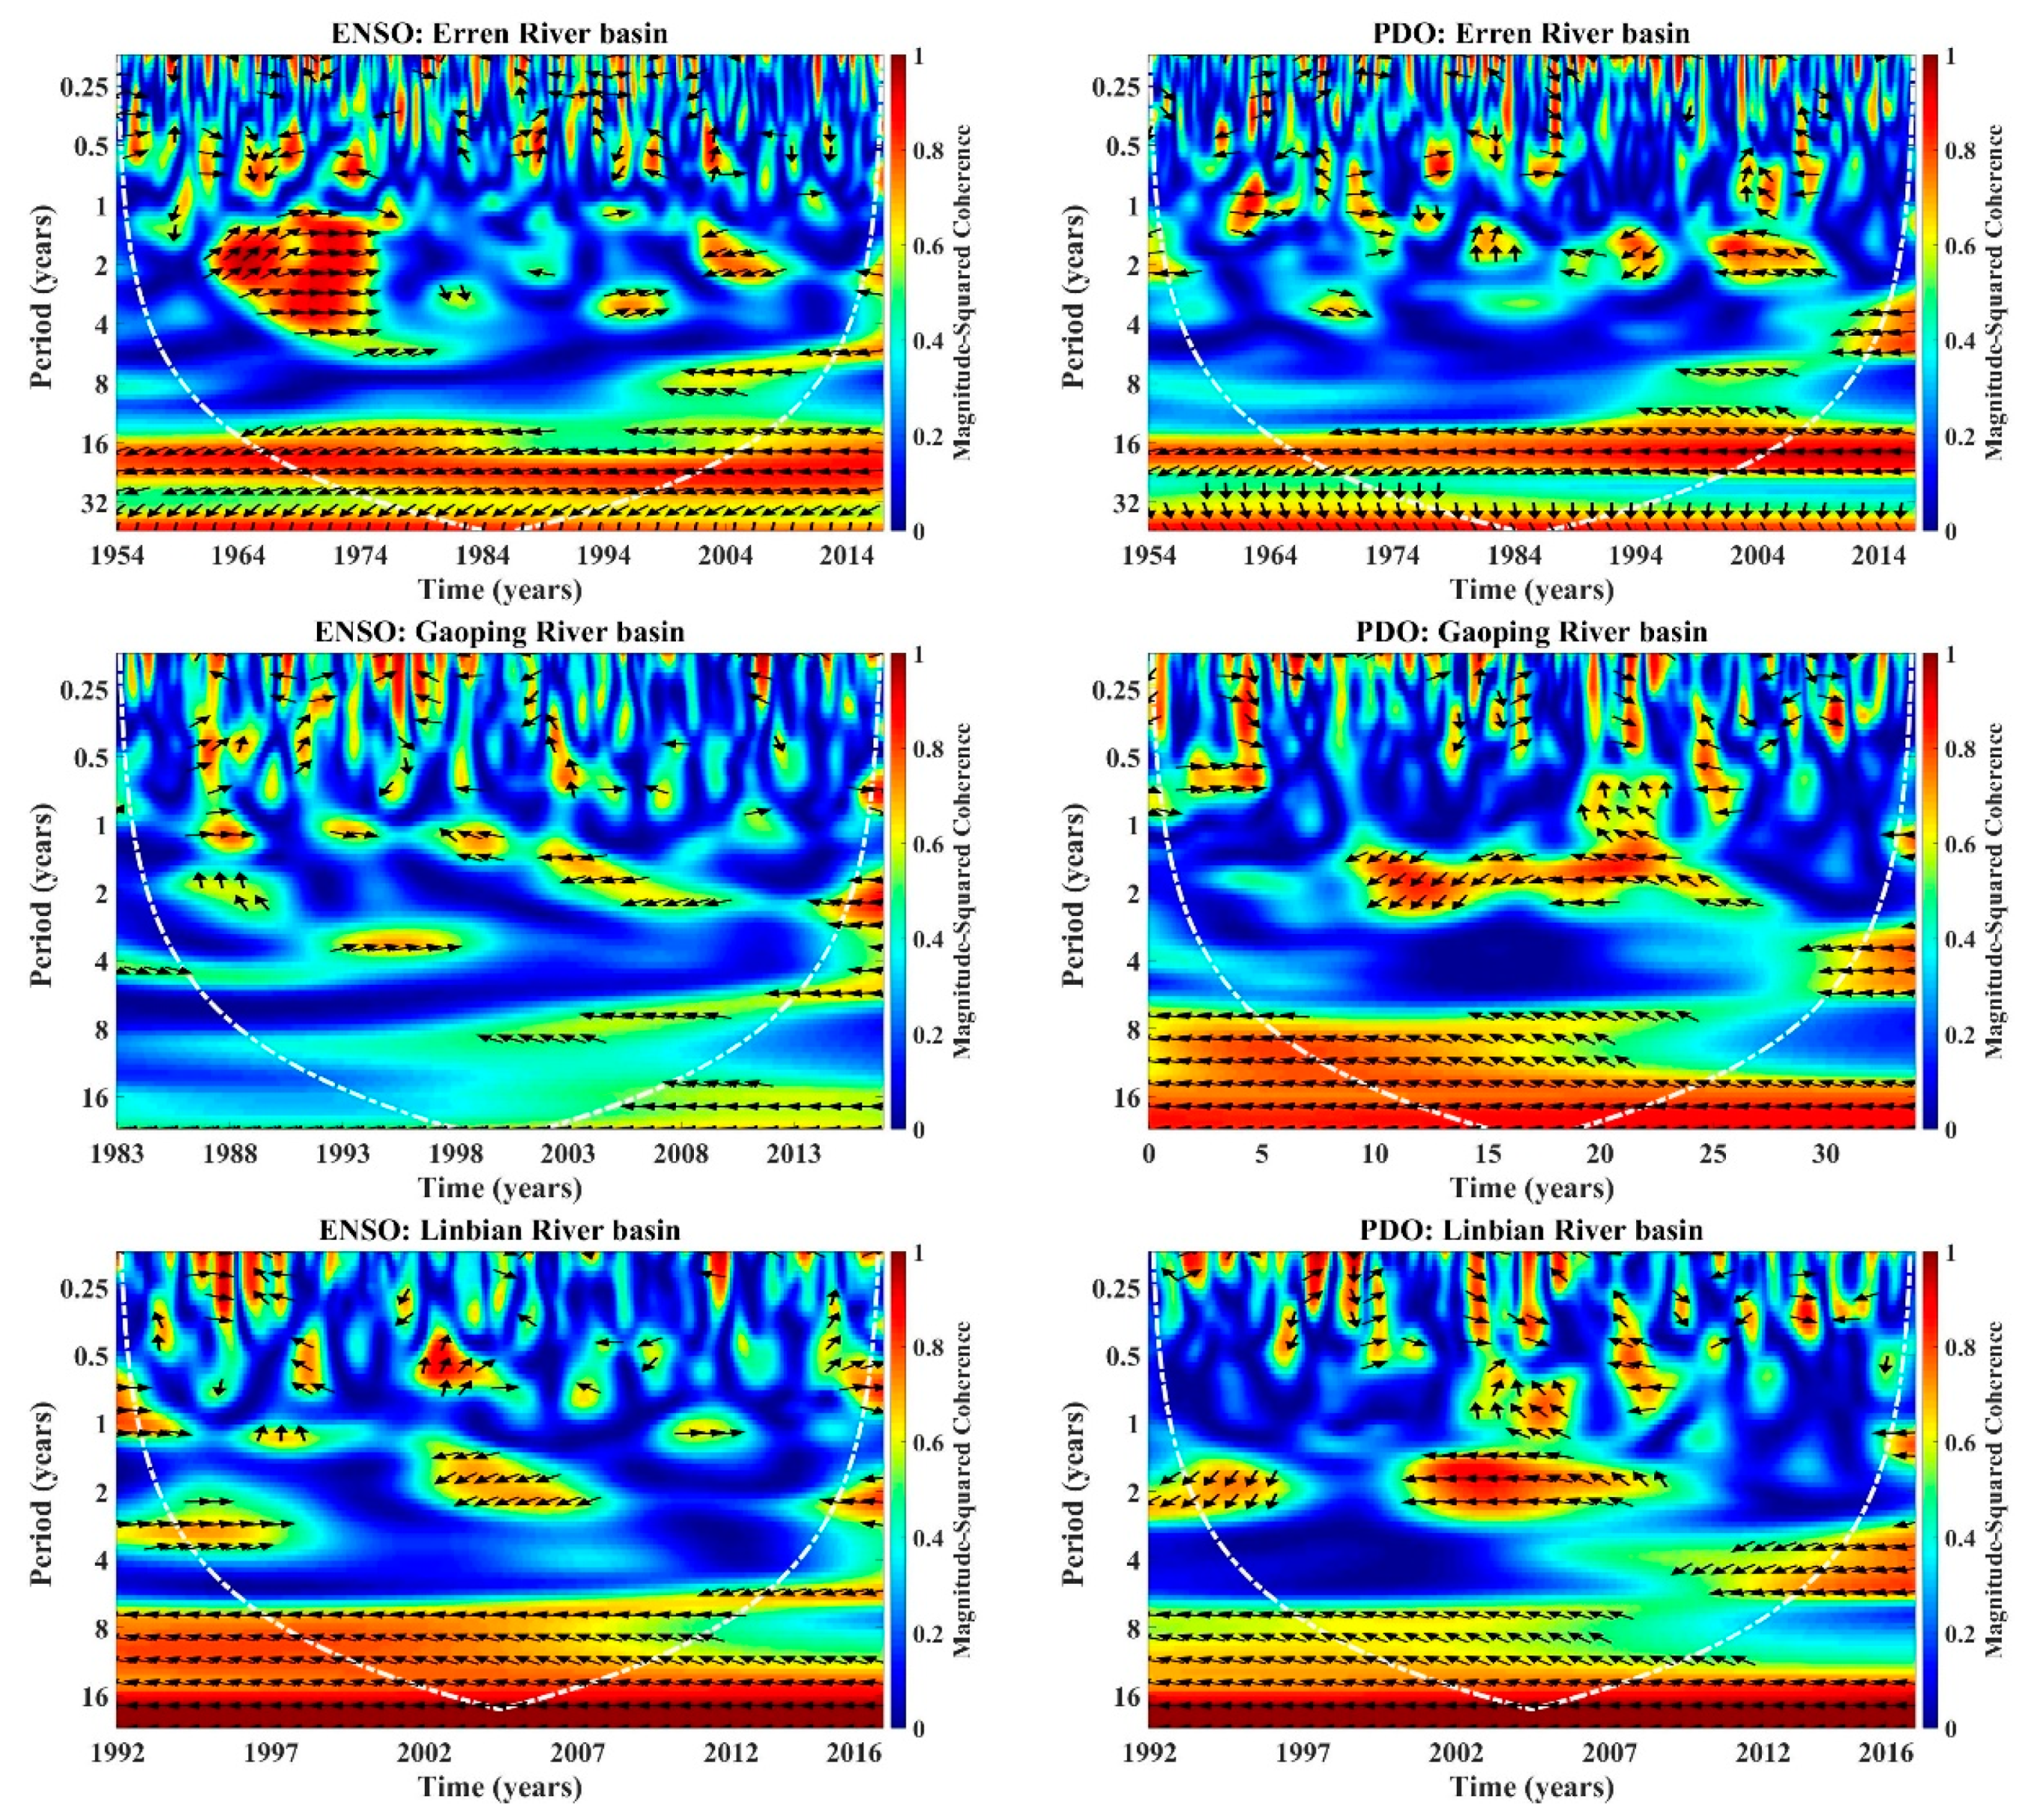
In recent years, the interrelationship between regional drought and large-scale atmospheric circulation has received great attention. A large number of studies have confirmed that the evolution of droughts in time and space can be explained by climate anomalies, such as the El Niño Southern Oscillation (ENSO), the North Atlantic Oscillation (NAO), the Pacific Decadal Oscillation (PDO), and the Atlantic Multidecadal Oscillation (AMO) [30,31,51,52,53,54,55,56]. Huang et al. [6] used a wavelet transform to analyze the correlation between meteorological and hydrological variable time series. The results showed that there are significant correlations in both short time scales and long time scales, respectively. It is speculated that the significant correlations among long time scales may be affected by atmospheric circulation. Based on the wavelet analysis, the results also indicate that the ENSO and Arctic oscillations (AOs) are negatively and positively correlated with climate variables, respectively, indicating that atmospheric circulation anomalies do have a serious impact on drought propagation. In order to determine whether the climate in Taiwan is affected by atmospheric circulation, a wavelet coherence analysis between drought index was calculated using the average precipitation for the seven basins and the atmospheric circulation. Due to the geographic location of Taiwan, the ENSO and PDO are the major atmospheric circulation types affecting Taiwan. Therefore, the ENSO and PDO climate factors and the precipitation drought index were used for the wavelet coherence analysis. The results are shown in Figure 8. The arrow pointing to the right indicates a positive correlation; pointing to the left indicates a negative correlation.
The results show that each basin indicates that atmospheric circulation has a degree of correlation with precipitation and most of them are negatively correlated. However, the corresponding situations are different for each basin. In the case of the ENSO, there is a strong negative correlation with a period of 2 to 4 years in each basin, which is consistent with the cycle of ENSO events. When ENSO events occur, the ENSO index is positive. The Asia region is under high pressure conditions, making the climate dry, indicating a negative correlation between the ENSO index and the SPI.
In terms of PDO, in addition to the correlation with a period of 2 to 4 years, there is also a significant correlation for the longer period (16 to 32 years). Since the PDO is atmospheric circulation with a decadal periodic scale, the transformation period is about 20 to 30 years. It can thus be considered a larger ENSO event. According to past climate reports and studies, when a PDO event occurred, there was more spring rain in Taiwan [57]. However, since the annual rainfall did not change much in the past in Taiwan, there may be a drought at the end of the year. Because Taiwan is located in the monsoon climate zone, drought has teleconnections with the global climate indices. Many studies have focused on the teleconnection between drought and atmospheric circulation [58,59,60]. In the future, we can conduct an examination of seasonal characteristics on the climate of Taiwan, and explore the season in which atmospheric circulation has the strongest impact.
4. Conclusions
In this study, long-term records of 25 rainfall stations and 17 groundwater level stations in southern Taiwan basins were collected. We used the Markov chain model based on the Standardized Precipitation Index (SPI) and the Standardized Groundwater Level Index (SGI) to analyze the drought characteristics in the southern Taiwan basin and to create its spatial distribution map. We also used wavelet analysis to explore the relationship between precipitation and groundwater as well as the correlations between rainfall patterns and climate indices. The results showed the precipitation drought steady state probability in the Yanshui River basin to be 0.18, which is higher than other basins in Taiwan. In terms of drought mean duration, the precipitation drought mean duration in the Yanshui River basin and the Erren River basin is 6.29 months and 5.99 months, respectively, and the overall precipitation drought mean duration ranges from 3 to 7 months. The results also indicate that the drought mean duration caused by groundwater is longer than that caused by precipitation. In addition, in the analysis of drought proneness, it was found that the DI value has a strong negative correlation with precipitation drought mean duration, and the correlation coefficient is as high as 0.99, which indicates that when there is a longer drought duration caused by precipitation, a more serious groundwater drought will occur in the future. Overall, based on the results discussed above, the Yanshui River basin is a region with a high degree of drought. Finally, in the wavelet analysis, there were strong correlation found between precipitation and groundwater at long time scales, which could be related to atmospheric circulation. In this study, wavelet coherence between precipitation and ENSO/PDO was carried out and showed that atmospheric circulation does influence the precipitation pattern in Taiwan and in turn, affects the groundwater. A more detailed analysis is worth conducting in the future. This study continues the work of predecessors using a drought index analysis to assess drought events, where the Markov chain model tool was added for the probability analysis and a wavelet transform was used to analyze the drought event information effectively. Therefore, the method used in this study combined with long-term monitoring data can provide insights into the drought situation in all regions in Taiwan and can also provide a reference for water resource management and deployment in the future.
Author Contributions
H.-F.Y. contrived the subject of the article, performed the literature review, and contributed to the writing of the paper; H.-L.H. participated in data processing and the elaboration of the statistical analysis and figures.
Funding
This research received no external funding.
Conflicts of Interest
The authors declare no conflict of interest.
References
- IPCC. Summary for policymakers. In Climate Chang. 2013: The Physical Science Basis. Contribution of Working Group I to the Fifth Assessment Report of the Intergovernmental Panel on Climate Change; Stocker, T.F., Qin, D., Plattner, G.K., Tignor, M., Allen, S.K., Boschung, J., Nauels, A., Xia, Y., Bex, V., Midgley, P.M., Eds.; Cambridge University Press: Cambridge, UK; New York, NY, USA, 2013. [Google Scholar]
- Kunkel, K.E. North American trends in extreme precipitation. Nat. Hazards 2003, 29, 291–305. [Google Scholar] [CrossRef]
- Christensen, O.B.; Christensen, J.H. Intensification of extreme European summer precipitation in a warmer climate. Global Planet. Chang. 2004, 44, 107–117. [Google Scholar] [CrossRef]
- Leng, G.; Tang, Q.; Rayburg, S. Climate change impacts on meteorological, agricultural and hydrological droughts in China. Global Planet. Chang. 2015, 126, 23–34. [Google Scholar] [CrossRef] [Green Version]
- Leng, G.; Tang, Q.; Huang, S.; Zhang, X.; Cao, J. Assessments of joint hydrological extreme risks in a warming climate in China. Int. J. Climatol. 2016, 36, 1632–1642. [Google Scholar] [CrossRef]
- Huang, S.; Li, P.; Huang, Q.; Leng, G.; Hou, B.; Ma, L. The propagation from meteorological to hydrological drought and its potential influence factors. J. Hydrol. 2017, 547, 184–195. [Google Scholar] [CrossRef]
- Ahmad, J.S.; Low, K.S. Droughts in Malaysia: A look at its characteristics, impacts, related policies and management strategies. In Proceedings of the Water and Drainage Conference, Malaysia, 28–29 April 2003. [Google Scholar]
- Sheffield, J.; Wood, E.F. Global trends and variability in soil moisture and drought characteristics, 1950–2000, from observation-driven simulations of the terrestrial hydrologic cycle. J. Clim. 2008, 21, 432–458. [Google Scholar] [CrossRef]
- Mishra, A.K.; Singh, V.P. A review of drought concepts. J. Hydrol. 2010, 391, 202–216. [Google Scholar] [CrossRef]
- Jahangir Alam, A.T.M.; Rahman, M.S.; Saadat, A.H.M. Monitoring meteorological and agricultural drought dynamics in Barind region Bangladesh using standard precipitation index and Markov chain model. Int. J. Geomater. Geosci. 2013, 3, 511–524. [Google Scholar]
- Habibi, B.; Meddi, M.; Torfs, P.J.; Remaoun, M.; Van Lanen, H.A. Characterisation and prediction of meteorological drought using stochastic models in the semi-arid Chéliff–Zahrez basin (Algeria). J. Hydrol. Reg. Stud. 2018, 16, 15–31. [Google Scholar] [CrossRef]
- TaiCCAT. Taiwan Integrated Research Program on Climate Change Adaptation Technology. e-News, 2015; 11, 1–6. [Google Scholar]
- Palmer, W.C. Meteorological Drought; Research Paper No. 45; US Department of Commerce Weather Bureau: Washington, DC, USA, 1965.
- Shafer, B.A.; Dezman, L.E. Development of a surface water supply index (SWSI) to assess the severity of drought conditions in snowpack runoff areas. In Proceedings of the 50th Annual Western Snow Conference, Reno, NV, USA, 19–23 April 1982. [Google Scholar]
- McKee, T.B.; Doesken, N.J.; Kleist, J. The relationship of drought frequency and duration to time scales. In Proceedings of the Eighth Conference on Applied Climatology, Anaheim, CA, USA, 17–22 January 1993. [Google Scholar]
- Tsakiris, G.; Vangelis, H. Establishing a drought index incorporating evapotranspiration. Eur. Water 2005, 9, 3–11. [Google Scholar]
- Nalbantis, I. Evaluation of a hydrological drought index. Eur. Water 2008, 23, 67–77. [Google Scholar]
- Nalbantis, I.; Tsakiris, G. Assessment of hydrological drought revisited. Water Resour. Manag. 2009, 23, 881–897. [Google Scholar] [CrossRef]
- Sharma, T.C.; Panu, U.S. Analytical procedures for weekly hydrological droughts: A case of Canadian rivers. Hydrol. Sci. J. 2010, 55, 79–92. [Google Scholar] [CrossRef]
- Bloomfield, J.P.; Marchant, B.P. Analysis of groundwater drought building in the standardized precipitation index approach. Hydrol. Earth Syst. Sci. 2013, 17, 4769–4787. [Google Scholar] [CrossRef]
- Mu, Q.Z.; Zhao, M.S.; Kimball, J.S.; McDowell, N.G.; Running, S.W. A remotely sensed global terrestrial drought severity index. Bull. Am. Meteorol. Soc. 2013, 94, 83–98. [Google Scholar] [CrossRef]
- Liu, M.; Xu, X.; Xu, C.; Sun, A.Y.; Wang, K.; Scanlon, B.R.; Zhang, L. A new drought index that considers the joint effects of climate and land surface change. Water Resour. Res. 2017, 53, 3262–3278. [Google Scholar] [CrossRef]
- Paulo, A.A.; Pereira, L.S. Prediction of SPI drought class transitions using Markov chains. Water Resour. Manag. 2007, 21, 1813–1827. [Google Scholar] [CrossRef]
- Paulo, A.A.; Ferreira, E.; Coelho, C.; Pereira, L.S. Drought class transition analysis through Markov and loglinear models, an approach to early warning. Agric. Water Manag. 2005, 77, 59–81. [Google Scholar] [CrossRef]
- Paulo, A.A.; Pereira, L.S. Stochastic prediction of drought class transition. Water Resour. Manag. 2008, 22, 1277–1296. [Google Scholar] [CrossRef]
- Sanusi, W.; Jemain, A.A.; Zin, W.Z.W.; Zahari, M. The drought characteristics using the first-order homogeneous Markov chain of monthly rainfall data in peninsular Malaysia. Water Resour. Manag. 2015, 29, 1523–1539. [Google Scholar] [CrossRef]
- Tabari, H.; Zamani, R.; Rahmati, H.; Willems, P. Markov chain of different orders for streamflow drought analysis. Water Resour. Manag. 2015, 29, 3441–3457. [Google Scholar] [CrossRef]
- Banik, P.; Mandal, A.; Rahman, M.S. Markov chain analysis of weekly rainfall data in determining drought-proneness. Discrete Dyn. Nat. Soc. 2002, 7, 231–239. [Google Scholar] [CrossRef]
- Jahangir Alam, A.T.M.; Saadat, A.H.M.; Rahman, M.S.; Barkotulla, M.A.B. Spatial analysis of rainfall distribution and its impact on agricultural drought at barind region, Bangladesh. Rajshahi Univ. J. Environ. Sci. 2011, 1, 40–50. [Google Scholar]
- Zhang, Q.; Lu, W.; Chen, S.; Liang, X. Using multifractal and wavelet analyses to determine drought characteristics: A case of Jilin province, China. Theor. Appl. Climatol. 2016, 125, 829–840. [Google Scholar] [CrossRef]
- Wang, Y.; Zhang, T.; Chen, X.; Li, J.; Feng, P. Spatial and temporal characteristics of droughts in Luanhe River basin, China. Theor. Appl. Climatol. 2018, 131, 1369–1385. [Google Scholar] [CrossRef]
- Lin, Q.X.; Wu, Z.Y.; Singh, V.P.; Sadeghi, S.H.R.; He, H.; Lu, G.H. Correlation between hydrological drought, climatic factors, reservoir operation, and vegetation cover in the Xijiang Basin, South China. J. Hydrol. 2017, 549, 512–524. [Google Scholar] [CrossRef]
- Meehl, G.A.; Karl, T.; Easterling, D.R.; Changnon, S.; Pielke, R., Jr.; Changnon, D.; Evans, J.; Groisman, P.Y.; Knutson, T.R.; Kunkel, K.E.; et al. An introduction to trends in extreme weather and climate events: Observations, socioeconomic impacts, terrestrial ecological impacts, and model projections. Bull. Am. Meteorol. Soc. 2000, 81, 413–416. [Google Scholar] [CrossRef]
- Arnell, N.W. Climate change and global water resources: SRES emissions and socio-economic scenarios. Glob. Environ. Chang. 2004, 14, 31–52. [Google Scholar] [CrossRef]
- Water Resources Agency Ministry of Economic Affairs. Hydrological Year Book of Taiwan; Water Resources Agency Ministry of Economic Affairs: Taichung, Taiwan, 2017.
- Liu, B.; Zhou, X.; Li, W.; Lu, C.; Shu, L. Spatiotemporal characteristics of groundwater drought and its response to meteorological drought in Jiangsu Province, China. Water 2016, 8, 480. [Google Scholar] [CrossRef]
- Rad, A.M.; Khalili, D.; Kamgar-Haghighi, A.A.; Zand-Parsa, S.; Banimahd, S.A. Assessment of seasonal characteristics of streamflow droughts under semiarid conditions. Nat. Hazards 2016, 82, 1541–1564. [Google Scholar]
- Lorenzo-Lacruz, J.; Garcia, C.; Morán-Tejeda, E. Groundwater level responses to precipitation variability in Mediterranean insular aquifers. J. Hydrol. 2017, 552, 516–531. [Google Scholar] [CrossRef]
- Svoboda, M.; Hayes, M.; Wood, D.A. Standardized Precipitation Index User Guide; Tech. Rep. WMO-No. 1090; World Meteorological Organization: Geneva, Switzerland, 2012. [Google Scholar]
- Seneta, E. Markov and the birth of chain dependence theory. Int. Stat. Rev. 1996, 64, 255–263. [Google Scholar] [CrossRef]
- Morlet, J.; Arens, G.; Fourgeau, D.; Glard, D. Wave propagation and sampling theory. Geophysics 1982, 47, 203–236. [Google Scholar] [CrossRef]
- Grossmann, A.; Morlet, J. Decomposition of hardy function into square integrable wavelets of constant shape. SIAM J. Math. Phys. 1984, 15, 723–736. [Google Scholar] [CrossRef]
- Mallat, S.G. A theory for multiresolution signal decomposition: The wavelet representation. IEEE Trans. Pattern Ana. Mach. Intell. 1989, 11, 674–693. [Google Scholar] [CrossRef]
- Daubechies, I. Orthonormal bases of compactly supported wavelets. Commun. Pure Appl. Math. 1988, 41, 909–996. [Google Scholar] [CrossRef] [Green Version]
- Torrence, C.; Webster, P.J. The annual cycle of persistence in the El Nño/Southern Oscillation. Quart. J. R. Meteor. Soc. 1998, 124, 1985–2004. [Google Scholar] [CrossRef]
- Lafreniere, M.; Sharp, M. Wavelet analysis of inter-annual variability in the runoff regimes of glacial and nival stream catchments, Bow Lake, Alberta. Hydrol. Process. 2003, 17, 1093–1118. [Google Scholar] [CrossRef]
- Labat, D. Wavelet analysis of the annual discharge records of the world’s largest rivers. Adv. Water Resour. 2008, 31, 109–117. [Google Scholar] [CrossRef]
- Labat, D.; Ronchail, J.; Guyot, J.L. Recent advances in wavelet analyses: Part 2-Amazon, Parana, Orinoco and Congo discharges time scale variability. J. Hydrol. 2005, 314, 289–311. [Google Scholar] [CrossRef]
- Thomas, E.A.; Needoba, J.; Kaberia, D.; Butterworth, J.; Adams, E.C.; Oduor, P.; Macharia, D.; Mitheu, F.; Mugo, R.; Nagel, C. Quantifying increased groundwater demand from prolonged drought in the East African Rift Valley. Sci. Total Environ. 2019, 666, 1265–1272. [Google Scholar] [CrossRef]
- Medved-Cvikl, B.; Ceglar, A.; Kajfe-Bogataj, L. The response of hydrological droughts to climatic droughts at different time scales in Dravinja, Savinja and Krka Basins in Slovenia. In Proceedings of the International Conference BALWOIS, Ohrid, Macedonia, 28 May–2 Jun 2012. [Google Scholar]
- Özger, M.; Mishra, A.K.; Singh, V.P. Low frequency drought variability associated with climate indices. J. Hydrol. 2009, 364, 152–162. [Google Scholar] [CrossRef]
- Yin, Y.; Xu, Y.; Chen, Y. Relationship between flood/drought disasters and ENSO from 1857 to 2003 in the Taihu Lake basin, China. Quat. Int. 2009, 208, 93–101. [Google Scholar] [CrossRef]
- Oglesby, R.; Feng, S.; Hu, Q.; Rowe, C. The role of the Atlantic Multidecadal Oscillation on medieval drought in North America: Synthesizing results from proxy data and climate models. Global Planet. Chang. 2012, 84, 56–65. [Google Scholar] [CrossRef]
- Chen, F.; Yuan, Y.J.; Chen, F.H.; Wei, W.S.; Yu, S.L.; Chen, X.J.; Fan, Z.A.; Zhang, R.B.; Zhang, T.W.; Shang, H.M.; et al. A 426-year drought history for Western Tian Shan, Central Asia inferred from treerings and its linkages to the North Atlantic and Indo-West Pacific Oceans. The Holocene 2013, 23, 1095–1104. [Google Scholar] [CrossRef]
- Zhang, J.; Li, D.L.; Li, L.; Deng, W.T. Decadal variability of droughts and floods in the Yellow River basin during the last five centuries and relations with the North Atlantic SST. Int. J. Climatol. 2013, 33, 3217–3228. [Google Scholar] [CrossRef] [Green Version]
- Guo, H.; Bao, A.; Liu, T.; Ndayisaba, F.; Jiang, L.; Kurban, A.; De Maeyer, P. Spatial and temporal characteristics of droughts in Central Asia during 1966–2015. Sci. Total Environ. 2018, 624, 1523–1538. [Google Scholar] [CrossRef]
- Hung, C.W.; Hsu, H.H.; Lu, M.M. Decadal oscillation of spring rain in northern Taiwan. Geophys. Res. Lett. 2004, 31, L22206. [Google Scholar] [CrossRef]
- Huang, S.; Huang, Q.; Chang, J.; Zhu, Y.; Leng, G.; Xing, L. Drought structure based on a nonparametric multivariate standardized drought index across the Yellow River basin, China. J. Hydrol. 2015, 530, 127–136. [Google Scholar] [CrossRef]
- Tan, X.; Gan, T.Y.; Shao, D. Wavelet analysis of precipitation extremes over Canadian ecoregions and teleconnections to large-scale climate anomalies. J. Geophys. Res. Atmos. 2016, 121, 14469–14486. [Google Scholar] [CrossRef]
- Deng, S.; Chen, T.; Yang, N.; Qu, L.; Li, M.; Chen, D. Spatial and temporal distribution of rainfall and drought characteristics across the Pearl River basin. Sci. Total Environ. 2018, 619, 28–41. [Google Scholar] [CrossRef] [PubMed]
Figure 1.
Spatial distribution of the elevation and rainfall stations and the groundwater level stations in the southern Taiwan basin.
Figure 1.
Spatial distribution of the elevation and rainfall stations and the groundwater level stations in the southern Taiwan basin.

Figure 2.
Geological distribution of the southern Taiwan basin.

Figure 3.
Spatial distribution of precipitation drought steady state probability in the southern Taiwan basin.
Figure 3.
Spatial distribution of precipitation drought steady state probability in the southern Taiwan basin.

Figure 4.
Spatial distribution of precipitation drought mean duration in the southern Taiwan basin.

Figure 5.
Spatial distribution of the drought index in the southern Taiwan basin.

Figure 6.
The relationship between precipitation drought mean duration and DI value.

Figure 7.
The wavelet coherence between SPI and SGI in each basin.


Figure 8.
The wavelet coherence between ENSO/PDO and SPI at each basin.


Table 1.
Information on the rainfall stations and groundwater level stations in the southern Taiwan basin.
Table 1.
Information on the rainfall stations and groundwater level stations in the southern Taiwan basin.
| Basin | Rainfall Station | Short Name | Record Year | Groundwater Level Station | Short Name | Record Year |
|---|---|---|---|---|---|---|
| Pozi River | Zhang Nao Liao-2 | PR1 | 1961–2016 | Dong Shi | PG1 | 1986–2014 |
| Sha Keng | PR2 | 1966–2015 | ||||
| Bazhang River | Da Hu Shan | BR1 | 1953–2016 | Zhong Liao | BG1 | 1988–2016 |
| Xiao Gong Tian-2 | BR2 | 1967–2015 | Zhong Zhuang | BG2 | 1992–2016 | |
| Jishui River | Guan Zi Ling-2 | GR1 | 1958–2016 | Liu Ying-1 | GG1 | 1995–2016 |
| Bei Liao | GR2 | 1958–2016 | ||||
| Liu Xi | GR3 | 1959–2016 | Liu Ying-2 | GG2 | 1995–2016 | |
| Dong Yuan | GR4 | 1959–2016 | ||||
| Yanshui River | Hu Tou Pi | YR1 | 1981–2016 | Yong Kang-1 | YG1 | 1996–2016 |
| Qi Ding | YR2 | 1952–2016 | Xiao Xin-1 | YG2 | 1997–2016 | |
| Erren River | Mu Zha | RR1 | 1953–2016 | Ren De-1 | RG1 | 1991–2016 |
| Gu Ting Keng | RR2 | 1953–2016 | ||||
| Gaoping River | Gu Xia | KR1 | 1954–2016 | Shi Hua-1 | KG1 | 1991–2016 |
| Jia Xian-2 | KR2 | 1952–2016 | Lin Yuan-1 | KG2 | 1996–2016 | |
| Ping Dong-5 | KR3 | 1947–2016 | Xi Pu-1 | KG3 | 1996–2016 | |
| Meinong 2 | KR4 | 1960–2016 | Jiu Qu-1 | KG4 | 1996–2016 | |
| Qi Shan-4 | KR5 | 1961–2016 | Ji Yang work station | KG5 | 1991–2016 | |
| Shan Di Men | KR6 | 1965–2016 | Tu Ku-1 | KG6 | 1991–2016 | |
| Tian Chi | KR7 | 1979–2016 | Li Gang-1 | KG7 | 1996–2016 | |
| Mei Shan-2 | KR8 | 1979–2016 | ||||
| Liu Gui-4 | KR9 | 1982–2016 | ||||
| Xin Ma Jia | KR10 | 1976–2016 | ||||
| Linbian River | Tai Wu-1 | LR1 | 1991–2016 | Da Xiang-1 | LG1 | 1997–2016 |
| Nan Han | LR2 | 1966–2016 | Qi Feng-1 | LG2 | 1997–2016 | |
| Xin La Yi | LR3 | 1972–2016 |
Table 2.
The standard precipitation index (SPI) and standardized groundwater level index (SGI) classifications (McKee et al., 1993).
Table 2.
The standard precipitation index (SPI) and standardized groundwater level index (SGI) classifications (McKee et al., 1993).
| Drought Severity | SPI; SGI |
|---|---|
| Near normal | −1.0 < SPI; SGI ≤ 0 |
| Moderate drought | −1.5 < SPI; SGI ≤ −1.0 |
| Severe drought | −2.0 < SPI; SGI ≤ −1.5 |
| Extreme drought | SPI; SGI ≤ −2 |
Table 3.
Drought proneness index classifications (Jahangir Alam et al., 2013).
| Drought Proneness | DI |
|---|---|
| Extreme drought | DI < 0.125 |
| Severe drought | 0.125 < DI ≤ 0.185 |
| Moderate drought | 0.185 < DI ≤ 0.235 |
| Mild drought | 0.235 < DI ≤ 0.310 |
| No drought | 0.310 < DI ≤ 1.000 |
Table 4.
The drought steady state probability (p) of precipitation in the southern Taiwan basin.
| Basin | Rainfall Station | p | Basin | Rainfall Station | p |
|---|---|---|---|---|---|
| Pozi River basin | PR1 | 0.14 | Gaoping River basin | KR1 | 0.18 |
| PR2 | 0.14 | KR2 | 0.16 | ||
| Bazhang River basin | BR1 | 0.17 | KR3 | 0.13 | |
| BR2 | 0.17 | KR4 | 0.16 | ||
| Jishui River basin | GR1 | 0.16 | KR5 | 0.16 | |
| GR2 | 0.13 | KR6 | 0.18 | ||
| GR3 | 0.13 | KR7 | 0.13 | ||
| GR4 | 0.15 | KR8 | 0.14 | ||
| Yanshui River basin | YR1 | 0.21 | KR9 | 0.15 | |
| YR2 | 0.15 | KR10 | 0.18 | ||
| Erren River basin | RR1 | 0.14 | Linbian River basin | LR1 | 0.20 |
| RR2 | 0.16 | LR2 | 0.15 | ||
| LR3 | 0.13 |
Table 5.
The drought mean duration (D) of precipitation and groundwater drought in the southern Taiwan basin.
Table 5.
The drought mean duration (D) of precipitation and groundwater drought in the southern Taiwan basin.
| Basin | Rainfall Station | D | GW Station | D | Basin | Rainfall Station | D | GW Station | D |
|---|---|---|---|---|---|---|---|---|---|
| Pozi River basin | PR1 | 3.9 | PG1 | 18.0 | Gaoping River basin | KR1 | 6.1 | KG1 KG2 KG3 KG4 KG5 KG6 KG7 | 23.0 17.5 12.3 24.0 12.2 16.8 34.0 |
| PR2 | 4.4 | KR2 | 4.9 | ||||||
| Bazhang River basin | BR1 | 5.4 | BG1 | 22.0 | KR3 | 5.1 | |||
| BR2 | 4.3 | BG2 | 61.0 | KR4 | 4.7 | ||||
| Jishui River basin | GR1 | 5.9 | GG1 | 12.0 | KR5 | 6.4 | |||
| GR2 | 5.4 | KR6 | 5.6 | ||||||
| GR3 | 4.9 | GG2 | 35.0 | KR7 | 5.6 | ||||
| GR4 | 6.1 | KR8 | 4.9 | ||||||
| Yanshui River basin | YR1 | 6.7 | YG1 | 7.3 | KR9 | 4.3 | |||
| YR2 | 5.9 | YG2 | 9.7 | KR10 | 5.5 | ||||
| Erren River basin | RR1 | 5.1 | RG1 | 19.0 | Linbian River basin | LR1 | 4.4 | LG1 LG2 | 23.5 15.0 |
| RR2 | 6.9 | LR2 | 4.5 | ||||||
| LR3 | 4.6 |
(Unit: Month).
Table 6.
The drought index (DI) value in the southern Taiwan basin.
| Basin | Rainfall Station | DI | Basin | Rainfall Station | DI |
|---|---|---|---|---|---|
| Pozi River basin | PR1 | 0.25 | Gaoping River basin | KR1 | 0.16 |
| PR2 | 0.22 | KR2 | 0.20 | ||
| Bazhang River basin | BR1 | 0.18 | KR3 | 0.19 | |
| BR2 | 0.22 | KR4 | 0.20 | ||
| Jishui River basin | GR1 | 0.16 | KR5 | 0.15 | |
| GR2 | 0.18 | KR6 | 0.17 | ||
| GR3 | 0.20 | KR7 | 0.18 | ||
| GR4 | 0.16 | KR8 | 0.20 | ||
| Yanshui River basin | YR1 | 0.14 | KR9 | 0.22 | |
| YR2 | 0.16 | KR10 | 0.18 | ||
| Erren River basin | RR1 | 0.19 | Linbian River basin | LR1 | 0.22 |
| RR2 | 0.14 | LR2 | 0.21 | ||
| LR3 | 0.21 |
© 2019 by the authors. Licensee MDPI, Basel, Switzerland. This article is an open access article distributed under the terms and conditions of the Creative Commons Attribution (CC BY) license (http://creativecommons.org/licenses/by/4.0/).
Share and Cite
MDPI and ACS Style
Yeh, H.-F.; Hsu, H.-L. Using the Markov Chain to Analyze Precipitation and Groundwater Drought Characteristics and Linkage with Atmospheric Circulation. Sustainability 2019, 11, 1817. https://doi.org/10.3390/su11061817
AMA Style
Yeh H-F, Hsu H-L. Using the Markov Chain to Analyze Precipitation and Groundwater Drought Characteristics and Linkage with Atmospheric Circulation. Sustainability. 2019; 11(6):1817. https://doi.org/10.3390/su11061817
Chicago/Turabian StyleYeh, Hsin-Fu, and Hsin-Li Hsu. 2019. "Using the Markov Chain to Analyze Precipitation and Groundwater Drought Characteristics and Linkage with Atmospheric Circulation" Sustainability 11, no. 6: 1817. https://doi.org/10.3390/su11061817
Note that from the first issue of 2016, this journal uses article numbers instead of page numbers. See further details here.