Article

An Integrated Multi-Criteria Decision-Making Model Based on Prospect Theory for Green Supplier Selection under Uncertain Environment: A Case Study of the Thailand Palm Oil Products Industry

by
Patchara Phochanikorn
1 and
Chunqiao Tan
1,2,*
1
School of Business, Central South University, Changsha 410083, Hunan, China
2
School of Economics and Management, Nanjing University of Information Science and Technology, Nanjing 210044, Jiangsu, China
*
Author to whom correspondence should be addressed.
Sustainability 2019, 11(7), 1872; https://doi.org/10.3390/su11071872
Submission received: 1 March 2019 / Revised: 17 March 2019 / Accepted: 26 March 2019 / Published: 28 March 2019
(This article belongs to the Special Issue How Better Decision-Making Helps to Improve Sustainability - Part II)

Abstract

:
Environmental concerns have globally driven the encouragement of green supply chain management. Accordingly, business and industrial organizations try to seek green supply chain strategies to respond to market pressure regarding corporate social responsibility. Green supplier selection is one of the practical strategies for modern enterprises. With the large-scale development of the palm oil products industry, green supplier selection technique is the key for decision making when dealing with mass information and possible risks of biased data. For instance, the preference of decision makers possibly causes a misleading decision, thus leading to unnecessary waste of resources. Therefore, the contribution of this paper is to apply the integrated multi-criteria decision method using the ‘fuzzy decision-making trial and evaluation laboratory’ (fuzzy DEMATEL) method to consider the cause and effect relationship and then using fuzzy analytic network process (fuzzy ANP) to assign the weight of each relevant criteria. The initial results are useful for strategic procurement planning. In the final step, we adopt the prospect theory to synthesize procurement’s psychological and behavioral factors when selecting green suppliers. The final result refers to the comprehensive prospect value to rank the eligible suppliers into orders. Moreover, the results of both sensitivity analysis and comparison method confirm that the proposed model is adequately realistic and robust.

1. Introduction

A supply chain consists of certain processes including production planning, raw material sourcing, production, quality control, product shipping, as well as inventory management. Sourcing is a key point of the procurement process in the supply chain, with its critical roles in resource efficiency management and cost reduction. However, the sourcing is not only relevant to either the buyer of raw materials or the manufacturer of the products, but also the suppliers of those raw materials required. Therefore, supplier selection is considered one of the most strategic parts of supply chain management (SCM) of the company [1]. Nowadays, sustainable enterprise management promotion has encouraged green supply chain implementations. For instance, a green supply chain may apply a green production with an environmentally friendly design which supports the reduction of wastes and greenhouse gas emissions generated during the production process. Aiming to minimize environmental problems, a large number of enterprises try to engage only in green supply chains with environmentally, socially, and economically sustainable material sourcing and production processes. Accordingly, sustainable manufacturers also focus on green supplier selection to save cost and to protect the environment at the same time [2].
In Thailand, green concepts have been widely applied in many industries including the palm oil products industry. Palm oil is an essential raw material for producing certain types of products such as fuels and various consumer goods; thus, the demand for palm oil in Thailand has continuously risen [3]. Many manufacturers who require raw palm oil for their production inputs are paying attention to involvement in green supplier selection in order to support global sustainability by considering several related conditions. Generally, the company would closely evaluate relevant green factors when choosing a supplier of palm oil. However, green factor evaluation might not be efficient due to unscientific decision-making, possibly leading to the loss of profits and of the ability to compete in the market. Moreover, a misleading green evaluation may also negatively influence the whole supply chain, including both upstream and downstream operations, and finally leads to negative impacts on the company’s reputation, particularly regarding corporate social responsibility.
There are some specific problems that occur when complicated multi-criteria decision-making is applied to the selection of green suppliers for Thailand palm oil-related product industry. Firstly, green factors previously used in the supplier selection in the palm oil products industry might not cover all relevant aspects and may not align with a green supplier’s practical operations. Conventional procurements focus on the comparison of quality, price, time, and transportation cost while they still lack evaluation on environmental impacts. Secondly, procurement teams deal with lots of information, so there might be a problem of information loss. Traditional data analysis only represents data in the form of real numbers, and that would create an uncertain environment which lessens the efficiency of data analysis such as evaluating and ranking, especially when arranging qualitative data (i.e., service minds, attitudes). Therefore, linguistic variables should be more appropriate for denoting the data on human thinking with fuzzy characteristics, for instance, ‘very poor’, ‘poor’, ‘good’, and ‘excellent’. Thirdly, methods for determining the weights of factors in current green supplier selection did not consider the uncertainty and fuzzy characteristics occurred during the decision making. Most of the studies only apply basic principles when determining the weights without an in-depth analysis of each factor’s impact on final decision-making results. Lastly, the decision making of procurement teams concerns risk and uncertainty, namely psychological problems. Behavioral characteristics of decision makers may lead to over expectation or unavoidable risks due to certain limitations [4].
This study develops the following methodologies to find solutions for abovementioned problems:
(1)
Evaluation index system that includes green criteria is developed by integrating data from previous research as well as experts in Thailand’s palm oil products industry.
(2)
Classic multi-criteria decision-making method (MCDM) is a reliable instrument for supplier selection. However, in this study, MCDM is extended to an integrated multi-criteria decision-making method using fuzzy DEMATEL combined with fuzzy ANP, or so called fuzzy DEMATEL-ANP. Firstly, fuzzy DEMATEL is used for identifying the cause and effect interrelationship of green factors. Later, fuzzy ANP—which is an extended version of the analytical hierarchy process (AHP)—is applied to identify index weights of various elements using comparison matrix in order to adopt a network structure of interdependency. ANP effectively enhance decision making efficiency both quantitatively and qualitatively, especially for complicated real-world problems [5].
(3)
This study also applies prospect theory to the process of green supplier selection in the palm oil products industry to prevent the bias caused by the behavior of decision makers as well as the loss aversion that might influence the final decision solution [6]. Due to the possibility of over expectation or environmental and managerial limitations, decision-makers are not entirely rational when making decisions that present possible risk, thus they tend to use bounded rationality [7].
(4)
We design an integrated MCDM model by employing prospect theory to green supplier selection under fuzzy environment. The proposed framework offers three main benefits: (i) the decision-making process is concrete and easy to implement; (ii) the decision making process combined with the prospect theory enhances reality and robustness as well as strategic procurement within the industry; and (iii) the result of supplier ranking is useful for conducting further analysis and guidance on buyer–supplier cooperation towards environmental concerns.
There are three main contributions of this study. Firstly, after careful consideration of the economic, environmental, and social aspects concerning green supply chain condition, the paper establishes 5 dimensions and 15 criteria for green supplier selection, which can help enterprises in the process of identifying potential areas of improvement for green suppliers, while avoiding the potential risk of selecting unsuitable suppliers. Secondly, suppliers that want to ‘go green’ can apply the ranking result of relevant green supplier selection criteria into their operations by focusing on primary factors. Suppliers may enhance the long-term relationship with buyers by promoting their green practices as valuable contributions towards sustainability. Finally, we proposed an integrated MCDM model based on prospect theory for solving a problem in green supplier selection in an uncertain environment, as well as selecting an appropriate green supplier for a particular company. The findings of the study can also improve management practices with reference to synthesized green supplier selection criteria.
The remainder of the paper is organized as follows: Section 2 summarizes the literature review. Section 3 describes an integrated multi-criteria decision-making model based on prospect theory. Section 4 exemplifies a case study. The results and discussions are shown in Section 5, and finally, the conclusions are recited in Section 6.

2. Literature Review

Responding to specific regulations regarding environmental concerns, businesses are now focusing on green supply chain systems, including the selection of green suppliers. Green supplier selection simultaneously relates to various factors, both quantitative and qualitative, thus it usually involves multi-criteria decision-making problems [8,9]. Furthermore, prospect theory has also been applied to critical decision-making processes in green or sustainable supply chain management [10].
Researchers in different countries have studied criteria for supplier selection both methodologically and theoretically. Regarding the methodologies, MCDM methods—such as TOPSIS, VIKOR, AHP, ANP, and DEMATEL—as well as the extended version of these methods have been previously used in green supplier selection procedure [11]. Shen et al. [12] combine fuzzy set theory with TOPSIS when evaluating suppliers’ environmental performance. Buyukozkan [13] integrates a novel fuzzy MCDM including fuzzy DEMATEL, ANP, and TOPSIS as strategic tools for supplier selection under green principles to create efficiency and positive reputations of the organization. Santos et al. [14] propose an environmentally friendly supplier selection model for Brazilian furniture industry using fuzzy integrated with Shannob’s Entropy and the TOPSIS method to deal with uncertainty in the decision-making process. Shi et al. [15] solve the problem of green supplier selection with uncertain linguistic information by firstly adapting interval-valued intuitionistic uncertain linguistic sets (IVIULSs) to minimize uncertainties of decision makers and then applying GRA-TOPSIS method to make it more realistic and more efficient. Mousakhani et al. [16] initiate an innovative method for green supplier evaluation under group decision-making approach using interval-type-2 fuzzy sets (IT2FSs) and TOPSIS method for the green supplier selection barriers in a case study of the battery industry. Wang et al. [17] adopt the MCDM model with fuzzy AHP and green data envelopment analysis (GDEA) to recognize the weight of criteria for supplier selection in the food processing industry in Vietnam.
Wang and Tsai [18] propose a fuzzy MCDM model that integrates fuzzy AHP with the data envelopment analysis (DEA) into the evaluation and selection of solar panel supplier for photovoltaic system design in Taiwan. Awasthi et al. [19] come up with an integrated fuzzy AHP-VIKOR based model for sustainable supplier assessment by considering the risks possibly caused by the company’s sub-suppliers. Rahiminezhad et al. [20] use fuzzy ANP to rank the suppliers regarding both traditional and green key performance indicators (KPI) when conducting supplier selection. Bottani et al. [21] apply ANP by integrating quality function deployment QFD methods for supplier selection by considering the benefits, costs, opportunities, as well as risks. Liou et al. [22] present a hybrid model for supplier selection of green supply chains in Taiwanese electronic companies by combining DEMATEL based ANP and complex proportional assessment of alternatives with Gray relations (COPRAS-G). Also, Jiang et al. [23] propose DEMATEL based ANP and grey methods, which provided the suitable ranking of green suppliers for Taiwan’s automotive industry. Guarnieri and Trojan [24] apply AHP method to assign the weighting for each supplier selection factor, and in the meantime employ ELECTRE-TRI method to classify the supplier in the textile industry based on social, environmental, and economic criteria.
For theoretical research, Lu et al. [25] introduce a green supplier selection case in straw biomass industry by integrating cloud model with MCDM with an aim to avoid the risks of the fuzziness as well as randomness of extensive evaluation information. Song et al. [26] utilize prospect theory to analyze the manufacturer’s psychological and behavioral factors during an environmentally friendly supplier. Song et al. [27] illustrate green supplier selection in a dynamic environment by using third-generation prospect theory (PT3) to examine psychological and behavioral factors of the manufacturers, and at the same time creating gain and loss matrix to assign the weight of each relevant factor. Qin et al. [28] research a new distance based on the fuzzy logic and α-cuts of the IT2FSs and extend the novel TODIM method by integrating prospect theory application to solve green supplier selection issues. Fallahpour et al. [1] collect raw data for supplier selection analysis via questionnaires and in the meantime employ a hybrid model to choose a sustainable supplier in the textile manufacturing company. Lo et al. [10] combine the best–worst method (BWM) with fuzzy TOPSIS when evaluating the performance of green suppliers via order allocation method. Li et al. [29] find solutions for problems regarding risks in selecting third-party reversed logistics provider by using prospect theory to identify sustainable choices.
For buyers of raw palm oil, there is still a lack of concrete research on green supplier selection with psychological problems since the number of green suppliers in the palm oil industry is still low. Most of the available studies are related to sustainable agriculture [30], the environmental impact of palm oil production [3], sustainable supplier selection in edible oil industry [17], and ecological footprint assessment [31].
Available literature reviews reveal various methods and tools for evaluating and selecting green suppliers; however, most of them refer to basic models such as AHP and ANP when assigning the weight to each relevant criterion. Moreover, it seems that in-depth analyses on the factors’ impact have been ignored; thus, this study tries to close this gap via the proposed model. Besides, decision methods and theories have not been commonly used for solving the problems of complexity, uncertainty, and vagueness as well as risk preference of decision-makers. To fill this research gap, this study focuses on an integrated MCDM model based on prospect theory for green supplier selection under uncertain environment aims to explore the plausible interrelationships among the considered criteria for a more in-depth analysis and enhanced decision making.

3. Methodology

MCDM is a method that simultaneously considers multiple criteria and aids in decision making by estimating the best case for each criterion after sorting limited available cases according to different characteristics or criteria. This study proposes a fuzzy set to address concerns related to decision uncertainties [32,33,34], comprising fuzzy DEMATEL-ANP based on prospect theory. First, fuzzy DEMATEL is used to confirm the cause and of each criterion and to investigate the linkage between each of the criteria. To subsequently calculate the weight of the criteria for green supplier selection, a newly introduced integration of fuzzy DEMATEL and fuzzy ANP is also adopted. These methods are capable of solving the criteria issues, namely dependency and feedback [2]. Finally, the psychologically influenced behavior of the decision maker in supplier selection under environmental stress has also been measured to assign a weight to each alternative by using prospect theory.

3.1. Fuzzy Set Theory

Fuzzy set theory is beneficial for solving problems involving with uncertainties of human cognition processes [35,36]. It was initially developed by Zadeh in 1965 and has been used for categorizing objects via a membership continuum. The membership level is generally allotted to each relevant object at the value ranged from zero to one [37,38].
Definition 1.
A fuzzy set A ˜ in x is defined by
A ˜ = { ( x , μ A ( x ) ) , x R }
in which x symbolizes real line values,R: −∞ < x < +∞ and μ A ( x ) is formed by the continual mapping between R and the closed interval [0, 1].
Definition 2.
A fuzzy number is a fuzzy set in which the membership [39].
Triangular fuzzy numbers (TFN) are divided into three values: (1) the lowest possible value l, (2) the most promising value m, and (3) the upper possible value u, TFN A ˜ is represented in the form of a membership function μ A ˜ ( x ) .
μ A ˜ ( x ) = { 0 , x < l x l m l , l < x m u x u m , m < x u 0 , x > u

3.2. Fuzzy DEMATEL-ANP

DEMATEL-ANP is a particular type of integrated MCDM approach originated by Hsu and Liou [40]. It pays attention to the possibility of inherent interrelation among each of the criteria which may affect the influential weight assigned to each criterion. It is clear that DEMATEL is capable of mapping out complex constructs and analyzing structural models by relying mainly on cause and effect relationships [41]. However, the integration of ANP extends the power of the model to measure more comprehensive constructs by referring to the ratio scale priorities when distributing the influence among criteria in the decision problem [42].

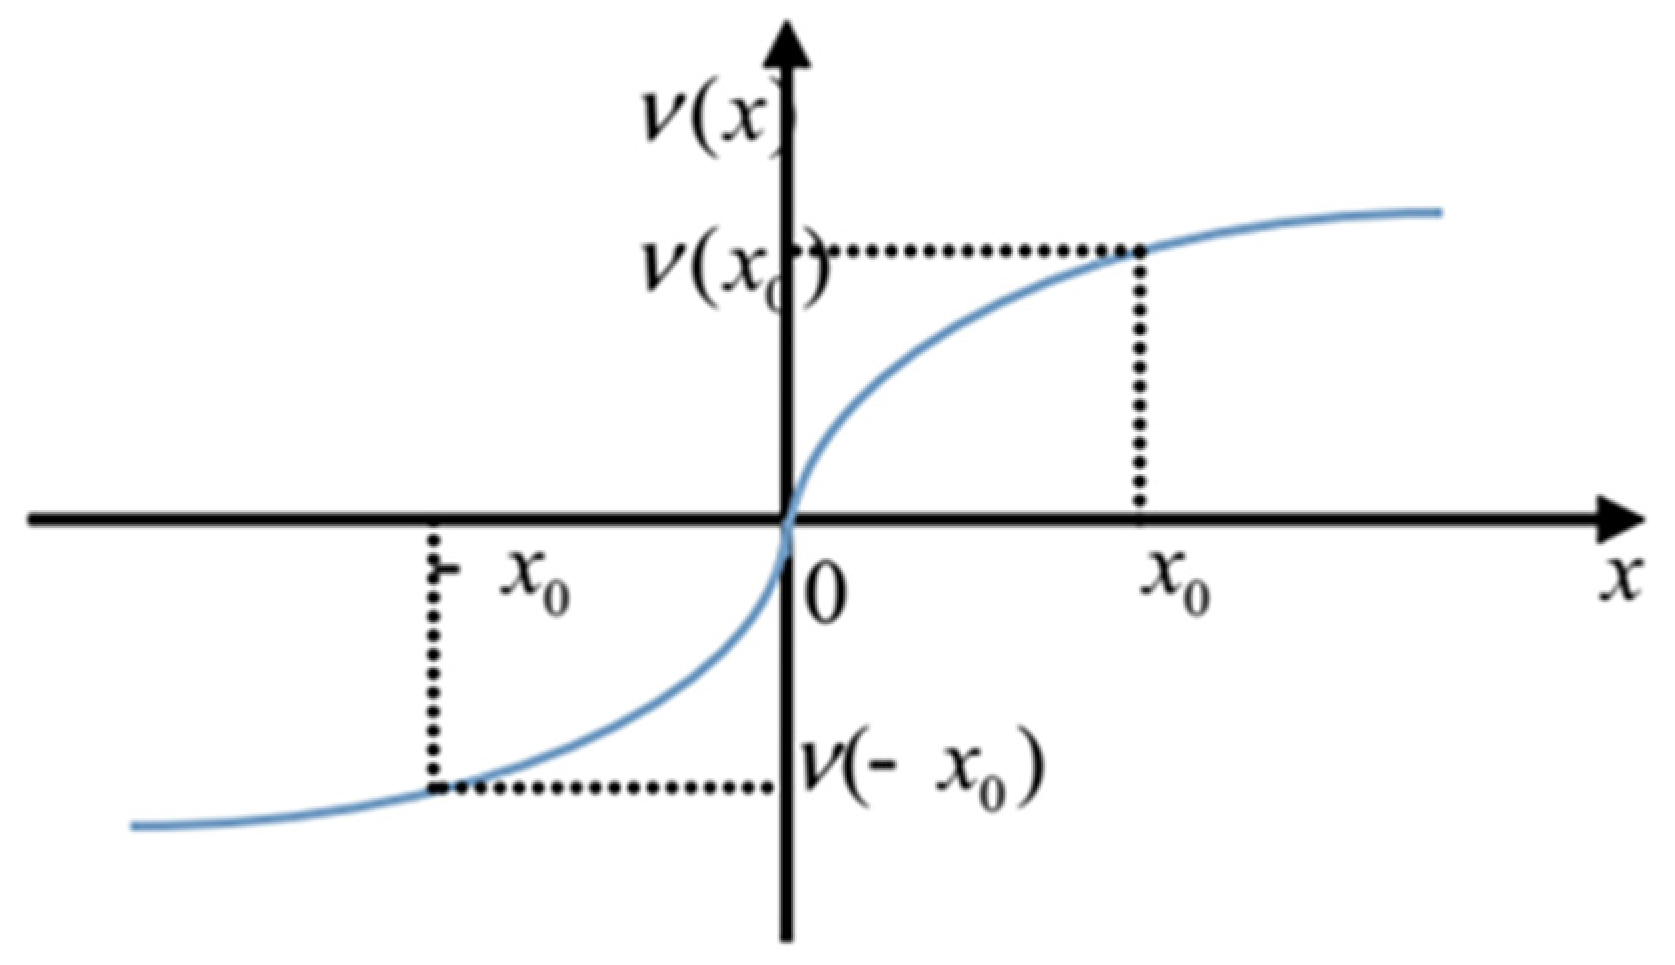
3.3. Prospect Theory

Kahneman and Tversky firstly formed prospect theory in 1979. It explains decision making behavior under risk and uncertainty. The absolute number of studies employs the prospect theory to illustrate the two steps of decision making, including the editing step and the evaluation step. In the initial state, editing, the decision-making results are placed in order based on the reference point and utility function, eliminating the problems of bias or personal preference of decision makers. In the evaluation state, the decision makers’ behaviors are in accordance with computed utility value functions. During the evaluation state, behaviors of the decision makers follow computed utility value functions. After the discretion of potential outcomes, a larger utility is selected. Furthermore, Kahneman and Tversky have explicated three value function principles regarding decision maker behaviors—namely loss aversion, reference dependence [43], and diminishing sensitivity—which are usually represented in the form of asymmetric S-shaped value function, as exhibited in Figure 1. The value function [44] can be illustrated as
v ( x ) = { x α , x 0 λ ( x ) β , x < 0
α and β denote the adjustable coefficients, whereas α specifies the concavity and β specifies the convexity of the value function. The value function satisfies the constraints 0 α ,   β 1 . The parameter λ denotes the loss aversion, and we employ the condition λ > 1 . In this paper, we set the parameter values as α = β = 0.88 ,   λ = 2.25 , as recommended by Tversky and Kahneman (1991) [44].
π ( p ) = { p γ ( p γ + ( 1 p ) γ ) 1 γ p δ ( p δ + ( 1 p ) δ ) 1 δ
where γ is the attitude coefficient of risk gains whereas δ is the attitude coefficient of risk losses, and we employ the condition 0 < γ ,   δ < 1 . The values of γ and δ are stipulated as 0.61 and 0.69 respectively in our experimental analysis [44].

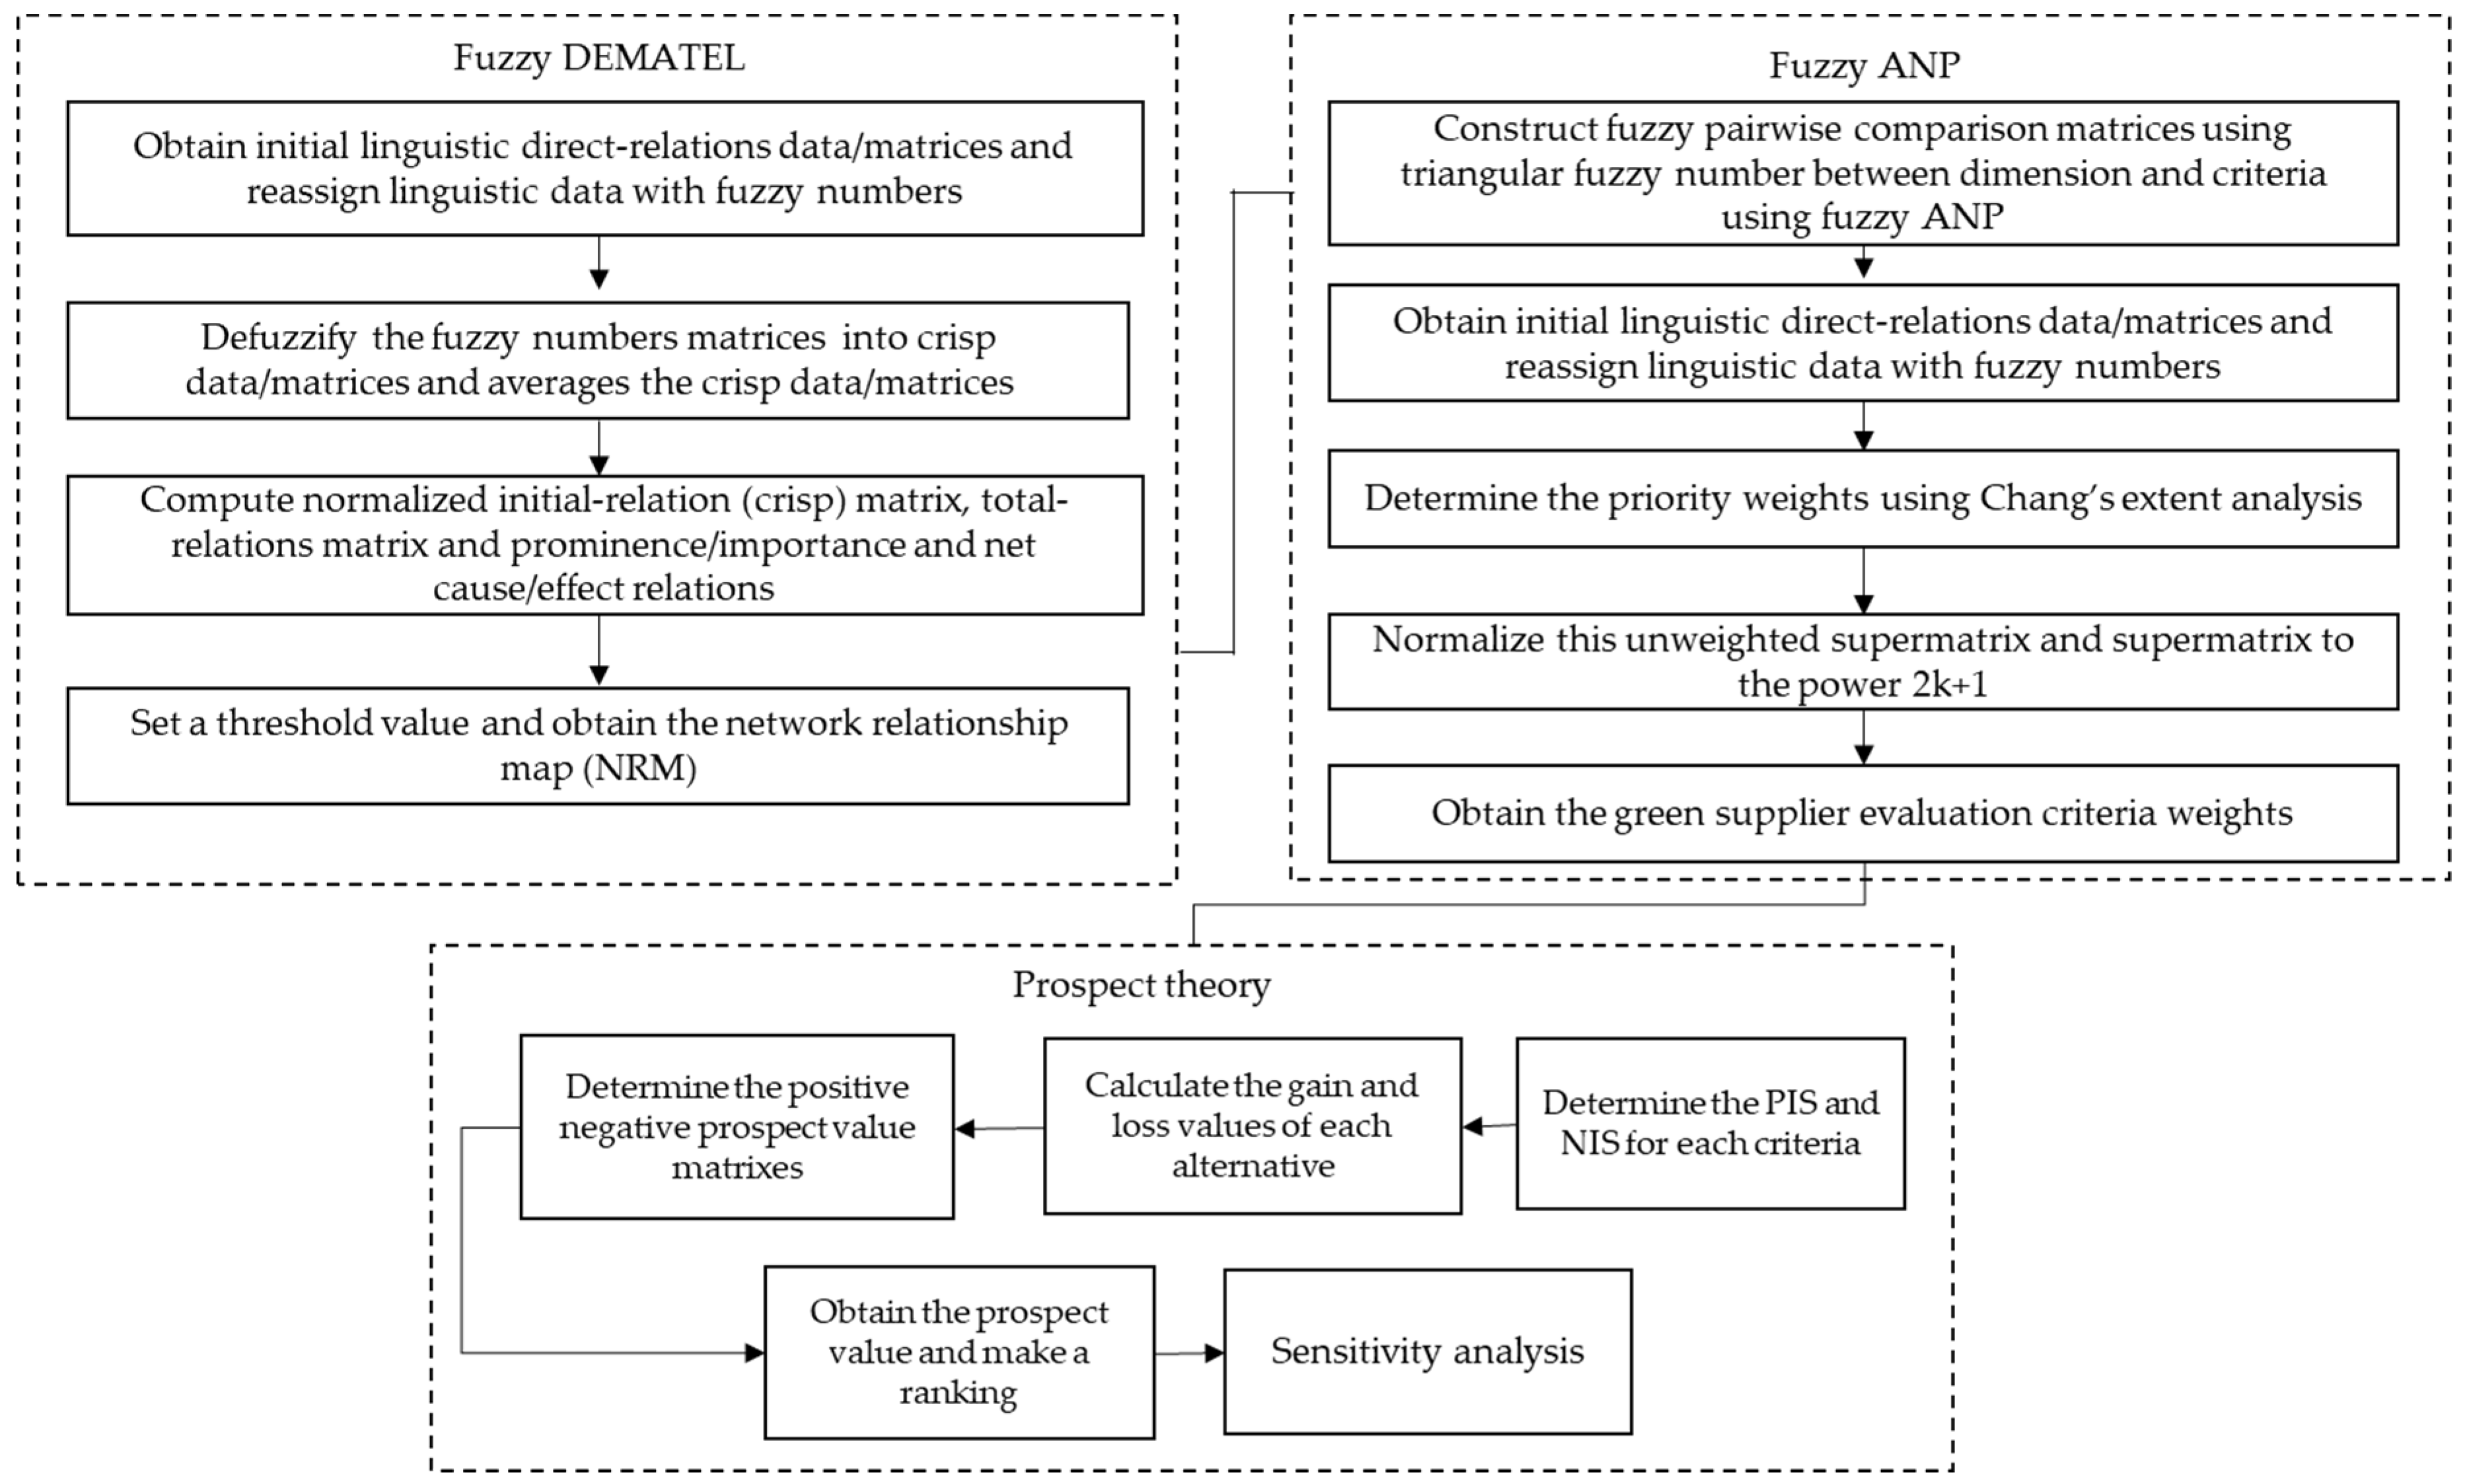
3.4. The Computational Step of the Fuzzy MCDM Model Based on Prospect Theory

The following explains the computational steps of an integrated MCDM model with regards to the prospect theory. Figure 2 provides the purposed model for green supplier selection. A detailed methodology of an integrated MCDM model based on prospect theory is presented in the following section:
Step 1: Design the fuzzy linguistic variables
The experts are asked to make the pairwise comparisons and the feedbacks are presented in the form of triangular fuzzy numbers as seen in Table 1. The use of triangular fuzzy numbers enables the relative significance of every paired item to be measured equally. In this case, triangular fuzzy numbers act as the indicators of comparison ratios. The following is the given format to describe the importance of element i over element j depending on the opinion of expert k, shown as z ˜ i j k where z ˜ i j k = ( 1 , 1 , 1 ) if i = j, and z ˜ i j k = ( l i j k , m i j k , u i j k ) if i j , for i, j = 1, 2, …, n, and k = 1, 2, …, K. The fuzzy judgment matrix derived from decision maker k, z ˜ k is defined as
Z ˜ k = { z ˜ i j k } = ( ( 1 , 1 , 1 ) ( l 12 k , m 12 k , u 12 k ) ( l 1 n k , m 1 n k , u 1 n k ) ( l 21 k , m 21 k , u 21 k ) ( 1 , 1 , 1 ) ( l 2 n k , m 2 n k , u 2 n k ) ( l n 1 k , m n 1 k , u n 1 k ) ( l n 2 k , m n 2 k , u n 2 k ) ( 1 , 1 , 1 ) )
Step 2: Transform triangular fuzzy numbers into the initial direct-relation matrix by using fuzzy DEMATEL.
Let z ˜ i j k = ( l i j k , m i j k , u i j k ) , be the influential level of criteria i on criteria j, with 1≤ kK. Then, the fuzzy data can be converted into the crisp scores with (CFCS) defuzzification method, whereas Equations (6)–(12) are calculated to acquire the crisp numbers [46].
Step 2.1: Normalize lower (xl), mean (xm), and upper (xu) fuzzy numbers
x l i j k = ( l i j k min l i j k ) / Δ min max
x m i j k = ( m i j k min l i j k ) / Δ min max
x u i j k = ( u i j k min l i j k ) / Δ min max
where Δ min max = max u i j k min l i j k .
Step 2.2: Calculate upper (xus) and lower (xls) normalized values
x u s i j k = x u i j k / ( 1 + x u i j k x m i j k )
x l s i j k = x m i j k / ( 1 + x m i j k x l i j k )
Step 2.3: Calculate total normalized crisp values (x)
x i j k = [ x l s i j k ( 1 x l s i j k ) + ( x u s i j k x u s i j k ) ] / [ 1 x l s i j k + x u s i j k ]
Step 2.4: Compute crisp values (z)
z i j k = min l i j k + ( x i j k Δ min max )
Step 2.5: Aggregate direct-relation crisp matrices and normalize. In this step, we aggregate the direct-relation crisp matrices from all experts into an average or so-called a single overall crisp direct-relation matrix by relying on Equation (13)
z ˜ i j = 1 K ( z ˜ i j 1 + z ˜ i j 2 + + z ˜ i j K )
Next, we can get the generalized direct-relation fuzzy matrix X ˜ by normalizing the aggregated direct-relation matrix via Equations (14) and (15) as shown below
Let   z = 1 max 1 i n j n a ˜ i j   w h e r e   z > 0
X ˜ = z × A ˜
Step 2.6: Calculate the total influence matrix T ˜ , Equation (16) is calculated to acquire the total influence matrix, in which I stands for the identity matrix.
T ˜ = lim k ( X ˜ 1 + X ˜ 2 + + X ˜ h ) = X ( I X ) 1
Later on, we sum up the total influence matrix T ˜ to the total row ( r ˜ ) and column ( s ˜ ) using Equations (17) and (18) as defined below;
r ˜ = [ r ˜ i ] n × 1 = [ j = 1 n t ˜ i j ] n × 1
s ˜ = [ s ˜ j ] n × 1 = [ j = 1 n t ˜ i j ] 1 × n
where, T ˜ = [ t ˜ i j ] , i, j = 1, 2, …, n,
Step 3: Establish fuzzy ANP to obtain the criteria weights
In 1996, Saaty firstly introduced ANP to handle the problems of real-world feedback and underlying interdependence among the criteria and among the alternatives [47]. ANP is said to be a generalized module of AHP [48]. ANP technique acts as an option to the hierarchy revealed in AHP through the formation of a network that supports ANP to model the interactions among decision criteria in order to find solutions for certain complex non-linear problems. ANP practically supports a systematic analysis of various types of interactions so that it is defined as a useful tool in MCDM situations [49]. We outline the processes of fuzzy ANP below.
Step 3.1: Perform pairwise comparisons using TFN linguistic scale
Each of the respondent experts assesses each pair of dimension and criteria on the TFN linguistic scale. Thus, the relative importance of the importance of element i over element j from the perspective of the decision maker k, shown as a ˜ i j k where a ˜ i j k = ( 1 , 1 , 1 ) if i = j, and a ˜ i j k = ( l i j k , m i j k , u i j k ) if i j , for i, j = 1, 2, …, n.
A ˜ = { a ˜ i j } n × n ; a ˜ i j = ( l i j , m i j , u i j )
in which,
l i j = min k ( l i j k ) , m i j = min k ( m i j k ) , u i j = min k ( u i j k )
Step 3.2: Use Chang’s extent analysis to determine the priority weights
Chang’s technique of extent analysis enables the assessment of the weighting of multiple decision-making attributes [50]. With this technique, we calculate the local priority via the aggregate fuzzy judgment matrix as shown in Equation (19). Chang’s extent analysis technique consists of the following procedures:
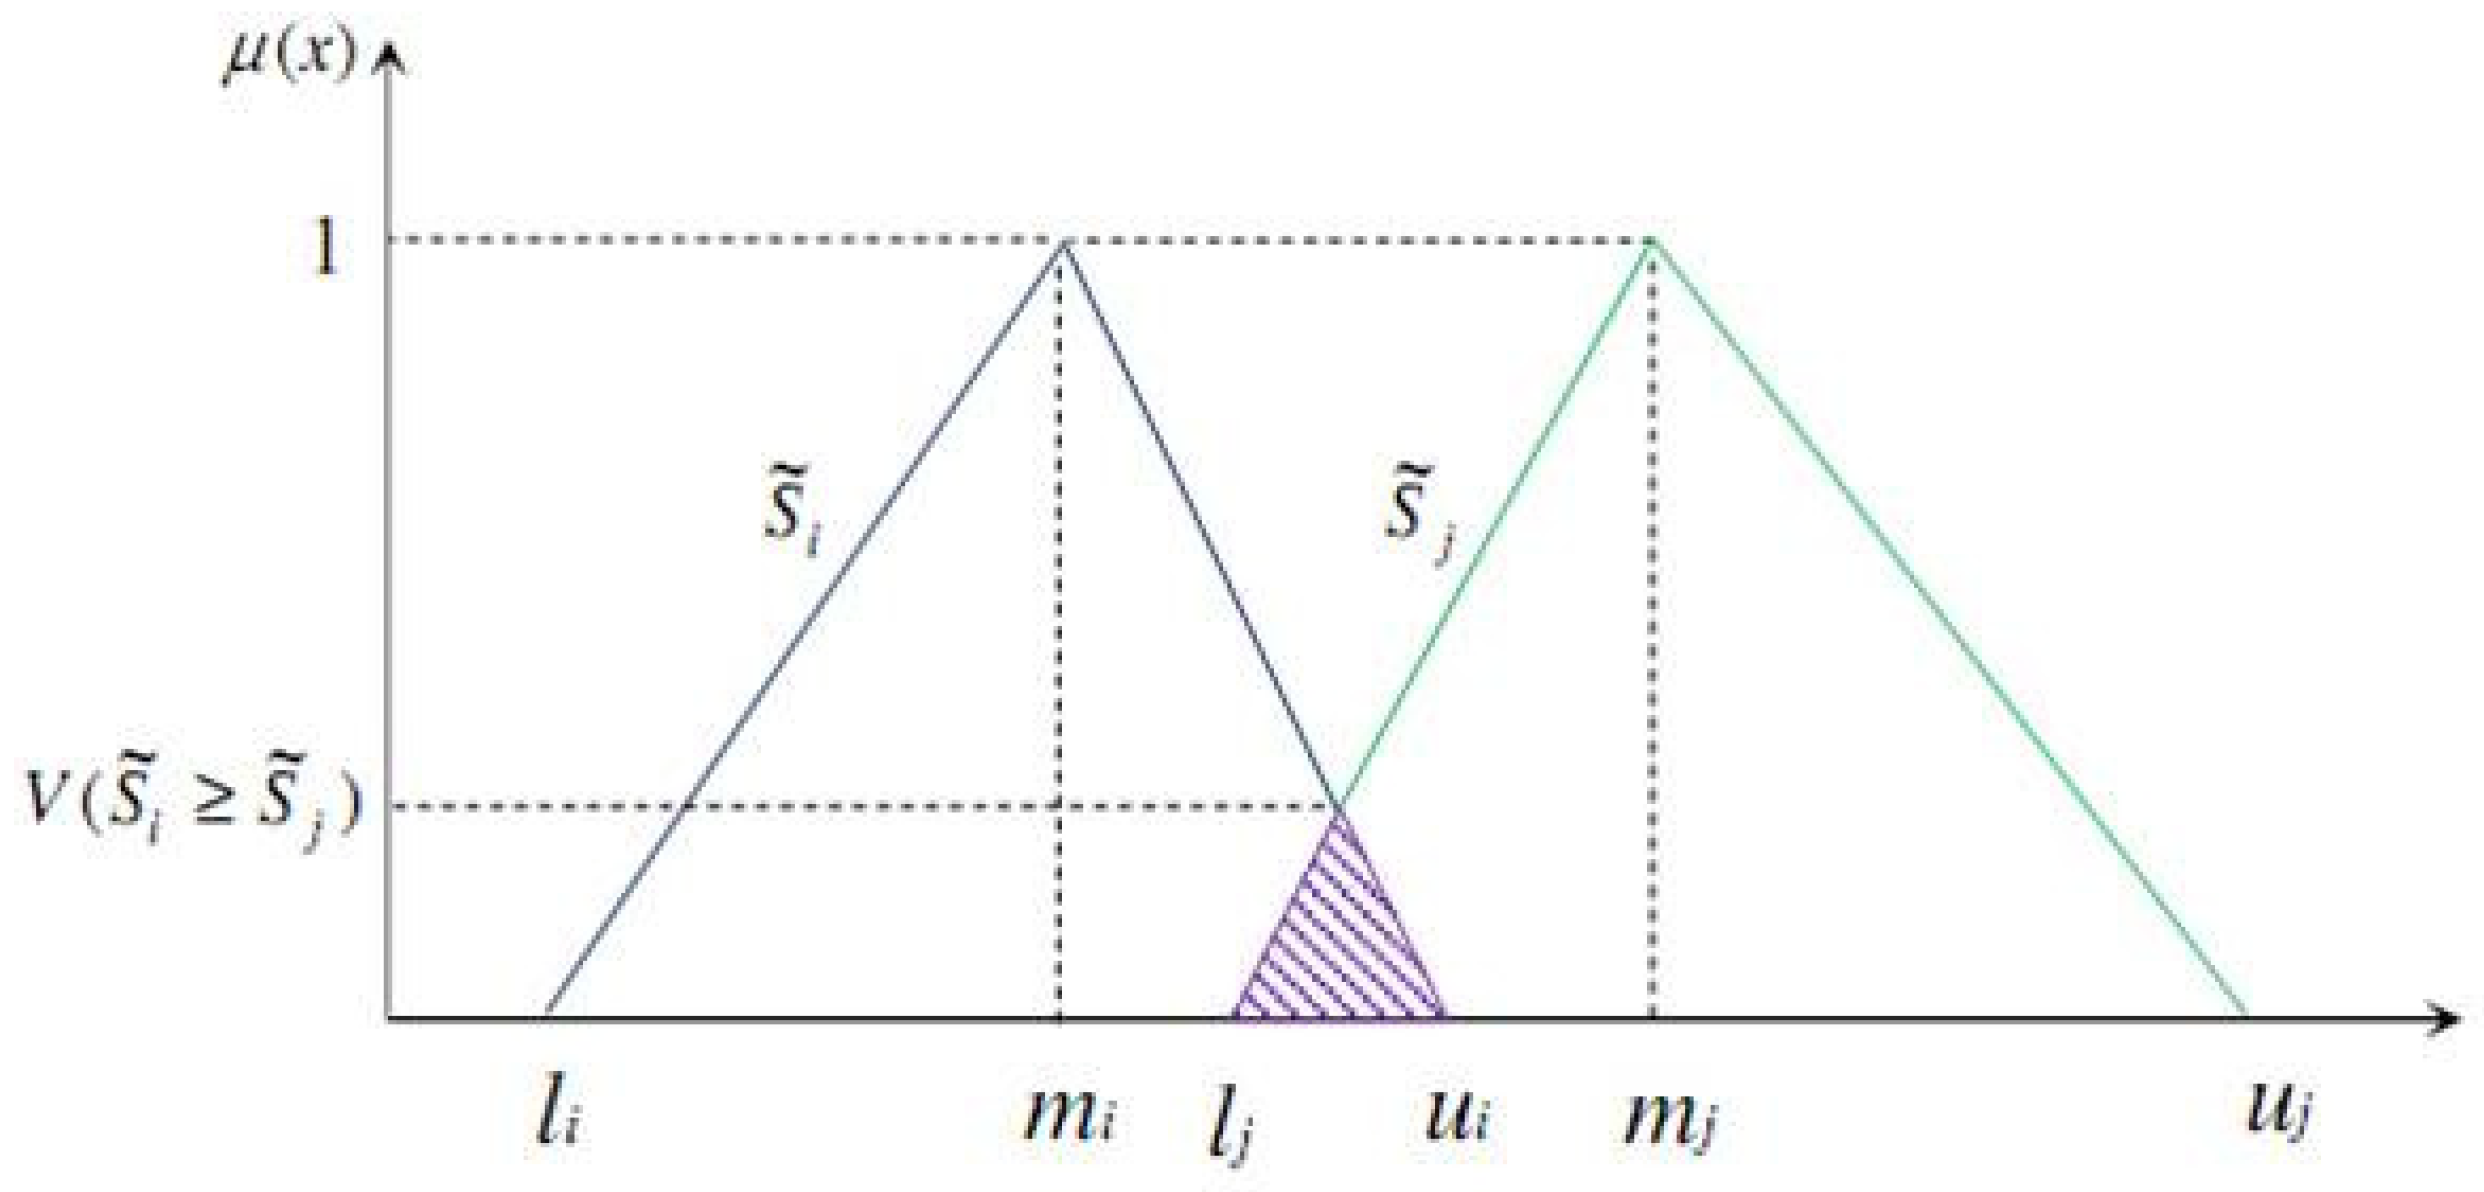
  • The fuzzy synthetic extent value in terms of the element (i = 1, 2, …, n), is defined as
    S ˜ i ( l i , m i , u i ) = j = 1 n a ˜ i j [ i = 1 n j = 1 n a ˜ i j ] 1 ( j = 1 n l i j i = 1 n j = 1 n u i j , j = 1 n m i j i = 1 n j = 1 n m i j , j = 1 n u i j i = 1 n j = 1 n l i j )
    where l i j , m i j and u i j are given by Equation (20).
  • The degree of possibility of S ˜ i ( l i , m i , u i ) S ˜ j ( l j , m j , u j ) for two elements namely i and j is described as Equation (22)
    V ( S ˜ i S ˜ j ) = { 1 , i f   m i m j 0 , i f   l j u i u i l j ( u i m i ) + ( m j l j )     o t h e r w i s e
As illustrated in Figure 3, the value of V ( S ˜ i S ˜ j ) presents the greatest intersection point ordinated between any pair of fuzzy membership functions.
Compile the degree of possibility for S ˜ i to exceed all other n − 1 TFN, so that,
d ( S ˜ i ) V ( S ˜ i S ˜ 1 , , S ˜ i 1 , S ˜ i + 1 , , S ˜ n ) = min j V ( S ˜ i S ˜ j ) ,   f o r   j = 1 , 2 , , n , j i .
iii.
Acquire the normalized priority vector W = ( w 1 , w 2 , , w n ) of the fuzzy judgment matrix A ˜ where w i is given by
w i = d ( S ˜ i ) j = 1 n d ( S ˜ j ) , i , j = 1 , 2 , , n .
Step 3.3: Develop and analyze the supermatrix and the limit supermatrix
The steps in this process reflect the interdependence effects in the supermatrix to explain three types of relationships: (i) independence from the subsequent criteria and sub-criteria; (ii) interdependence between the criteria and sub-criteria levels; and (iii) interdependence among the dimensions and criteria themselves. Firstly, we apply the priority weights of all dimensions and criteria previously calculated in Step 3.2 to create the unweighted supermatrix which is a multi-block matrix. Each single block portrays the linkage between the two nodes within the network, while each column in every block exhibits a priority weight vector inputted into supermatrix in accordance with the proper flow of impacts among the nodes. In case there is not any influence or impact between the two factors, the weight will be shown in the supermatrix as zero. The weighted supermatrix has the property that the sum of all columns is unity, which is the result of normalization of the unweighted supermatrix. The weighted supermatrix is set to be powered by 2k + 1, whereas k is an arbitrarily large number. In case of a very small change in the arrays of the supermatrix by sequent powers, we achieve convergence on the importance weights, and the newly obtained matrix is nominated as the limit supermatrix. Consequently, we can refer to this limit supermatrix to derive the relative weights [48].
Step 4: Decision-making based on prospect theory
When the prospect theory is applied, the reference point becomes a crucial factor in decision-making. In this condition, the reference points are generally chosen from the following key points: zero-point; mean value; maximum value and minimum value [51]. Let S = { S 1 , S 2 , , S n } where (i = 1, 2,…, m) be the set of the green supplier, and C = { C 1 , C 2 , , C n } be the set of criteria, and w = { w 1 , w 2 , , w n } T be the weight vector related to them, satisfying w j [ 0 , 1 ] and j = 1 n w j = 1 . Let H = ( h i j ) m × n be the decision matrix, where h i j is provided by the decision maker for the evaluation of the supplier Si under the criteria C i j . When the attribute weight information is complete, this paper expands the prospect theory to handle the green or sustainable supplier selection issues in the MCDM problem which involves the following step.
Step 4.1: Determine the positive ideal solution (PIS) and the negative ideal solution (NIS) of all alternatives under each criterion are set as [51]
G = ( h 1 , h 2 , , h m ) = { max 1 i n ( h i 1 ) , max 1 i n ( h i 2 ) , , max 1 i n ( h i m ) } ;
B = ( h 1 , h 2 , , h m ) = { min 1 i n ( h i 1 ) , min 1 i n ( h i 2 ) , , min 1 i n ( h i m ) }
Step 4.2: Calculate the gain and loss value of each alternative
d ( S i , G ) = { d ( h i 1 , G 1 ) , d ( h i 2 , G 2 ) , , d ( h i m , G m ) }
d ( S i , B ) = { d ( h i 1 , B 1 ) , d ( h i 2 , B 2 ) , , d ( h i m , B m ) }
Step 4.3: Besides, d ( h i j , G j ) and d ( h i j , B j ) are substituted into Equation (3)
When the reference point is the PIS, the decision-makers tend to be the risk seekers as they are about to confront with losses, so that   d ( h i j , G j ) is substituted into v ( x ) = λ ( x ) β . In contrast, when the reference point is the NIS, the benefits enable the decision-makers to engage in risk aversion, so that, d ( h i j , B j ) is substituted into v ( x ) = x α . The formula can be deduced as
v ( d ( h i j , G j ) ) = λ ( d ( h i j , G j ) ) β
v + ( d ( h i j , B j ) ) = ( d ( h i j , B j ) ) β
Step 4.4: Calculate the integrated prospect value of each alternative and make a ranking based on Equation (4) and obtain the weights of criteria from fuzzy DANP, the prospect theory weights can be derived from
V = j = 1 m v i j + π + ( w j ) + j = 1 m v i j π ( w j )

4. Case Study

Responding to the global competition, all enterprises need to enhance the essential competencies towards global strategic management, and resource efficiency is one of the impactful strategies. In this section, our empirical study demonstrates how palm oil product purchasing companies apply our proposed method to evaluate and select the green suppliers of palm oil products for manufacturing inputs. We introduce the case study of green supplier selection methods when evaluating the suppliers of palm oil products for manufacturing inputs, the company’s name is given as ‘ABC’ for data confidentiality. ABC Company is one of the major producers of cooking oils, non-dairy creamers, and portions of margarine in Thailand. The company applies the environmental policy in its whole supply chain, including sourcing process and cooperative actions with all suppliers to encourage green practices. ABC has listed three potential green suppliers, namely S1, S2, and S3. Data collection is conducted via semi-structured interviews partially by telephone and partially face to face. Respondents include six procurement experts of ABC Company who have more than 10 years of experience in the palm oil products industry.

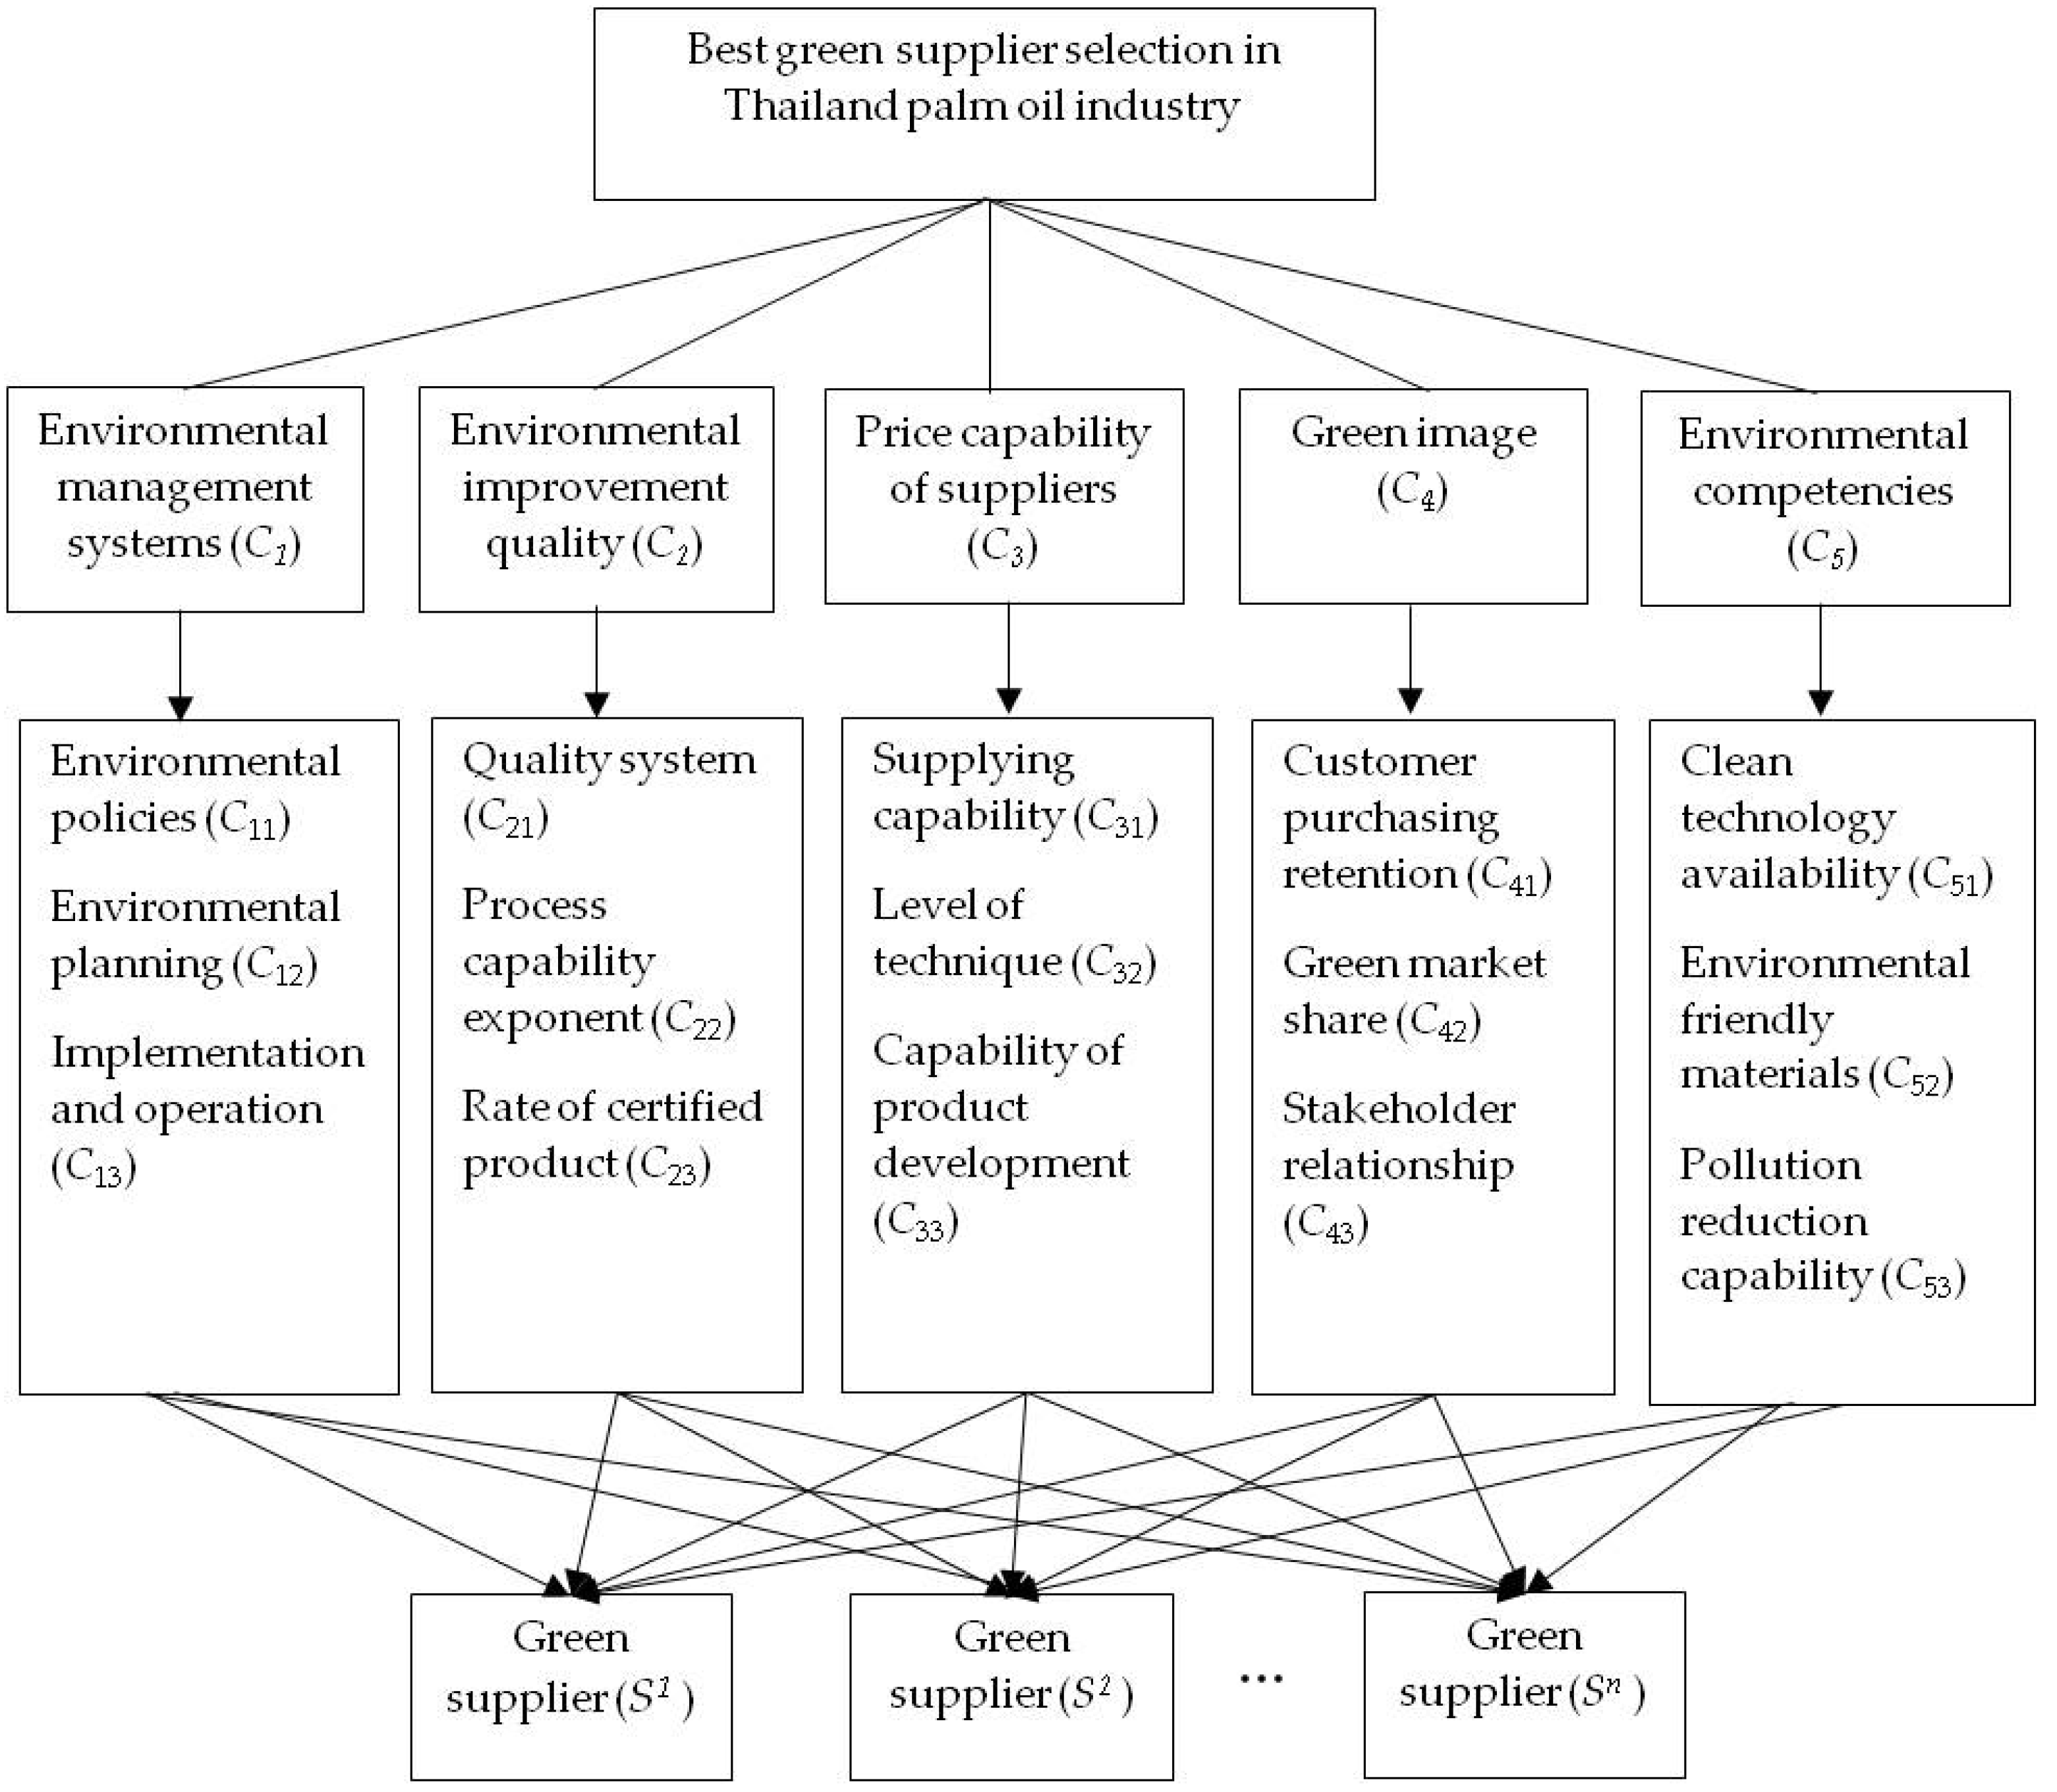
4.1. Evaluation Index System for Evaluating Suppliers of Palm Oil Products

To create the evaluation index system for selecting green suppliers in the palm oil products industry, the buyer needs to consider relevant factors carefully so that the evaluation is well qualified. The evaluation index system has two layers. It consists of five dimensions, and each dimension has three criteria. In total, fifteen criteria are included in this study as shown in Figure 4. To provide full guidelines for procurement decision-makers, concrete details on definitions, and explanations are portrayed as follows.
• Environmental management systems (C1)
It is unarguable that a supplier with a lack of flexibility, unwell-managed planning, or a miscommunication bears some risks including the waste of resources during the transactions between the buyer and the supplier. Therefore, the environmental management system is an essential factor that indicates the possible ecological impact of the supplier’s operations. In this study, the environmental management system includes three aspects: environmental policies, environmental planning, and implementation and operation.
• Environmental improvement quality (C2)
Capability to source high-quality raw materials is one of the most critical factors. Unqualified raw materials negatively affect the whole supply chain and the productions in palm oil-related product industries. Besides, it also negatively impacts natural environments. Hence, a sustainable supplier should contribute to qualified sourcing processes regarding either the packaging or environmentally friendly procurement management such as ISO14001 and the Roundtable on Sustainable Palm Oil (RSPO). Environmental improvement quality includes three aspects: quality system, the rate of certified products, and process capability exponent.
• Price capability of suppliers (C3)
A sustainable supplier should set up its product price reasonably covering its required cost. A good supplier should be able to balance its cost and price management. More specifically, a green supplier would seek any opportunity to reduce overconsumption of energy or to invent the technologies that facilitate its operations. Price capacity of suppliers includes three aspects: supply capability, capability for product development, and level of technique.
• Green image (C4)
An environmentally friendly operation has positive impacts on not only a supplier’s performance but also on its reputation to the consumers and society. Hence, active cooperation or strategies, such as environmentally friendly stakeholder relationship as well as industrial waste management policy, are considered the strengths of a supplier. Green image includes three aspects: green market share, customer purchasing retention, and stakeholder relationship.
• Environmental competencies (C5)
When evaluating green supply chain alignment of a supplier, a supplier’s capability to ensure environmental protection and sustainable development is the top priority. For instance, it is recommended to employ green technology, recycling management, reverse logistics, as well as waste management throughout the whole supply chain, namely from ordering until delivery. Additionally, we should promote practices that lead to improvement of maintenances and facilities, modifications to production processes, and substitution of materials. Environmental competencies include three aspects: clean technology availability, environmentally friendly materials, and pollution reduction capability.

4.2. Green Supplier Selection in Palm Oil Industry Using the Proposed Model

An integrated MCDM based on the prospect theory mentioned in Section 3.4 is employed to find the solution for green supplier selection. After finalizing the index system with total of 15 criteria, we analyze the cause and effect relationship between factors using fuzzy DEMATEL (Step 1–2). The process starts from denoting the expert’s linguistic evaluation by interpreting the six experts’ responses to fuzzy value (using Table 1) and the judgment matrix for decision makers in Equation (5). For example, it could be determined that the ‘environmental management system (C1)’ category is more influence than ’environmental improvement quality (C2)’, and an expert may rate this judgment as ‘no influence’. Next, we follow Equations (6)–(11) to transform triangular fuzzy numbers into the initial direct-relation matrix and modify converting fuzzy data into CFCS defuzzification method. Table 2 exhibits the initial direct-relation TFN matrix among dimension for one expert.
Then, we aggregate direct-relation crisp matrices Z ˜ 6 among dimension for all experts by using Equation (13) given in Table 3. Then, Equation (15) is used to generalize direction-relation matrix X ˜ given in Table 4.
To get the total-relation matrix T ˜ , we use the direct-relation matrix data in Table 4 for all criteria and all experts and apply it to Equation (16), then using the total influence matrix T ˜ to get the total row ( r ˜ ) and column ( s ˜ ) sum as defined in Equations (17) and (18) and presented in Table 5. The influence received by dimensions for the total fuzzy influence T ˜ matrix (cause and effect relation) of dimensions is shown in Table 6. The cause and effect relationship for criteria in each dimension is obtained in the same manner.
Based on Table 6, we can obtain the network relation map of dimensions as illustrated in Figure 5. The total relation matrix is defuzzified while the threshold value is given as 0.04 based on the suggestion of the experts. Hence, we acquire the mapping of impact relationship as presented in Figure 6.
The next step is to construct pairwise comparisons matrixes by using fuzzy ANP to find the relations between the dimensions belonging to different criteria (Step 3). All experts were requested to complete the pairwise comparisons of 5 dimensions and 15 criteria in order to allocate weightings to relevant criteria. For instances, the experts might value the ‘environmental management system (C1)’ category as more critical than ‘environmental improvement quality (C2)’, so that they mark their judgment as ‘very high importance’. The pairwise comparison marking concerns with the TFNs as described in Table 1 and employed via Equation (20) (Step 3.1).
Afterwards, we utilize Chang’s extent analysis to decide the priority weights as illustrated in Step 3.2. Furthermore, we establish the priority weights of associated dimensions and criteria grounded on the calculation of aggregate fuzzy judgment. Accordingly, Equation (21) is compiled to identify the fuzzy synthetic extent values while Equation (22) is calculated to get the degree of possibility. Meanwhile, Equation (23) demonstrates the non-normalized weights of the five criteria. Finally, Equation (24) is employed to calculate the normalized priority weights. Table 7 explains the comparison matrix for the main criteria and the final Chang’s priority weights calculated via MATLAB.
Nonetheless, we repeat the calculation of weight, interdependency among dimensions, and inter-criteria impact and place the measured values into relevant columns in order to establish the unweighted supermatrix (Step 3.3), which is exhibited in Table 8. Then, we normalize the unweighted supermatrix into the weighted supermatrix, in which the sum of each column is now equal to one. To obtain the final weights of the evaluation criteria, we raise the power of the weighted supermatrix to 2k + 1 until reaching the stabilized and equal value of each column. In the end, we compile the limit supermatrix as pictured in Table 9.
With regards to the criteria weights, we can now assess a green supplier by referring to the criteria based on the prospect theory method (Step 4). Here, we use S1, S2, and S3 to denote the three suppliers, respectively. A number of contributing elements combine to create a range of products that meet the demands of customers in the market place within Thailand palm oil industry. We assess the suppliers’ performance by gathering insights from six experts from Thailand palm oil sector. We refer to the rating scale that ranges from 0 to 4 is when conducting the evaluation. 0 indicates very low performance, whereas 4 denotes very high performance. The mean scores are taken for each supplier. Next, we can get the decision matrix H = ( h i j ) m × n .
Then, the PIS and NIS (Step 4.1) of the alternatives in each criteria are assigned by using Equations (25) and (26) as follows:
G = ( h 1 , h 2 , , h m ) = { max 1 i n ( h i 1 ) , max 1 i n ( h i 2 ) , , max 1 i n ( h i m ) } = { ( 0.68 , 0.75 , 0.83 ) , ( 0.29 , 0.44 , 1.00 ) , ( 0.22 , 0.36 , 1.00 ) , ( 0.42 , 0.50 , 0.63 ) , ( 0.75 , 0.88 , 1.00 ) , ( 0.63 , 0.77 , 1.00 ) , ( 0.50 , 0.67 , 1.00 ) , ( 0.03 , 0.51 , 1.00 ) , ( 0.60 , 0.70 , 0.80 ) , ( 0.60 , 0.70 , 0.80 ) , ( 0.80 , 0.90 , 1.00 ) , ( 0.42 , 0.73 , 0.44 ) , ( 0.12 , 0.13 , 0.15 ) , ( 0.97 , 0.97 , 0.97 ) , ( 0.76 , 0.86 , 1.00 ) } B = ( h 1 , h 2 , , h m ) = { min 1 i n ( h i 1 ) , min 1 i n ( h i 2 ) , , min 1 i n ( h i m ) } = { ( 0.13 , 0.16 , 0.21 ) , ( 0.17 , 0.18 , 0.18 ) , ( 0.12 , 0.15 , 0.20 ) , ( 0.38 , 0.63 , 0.81 ) , ( 0.20 , 0.03 , 0.75 ) , ( 0.02 , 0.02 , 0.02 ) , ( 0.20 , 0.22 , 0.25 ) , ( 0.01 , 0.10 , 0.20 ) , ( 0.30 , 0.20 , 0.10 ) , ( 0.00 , 0.10 , 0.20 ) , ( 0.10 , 0.50 , 0.31 ) , ( 0.42 , 0.73 , 0.44 ) , ( 0.00 , 1.00 , 1.00 ) , ( 0.26 , 0.26 , 0.26 ) , ( 0.25 , 0.33 , 0.50 ) }
The gain and loss value of each alternative is calculated by using Equations (27) and (28), respectively and presented as follows:
{ d ( S 1 , G ) d ( S 2 , G ) d ( S 3 , G ) } = { 0.38 , 0.44 , 0.00 , 0.00 , 0.25 , 0.79 , 0.53 , 0.59 , 0.40 , 0.80 , 0.00 , 0.00 , 0.00 , 0.50 , 0.15 0.13 , 0.00 , 0.21 , 0.21 , 0.20 , 0.00 , 0.43 , 0.47 , 0.28 , 0.20 , 0.60 , 0.40 , 0.20 , 0.87 , 0.03 0.71 , 0.50 , 0.48 , 0.24 , 0.25 , 0.00 , 0.00 , 0.52 , 0.20 , 0.20 , 0.60 , 0.60 , 0.74 , 0.00 , 0.00 } { d ( S 1 , B ) d ( S 2 , B ) d ( S 3 , B ) } = { 0.38 , 0.44 , 0.00 , 0.00 , 0.25 , 0.79 , 0.53 , 0.59 , 0.40 , 0.80 , 0.00 , 0.00 , 0.00 , 0.50 , 0.15 0.13 , 0.00 , 0.21 , 0.21 , 0.20 , 0.00 , 0.43 , 0.47 , 0.28 , 0.20 , 0.60 , 0.40 , 0.20 , 0.87 , 0.03 0.71 , 0.50 , 0.48 , 0.24 , 0.25 , 0.00 , 0.00 , 0.52 , 0.20 , 0.20 , 0.60 , 0.60 , 0.74 , 0.00 , 0.00 }
After obtaining the gain and loss values, corresponding positive and negative prospect value matrixes v and v + are acquired by Equations (29) and (30).
v = ( 0.96   1.09   0.00   0.00   0.66   1.84   1.29   1.42   1.00   1.85   0.00   0.00   0.00   1.22   1.31 0.37   0.00   0.57   0.55   0.00   1.06   1.15   0.73   0.55   1.44   1.00   0.55   1.98   0.11   0.34 1.66   1.22   1.18   0.65   0.66   0.00   0.00   1.26   0.55   0.55   1.44   1.44   1.72   0.00   0.12 ) v + = ( 0.50   0.11   0.53   0.00   0.03   0.00   0.00   0.00   0.00   0.64   0.64   0.00   0.88   0.46   0.31 0.62   0.55   0.32   0.30   0.44   0.09   0.65   0.24   0.24   0.24   0.45   0.55   0.00   0.89   0.04 0.74   0.42   0.26   0.00   0.03   0.17   0.09   0.10   0.64   0.45   0.64   0.00   0.00   0.16   0.92 )
The integrated prospect values of the alternative, as well as the rankings are based on Equation (4) and the obtained weights of criteria regarding fuzzy DEMATEL-ANP are shown in Table 10. The prospect theory weights are calculated and shown as follows:
π + ( w j ) = { 0.511 , 0.001 , 0.112 , 0.135 , 0.004 , 0.456 , 0.063 , 0.000 , 0.02 , 0.050 , 0.213 , 0.069 , 0.141 , 0.000 } π ( w j ) = { 0.105 , 0.330 , 0.000 , 0.223 , 0.000 , 0.000 , 0.431 , 0.311 , 0.000 , 0.009 , 0.000 , 0.009 , 0.000 , 0.142 , 0.100 }
After the prospect value weight are specified, the integrated prospect values of each alternative can be obtained as V 1 = 0.130 ,   V 2 = 0.402 ,   V 3 = 0.283 and these values are arranged as S2S3S1.

4.3. Sensitivity Analysis

Practically, decision making includes psychological factors—such as loss aversion, reference dependence, and risk preference—which are possible to influence the final decisions. Our sensitivity analysis denotes λ as the loss aversion parameter for the integrated fuzzy MCDM model. To test the lost aversion in green palm oil supplier selection, we alter the value of λ and complete the green supplier ranking case by case. As illustrated in Table 11, when λ = 1, supplier S3 ranks first among three suppliers. Then, the ranking changes as the loss aversion parameter (λ) increases, indicating the robustness of integrated fuzzy MCDM based on the prospect theory. However, after a certain point, an increase in the λ value no longer affects the ranking result, and it is clear that S2 outperforms S3 and S1, implying that the loss aversion is intensified.

4.4. Comparative Analysis

In this section, we compare the tools in fuzzy DEMATEL-ANP based on prospect theory with DEMATEL-ANP-VIKOR. VIKOR method is generally used for multi-criteria alternative ranking regarding the measure of closeness to the ideal solution while assigning the weight to each alternative [52]. Interestingly, the ranking results of both fuzzy DEMATEL-ANP based on prospect theory and DEMATEL-ANP-VIKOR methods are similar, as exhibited in Table 11. The reason is that, after considering the risk preference and decision makers’ behavior in MCDM problems in an uncertain environment, both rankings turn out more reasonable and fit with decision makers’ actual needs as well as behavior preferences.

5. Discussion and Analysis of the Results

The findings of this study are summarized and discussed as follows:
(1)
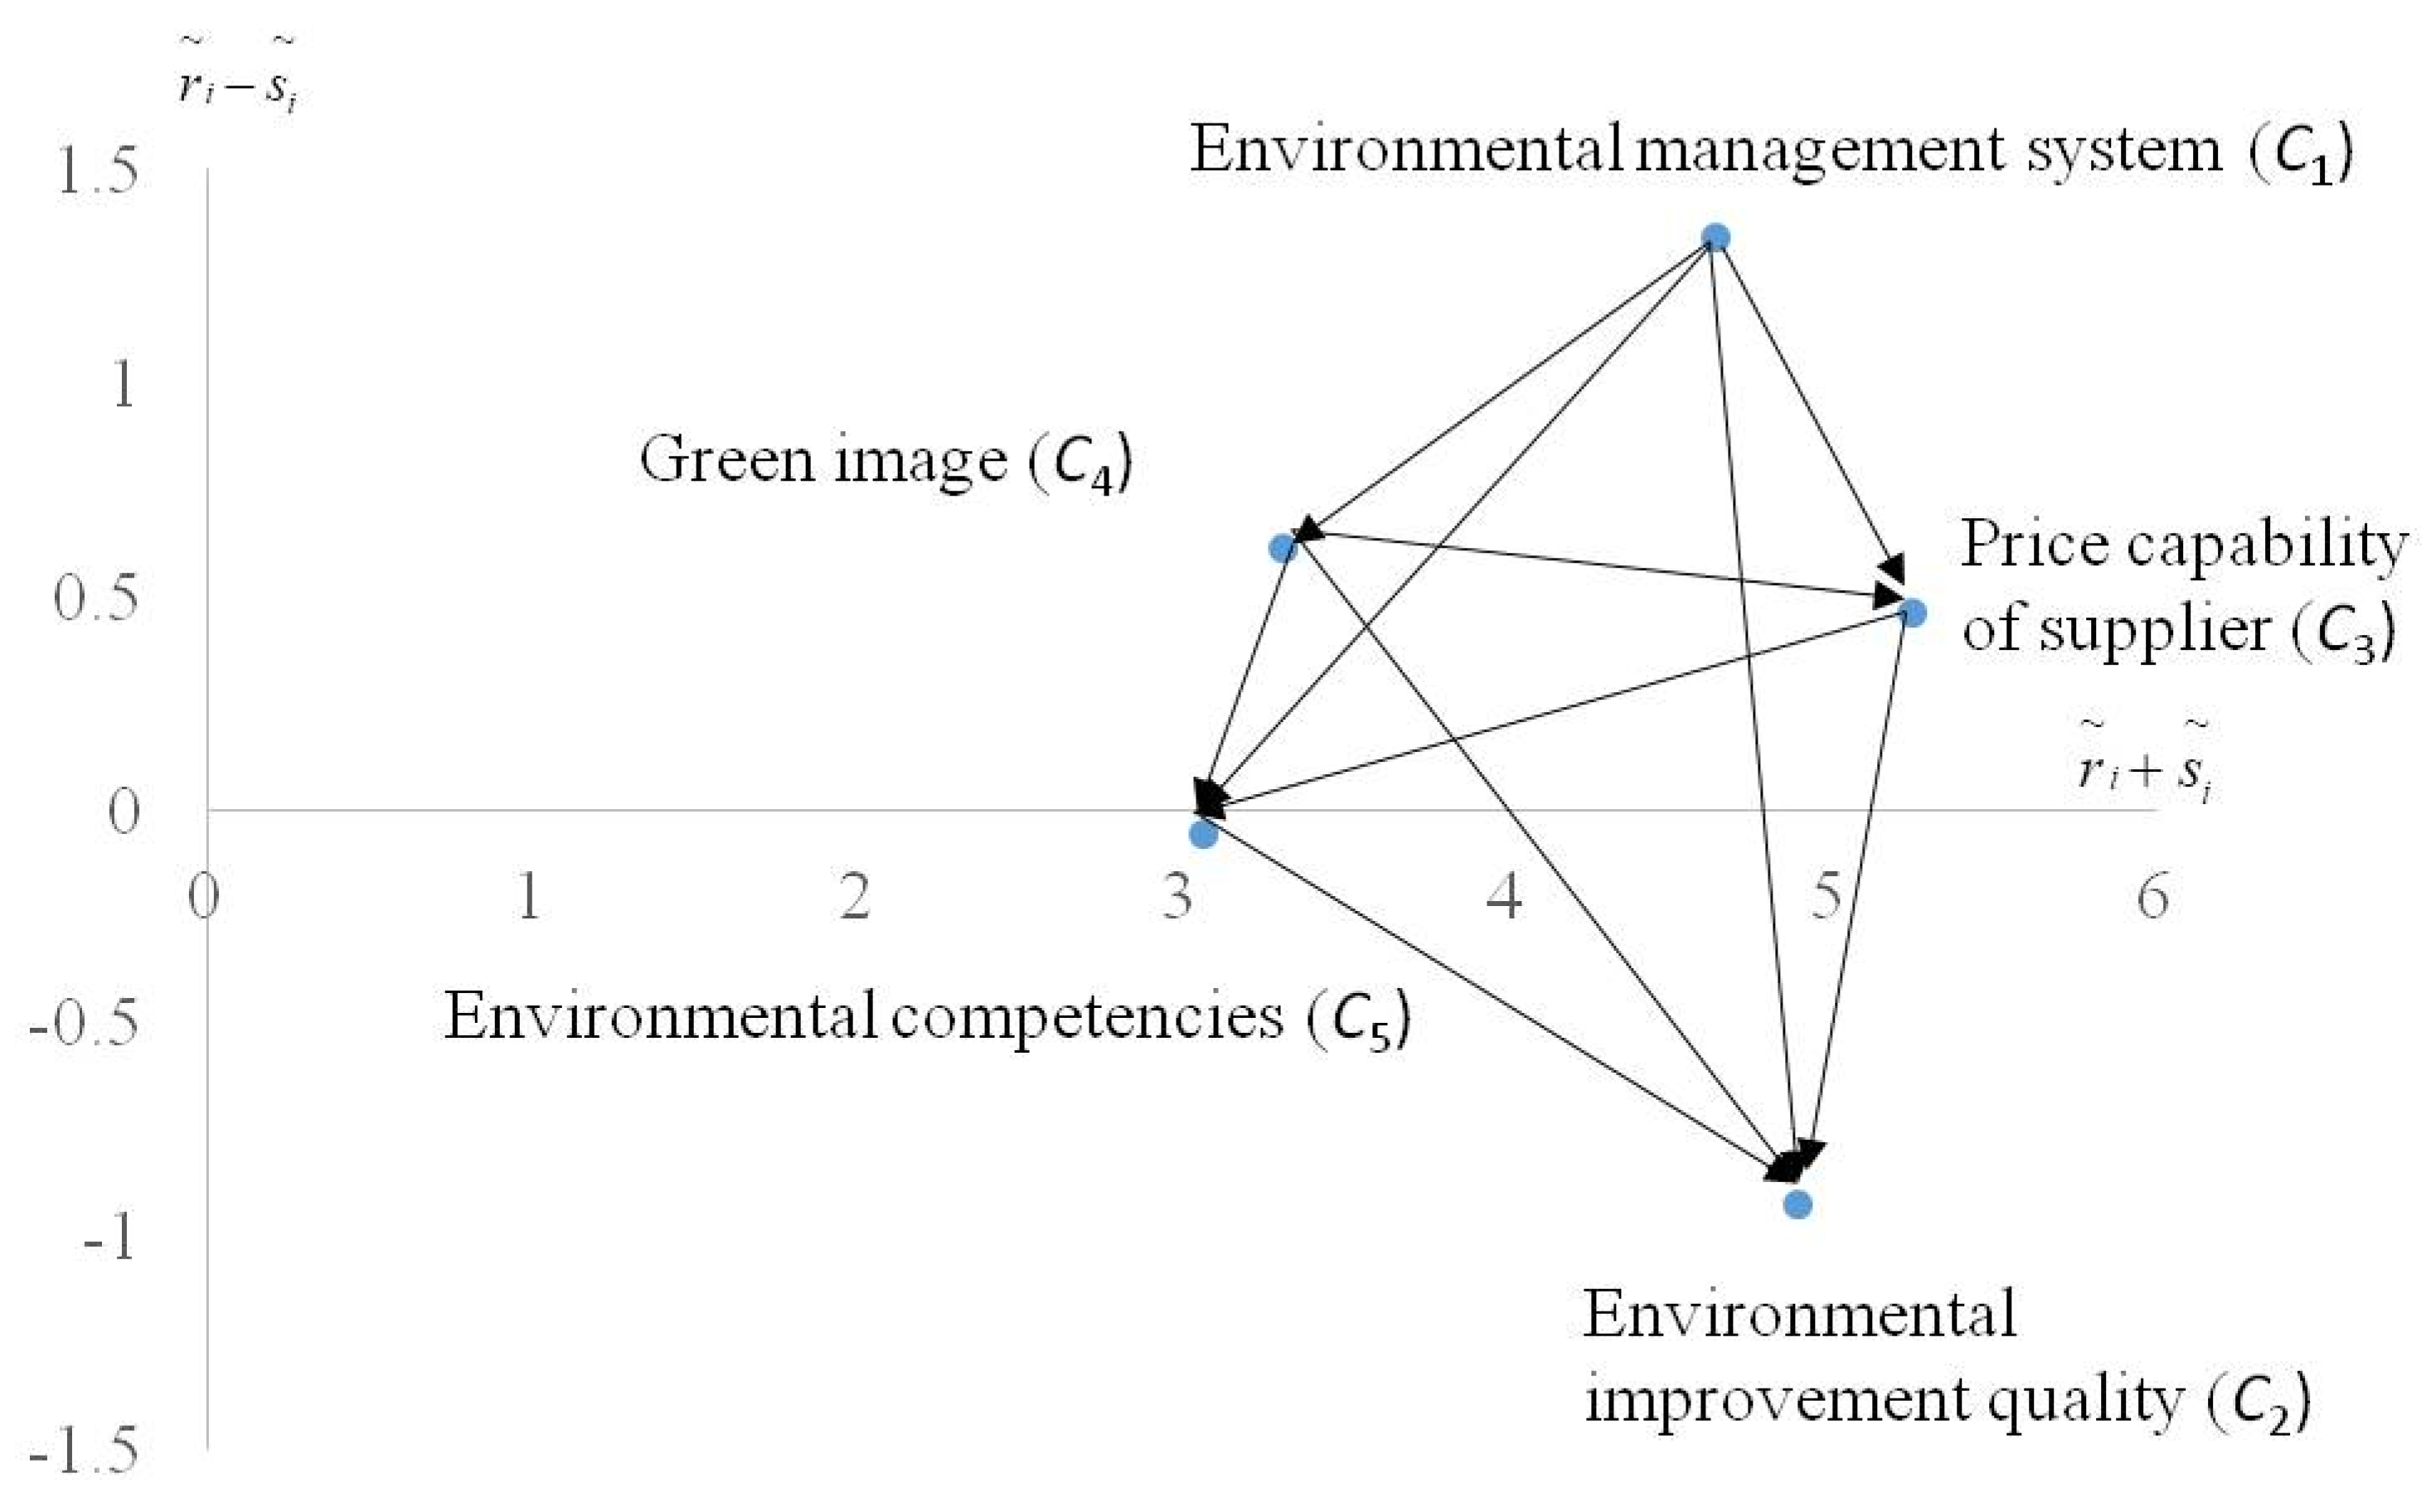
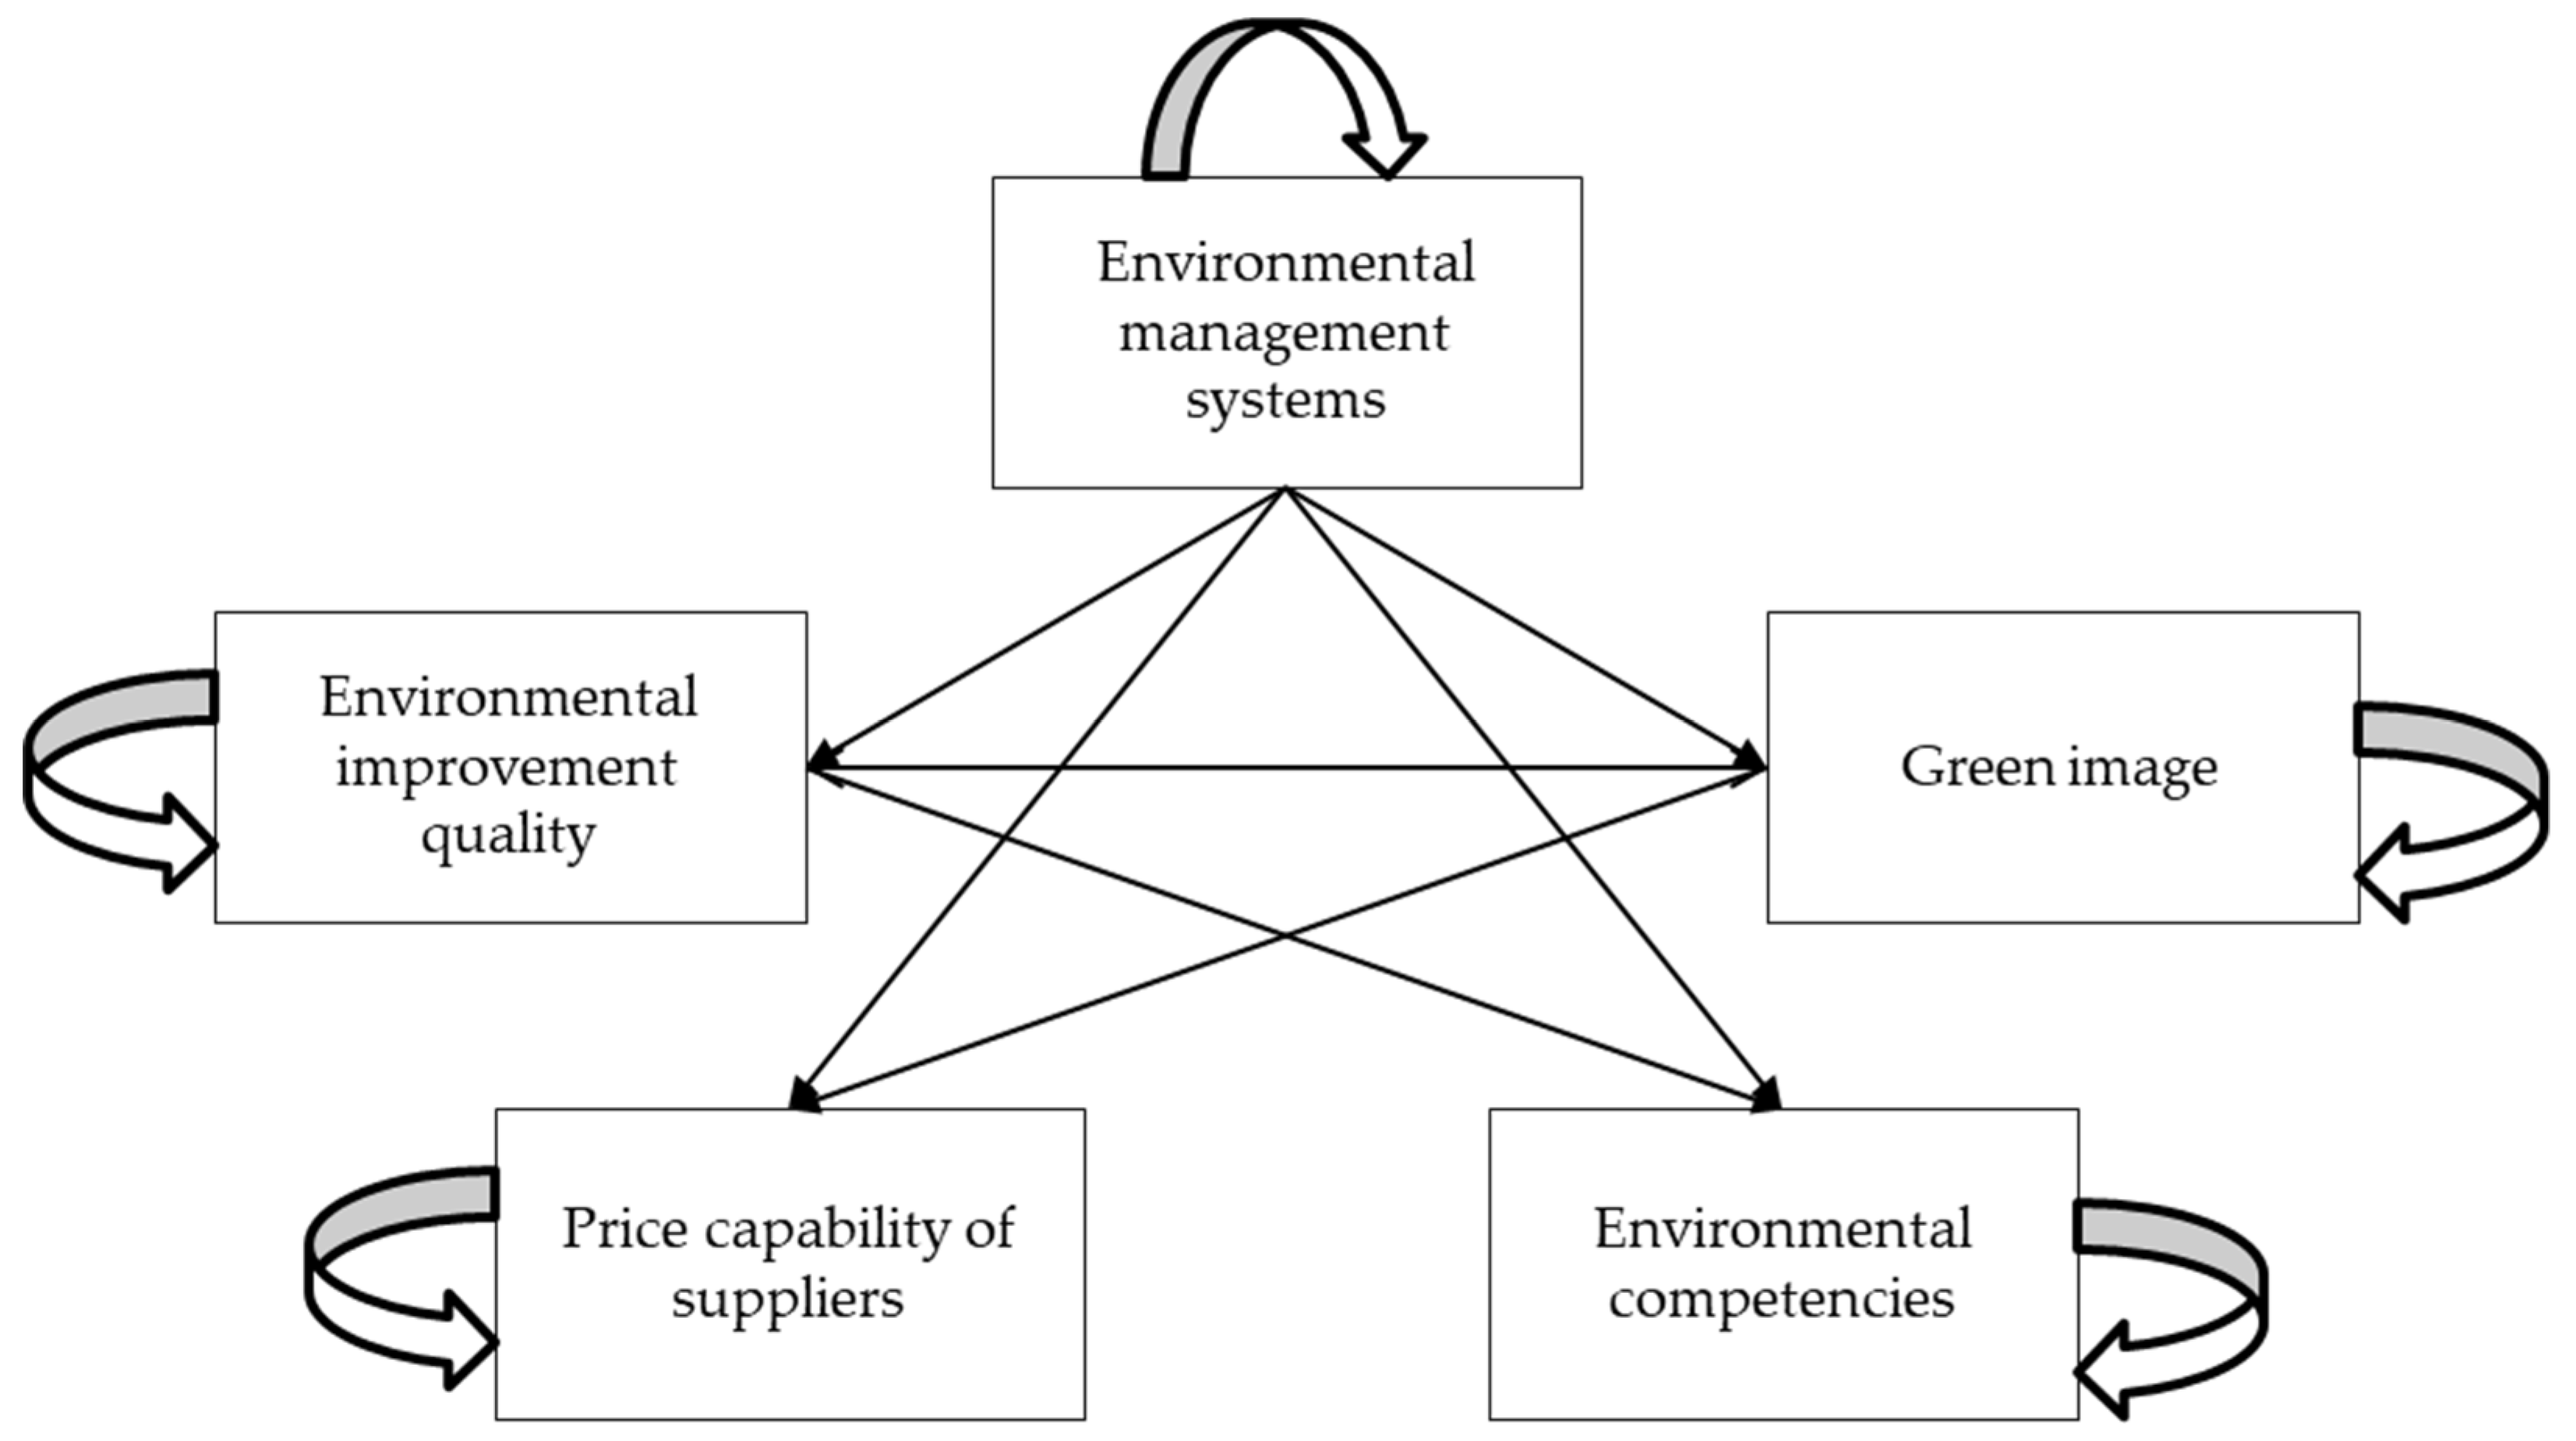
The fuzzy DEMATEL method is employed to determine the interdependence between each dimension as shown in Table 6. Moreover, Figure 5 represents the cause and effect values of all dimensions. It turns out that dimensions C1, C3, and C4 do not exhibit cause and effect with other dimensions. However, dimensions C2 and C5 are affected by the other dimensions. For the cause, the most significant factors include environmental improvement quality (C2). It implies that the buyers mainly focus on the environmental improvement quality which is described as the cooperation on quality management throughout the process (from ordering to delivery). Other important causal factors in the experts’ viewpoints are price capability of suppliers (C3) and green image (C4) respectively, indicating buyers’ attention on environmentally friendly operations. Hence, it is essential to encourage positive reputation regarding green procurement and pricing. For effects, the most significant factor is environmental improvement quality (C2), implying that buyers pay attention to the quality of palm oil products provided by the suppliers so that a green supplier should focus more on standardized product quality as well as environmental management systems. Inferior to (C2), another influencing factor is environmental management systems (C1), supporting that a supplier without effective environmental management systems or green procurement strategies should not be able to accomplish organizational sustainability. Hence, for a green supplier, it is recommended that they push forward an effective environmental management system in order to expand sales opportunities and extend long-term relationships with enterprises, more specifically the green buyers.
(2)
After determining the weight of all criteria using fuzzy ANP, we found that the maximum weight is assigned to implementation and operation (C13) as shown in Table 10. The result suggests that a sustainable supplier should give priority to the development of a strategy on cooperation and work process improvement starting from order planning to delivery of raw materials, in order to align with buyers’ expectation regarding environmental management policy.
(3)
By employing the prospect theory to handle the psychological behaviors of the decision team, we obtain the ranking result stating the supplier S2 is the most appropriate green alternative. Moreover, sensitivity analysis result points out that those green supplier rankings are sensitive to the value of the loss aversion parameter (λ). Additionally, comparative analysis is extensively conducted to clarify the rationality of our proposed model.
Our proposed methods have eliminated the limitations of classic MCDM problem-solving. Our model covers a more significant number of dimensions, and at the same time solves the problem of fuzzification by arranging the distinctive fuzzy grades in case of involvement with multiple decision makers when making the decision. The major contribution of this study to MCDM research is to develop a concrete and practical decision-making guideline for cooperation on environmentally friendly sourcing and selection of green suppliers of palm oil products which require raw materials for various consumer goods. While previous studies usually focus only on the weighting of relevant factors, we modify an integrated fuzzy MCDM to our model aiming to minimize the problem caused by the complexity and uncertainty regarding the selection of green suppliers of palm oil products. Additionally, we include the prospect theory which is a newly defined MCDM for the analysis of decision makers’ risk preference in an uncertain environment, leading to adequately realistic and reasonable results. Accordingly, the procurement team can refer to those results when seeking a green supplier. Meanwhile, a supplier can also use this guideline when trying to create a sustainable cooperation with buyers in green supply chains. However, it is still possible to reduce the complexity of the model by adopting additional methods which can be extracted from a broader set of dimensions and criteria.

6. Conclusions

The global consumer demand for products in the palm oil products industry has increased dramatically, especially for consumer goods such as cooking oil, non-dairy cream, and other related processed products. In Thailand, a certain number of modern enterprises focus on going green by engaging only in green supply chains. Accordingly, they try to seek green suppliers of raw materials needed for manufacturing. Since palm oil product is considered a high-demand raw material, this study presents an integrated conceptual framework to build and strengthen green supply chains for Thailand’s palm oil sector. Our proposed model is distinct from the classic model in the reviewed literature. Firstly, traditional models assume that green supplier selection is characterized by interdependent and interactive criteria. However, in reality, independent criteria and dimensions characterize decision making with probable conflicting and feedback effects.
Moreover, this study analyzes the latent problems caused by decision makers’ behaviors that might reflect the unscientific evaluation results. Possible latent problems are:
  • Indicators used on supplier evaluation do not cover all relevant aspects and do not align with green supplier characteristics.
  • Procurement teams deal with lots of information so that there is a high possibility of information loss; meanwhile traditional data management only transforms the data into the real number, leading to the problems of uncertainty environment.
  • The weight determining method used in a traditional green supplier selection model can neither handle uncertainty or fuzziness nor analyze cause and effect relationships, thus biasedly impacting the final decision making results.
  • The decision makers’ behavioral characteristics usually contain over expectations and risks under different environments.
The major innovations and impactful research findings of this paper are as follows:
  • We synthesize factors for selecting green suppliers by combining the data from the interview with procurement experts and the literature reviews, and finally came up with the five most significant dimensions, each with three criteria
  • An integrated multi-criteria decision-making method using fuzzy DEMATEL is helpful to identify the cause and effect interrelationship of green factors, while ANP is helpful to identify index weights of various elements based on the comparison matrix and the network structure of interdependency. Hence, the procurement team can effectively enhance decision making efficiency, especially in environmentally friendly sourcing strategies
  • Our decision-making framework applies the case study of three supplier candidates—namely S1, S2, and S3—by employing the prospect theory to synthesize the risk preference of decision makers when ranking the three suppliers’ green performance. After conducting the sensitivity analysis, S2S3S1. With careful consideration of risk preference and decision makers’ behavior, our prospect theory integrating MCDM in an uncertain environment provides results that are more consistent with the reality, leading to the selection of green alternatives that most satisfy the procurement team’s psychological preference and expectation.
The findings of the current study can serve as a reference for decision-makers who aim to reduce the gaps in the alternatives and reach ideal levels. Such knowledge can help both buyers and suppliers to understand the relevant factors for green performance and devise strategies for improvement. The empirical example demonstrates the substantial effect of interdependencies among all the criteria. Therefore, it is now possible to identify the best choice among all potential green suppliers of palm oil products in Thailand.
However, an additional limitation exists: the weightings are assessed by various procurement managers. This can lead to a lack of consistency among their judgments, which in turn, can potentially affect the final outcomes. Given that managers’ personal viewpoints might deliberately or inadvertently lead to biased allocations of the weightings, the scope of the study can be broadened in future research to increase the accuracy. Furthermore, manager perspectives within Thailand’s palm oil products sector should be applied, because their opinions and expertise can undoubtedly contribute to the decision-making process. However, our conclusions are exclusively based on Thailand’s palm oil products industry; thus, caution should be exercised in interpreting the results and in generalizing the conclusion. Future studies can refer to other cases in manufacturing to test our model across industries and draw accurate comparisons.

Author Contributions

P.P. and C.T. contributed equally in the writing of this article.

Funding

This work was partly supported by National Natural Science Foundation of China (no. 71671188), and Natural Science Foundation of Hunan Province, China (no. 2016JJ1024).

Conflicts of Interest

The authors declare no conflict of interest.

References

  1. Fallahpour, A.; Udoncy Olugu, E.; Nurmaya Musa, S.; Yew Wong, K.; Noori, S. A decision support model for sustainable supplier selection in sustainable supply chain management. Comput. Ind. Eng. 2017, 105, 391–410. [Google Scholar] [CrossRef]
  2. Feng, Y.; Hong, Z.; Tian, G.; Li, Z.; Tan, J.; Hu, H. Environmentally friendly MCDM of reliability-based product optimisation combining DEMATEL-based ANP, interval uncertainty and Vlse Kriterijumska Optimizacija Kompromisno Resenje (VIKOR). Inf. Sci. 2018, 442–443, 128–144. [Google Scholar] [CrossRef]
  3. Saswattecha, K.; Kroeze, C.; Jawjit, W.; Hein, L. Improving environmental sustainability of Thai palm oil production in 2050. J. Clean. Prod. 2017, 147, 572–588. [Google Scholar] [CrossRef]
  4. Tan, C.; Liu, Z.; Wu, D.D.; Chen, X. Cournot game with incomplete information based on rank-dependent utility theory under a fuzzy environment. Int. J. Prod. Res. 2016, 56, 1789–1805. [Google Scholar] [CrossRef]
  5. Sarkar, S.; Pratihar, D.K.; Sarkar, B. An integrated fuzzy multiple criteria supplier selection approach and its application in a welding company. J. Manuf. Syst. 2018, 46, 163–178. [Google Scholar] [CrossRef]
  6. Feng, Z.; Tan, C. Pricing, Green Degree and Coordination Decisions in a Green Supply Chain with Loss Aversion. Mathematics 2019, 7, 239. [Google Scholar] [CrossRef]
  7. Tan, C.; Yi, W.; Chen, X. Bertrand game under a fuzzy environment. J. Intell. Fuzzy Syst. 2018, 34, 2611–2624. [Google Scholar] [CrossRef]
  8. Govindan, K.; Khodaverdi, R.; Vafadarnikjoo, A. Intuitionistic fuzzy based DEMATEL method for developing green practices and performances in a green supply chain. Expert Syst. Appl. 2015, 42, 7207–7220. [Google Scholar] [CrossRef]
  9. Kuo, R.J.; Wang, Y.C.; Tien, F.C. Integration of artificial neural network and MADA methods for green supplier selection. J. Clean. Prod. 2010, 18, 1161–1170. [Google Scholar] [CrossRef]
  10. Lo, H.-W.; Liou, J.J.H.; Wang, H.-S.; Tsai, Y.-S. An integrated model for solving problems in green supplier selection and order allocation. J. Clean. Prod. 2018, 190, 339–352. [Google Scholar] [CrossRef]
  11. Govindan, K.; Shankar, M.; Kannan, D. Supplier selection based on corporate social responsibility practices. Int. J. Prod. Econ. 2018, 200, 353–379. [Google Scholar] [CrossRef]
  12. Shen, L.; Olfat, L.; Govindan, K.; Khodaverdi, R.; Diabat, A. A fuzzy multi criteria approach for evaluating green supplier’s performance in green supply chain with linguistic preferences. Resour. Conserv. Recycl. 2013, 74, 170–179. [Google Scholar] [CrossRef]
  13. Büyüközkan, G.; Çifçi, G. A novel hybrid MCDM approach based on fuzzy DEMATEL, fuzzy ANP and fuzzy TOPSIS to evaluate green suppliers. Expert Syst. Appl. 2012, 39, 3000–3011. [Google Scholar] [CrossRef]
  14. Dos Santos, B.M.; Godoy, L.P.; Campos, L.M.S. Performance evaluation of green suppliers using entropy-TOPSIS-F. J. Clean. Prod. 2019, 207, 498–509. [Google Scholar] [CrossRef]
  15. Shi, H.; Quan, M.-Y.; Liu, H.-C.; Duan, C.-Y. A Novel Integrated Approach for Green Supplier Selection with Interval-Valued Intuitionistic Uncertain Linguistic Information: A Case Study in the Agri-Food Industry. Sustainability 2018, 10, 733. [Google Scholar] [CrossRef]
  16. Mousakhani, S.; Nazari-Shirkouhi, S.; Bozorgi-Amiri, A. A novel interval type-2 fuzzy evaluation model based group decision analysis for green supplier selection problems: A case study of battery industry. J. Clean. Prod. 2017, 168, 205–218. [Google Scholar] [CrossRef]
  17. Wang, C.-N.; Nguyen, V.T.; Thai, H.T.N.; Tran, N.N.; Tran, T.L.A. Sustainable Supplier Selection Process in Edible Oil Production by a Hybrid Fuzzy Analytical Hierarchy Process and Green Data Envelopment Analysis for the SMEs Food Processing Industry. Mathematics 2018, 6, 302. [Google Scholar] [CrossRef]
  18. Wang, T.-C.; Tsai, S.-Y. Solar Panel Supplier Selection for the Photovoltaic System Design by Using Fuzzy Multi-criteria decision-making (MCDM) Approaches. Energies 2018, 11, 1989. [Google Scholar] [CrossRef]
  19. Awasthi, A.; Govindan, K.; Gold, S. Multi-tier sustainable global supplier selection using a fuzzy AHP-VIKOR based approach. Int. J. Prod. Econ. 2018, 195, 106–117. [Google Scholar] [CrossRef]
  20. Galankashi, M.R.; Chegeni, A.; Soleimanynanadegany, A.; Memari, A.; Anjomshoae, A.; Helmi, S.A.; Dargi, A. Prioritizing Green Supplier Selection Criteria Using Fuzzy Analytical Network Process. Proc. CIRP 2015, 26, 689–694. [Google Scholar] [CrossRef] [Green Version]
  21. Bottani, E.; Centobelli, P.; Murino, T.; Shekarian, E. A QFD-ANP Method for Supplier Selection with Benefits, Opportunities, Costs and Risks Considerations. Int. J. Inf. Technol. Decis. Mak. 2018, 17, 911–939. [Google Scholar] [CrossRef]
  22. Liou, J.J.H.; Tamošaitienė, J.; Zavadskas, E.K.; Tzeng, G.-H. New hybrid COPRAS-G MADM Model for improving and selecting suppliers in green supply chain management. Int. J. Prod. Res. 2015, 54, 114–134. [Google Scholar] [CrossRef]
  23. Jiang, P.; Hu, Y.C.; Yen, G.F.; Tsao, S.J. Green supplier selection for sustainable development of the automotive industry using grey decision-making. Sustain. Dev. 2018, 26, 890–903. [Google Scholar] [CrossRef]
  24. Guarnieri, P.; Trojan, F. Decision making on supplier selection based on social, ethical, and environmental criteria: A study in the textile industry. Resour. Conserv. Recycl. 2019, 141, 347–361. [Google Scholar] [CrossRef]
  25. Lu, Z.; Sun, X.; Wang, Y.; Xu, C. Green supplier selection in straw biomass industry based on cloud model and possibility degree. J. Clean. Prod. 2019, 209, 995–1005. [Google Scholar] [CrossRef]
  26. Song, W.; Chen, Z.; Wang, X.; Wang, Q.; Shi, C.; Zhao, W. Environmentally Friendly Supplier Selection Using Prospect Theory. Sustainability 2017, 9, 377. [Google Scholar] [CrossRef]
  27. Song, W.; Chen, Z.; Liu, A.; Zhu, Q.; Zhao, W.; Tsai, S.-B.; Lu, H. A Study on Green Supplier Selection in Dynamic Environment. Sustainability 2018, 10, 1226. [Google Scholar] [CrossRef]
  28. Qin, J.; Liu, X.; Pedrycz, W. An extended TODIM multi-criteria group decision making method for green supplier selection in interval type-2 fuzzy environment. Eur. J. Oper. Res. 2017, 258, 626–638. [Google Scholar] [CrossRef]
  29. Li, Y.-L.; Ying, C.-S.; Chin, K.-S.; Yang, H.-T.; Xu, J. Third-party reverse logistics provider selection approach based on hybrid-information MCDM and cumulative prospect theory. J. Clean. Prod. 2018, 195, 573–584. [Google Scholar] [CrossRef]
  30. Khatun, R.; Reza, M.I.H.; Moniruzzaman, M.; Yaakob, Z. Sustainable oil palm industry: The possibilities. Renew. Sustain. Energy Rev. 2017, 76, 608–619. [Google Scholar] [CrossRef]
  31. Musikavong, C.; Gheewala, S.H. Ecological footprint assessment towards eco-efficient oil palm and rubber plantations in Thailand. J. Clean. Prod. 2017, 140, 581–589. [Google Scholar] [CrossRef]
  32. Jiang, Z.-Z.; Tan, C.; Chen, X.; Sheng, Y. A Multi-objective Matching Approach for One-Shot Multi-attribute Exchanges Under a Fuzzy Environment. Int. J. Fuzzy. Syst. 2015, 17, 53–66. [Google Scholar] [CrossRef]
  33. Chen, S.M.; Chang, Y.C. Weighted Fuzzy Rule Interpolation Based on GA-Based Weight-Learning Techniques. IEEE Trans. Fuzzy Syst. 2011, 19, 729–744. [Google Scholar] [CrossRef]
  34. Chen, S.-M.; Munif, A.; Chen, G.-S.; Liu, H.-C.; Kuo, B.-C. Fuzzy risk analysis based on ranking generalized fuzzy numbers with different left heights and right heights. Expert Syst. Appl. 2012, 39, 6320–6334. [Google Scholar] [CrossRef]
  35. Centobelli, P.; Cerchione, R.; Esposito, E. How to deal with knowledge management misalignment: A taxonomy based on a 3D fuzzy methodology. J. Knowl. Manag. 2018, 22, 538–566. [Google Scholar] [CrossRef]
  36. Watanabe, N. Statistical Methods for Estimating Membership Functions. Jpn. J. Fuzzy Theory Syst. 1979, 5, 17–25. [Google Scholar]
  37. Zadeh, L.A. Fuzzy sets. Inf. Control 1965, 8, 338–353. [Google Scholar] [CrossRef] [Green Version]
  38. Sloan, D.S. A Review of: “Fuzzy set theory and its applications” (Second Edition), by H.-J. Zimmermann. Kluwer Publishers, Boston, 1991. Int. J. Gen. Syst. 1992, 21, 117–119. [Google Scholar] [CrossRef]
  39. Cui, C.; Feng, Z.; Tan, C.; Borkotokey, S. Loss Aversion Equilibrium of Bimatrix Games with Symmetric Triangular Fuzzy Payoffs. Int. J. Fuzzy Syst. 2019. [Google Scholar] [CrossRef]
  40. Hsu, C.-C.; Liou, J.J.H.; Chuang, Y.-C. Integrating DANP and modified grey relation theory for the selection of an outsourcing provider. Expert Syst. Appl. 2013, 40, 2297–2304. [Google Scholar] [CrossRef]
  41. Tseng, M.-L. Using hybrid MCDM to evaluate the service quality expectation in linguistic preference. Appl. Soft Comput. 2011, 11, 4551–4562. [Google Scholar] [CrossRef]
  42. Uygun, Ö.; Kaçamak, H.; Kahraman, Ü.A. An integrated DEMATEL and Fuzzy ANP techniques for evaluation and selection of outsourcing provider for a telecommunication company. Comput. Ind. Eng. 2015, 86, 137–146. [Google Scholar] [CrossRef]
  43. Cui, C.; Feng, Z.; Tan, C. Credibilistic Loss Aversion Nash Equilibrium for Bimatrix Games with Triangular Fuzzy Payoffs. Complexity 2018, 2018, 7143586. [Google Scholar] [CrossRef]
  44. Tversky, A.; Kahneman, D. Loss Aversion in Riskless Choice: A Reference-Dependent Model. Q. J. Econ. 1991, 106, 1039–1061. [Google Scholar] [CrossRef] [Green Version]
  45. Kiani Mavi, R.; Standing, C. Critical success factors of sustainable project management in construction: A fuzzy DEMATEL-ANP approach. J. Clean. Prod. 2018, 194, 751–765. [Google Scholar] [CrossRef]
  46. Wu, W.-W.; Lee, Y.-T. Developing global managers’ competencies using the fuzzy DEMATEL method. Expert Syst. Appl. 2007, 32, 499–507. [Google Scholar] [CrossRef]
  47. Saaty, T.L. The Analytic Network Process; Springer: Berlin, Germany, 2008. [Google Scholar]
  48. Shafiee, M. A fuzzy analytic network process model to mitigate the risks associated with offshore wind farms. Expert Syst. Appl. 2015, 42, 2143–2152. [Google Scholar] [CrossRef]
  49. Uygun, Ö.; Dede, A. Performance evaluation of green supply chain management using integrated fuzzy multi-criteria decision-making techniques. Comput. Ind. Eng. 2016, 102, 502–511. [Google Scholar] [CrossRef]
  50. Chang, D.Y. Applications of the extent analysis method on fuzzy AHP. Eur. J. Oper. Res. 1996, 95, 649–655. [Google Scholar] [CrossRef]
  51. Wu, Y.; Xu, C.; Zhang, T. Evaluation of renewable power sources using a fuzzy MCDM based on cumulative prospect theory: A case in China. Energy 2018, 147, 1227–1239. [Google Scholar] [CrossRef]
  52. Opricovic, S.; Tzeng, G.-H. Compromise solution by MCDM methods: A comparative analysis of VIKOR and TOPSIS. Eur. J. Oper. Res. 2004, 156, 445–455. [Google Scholar] [CrossRef]
Figure 1. A value function of prospect theory.
Sustainability 11 01872 g001
Figure 2. The purpose model of the green supplier selection.
Sustainability 11 01872 g002
Figure 3. The degree of a possibility of S ˜ i ( l i , m i , u i ) S ˜ j ( l j , m j , u j ) .
Sustainability 11 01872 g003
Figure 4. The hierarchy of green supplier selection.
Sustainability 11 01872 g004
Figure 5. Influential NRM of relations within dimensions.
Sustainability 11 01872 g005
Figure 6. The impact relationship map within dimensions.
Sustainability 11 01872 g006
Table 1. Membership function of the triangular fuzzy numbers [45].
DefinitionTriangular Fuzzy Number
No Influence (N)(0, 0, 0.25)
Very Low Influence (VL)(0, 0.25, 0.50)
Low Influence (L)(0.25, 0.50, 0.75)
High Influence (H)(0.50, 0.75, 1.00)
Very High Influence (VH)(0.75, 1.00, 1.00)
Table 2. Initial direct-relation TFN matrixes among dimension of one the experts.
Linguistic ComparisonCorresponding TFNs
DimensionC1C2C3C4C5C1C2C3C4C5
C11NLLH(1, 1, 1)(0, 0, 0.25)(0.25, 0.50, 0.75)(0.25, 0.50, 0.75)(0.50, 0.75, 1.00)
C2H1VHLVH(0.50, 0.75, 1.00)(1, 1, 1)(0.75, 1.00, 1.00)(0.25, 0.50, 0.75)(0.75, 1.00, 1.00)
C3NL1VHH(0, 0, 0.25)(0, 0, 0.25)(1, 1, 1)(0.75, 1.00, 1.00)(0.50, 0.75, 1.00)
C4LHVH1VH(0.25, 0.50, 0.75)(0.50, 0.75, 1.00)(0.75, 1.00, 1.00)(1, 1, 1)(0.75, 1.00, 1.00)
C5VHHNL1(0.75, 1.00, 1.00)(0.50, 0.75, 1.00)(0, 0, 0.25)(0.25, 0.50, 0.75)(1, 1, 1)
Table 3. Aggregated initial direct-relation matrix Z ˜ 6 for all dimension and criteria for all six experts.
DimensionsC1C2C3C4C5
C10.000.850.070.340.15
C20.890.000.270.460.34
C30.190.390.000.660.77
C40.310.540.420.000.42
C50.270.460.700.350.00
Table 4. Generalized direct-relation matrix X ˜ for all criteria and all six experts.
DimensionsC1C2C3C4C5
C10.000.380.030.150.07
C20.400.000.120.210.15
C30.080.170.000.290.34
C40.140.240.190.000.19
C50.120.210.310.150.00
Table 5. Total influence matrix T ˜ among dimensions for all six experts.
DimensionsC1C2C3C4C5 r ˜ i
C10.550.920.440.630.513.06
C20.960.810.620.810.703.91
C30.760.980.600.930.924.19
C40.720.920.650.600.713.61
C50.730.930.780.780.603.81
s ˜ i 3.724.563.083.753.46
Table 6. Influence received by dimensions for the total fuzzy influence T ˜ matrix.
DimensionsC1C2C3C4C5 r ˜ i + s ˜ i r ˜ i s ˜ i
C10.550.920.440.630.516.77−0.66
C20.960.810.620.810.708.47−0.68
C30.760.980.600.930.927.271.10
C40.720.920.650.600.717.36−0.15
C50.730.930.780.780.607.270.36
Table 7. The final Chang’s priority weights for all dimensions.
Corresponding TFNs
DimensionsC1C2C3C4C5Weights
C1(1, 1, 1)(0.73, 1.22, 1.63)(0.38, 0.52, 1,48)(0.30, 0.22, 1,46)(0.04, 0.22, 1.03)0.243
C2(0.73, 1.22, 1.63)(1, 1, 1)(0.44, 1.28, 1.30)(0.39, 1.11, 1.03)(1.28, 0.41, 1.39)0.201
C3(0.58, 0.81, 1.26)(0.68, 0.92, 1,38)(1, 1, 1)(0.42, 1.70, 1.61)(0.74, 1.33, 1.82)0.225
C4(0.60, 0.33, 1.32)(0.54, 1.08, 1.96)(0.95, 1.00, 1.56)(1, 1, 1)(0.55, 0.23, 0.25)0.121
C5(0.36, 0.83, 1.22)(0.74, 1.08, 1.61)(0.54, 1.50, 1.00)(0.64, 1.23, 1.30)(1, 1, 1)0.210
Table 8. Unweights supermatrix for all criteria.
CriteriaC11C12C13C21C22C23C31C32C33C41C42C43C51C52C53
C110000.3370.2090.2300.2010.2000.1850.1250.2360.1890.2200.1350.204
C120000.3690.3530.2000.1260.2310.2220.3030.2110.1550.1390.2220.211
C130000.3200.3140.2000.3010.2030.2450.1530.1640.2530.2210.2800.221
C210.3430.2000.2200000.1520.1430.1180.2330.2500.2060.2200.2110.210
C220.3550.2330.2500000.2200.2230.2300.1860.1390.1970.2000.1520.154
C230.3020.3270.2810000.2320.2420.2030.2850.2520.2300.2280.2400.250
C310.3390.3510.3130.2400.2460.2210000.2530.2930.2070.2730.2130.210
C320.3330.3220.2050.2540.2750.2100000.2120.3040.3100.1970.2100.331
C330.3280.3190.2010.2550.3010.1540000.2500.1510.2530.3020.3370.209
C410.4020.3210.3330.3270.3190.3050.3710.2640.4000000.2770.3690.353
C420.3490.3600.3310.3510.3210.3010.2670.3000.3000000.3230.3200.314
C430.2490.2490.3360.3220.3600.3940.3620.4360.3000000.4000.3110.333
C510.3330.1530.2200.2230.2010.2320.2420.2030.2280.2530.2440.203000
C520.3310.2910.3100.2890.1910.2220.2310.3400.3610.2700.3510.303000
C530.3360.3430.2310.2880.3210.3330.2820.2580.1900.2330.1500.261000
444444444444444
Table 9. Stable matrix of fuzzy ANP when power of 2k + 1.
CriteriaC11C12C13C21C22C23C31C32C33C41C42C43C51C52C53
Weight0.0710.0860.0580.0820.0620.0690.0670.0610.0740.0530.0830.0570.0560.0650.055
Table 10. Ranking results with different value of λ.
Different Values of λRanking Orders of Green Supplier
λ = 1S3S2S1
λ = 1.25S3S2S1
λ = 1.75S2S3S1
λ = 2.25S2S3S1
λ = 2.75S2S3S1
λ = 3.25S2S3S1
λ = 4.00S2S3S1
Table 11. Comparisons with another method
MethodsOrders of Alternatives
Fuzzy DEMATEL-ANP based on prospect theory
DEMATEL-ANP-VIKOR
S2 ≻ S3 ≻ S1
S2 ≻ S3 ≻ S1

