Assessing the Carbon Emission Driven by the Consumption of Carbohydrate-Rich Foods: The Case of China
by
Xiaoke Yang
1, 
Zhihang Zhang
2,
Huangyixin Chen
1,
Rongrong Zhao
1,
Zhongyue Xu
1,*,
Anguo Xie
3 and
Qiuhua Chen
1,* 1
College of Management, Fujian Agriculture and Forestry University, Fuzhou 350002, China
2
Teagasc Food Research Centre, Ashtown, 15 Dublin, Ireland
3
College of Food &Bioengineering, Henan University of Science and Technology, Luoyang 471023, China
*
Authors to whom correspondence should be addressed.
Sustainability 2019, 11(7), 1875; https://doi.org/10.3390/su11071875
Submission received: 12 February 2019
/
Revised: 18 March 2019
/
Accepted: 26 March 2019
/
Published: 28 March 2019
(This article belongs to the Section Sustainable Agriculture)
Abstract
:Background: Carbohydrate-rich (CR) foods are essential parts of the Chinese diet. However, CR foods are often given less attention than animal-based foods. The objectives of this study were to analyze the carbon emissions caused by CR foods and to generate sustainable diets with low climate impact and adequate nutrients. Methods: Twelve common CR food consumption records from 4857 individuals were analyzed using K-means clustering algorithms. Furthermore, linear programming was used to generate optimized diets. Results: Total carbon emissions by CR foods was 683.38g CO2eq per day per capita, accounting for an annual total of 341.9Mt CO2eq. All individuals were ultimately divided into eight clusters, and none of the popular clusters were low carbon or nutrient sufficient. Optimized diets could reduce about 40% of carbon emissions compared to the average current diet. However, significant structural differences exist between the current diet and optimized diets. Conclusions: To reduce carbon emissions from the food chain, CR foods should be a research focus. Current Chinese diets need a big change to achieve positive environmental and health goals. The reduction of rice and wheat-based foods and an increase of bean foods were the focus of structural dietary change in CR food consumption.
1. Introduction
Global food production is related to high amounts of greenhouse gas (GHG) or carbon emissions [1,2,3,4]. Recently, various studies, from different perspectives, have been carried out to reduce carbon emissions produced by food production [5,6,7,8]. Some technological and managerial options have been used to reduce GHG emissions, such as enhancing carbon removals by restoring degraded lands, optimizing fertilizer use, and increasing the production capacity per unit of emissions generated [9]. However, technological improvements alone were not enough to reduce GHG emissions, because the combination of population growth and rising consumption of high-energy foods could undermine the emission cuts that technological and managerial innovations could achieve [10]. Thus, a number of researchers have focused their attention on dietary choices [11,12]. Many studies set different dietary scenarios to investigate the potential for reducing GHG emissions [11,13], such as the Mediterranean diet and the national average diet in Italy [14], nine dietary scenarios in China [6], and six patterns in the Netherlands [15]. However, dietary scenarios were not intrinsically linked in these studies. A clustering algorithm can group data into different clusters based on distance to the centroid. A clustering algorithm, then, could better exhibit the implicate linkage among investigation samples. For example, three dietary patterns of 1500 Irish adults were profiled by Hyland et al. [16], and seven dietary patterns of 10,723 respondents were identified in Canada by Veeramani et al. [17]. On the other hand, a sustainable diet should consider both nutritional and environmental aspects [18]. If not well balanced, the dietary styles that tend to be most beneficial in environmental terms, such as a vegan and vegetarian diets, could lead to an insufficient supply of essential nutrients [19]. Many studies deal with this issue through linear programming, i.e., constraining environmental and health criteria together to generate qualified choices about diets [20]. Many diets, such as those in France [21], Netherlands [22], and the USA [23], have been optimized using linear programming. These studies all highlight animal-based foods. Although some studies showed that this process is a useful strategy by changing the ratio of meat consumption in current diets [6,17,24,25], many studies showed that consumers were reluctant to eat less meat [26,27]. With the rapid development of the economy, meat consumption per capita presented by Chinese statistics increased by 62.4% during the period of 2000–2016 [28]. This result is inconsistent with the demand of reducing meat consumption in a short period of time. In addition, dramatic reductions in meat consumption could lead to smaller reductions in carbon emissions, because the consumption of other ingredients might increase to compensate for the nutrients in meat [6].
Unlike western dietary patterns, carbohydrate-rich (CR) foods, which include cereals, beans, and tuber foods, are the main energy source in Chinese diets, providing about 50–65% of the total energy intake [29]. The study by Batis et al. [30] found that the characteristics of Chinese inhabitants’ diets include a high intake of rice and wheat flour products. Considering the recommended amount (250–400g per day) of CR foods [29] and the population of China, CR foods have a significant impact on the environment. The carbon emissions of 17,110 family members of Chinese households was quantified, and data showed that 39% of total carbon emissions produced by food consumption were from rice, wheat, legumes, and other cereals [31]. Thus, a study on the carbon emissions of CR foods in China is very important. However, systematic and specialized research related to the carbon emissions of CR food consumption is still in its infancy. On the other hand, directly intervening into diet choices for environmental reasons alone is difficult to implement [32]. However, the health aspects of sustainable diets make shifting consumer behaviors possible [33]. The dietary structure in CR food consumption is unreasonable [29]. Wheat flour and rice represent most of the CR foods consumed, which is not in line with the principle of Chinese dietary guidelines, i.e., encouraging people to eat diverse foods. Rice and wheat flour showed the highest carbon footprint (CF) among CR foods [34]. Consumers’ desire for healthy food can help achieve a diet with low carbon emissions. Owing to the large amounts of GHG emissions from CR food consumption, changing to healthier and more sustainable diets would be of great help to achieve the low-emission goal for China. Currently, the goal of various GHG studies in the food system on a diet basis is to identify the most polluting food items or to compare dietary choices [19]. However, no research was carried out to investigate the effects of improving the dietary patterns among CR foods on carbon emissions in China.
Carbon emissions from CR foods were huge, and a sustainable CR food diet shift is more likely to be accepted compared to meat products [33]. However, systematic and specialized research about CR food consumption is still in its infancy. Therefore, the aims of the present study were to (1) quantify the carbon emissions embedded in CR food consumption based on data from a household survey, (2) analyze carbon emissions and nutrient intake of different CR food consumption patterns to identify the feasible dietary options, and (3) minimize carbon emissions of CR food consumption using a linear programming method while meeting health requirements.
2. Materials and Methods
2.1. Food Intake Data
In this study, the information related to food intake was all taken from the China Health and Nutrition Survey (CHNS) of 2004, 2006, 2009, and 2011 [35]. CHNS is an open database that includes Chinese food consumption information for all 15 provinces. The data covers more than 1900 foods consumed by 18–50-year-old adults. Overall, 24 common CR food types were recorded in the database. Finally, about 1637 households’ food consumption items were chosen according to the CR food consumption record. In accordance with the China Food Composition database [36,37], twenty-four foods were aggregated into rice, tailored wheat flour, wheat flour (second), maize, maize flour, millet, arena nada flour, mung bean, mung bean flour, azuki bean, potato, and sweet potato.
A survey was conducted between 2010–2012 to investigate the proportions of nutrients from CR foods to total dietary nutrition, and the results showed that the proportions of 10 nutrients (protein, carbohydrate, vitamin B1 (VB1), vitamin B2 (VB2), niacin (VPP), magnesium, iron, calcium, potassium, and zinc) from CR foods were over 20% individually [29]. These nutrients are used as nutritional indices, and their contents per 100 g of different kinds of CR foods are taken from the China Food Composition database [36,37]. According to the recommendations from the Chinese dietary guidelines, 12 CR foods were categorized into four groups: rice & wheat flour (G1), whole grains (G2), beans (except soybeans) (G3), and tuber food (G4). In this study, the weight and energy intake is calculated based on raw or uncooked materials. The brief information of these CR foods is shown in Table 1 and Table 2.
2.2. Food Carbon Footprint (CF) Data
The CFs of different CR foods have been illustrated by thousands of studies through the life cycle assessment (LCA) methodology. Those studies involved rice [38], wheat [39], maize [40], and potatoes [41] worldwide. However, due to the difference in life cycle boundaries and calculation methods, CF values vary significantly for the same kind of food. The CFs of nineteen kinds of CR foods including grains, beans, and root and tuber foods from cultivation to manufacture in China were investigated by Xu et al. [34] according to the life cycle assessment (LCA) method. Coarse foods, such as avenanuda, an important part of Chinese diets, were also examined in their research. Because scientific and accurate results can be gained, the data by Xu et al. [34] is adopted in this study.
2.3. K-Means Clustering Algorithms
In many previous studies [12,14,42], the average consumption of foods was usually used as the standard when setting dietary scenarios. However, a more precise method can be used to set criteria for dietary scenarios through the K-means clustering algorithm (KCA). Cluster analysis can more accurately categorize a set of data into different clusters based on similarities that can reflect their characteristics. Samples are classified into clusters that share the maximized similarity in one cluster and minimized similarity between different clusters [43]. This algorithm was first used in the dietary field by ElisabetWirfÄLt et al. [44] to explore dietary patterns in weight, demographics, and nutrition intake dimensions, and 6 food patterns were concluded. Since then, Stricker et al. [45] has used KCA to identify dietary patterns associated with two diseases. K-means clustering is more effective when dealing with large scale data [46]. In this study, KCA in the python 3.6.7 software package was used to generate different CR food consumption clusters for 1637 households. The procedure of K-means clustering is as follows: a) a chosen number, K, is set as the initial centroid number among the data objects; b) each data object is assigned to a cluster that shares the most similar features; c) the centroids of each cluster are re-calculated; d) if the algorithms are convergent, then stop; otherwise, go back to step b.
2.4. Linear Programming Models
Linear programming is a mathematical modeling technique that allows the generation of optimal solutions [47]. Linear programming models for human diets were first applied in the 1950s [48]. This mathematical method optimizes an outcome that is a linear function of several variables that can be controlled (e.g., the amount of food eaten), while subject to a number of constraints (e.g., dietary requirements) [49]. In this study, linear programming using the python 3.6.7 software package was adopted to generate optimal selections with qualified criteria to develop a diet with low carbon emissions and sufficient nutrition. One objective function and four kinds of constraints were considered in the linear programming algorithm. The diet consisted of 12 CR foods X = (x1, x2, x3,…, x12). At the same time, each CR food was characterized by 11 factors, i.e., its energy content and 10 nutrients. In this way, we can obtain a 12 × 11 matrix A. Matrix A is written as Equation (1),
where aij represents the content of the jth characterization factor in the ith CR food per kg, which is taken from the China Food Composition database [36,37].
First, the objective function was expressed as follows:
where GHGt is the sum of carbon emissions embedded in CR foods (kgCO2eq); Xi is the estimated consumption amount of food i per day (kg); and CFi is the CF of food i, which is calculated by Xu et al. [34].
The diet should be constrained by the following limitations:
● Nutrient constraints
The amounts of nutrients should be within a certain range. The upper and lower bounds of nutrient intake are set as Tolerable Upper Intake Level (UIL) and Recommended Nutrient Intake (RNI) to avoid changing radically with the CR food consumption that may lead to an unhealthy situation. Equations (3) and (4) were employed to calculate the nutrient intake of a diet according to the study of Song et al. [6]:
where Nuj is the total amount of nutrient j, and j = 2, … or 11; RNI is its recommended nutrient intake level; UIL is its tolerable upper intake level.
● Weight constraints
Consumption of each food group should also be in a certain weight range according to the dietary guidelines for Chinese residents [29]. The details of the lower and upper bounds are shown in Table 3.
The sum of all CR food weight is 250–400 g [29]. That is to say,
The weight sum of G1 is 150 g [29], which means,
The weight sum of G2 and G3 is 50–150 g [29]. That is to say,
The weight sum of G4 is 50–100 g [29], which means,
● Food type constraints
The principle of dietary guidelines for Chinese residents was to encourage people to eat more kinds of food. Thus, 12 CR foods should join the daily diet. In this study, 10% of the lower bounds are set to ensure that all 12 CR foods are covered [29]:
where for the G1 foods, i = 1, 2, or 3; for the G2 and G3 foods, j = 4, 5,…, or 10; for the G4 foods, k = 11 or 12.
● Energy constraints
Since CR foods are the main source of energy, accounting for 50%–65% of total energy [29], energy from CR foods should be constrained at the same time. Chinese adults under 65 years old are suggested to intake an average of 2200 kcal d−1 [29]. Thus, the sum of the energy from CR foods is limited to the range from 1100 kcal to 1430 kcal:
where ai1 is the energy content in the ith CR food per kg, which can be found in the China food composition database [37].
2.5. Three Scenarios
The characteristics of the current Chinese diet are unsustainable and unhealthy. Polished rice and wheat flour products containing little vitamin B, dietary fibers, or minerals occupy a large proportion of CR food consumption [29]. Lacking whole grains, beans, and tuber products may cause nutrient deficiency. Besides, a great number of studies have confirmed that the CFs of rice are much higher than those of other cereals. The dietary guidelines for Chinese residents [29] recommend that people need to eat more whole grains and tuber foods. Accordingly, this study analyzed the current consumption of 12 CR foods, and then generated different scenarios based on the characteristics of CR foods consumption by households. This article aims to research the effects of a qualified diet compared to those of the current diet. Three scenarios are developed in this study.
● Scenario 1:
The first scenario is the current diet without any constrains.
● Scenario 2:
The second scenario is the recommended diet. This diet is restrained by recommended weight, energy, nutrient intake; at least one type of food in each of the four groups (Table 3) needs to be included in the optimal diet.
● Scenario 3:
The third scenario is the optimized current diet. In this diet, the intake of CR foods is constrained by recommended weight, energy, and nutrient intake. In addition, 12 types of food were included in this diet.
3. Results
3.1. Food Amounts and Carbon Emissions of the Current Consumption
The current CR food consumption is shown in Table 4, which shows that G1 foods, as traditional staple foods, in grams, occupy the top three slots, accounting for 76.02% of the total CR food intake. In addition, G4 foods also play an important role in the Chinese diet based on food weight. However, avenanuda flour and G3 food consumption was small, less than 2g per day. According to the dietary guidelines for Chinese residents [29], foods from the four groups should be covered in Chinese daily diets from a health perspective. Thus, the 12 CR foods in this study were further assigned to the recommended groups (Table 3). The total consumption of G1 foods was 373.02g per day, which is about 2.5 times higher than the upper limit (150g per day). The results also showed that the consumption of G2 and G3 foods (whole grains and beans) was 36.66 g per day in total, far below the 50 g d−1 minimum threshold. G4 food was the only food group reaching the recommended range (50–150 g per day). This data indicated that current CR food consumption by Chinese people deviates from the dietary guidelines, implying that the current CR food consumption could lead to nutrient intake imbalance.
The carbon emissions embedded in the 12 CR foods are also shown in Table 4. The total carbon emissions produced by the 12 CR foods were 683.38 g CO2eq d−1 per capita. Furthermore, carbon emissions produced by G1 foods accounted for 92.17% of the total carbon emissions from the CR food production. The results in Table 4 also show that although G4 food consumption accounted for 16.57% of the total intake in grams, it was responsible for only 2.71% of the carbon emissions due to the lower CF of tuber foods. G2 and G3 foods have small emissions because of their slight consumption. G1 foods produced most of the total emissions. Xu et al. [34] showed that a higher consumption choice of brown rice and standard grade flour could reduce carbon emissions. However, the total consumption of G1 foods was much higher than the upper limit. Therefore, a greater consumption choice of coarse food is more appropriate. In addition, as a low carbon and healthy food type, the consumption of G4 food should be increased. However, the weight range of G4 food, according to the dietary guidelines, was 50–100 g, and the consumption of potatoes has reached 75.32 g. Therefore, sweet potatoes should be given more attention than potatoes. On the other hand, the recommended consumption of CR food was 250–400 g. Thus, reducing the consumption of CR food, especially G1 food, could be beneficial from health and environmental viewpoints.
3.2. CR Food Consumption Patterns
According to the dietary guidelines for Chinese residents, four groups of CR foods should be contained in Chinese diets each day. Thus, individual consumption of CR foods was clustered to further investigate the current situation. In this study, 4857 Chinese adults’ consumption of the 12 CR foods was clustered, and ultimately 8 clusters were developed. Centroids and consumption of the eight clusters are shown in Table 5. As for the scale of the clusters, cluster 8, which included 1768 individuals, occupied the biggest proportion. If the scale of the respondents represented the acceptance of consumption patterns, cluster 8 was the most popular. In this cluster, consumption of G1 food was high while other groups were low. Its feature was in line with the characteristic of the CR foods consumption [29], i.e., rice and wheat flour products occupy most of the staple foods. Cluster 7 had 1362 respondents, accounting for 27.94% of total respondents. In this cluster, G4 food consumption increased and G1 foods reduced significantly, compared to cluster 8. Cluster 1 ranked the third, highlighting the G1 group products, which were similar to cluster 8. However, consumption of tuber foods from cluster 1 is higher than that of the cluster 8. The proportion of interviews in clusters 3, 5, and 6 were all less than 2%, respectively. On the other hand, the number in bold in a cluster implied the highest Z-score for the group. The highest consumption was shown for G1 products in cluster 1, G2 products in cluster 5, G3 products in cluster 3, and G4 group foods in cluster 2, respectively. In addition, the G3 foods were mainly consumed by respondents in cluster 3 and cluster 6.
3.3. Carbon Emissions and Nutrients of the Eight Clusters
Carbon emissions of the eight clusters are shown in Figure 1. this data shows that the carbon emissions were significantly different. Due to high food consumption, the highest carbon emissions were from cluster 5, which was 700.37 g CO2eq. For cluster 5, the consumption of whole grains was the largest compared to other clusters, which produced 52.82% of the total carbon emissions in that pattern, while the lowest carbon emissions were from cluster 7, which was only 196.36g CO2eq. Individuals in cluster 7 consumed the fewest G1 foods and the second largest amounts of G4 foods compared to other clusters. The consumption pattern of cluster 7 should be looked at more closely, as this pattern was followed by the second most respondents. Because of its highest popularity, the consumption pattern of cluster 8 is also worthy of attention. This cluster produced the third least carbon emissions per day. As for the carbon emissions source, G1 was the most important carbon emissions source for all the clusters except cluster 5. Moreover, carbon emissions from beans can hardly be found in any clusters except 3 and 6, due to their deficiencies in bean consumption.
Energy and ten nutrients, mainly from CR foods, were chosen to evaluate the current consumption models. The different nutrient intakes of the eight clusters are shown in Table 6. Numbers in bold in the table mean that the nutrients reach the recommended standard in each cluster. The results show that clusters 7, 8, and 1, which accounted for most of the individuals, were severely insufficient in nearly all the nutrients chosen. These results indicate that current CR food intake behavior is unhealthy for about 80% of Chinese individuals. On the other hand, the consumption patterns of clusters 2, 3, and 4 reached nearly all the recommended goals for the energy and 10 nutrients. The results also show that cluster 5 reached nearly all the nutrients standards, but exceeded the recommended upper limits of energy, carbohydrates, and magnesium, because it featured the highest consumption of G2 foods.
3.4. Optimized Dietary Scenarios
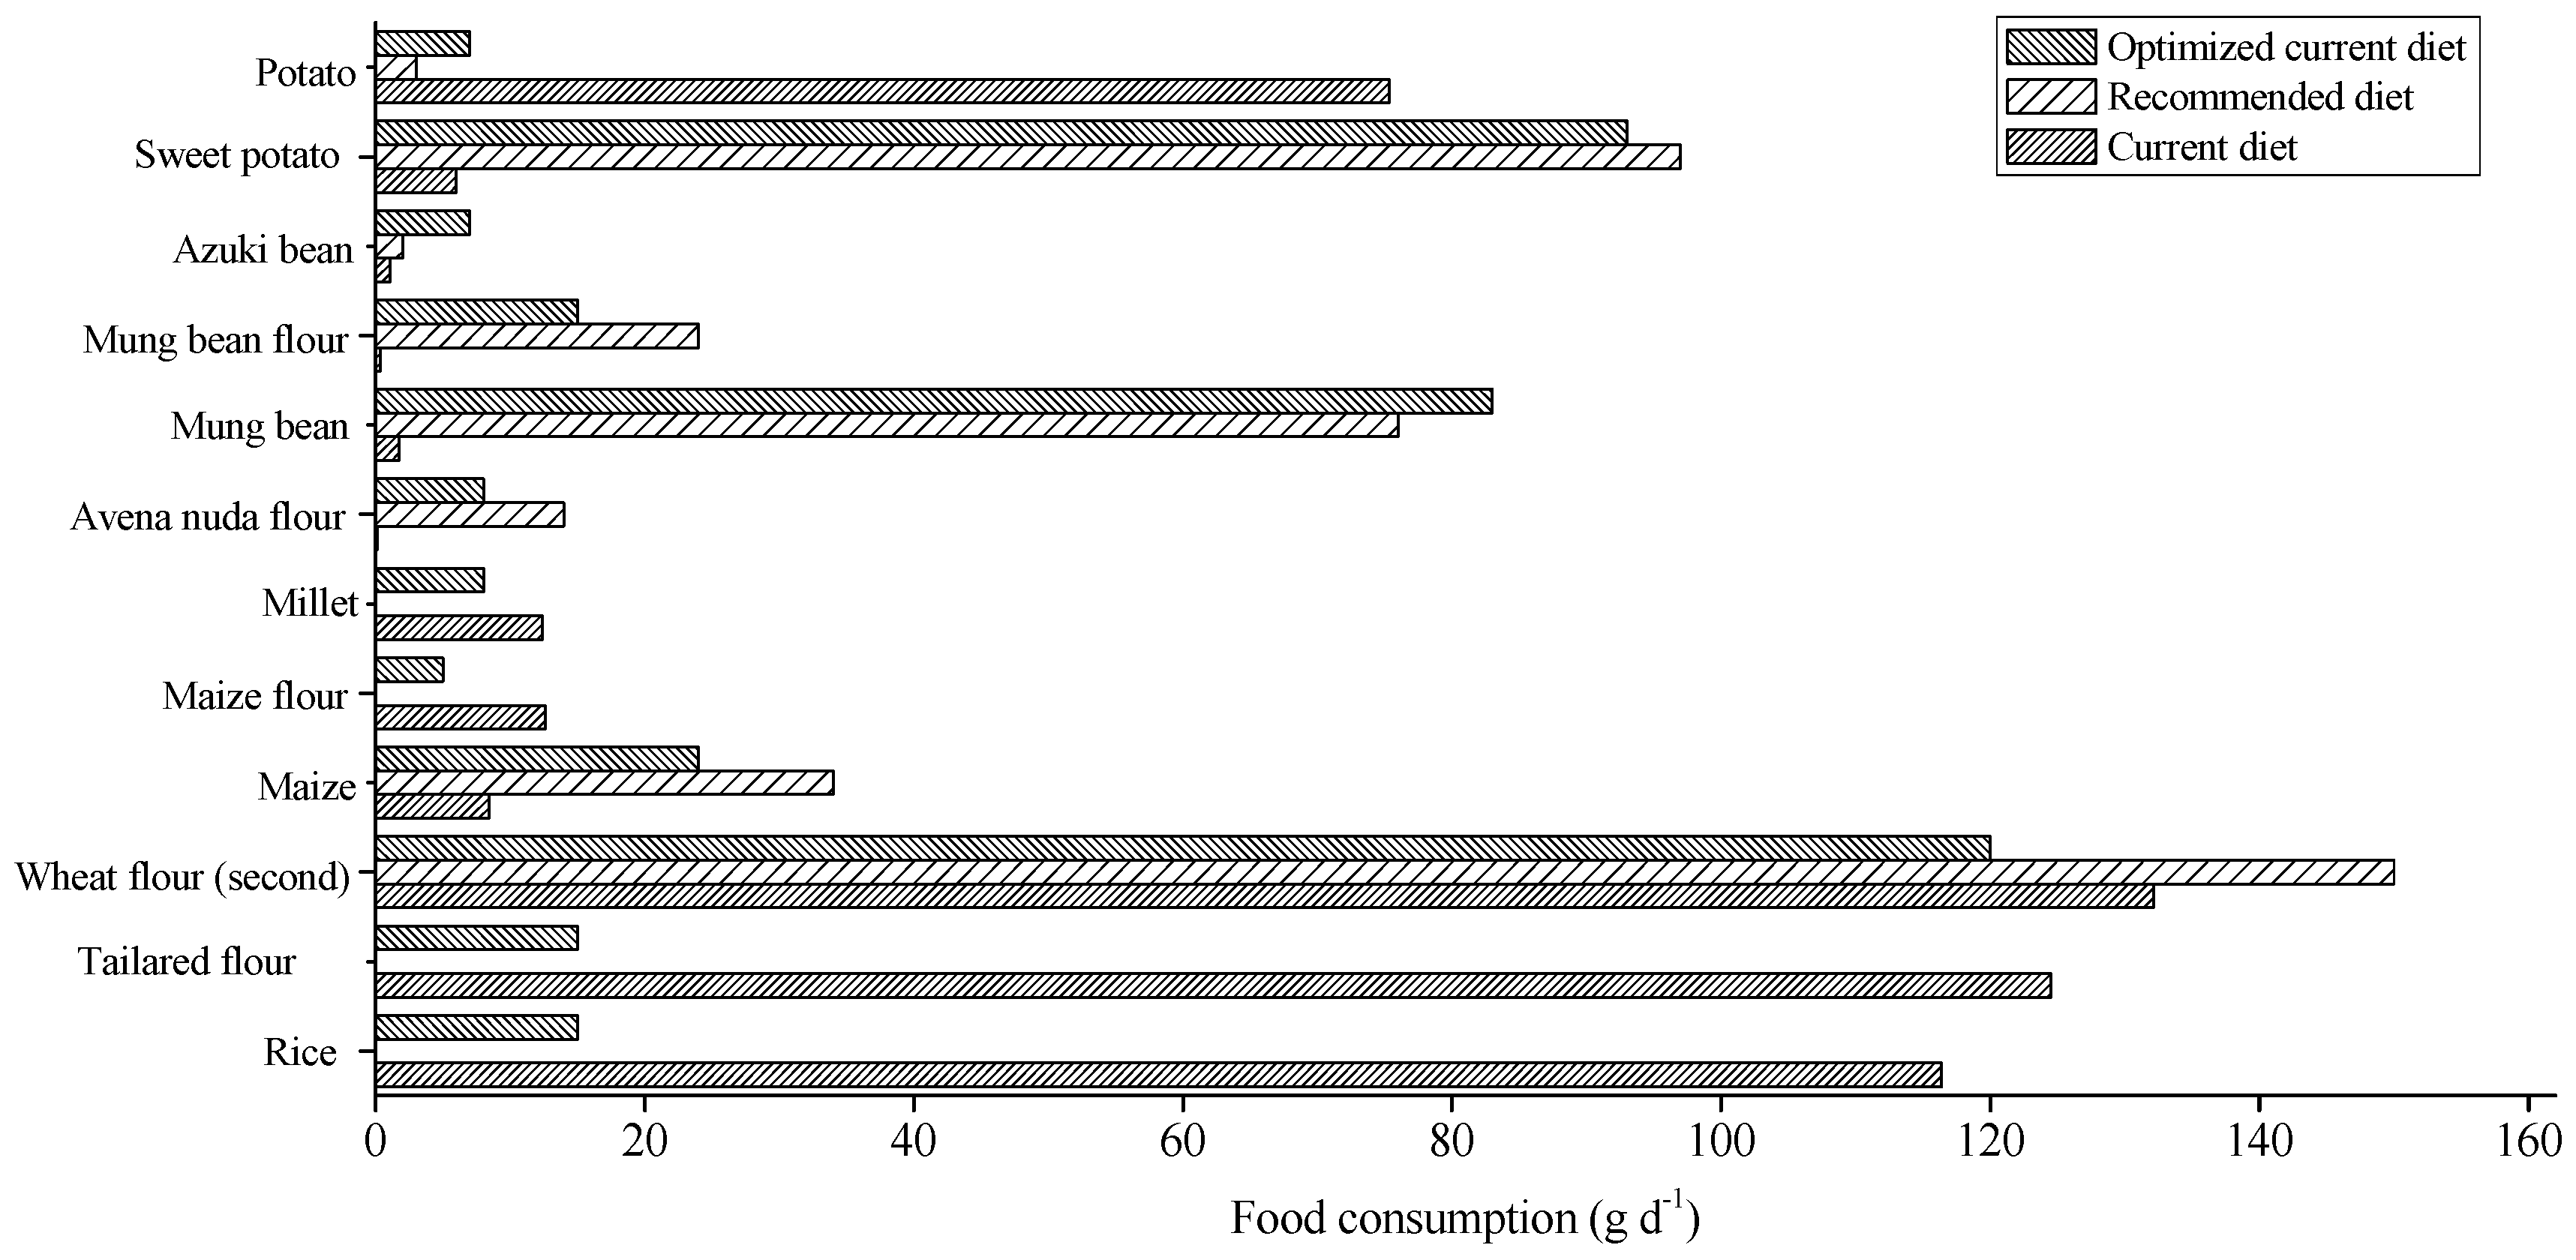
Linear programming was adopted to qualify sustainable diets, which were constrained by healthy and environment friendly standards. Recommended diet and optimized current diet scenarios have been developed to compare with the current dietary pattern. The CR food consumption of three diets is shown in Figure 2.
The recommended diet was strictly constrained and produced about 358.1 g CO2eq d−1 each person. The recommended diet could reduce 44.73% of carbon emissions compared to the average current diet. It showed that eight types of food in four groups were covered in the recommended diet model. In G1 foods, due to their lower CF, only wheat flour (second) was chosen among the three foods. For the G2 foods, although the total weight only slightly increased from 33.5 g to 48 g, the proportion of the four foods (maize, maize flour, millet, and avenanuda flour) changed significantly, and maize flour and millet consumption were completely removed. In addition, G3 foods are recommended to be eaten 102 g d−1 from the current 3.17 g to ensure the protein content. Moreover, 100 g d−1 of G4 foods was a qualifying element in this scenario. However, it should be noted that due to their higher calcium content, sweet potatoes should be increased to occupy 97% of the total G4 foods. During the optimization procedure, calcium was the key nutritional factor that affected the consumption patter of G4 foods. On the other hand, the optimized current diet was set according to the current diet. In this scenario, 10% of the lower bounds were set to ensure that all 12 CR foods are covered. The consumption pattern of the 12 CR foods in the current optimized diet is shown in Figure 2, and carbon emissions could be reduced to 387.2 gCO2eq d−1. The major difference between the recommended diet and the current optimized diet is that rice, tailored flour, maize flour, and millet increase to their own minimum limits in the latter pattern. Although a current optimized diet that includes 12 CR foods every day is too radical to achieve, it is in line with the principle of the dietary guidelines for Chinese residents, i.e., more varieties of food should be consumed. Thus, it could be healthier to reduce the risk of insufficient nutrients, although this perspective was not considered in this research. In addition, the optimized diet model could be achieved within a short period of time, such as one week.
4. Discussion
Total carbon emissions produced by the 12 CR foods were 683.38 g CO2eq d−1 per capita. Due to differences in data sources and types of selected foods, outcomes obtained were usually different from one study to another. The carbon emissions in the current study are higher than those of many previous studies in China [50,51]. Daily Chinese diets, covering 22 kinds of foods, were calculated by using the weighted average CF for each food category [50]. The results showed that dietary carbon emission was 0.9 kg CO2eq per day per capita, and about 25% of total carbon emissions were from cereal and bean foods. Furthermore, food-related carbon emissions of Chinese urban households were investigated by using an input-output model, and the results showed that cereal consumption per capita produced 205.4 g CO2eq, accounting for 17.2% of the total carbon emissions embodied in household food consumption [51]. However, the results of this study were lower than those of the study by Song et al. [31], which showed that carbon emissions embedded in food consumption per capita were about 1170 g CO2eq. A comparison of diet optimizations to reduce GHG emissions in the UK, France, Spain, Sweden, New Zealand, and China was carried out, and the results showed that consumption patterns of meat are the main topic of research [6]. CR food diets in China were responsible for an annual total of 341.9 Mt CO2eq in this study. In addition, according to the studies [31,50,51], CR foods are responsible for about 20%–40% of total carbon emissions embodied in household food consumption. Therefore, there is great potential to reduce the carbon emissions from CR foods.
The results in Table 5 and Table 6, and Figure 1 show that it is difficult to choose one popular consumption pattern that is healthy and has a low CF. Clusters 1, 7, and 8 produced smaller emissions. However, these patterns are insufficient in nearly all the nutrients. The major function of a diet is to provide nutrients. In addition, levels of most of the nutrients from clusters 2, 3, and 4 were within the recommended ranges. Further, the three patterns also produced smaller emissions than the average CR consumption. Thus, these pattern clusters should be paid more attention to. However, they were applied by fewer respondents, especially in cluster 3. By comparing the results in Table 4, the total consumption of CR foods should be reduced from 490g to 400g, and total consumption of G1 foods also should be reduced to 150g. The traditional Chinese diet and Mediterranean diet have some characteristics in common, i.e., both include a high consumption of grains [52]. However, the unrefined cereals that play an important role in the Mediterranean diet make it healthier and create fewer environmental impacts [15,32,53,54]. With economic development, refined rice and wheat foods are often preferred by most people due to better mouth feel (such as the pattern in cluster 8). However, there are few micro-nutrients in refined grains. Whole grains and beans should be consumed to supply nutrients to preserve health. In addition, people should be mindful of over-consuming carbohydrates, which occurred in the pattern of cluster 5. A study by Park et al. [55] showed that when carbohydrate intake provided over 70% of energy, the consumption was highly associated with diabetes and low high-density lipoprotein cholesterol in Korean females. Moreover, a higher carbohydrate intake could be associated with mortality [56] and an increased risk of head and neck cancer [57].
Comparison between consumption patterns of the 8 clusters and the two optimized diets showed that a significant structural difference exists. Cluster 3 had the most similar consumption pattern to the optimized diets. However, consumption of G3 and G4 was still different between cluster 3 and the two optimized diets. This result implies that a significant change in Chinese diets should be made to achieve environmental and health goals. Linear programming could help develop diets with lower impacts than diet scenario studies [20,22]. On the other hand, in this research, the consumption of G3 increased significantly in the two optimized diets. MacDiarmid et al. [58] also showed that optimal diets generally have a tendency for higher legume intake, such as a 50% increase in the UK. In this research, only the CR foods, rather than all foods consumed in China, were considered in the optimized diet. However, nutrient intake was still reasonable when all foods were considered, because the optimized diet was set in accordance with the principle of dietary guidelines for Chinese residents, i.e., the weight constraint of different groups of food was considered. A sustainable dietary shift was necessary for GHG reduction [2]. The potential to reduce dietary carbon emissions depends on the carbon intensity of current diets and of the production of the dietary ingredients. Due to the relatively low GHG intensity of current Chinese diets, the per capita mitigation potential is lower than that in developed economies [6]. The current study has shown that by optimizing CR food consumption, a large amount of carbon emissions could also be reduced.
5. Conclusions
CR foods, which are the most important energy source in China, are essential parts of the daily Chinese diet. However, their carbon emission is often neglected because animal-based foods are commonly considered to be more efficient to reduce GHG emissions. The carbon emissions caused by current CR food consumption were studied in this paper. Total carbon emissions produced by the 12 CR foods were 683.38 g CO2eq d−1 per capita. Furthermore, carbon emissions produced by G1 foods accounted for 92.17% of the total carbon emissions from CR food production. In addition, according to the characteristics of CR foods consumption, 4857 individuals were divided into eight clusters. Clusters 1, 7, and 8 produced smaller emissions and were applied by more than 80% of the total respondents. However, the three patterns are insufficient in nearly all the nutrients. Clusters 2, 3, and 4 provided the most nutrients and produced smaller emissions than the average CR consumption. However, the three patterns were applied by many fewer respondents. It is difficult to choose one popular consumption pattern that is of low carbon and nutrient sufficient. Linear programming was used to qualify sustainable diets. The recommended diet produced about 358.1 g CO2eq d−1 each person, and reduced 44.73% of carbon emissions compared to the average current diet. The optimized current diet produced about 387.2 g CO2eq d−1 each person, and reduced 40.24% of carbon emissions. Reduction of G1 foods and increase of G3 foods were the focus of dietary structure changes for CR food consumption, from environmental and health viewpoints.
In this study, sustainable CR food diets were proposed. However, food choices of consumers are influenced by many factors, such as consumer culture, nutritional knowledge, food price, product enjoyment, etc. Future consumer focused work should pay attention to research on policy guidance for the low carbon consumption behavior of residents. The nutrient and health aspects of food could be advertised to encourage people to consume more food with lower environmental impacts. Information on news networks should be intensified to popularize nutritional knowledge about coarse foods, and thus to construct a healthy and environmentally sound conception of consumption. Moreover, price is one of the key factors in food choice, and the effects of price measures on consumption of environmentally sustainable food options should be studied. In addition, the taste and texture of food are also important influencing factors. Although some coarse foods are healthier, consumers still show preference for rice and tailored flour due to their better taste. Thus, more incentive mechanisms should be established to encourage nutritionists to devote themselves to improving coarse food science and technology.
In this study, only CR foods were analyzed. As substitutes within the same food group are more likely to be accepted by residents, more food groups, such as animal based foods and vegetables, should be studied in the future. Therefore, the development of a richer local food CF database for unique food sources is urgent. In addition, the most significant role of food is to provide nutrition and energy. A sustainable diet should be evaluated on nutritional quality. This study used nutrient constraints that considered the characteristics of the Chinese diet. To evaluate the carbon emissions driven by other food groups in other regions, nutritional constraint models should be food-group specific and locally characterized. The carbon emissions produced by diet were considered in the current study, but more diet-associated environmental factors, such as energy, water, and biodiversity, should be considered in future work.
Author Contributions
Conceptualization, Z.X. and Q.C.; data curation, H.C., R.Z., A.X.; writing—original draft preparation, X.Y.; writing—review and editing, Z.Z.
Funding
This research was funded by the Fujian Provincial Social Science Research Base for Ecological Civilization (KXJD1815A; FJ2018JDZ062); the Guangdong Planning Projects of Philosophy and Social Science (GD16YGL03); Natural Science Foundation of Guangdong Province (2017A030313395); Fujian Provincial Social Science Research Base for Ecological Civilization (K81NIF01A); the Research on Humanities and Social Sciences of Ministry of Education (19YJCZH203), and the China Postdoctoral Science Foundation (2016M602476).
Conflicts of Interest
The authors declare no conflict of interest.
References
- Garnett, T. Where are the best opportunities for reducing greenhouse gas emissions in the food system (including the food chain)? Food Policy 2011, 36, S23–S32. [Google Scholar] [CrossRef]
- Li, H.; Wu, T.; Wang, X.; Qi, Y. The greenhouse gas footprint of China’s food system: An analysis of recent trends and future scenarios. J. Ind. Ecol. 2016, 20, 803–817. [Google Scholar] [CrossRef]
- Clune, S.; Crossin, E.; Verghese, K. Systematic review of greenhouse gas emissions for different fresh food categories. J. Clean. Prod. 2017, 140, 766–783. [Google Scholar] [CrossRef]
- Ding, N.; Liu, J.; Kong, Z.; Yan, L.; Yang, J. Life cycle greenhouse gas emissions of Chinese urban household consumption based on process life cycle assessment: Exploring the critical influencing factors. J. Clean. Prod. 2019, 210, 898–906. [Google Scholar] [CrossRef]
- Xia, L.; Ti, C.; Li, B.; Xia, Y.; Yan, X. Greenhouse gas emissions and reactive nitrogen releases during the life-cycles of staple food production in China and their mitigation potential. Sci. Total Environ. 2016, 556, 116–125. [Google Scholar] [CrossRef]
- Song, G.; Li, M.; Fullana-i-Palmer, P.; Williamson, D.; Wang, Y. Dietary changes to mitigate climate change and benefit public health in China. Sci. Total Environ. 2017, 577, 289–298. [Google Scholar] [CrossRef]
- Benbi, D.K. Carbon footprint and agricultural sustainability nexus in an intensively cultivated region of Indo-Gangetic Plains. Sci. Total Environ. 2018, 644, 611–623. [Google Scholar] [CrossRef]
- Corrado, S.; Luzzani, G.; Trevisan, M.; Lamastra, L. Contribution of different life cycle stages to the greenhouse gas emissions associated with three balanced dietary patterns. Sci. Total Environ. 2019, 660, 622–630. [Google Scholar] [CrossRef] [PubMed]
- Metz, B.; Davidson, O.; Bosch, P.; Dave, R.; Meyer, L. Climate Change 2007: Mitigation of Climate Change; Cambridge University Press: London, UK, 2007. [Google Scholar]
- Kim, J.E. Fostering behavior change to encourage low-carbon food consumption through community gardens. Int. J. Urban Sci. 2017, 21, 364–384. [Google Scholar] [CrossRef]
- Ridoutt, B.G.; Hendrie, G.A.; Noakes, M. Dietary strategies to reduce environmental impact: A critical review of the evidence base. Adv. Nutr. 2017, 8, 933–946. [Google Scholar] [CrossRef]
- Payne, C.L.R.; Scarborough, P.; Cobiac, L. Do low-carbon-emission diets lead to higher nutritional quality and positive health outcomes? A systematic review of the literature. Public Health Nutr. 2016, 19, 2654–2661. [Google Scholar] [CrossRef] [PubMed]
- González-García, S.; Esteve-Llorens, X.; Moreira, M.T.; Feijoo, G. Carbon footprint and nutritional quality of different human dietary choices. Sci. Total Environ. 2018, 644, 77–94. [Google Scholar] [CrossRef]
- Pairotti, M.B.; Cerutti, A.K.; Martini, F.; Vesce, E.; Padovan, D.; Beltramo, R. Energy consumption and GHG emission of the Mediterranean diet: A systemic assessment using a hybrid LCA-IO method. J. Clean. Prod. 2015, 103, 507–516. [Google Scholar] [CrossRef]
- Van Dooren, C.; Marinussen, M.; Blonk, H.; Aiking, H.; Vellinga, P. Exploring dietary guidelines based on ecological and nutritional values: A comparison of six dietary patterns. Food Policy 2014, 44, 36–46. [Google Scholar] [CrossRef]
- Hyland, J.J.; McCarthy, M.B.; Henchion, M.; McCarthy, S.N. Dietary emissions patterns and their effect on the overall climatic impact of food consumption. Int. J. Food Sci. Technol. 2017, 52, 2505–2512. [Google Scholar] [CrossRef]
- Veeramani, A.; Dias, G.; Kirkpatrick, S. Carbon footprint of dietary patterns in Ontario, Canada: A case study based on actual food consumption. J. Clean. Prod. 2017, 162, 1398–1406. [Google Scholar] [CrossRef]
- Ridoutt, B.; Hendrie, G.; Noakes, M. Dietary strategies to reduce environmental impact must be nutritionally complete. J. Clean. Prod. 2017, 152, 26–27. [Google Scholar] [CrossRef]
- Meier, T.; Christen, O. Environmental impacts of dietary recommendations and dietary styles: Germany as an example. Environ. Sci. Technol. 2012, 47, 877–888. [Google Scholar] [CrossRef]
- Dooren, C.V. A review of the use of Linear Programming to optimize diets, nutritiously, economically and environmentally. Front. Nutr. 2018, 5, 48. [Google Scholar] [CrossRef] [PubMed]
- Darmon, N.; Rambeloson, Z.J.; Ferguson, E.F. Linear programming can help identifying practical solutions to improve the nutritional quality of food aid in France. FASEB J. 2007, 21, A1048–A1049. [Google Scholar]
- Van Dooren, C.; Tyszler, M.; Kramer, G.F.; Aiking, H. Combining Low Price, Low Climate Impact and High Nutritional Value in One Shopping Basket through Diet Optimization by Linear Programming. Sustainability 2015, 7, 12837–12855. [Google Scholar] [CrossRef]
- Gephart, J.A.; Davis, K.F.; Emery, K.A.; Leach, A.M.; Galloway, J.N.; Pace, M.L. The environmental cost of subsistence: Optimizing diets to minimize footprints. Sci. Total Environ. 2016, 553, 120–127. [Google Scholar] [CrossRef] [PubMed]
- Vieux, F.; Darmon, N.; Touazi, D.; Soler, L.G. Greenhouse gas emissions of self-selected individual diets in France: Changing the diet structure or consuming less? Ecol. Econ. 2012, 75, 91–101. [Google Scholar] [CrossRef]
- Biesbroek, S.; Bueno-de-Mesquita, H.B.; Peeters, P.H.M.; Verschuren, W.M.; van der Schouw, Y.T.; Tyszler, M.; Temme, E.H. Reducing our environmental footprint and improving our health: Greenhouse gas emission and land use of usual diet and mortality in EPIC-NL: A prospective cohort study. Environ. Health-Glob. 2014, 13, 27. [Google Scholar] [CrossRef] [PubMed]
- Leroy, F.; Praet, I. Meat traditions. The co-evolution of humans and meat. Appetite 2015, 90, 200–211. [Google Scholar] [CrossRef] [PubMed]
- Macdiarmid, J.I.; Douglas, F.; Campbell, J. Eating like there’s no tomorrow: Public awareness of the environmental impact of food and reluctance to eat less meat as part of a sustainable diet. Appetite 2016, 96, 487–493. [Google Scholar] [CrossRef] [PubMed]
- NBS (National Bureau of Statistics of the People’s Republic of China). China Statistical Yearbook. Available online: http://www.stats.gov.cn/tjsj/ndsj/ (accessed on 20 March 2019).
- CNS (Chinese Nutrition Society). The Dietary Guidelines for Chinese Residents. 2016. Available online: http://www.cnsoc.org/index.html (accessed on 26 November 2018).
- Batis, C.; Sotres-Alvarez, D.; Gordon-Larsen, P.; Mendez, M.A.; Adair, L.; Popkin, B. Longitudinal analysis of dietary patterns in Chinese adults from 1991 to 2009. Br. J. Nutr. 2014, 111, 1441–1451. [Google Scholar] [CrossRef] [PubMed]
- Song, G.; Li, M.; Semakula, H.M.; Zhang, S. Food consumption and waste and the embedded carbon, water and ecological footprints of households in China. Sci. Total Environ. 2015, 529, 191–197. [Google Scholar] [CrossRef] [PubMed]
- Tukker, A.; Goldbohm, R.; De Koning, A.; Verheijden, M.; Kleijn, R.; Wolf, O.; Pérez-Domínguez, I.; Rueda-Cantuche, J.M. Environmental impacts of changes to healthier diets in Europe. Ecol. Econ. 2011, 70, 1776–1788. [Google Scholar] [CrossRef]
- Hoek, A.C.; Pearson, D.; James, S.W.; Lawrence, M.A.; Friel, S. Shrinking the food-print: A qualitative study into consumer perceptions, experiences and attitudes towards healthy and environmentally friendly food behaviours. Appetite 2017, 108, 117–131. [Google Scholar] [CrossRef] [PubMed]
- Xu, Z.; Xu, W.; Peng, Z.; Yang, Q.; Zhang, Z. Effects of different functional units on carbon footprint values of different carbohydrate-rich foods in China. J. Clean. Prod. 2018, 198, 907–916. [Google Scholar] [CrossRef]
- CHNS. China Health and Nutrition Survey. 2004, 2006, 2009, 2011. Available online: https://www.cpc.unc.edu/projects/china (accessed on 26 November 2018).
- Yang, Y.X. China Food Composition, 1st ed.; Peking University Medical Press: Beijing, China, 2004. [Google Scholar]
- Yang, Y.X.; Wang, G.Y.; Pan, X. Chinese Food Ingredients; Peking University Press: Beijing, China, 2009. [Google Scholar]
- Blengini, G.A.; Busto, M. The life cycle of rice: LCA of alternative agri-food chain management systems in Vercelli (Italy). J. Environ. Manag. 2009, 90, 1512–1522. [Google Scholar] [CrossRef] [PubMed]
- Williams, A.G.; Audsley, E.; Sandars, D.L. Environmental burdens of producing bread wheat, oilseed rape and potatoes in England and Wales using simulation and system modelling. Int. J. Life Cycle Assess. 2010, 15, 855–868. [Google Scholar] [CrossRef]
- González, A.D.; Frostell, B.; Carlsson-Kanyama, A. Protein efficiency per unit energy and per unit greenhouse gas emissions: Potential contribution of diet choices to climate change mitigation. Food Policy 2011, 36, 562–570. [Google Scholar] [CrossRef]
- Webb, J.; Williams, A.G.; Hope, E.; Evans, D.; Moorhouse, E. Do foods imported into the UK have a greater environmental impact than the same foods produced within the UK? Int. J. Life Cycle Assess. 2013, 18, 1325–1343. [Google Scholar] [CrossRef]
- Heller, M.C.; Keoleian, G.A. Greenhouse gas emission estimates of US dietary choices andfood loss. J. Ind. Ecol. 2015, 19, 391–401. [Google Scholar] [CrossRef]
- Kim, K.; Ahn, H. A recommender system using GA K-means clustering in an online shopping market. Expert Syst. Appl. 2008, 34, 1200–1209. [Google Scholar] [CrossRef]
- Wirfält, A.K.E; Jeffery, R.W. Using Cluster Analysis to Examine Dietary Patterns. J. Am. Diet. Assoc. 1997, 97, 272–279. [Google Scholar]
- Stricker, M.D.; Onland-Moret, N.C.; Boer, J.M.A.; Van Der Schouw, Y.T.; Verschuren, W.M.M.; May, A.M.; Peeters, P.H.M.; Beulens, J.W.J. Dietary patterns derived from principal component-and k-means cluster analysis: Long-term association with coronary heart disease and stroke. Nutr. Metab. Cardiovasc. Dis. 2013, 23, 250–256. [Google Scholar] [CrossRef]
- Zhao, W.; Ma, H.; He, Q. Parallel k-means clustering based on MapReduce. 2009. Available online: https://link.springer.com/chapter/10.1007%2F978-3-642-10665-1_71 (accessed on 26 November 2018).
- Dantzig, G.; Thapa, M. Linear Programming 1: Introduction; Springer: New York, NY, USA, 1997. [Google Scholar]
- Smith, V.E. Linear Programming Models for the Determination of Palatable Human Diets. J. Farm. Econ. 1959, 41, 272–283. [Google Scholar] [CrossRef]
- Macdiarmid, J.I.; Kyle, J.; Horgan, G.; Loe, J.; Fyfe, C.; Johnstone, A.; McNeill, G. Livewell: A Balance of Healthy and Sustainable Food Choices; WWF, Rowett Institute of Nutrition and Health: Aberdeen, UK, 2011; p. 64. [Google Scholar]
- Xu, X.; Lan, Y. A comparative study on carbon footprints between plant-and animal-based foods in China. J. Clean. Prod. 2016, 112, 2581–2592. [Google Scholar] [CrossRef]
- Feng, W.; Cai, B.; Zhang, B. A bite of China: Food consumption and carbon emission from 1992 to 2007. China Econ. Rev. 2016. [Google Scholar] [CrossRef]
- Woo, J.; Cheung, B.; Ho, S.; Sham, A.; Lam, T.H. Influence of dietary pattern on the development of overweight in a Chinese population. Eur. J. Clin. Nutr. 2008, 62, 480–487. [Google Scholar] [CrossRef] [PubMed]
- Trichopoulou, A.; Bamia, C.; Trichopoulos, D. Anatomy of health effects of Mediterranean diet: Greek EPIC prospective cohort study. BMJ-Br. Med. J. 2009, 338, b2337. [Google Scholar] [CrossRef] [PubMed]
- Wilson, N.; Nghiem, N.; Mhurchu, C.N.; Eyles, H.; Baker, M.G.; Blakely, T. Foods and dietary patterns that are healthy, low-cost, and environmentally sustainable: A case study of optimization modeling for New Zealand. PLoS ONE 2013, 8, e59648. [Google Scholar] [CrossRef] [PubMed]
- Park, S.H.; Lee, K.S.; Park, H.Y. Dietary carbohydrate intake is associated with cardiovascular disease risk in Korean: Analysis of the third Korea National Health and Nutrition Examination Survey (KNHANES III). Int. J. Cardiol. 2010, 139, 234–240. [Google Scholar] [CrossRef] [PubMed]
- Dehghan, M.; Mente, A.; Zhang, X.; Swaminathan, S.; Li, W.; Mohan, V.; Iqbal, R.; Kumar, R.; Rosengren, A.; Amma, L.; et al. Associations of fats and carbohydrate intake with cardiovascular disease and mortality in 18 countries from five continents (PURE): A prospective cohort study. Lancet 2017, 390, 2050–2062. [Google Scholar] [CrossRef]
- Arthur, A.E.; Goss, A.M.; Wahnefried, W.D.; Mondul, A.M.; Fontaine, K.R.; Chen, Y.T.; Carroll, W.R.; Spencer, S.A.; Rogers, L.Q.; Rozek, L.S.; et al. Higher carbohydrate intake is associated with increased risk of all-cause and disease-specific mortality in head and neck cancer patients: Results from a prospective cohort study. Int. J. Cancer 2018, 143, 1105–1113. [Google Scholar] [CrossRef]
- Macdiarmid, J.I.; Kyle, J.; Horgan, G.W.; Loe, J.; Fyfe, C.; Johnstone, A.; McNeill, G. Sustainable diets for the future: Can we contribute to reducing greenhouse gas emissions by eating a healthy diet? Am. J. Clin. Nutr. 2012, 96, 632–639. [Google Scholar] [CrossRef] [PubMed]
Figure 1.
Emissions (g CO2eq per day) from each cluster.
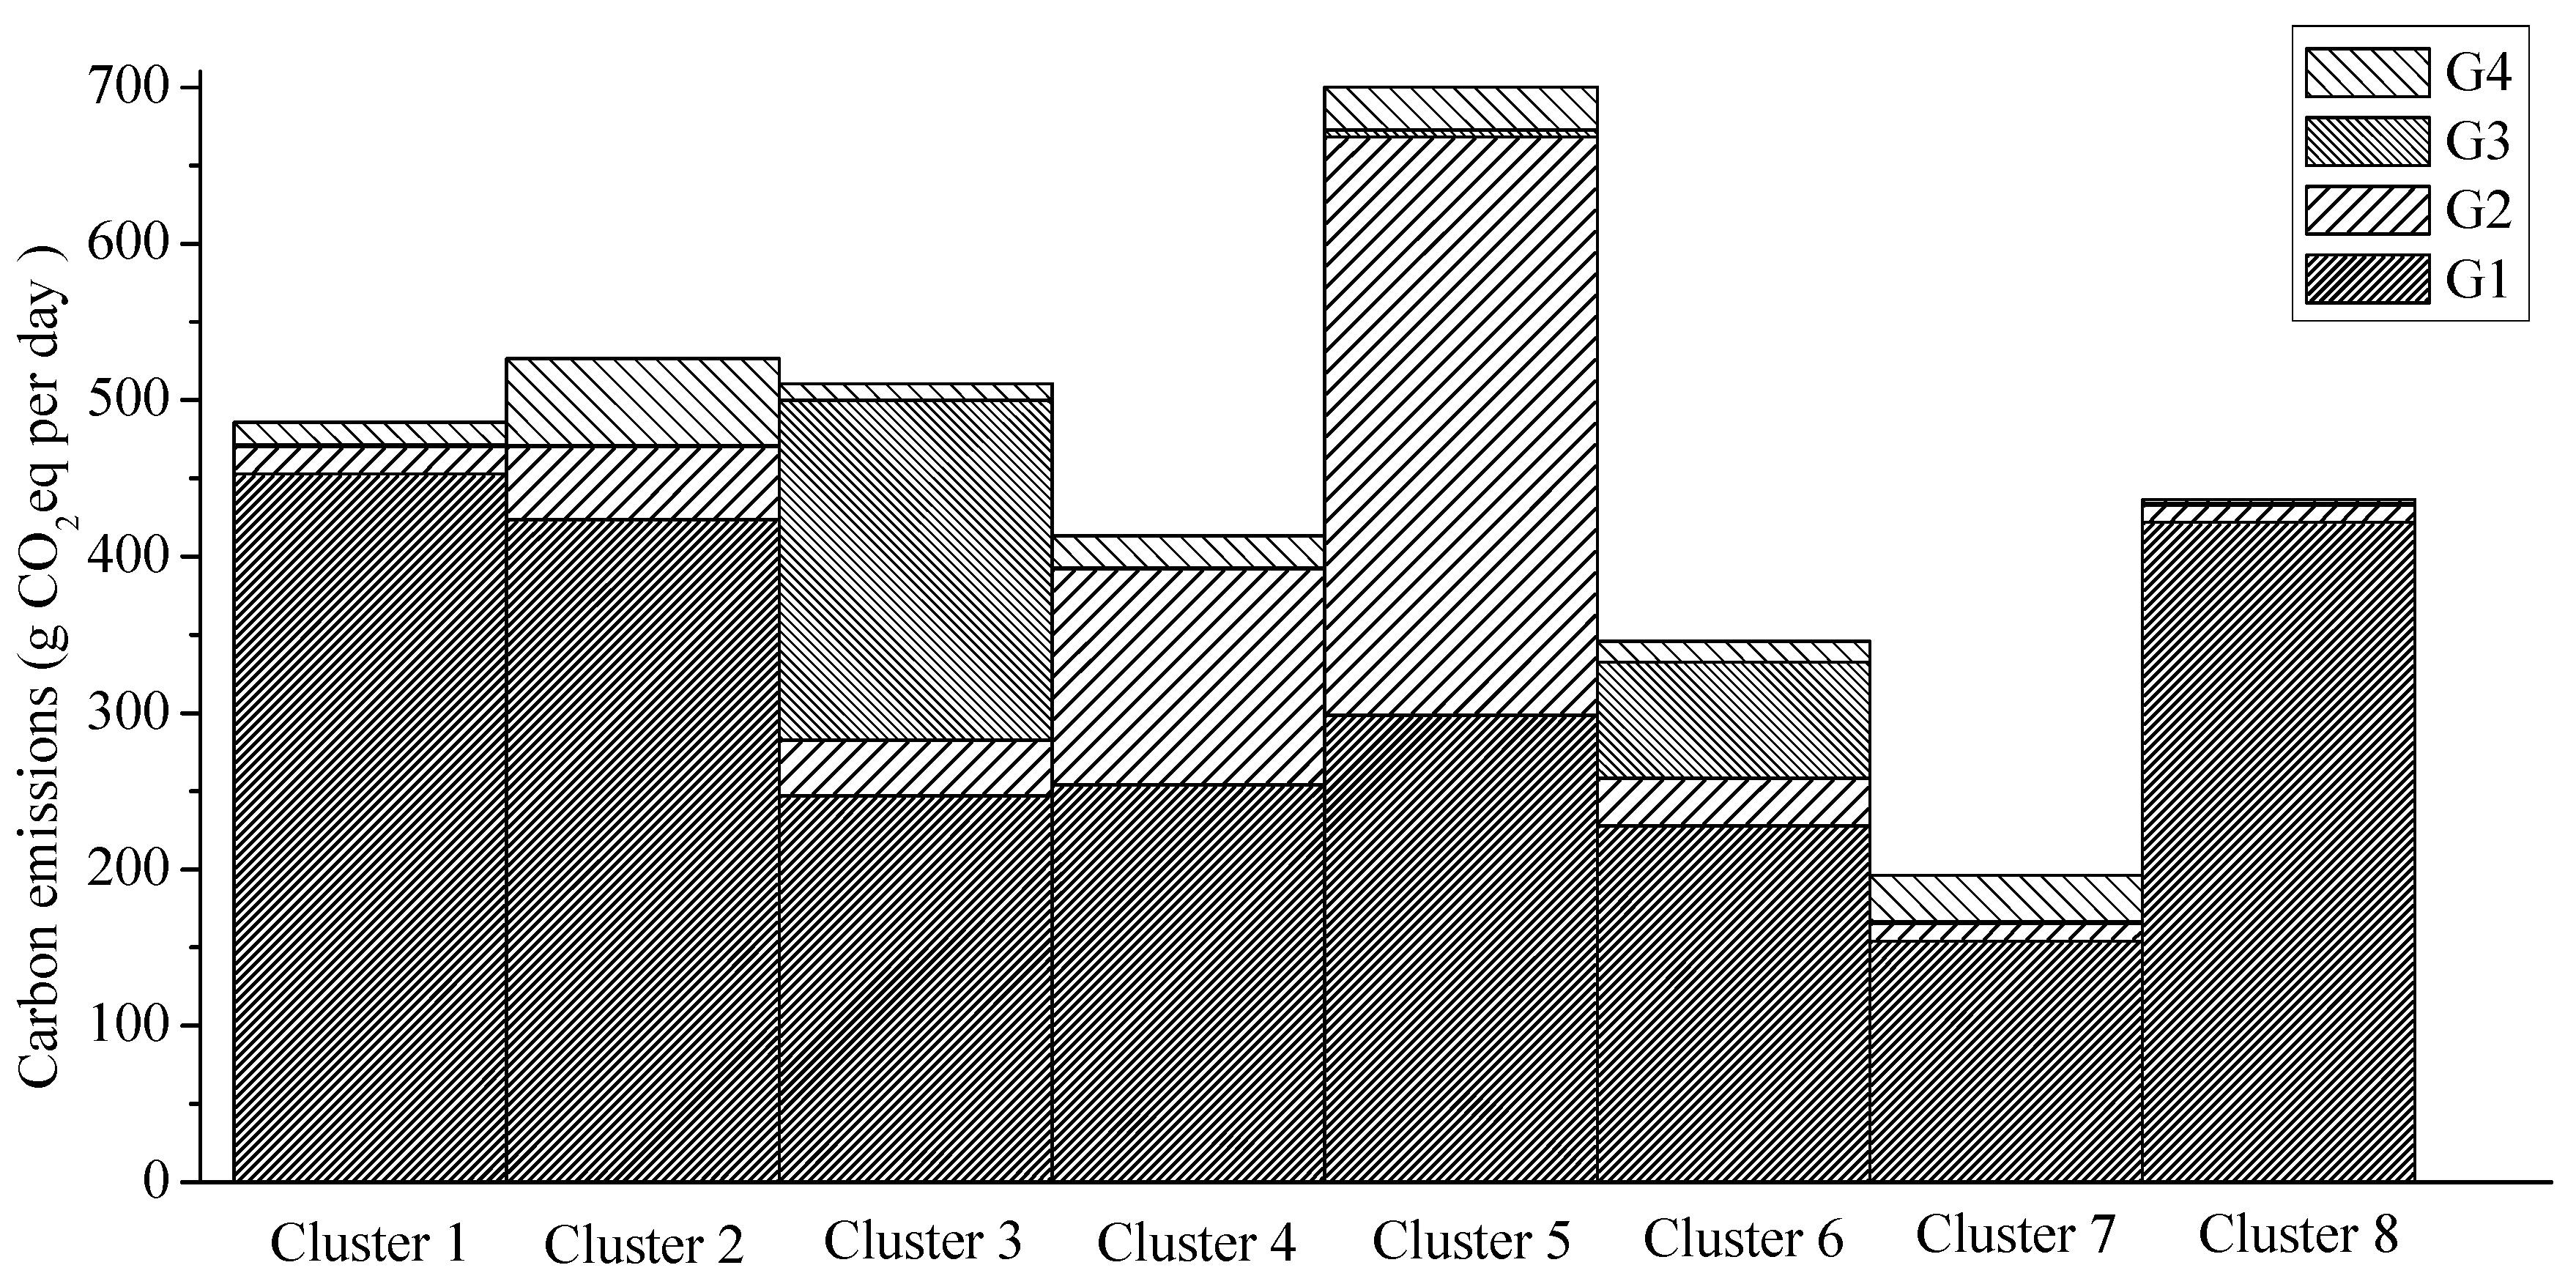
Figure 2.
CR food consumption of three diets.

Table 1.
The carbon footprint (CF), energy, protein, carbohydrate, and vitamins content of these carbohydrate-rich (CR) foods per 100g.
Table 1.
The carbon footprint (CF), energy, protein, carbohydrate, and vitamins content of these carbohydrate-rich (CR) foods per 100g.
| Groups | Foods | GHG (kg CO2eq) 1 | Energy (kcal) 2 | Protein (g) 2 | Carbohydrate (g) 2 | VB1(mg) 2 | VB2 (mg) 2 | VPP (mg) 2 |
|---|---|---|---|---|---|---|---|---|
| G1 | Rice | 0.290 | 344 | 8.6 | 76.4 | 0.11 | 0.07 | 1.6 |
| Tailored flour | 0.122 | 350 | 10.3 | 74.6 | 0.17 | 0.06 | 2.0 | |
| Wheat flour (second) | 0.106 | 349 | 10.4 | 74.3 | 0.15 | 0.08 | 2.0 | |
| G2 | Maize | 0.059 | 335 | 8.7 | 66.6 | 0.21 | 0.13 | 2.5 |
| Maize flour | 0.103 | 340 | 8.1 | 69.6 | 0.26 | 0.09 | 2.3 | |
| Millet | 0.106 | 358 | 9.0 | 73.5 | 0.33 | 0.10 | 1.5 | |
| Avenanuda flour | 0.192 | 385 | 12.2 | 67.8 | 0.39 | 0.04 | 3.9 | |
| G3 | Mung bean | 0.121 | 316 | 21.6 | 55.6 | 0.25 | 0.11 | 2.0 |
| Mung bean flour | 0.127 | 330 | 20.8 | 55.0 | 0.45 | 0.12 | 0.7 | |
| Azuki bean | 0.117 | 309 | 20.2 | 55.7 | 0.16 | 0.11 | 2.0 | |
| G4 | Potato | 0.022 | 76 | 2.0 | 16.5 | 0.08 | 0.04 | 1.1 |
| Sweet potato | 0.027 | 99 | 1.1 | 23.1 | 0.04 | 0.04 | 0.6 |
Table 2.
The mineral content of these CR foods per 100g.
| Groups | Foods | Magnesium (mg) 1 | Iron (mg) 1 | Zinc (mg) 1 | Calcium (mg) 1 | Potassium (mg) 1 |
|---|---|---|---|---|---|---|
| G1 | Rice | 35 | 0.8 | 2.00 | 6 | 107 |
| Tailoredflour | 32 | 2.7 | 1.00 | 27 | 128 | |
| Wheat flour (second) | 48 | 3.0 | 1.00 | 30 | 124 | |
| G2 | Maize | 96 | 2.4 | 2.00 | 14 | 300 |
| Maize flour | 84 | 3.2 | 1.00 | 22 | 249 | |
| Millet | 107 | 5.1 | 2.00 | 41 | 284 | |
| Avenanuda flour | 146 | 13.6 | 2.00 | 27 | 319 | |
| G3 | Mung bean | 125 | 6.5 | 2.00 | 81 | 787 |
| Mung bean flour | 0 | 6.1 | 3.00 | 74 | 750 | |
| Azuki bean | 138 | 7.4 | 2.00 | 74 | 860 | |
| G4 | Potato | 23 | 0.8 | 0.15 | 8 | 342 |
| Sweet potato | 12 | 0.5 | 0.37 | 23 | 130 |
Table 3.
Food intake (g d−1) constraints for 4 groups.
| Group Code | Group Name | Lower | Upper |
|---|---|---|---|
| G1 | Rice & wheat flour | 150 | 150 |
| G2 | Whole grains | 50 | 150 1 |
| G3 | Beans (excluding soybeans) | ||
| G4 | Tuber foods | 50 | 100 |
| Total | 250 | 400 |
1 Consumption constrains of G2 and G3 is merged into one item.
Table 4.
The amount of current CR food consumption and carbon emissions per day per capita.
| Groups | Food Items | Food Consumption (g) | Carbon Emissions (g) |
|---|---|---|---|
| G1 | Rice | 116.39 | 337.44 |
| Tailored flour | 124.48 | 152.28 | |
| Wheat flour (second) | 132.15 | 140.14 | |
| G2 | Maize | 8.42 | 4.98 |
| Maize flour | 12.58 | 12.9 | |
| Millet | 12.4 | 13.15 | |
| Avenanuda flour | 0.09 | 0.17 | |
| G3 | Mung bean | 1.72 | 2.09 |
| Mung bean flour | 0.36 | 0.45 | |
| Azuki bean | 1.09 | 1.28 | |
| G4 | Sweet potato | 6.00 | 1.63 |
| Potato | 75.32 | 16.87 | |
| Total | 490.7 | 683.38 |
Table 5.
Centroids (Cen)and consumption (Con) (g d−1) of the eight clusters.
| Cluster | 1 | 2 | 3 | 4 | 5 | 6 | 7 | 8 | |
|---|---|---|---|---|---|---|---|---|---|
| Number | 767 | 409 | 24 | 397 | 71 | 87 | 1362 | 1768 | |
| G1 | Cen | 1.25 | 1.08 | 0.05 | 0.09 | 0.35 | −0.06 | −0.49 | 1.06 |
| Con | 268.11 | 250.85 | 146.26 | 150.32 | 176.72 | 135.09 | 91.43 | 249.78 | |
| G2 | Cen | −0.21 | 0.24 | 0.07 | 1.66 | 5.25 | −0.02 | −0.31 | −0.31 |
| Con | 18.95 | 50.11 | 38.34 | 148.42 | 396.97 | 32.11 | 12.03 | 12.03 | |
| G3 | Cen | −0.12 | −0.13 | 11.03 | −0.13 | 0.05 | 3.67 | −0.13 | −0.12 |
| Con | 0.88 | 0.72 | 180.10 | 0.72 | 3.61 | 61.80 | 0.72 | 0.88 | |
| G4 | Cen | −0.2 | 1.84 | −0.4 | 0.09 | 0.46 | −0.26 | 0.57 | −0.81 |
| Con | 63.77 | 242.92 | 46.21 | 89.24 | 121.73 | 58.50 | 131.39 | 10.20 | |
Table 6.
Different nutrient intake of the eight clusters.
| Cluster | 1 | 2 | 3 | 4 | 5 | 6 | 7 | 8 |
|---|---|---|---|---|---|---|---|---|
| Energy | 1050.18 | 1236.52 | 1244.66 | 1107.20 | 2092.17 | 820.98 | 463.88 | 920.91 |
| Protein | 29.33 | 33.74 | 56.40 | 29.37 | 54.55 | 30.13 | 12.69 | 25.90 |
| Carbohydrate | 225.84 | 265.13 | 244.63 | 232.68 | 434.31 | 168.22 | 99.79 | 198.12 |
| VB1 | 0.49 | 0.69 | 0.79 | 0.69 | 1.44 | 0.48 | 0.27 | 0.40 |
| VB2 | 0.23 | 0.32 | 0.36 | 0.29 | 0.59 | 0.22 | 0.13 | 0.19 |
| Niacin | 6.07 | 8.29 | 7.34 | 6.81 | 12.82 | 4.94 | 3.36 | 5.02 |
| Magnesium | 136.69 | 199.42 | 310.96 | 220.64 | 479.22 | 167.04 | 76.75 | 111.11 |
| Iron | 7.20 | 9.36 | 17.21 | 9.61 | 19.91 | 8.82 | 3.54 | 6.11 |
| Zinc | 3.95 | 4.52 | 6.43 | 4.55 | 9.05 | 3.70 | 1.63 | 3.51 |
| Calcium | 69.29 | 90.19 | 186.15 | 81.15 | 159.24 | 91.15 | 35.45 | 58.59 |
| Potassium | 589.56 | 1237.87 | 1887.04 | 885.83 | 1730.38 | 940.85 | 577.58 | 373.67 |
© 2019 by the authors. Licensee MDPI, Basel, Switzerland. This article is an open access article distributed under the terms and conditions of the Creative Commons Attribution (CC BY) license (http://creativecommons.org/licenses/by/4.0/).
Share and Cite
MDPI and ACS Style
Yang, X.; Zhang, Z.; Chen, H.; Zhao, R.; Xu, Z.; Xie, A.; Chen, Q. Assessing the Carbon Emission Driven by the Consumption of Carbohydrate-Rich Foods: The Case of China. Sustainability 2019, 11, 1875. https://doi.org/10.3390/su11071875
AMA Style
Yang X, Zhang Z, Chen H, Zhao R, Xu Z, Xie A, Chen Q. Assessing the Carbon Emission Driven by the Consumption of Carbohydrate-Rich Foods: The Case of China. Sustainability. 2019; 11(7):1875. https://doi.org/10.3390/su11071875
Chicago/Turabian StyleYang, Xiaoke, Zhihang Zhang, Huangyixin Chen, Rongrong Zhao, Zhongyue Xu, Anguo Xie, and Qiuhua Chen. 2019. "Assessing the Carbon Emission Driven by the Consumption of Carbohydrate-Rich Foods: The Case of China" Sustainability 11, no. 7: 1875. https://doi.org/10.3390/su11071875
Note that from the first issue of 2016, this journal uses article numbers instead of page numbers. See further details here.