Experiencing LoRa Network Establishment on a Smart Energy Campus Testbed


College of Information Technology, Incheon Nat’l University, Incheon 22012, Korea
*
Authors to whom correspondence should be addressed.
Sustainability 2019, 11(7), 1917; https://doi.org/10.3390/su11071917
Submission received: 29 January 2019
/
Revised: 7 March 2019
/
Accepted: 25 March 2019
/
Published: 30 March 2019
(This article belongs to the Special Issue Sustainable Communication Networks)
Abstract
:The fundamental properties of long-range (LoRa) performance have been revealed by previous research, but advanced issues remain unresolved. This paper tackles three technical challenges that are confronted when establishing a LoRa network on a smart energy campus testbed in Korea. First, the communication range of LoRa in a combined indoor and outdoor environment has yet to be determined. To address this problem, this study builds a LoRa testbed from which we measure the propagation properties of radio signals in a combined environment. Then, we establish a simplified path loss model for LoRa PHY and compute the communication range. Next, national regulations enforce the use of the Listen-Before-Talk (LBT) scheduling scheme, but its performance has never been examined. This paper enumerates the impacts of LBT, threshold values, back-off algorithms, and application parameters on LoRa Medium Access Control (MAC) performance. Last, the application parameters required by the smart energy scenario influence LoRa performance, but their impacts have been scarcely reported. Based on the application parameters and experimental results, this paper proposes a strategy to deploy LoRa gateway(s) and nodes on the campus. To the best of the authors’ knowledge, this is the first work that considers performance issues when establishing a LoRa network on a real-world application testbed.
1. Introduction
The emergence of the Internet of Things (IoT) has necessitated new types of communication alternatives that consist of a massive number of smart devices and sensors. Unlike conventional communication technologies, sensors transmit a small amount of data with a very long period through the air. In addition, since most of these sensors are battery-driven, long-range communication with low power is a prerequisite [1]. To meet these new requirements, Low-Power Wide Area Network (LPWAN) wireless communication technologies, such as Long Range (LoRa), LTE-M, and SigFox, have been recently introduced. Of the three, LTE-M uses a cellular network, implying high costs, and SigFox only supports very low data rates. LoRa, which is known to allow for communication over a distance of up to several kilometers in urban environments with low power consumption in an unlicensed band, is attracting much attention [2].
Since the debut of LoRa communication chips and related development kits, academia has evaluated the performance of the LoRa PHY (Physical) and MAC (Medium Access Control) layers to determine whether LoRa works as well as its specification indicates when applied on a real-world device. Two popular research topics on the PHY layer are (i) the maximum length over which a radio signal can propagate in an outdoor environment and (ii) the extent to which in-building obstacles, such as internal walls and doors, affect the radio signal. Simulation studies on the MAC layer have focused on how well-known network parameters (e.g., number of nodes and size of data transmission) cause collisions and thus influence overall MAC performance. Existing research has successfully uncovered the fundamental properties of LoRa. However, some challenges remain unexamined and must be resolved when establishing a LoRa network in the real world.
The ultimate goal of our research is to build a smart energy testbed on a Korean campus in which the LoRa network enables wireless communications for end devices. This paper tackles three technical challenges that are confronted when installing LoRa gateways and nodes and configuring their operational parameters. First, the communication range of LoRa in a combined indoor and outdoor environment has not yet been examined. Suppose that a LoRa gateway is deployed, and LoRa nodes (energy devices, sensors, and actuators) are installed outside and inside buildings on the campus. It is questionable whether the gateway can successfully communicate with a smart meter installed in a campus building 1 km away. The signal strength may decrease dramatically as it passes through the buildings between the gateway and smart meter, leading to a shrinkage in the communication range. Existing works have examined PHY performance in either an indoor or outdoor environment, but the communication range in a combined indoor and outdoor environment must be determined before deploying the gateways and nodes. Next, LoRa networks must follow Korean regulations for wireless communications. Adopting the regulations influences LoRa MAC performance, but the impacts have never been enumerated and studied. In Korea, the LoRa Alliance enforces the use of the Listen-Before-Talk (LBT) scheme instead of duty cycling, which has been studied actively in Europe. The LBT scheme restricts data transmission in different ways, but its performance has remained unknown. Moreover, previous research has never investigated which of the back-off algorithms used in LBT work better in LoRa. This knowledge must be acquired before configuring the operational parameters in gateways and nodes.
Last, the application parameters required in the smart energy scenario influence LoRa performance. For instance, frequent data collection from several nodes can increase the probability of a packet collision. For example, one collision every 10 s from 1000 nodes is considered a high collision rate. If this is the case, we can adjust the operational parameters by slowing down the collection frequency or reducing the number of nodes to resolve the collision problem. Installing more than one gateway can also mitigate the problem. To date, however, there are few experimental results showing the impacts of application parameters on LoRa performance, meaning that it is even unknown whether we need to change the parameters. These impacts must be investigated before deploying the gateway(s).
This paper aims to resolve the technical challenges to help us understand how to deploy a LoRa network on the campus. The contributions of this paper are summarized as follows.
- We build a LoRa testbed on the campus and run experiments to understand the properties of LoRa PHY. After deploying nodes outdoors only, the first experiment records the signal strength and computes the communication range, and the findings are compared with the results reported in the existing research to verify their accuracy. The next experiment also measures the signal strength from nodes that are installed inside and outside campus buildings. By using the experimental results, we establish a simplified path loss model for LoRa PHY and estimate the communication range in the combined environment (Section 4).
- Given the signal properties of LoRa PHY, we conduct experiments to understand the properties of LoRa MAC via simulations. The first experiment adopts the application parameters of smart energy (data size and data period) and evaluates their impacts on the packet delivery ratio when setting different values of LoRa parameters. Experimental results reveal threshold values for the parameters to satisfy the given requirement for communication reliability (Section 3 and Section 5).
- The aim of the next experiment is to enumerate the impact of the LBT scheme on LoRa MAC performance. The experimental result leads to a recommendation for optimal sensing threshold values for different application parameter settings. We also apply a list of back-off algorithms to LoRa and compare their performance. Experiments find out an optimal algorithm and a corresponding contention window size (Section 5).
- Taking into account all the experimental results, we present a strategy to establish a LoRa network. The strategy includes the number of nodes to deploy and how to set up LoRa parameters, such as the spreading factor (SF), in the nodes. The strategy also recommends the number of gateways to install on the campus to satisfy application requirements (Section 6).
The following section starts with a brief review about LoRa technology, including a list of parameters on PHY and MAC layers and regional regulations.
2. LPWAN and LoRa
IoT applications require communication technologies to support the following properties: (i) long communication range, (ii) low energy consumption, (iii) relatively low data rate, and (iv) scalability and low cost. As shown in Table 1, however, most existing wireless communication technologies do not meet the requirements for IoT applications. LPWAN technologies have been proposed to meet new requirements; Table 2 lists three examples and their characteristics. SigFox supports the longest communication range, while LTE-M provides high data rates.
Of the listed technologies, LoRa™ technology, consisting of two layers, has received considerable attention. LoRa is a wireless modulation technique that defines the physical layer of LoRa communication, creating long-distance communication links [3]. A MAC layer of LoRa, named LoRaWAN (LoRa Wide Area Network), is implemented on top of LoRa PHY, as shown in Figure 1. LoRa Alliance™ defines the LoRaWAN protocol that specifies a network topology, communication protocols, operating options of LoRa nodes, and security [4,5]. Table 2 also includes technical details of LoRa communication.
A LoRa network architecture is deployed in a star-of-stars topology in which nodes, gateways, network servers, and application servers are placed (see Figure 2). A node collects sensor records and sends them to a gateway by using single-hop wireless communication with LoRa modulation. The gateway is connected to a central network server via standard IP connections and acts as a bridge between the node and the network server and converts RF signals to IP packets and vice versa. The network server removes duplicated data and determines which gateway responds to the node. It is capable of maximizing the network capacity by controlling the node’s data rate adaptively. An application server is used to collect and analyze data from nodes.
This section reviews the two layers from a technical perspective and discusses various parameters affecting LoRa performance. To avoid confusion regarding terminologies, this paper uses LoRa PHY and LoRa MAC (LoRaWAN) to represent the PHY and MAC layers, respectively. From this point, we use the term LoRa to represent a wireless communication technology including both layers.
2.1. LoRa PHY
LoRa PHY uses a chirp spread spectrum (CSS) modulation technique, where a chirp represents a sinusoidal signal of a frequency increase or decrease over time. The CSS uses broadband linear frequency-modulated pulses to encode information by sweeping the frequency for a certain period of time (see Figure 3). LoRa PHY is robust to channel noise because it occupies the entire channel bandwidth. It also mitigates external noise by performing frequency hopping on every transmission [7]. Since a receiver demodulates a unique pattern, it can detect signals lower than a noise floor and has a high tolerance for frequency misalignment between transceivers. LoRa PHY achieves wider coverage at the same power consumption as other communication systems that operate with a higher-frequency carrier. The use of sub-GHz leads to a lower data rate than that obtained with high frequency, but it is suitable for IoT systems that do not require significant amounts of throughput. In addition, a lower data rate reduces the sensitivity requirements of the receiver because it provides benefits in terms of the error rate. The low-frequency nature increases the possibility of reaching a signal through the diffraction phenomenon, even where the line-of-sight (LOS) is not secured. However, with a slow wireless link, there is a greater possibility of a collision by noise and other signal interferences because it increases the duty cycle. It also increases power consumption at both the transmitter and the receiver as a result of a longer transmission delay. Despite these shortcomings, LoRa communication supports the coverage, power, and data rate required by most IoT applications.
LoRa PHY uses 6 spreading factors (from SF 7 to SF 12) and 3 bandwidths (125 kHz, 250 kHz, and 500 kHz). Because of the spread spectrum technique, messages with different data rates can be regarded as a set of virtual channels that are orthogonal to one another. As a result, the overall gateway capacity is increased. To analyze the performance of LoRa modulation, it is necessary to understand the factors that affect the sensitivity of a radio receiver. The equation below represents the sensitivity at room temperature [9].
where the first term is thermal noise in 1 Hz of bandwidth and influenced by the temperature of the receiver. and denote the receiver bandwidth and the receiver noise determined by the hardware implementation, respectively. Finally, means the minimum signal-to-noise ratio for demodulation. The bandwidth and SNR are variables that greatly affect LoRa PHY performance.
As the bandwidth decreases, the receiver sensitivity increases; it is possible to transmit packets farther with the same signal power. In other words, the required signal power decreases for a transmission over the same distance. However, since the bandwidth is proportional to the transmission rate of the chirp, the use of a lower bandwidth means an increase in transmission time. Likewise, increasing the SNR value improves the performance of LoRa PHY. Two parameters, the SF and Coding Rate (CR), affect the SNR value. The SF is a parameter used for encoding, and a single bit is encoded into chirps. In general, the higher the SF, the lower the SNR required for demodulation. When the SF is 12, a signal with −20 dB signal power can be demodulated relative to the noise floor. However, a higher SF requires more chips for encoding, so the transmission time will be longer. The CR is related to Forward Error Correction (FEC), which allows for the recovery of information bits corrupted by interference. Higher CR values allow for lower sensitivity because the number of recoverable bits increases, but the overhead used for encoding also increases, implying longer Time on Air (ToA). Since the actual performance of FEC can be evaluated in the event of burst errors due to interference, the use of a high CR may result in longer ToA without the benefit of sensitivity if such interference does not exist. Therefore, an appropriate trade-off between receiver sensitivity and ToA should be made when designing the LoRa radio link.
2.2. LoRa MAC
LoRaWAN defines the LoRa MAC layer, which has low power, network capacity, quality of service, and security. Collisions can occur because multiple transmitters share the same radio channel. Scheduling or random-access methods can mitigate this problem. Since scheduling is complicated and difficult to control as the number of nodes increases, most wireless communication technologies use a random-access approach. Two popular indicators for evaluating LoRa MAC performance are the packet delivery ratio (PDR) and throughput.
In general, when a node transmits little data, the collision rate decreases, which increases the PDR but decreases the throughput. Table 3 lists the parameters and shows their impacts on the two indicators when their values increase. The parameters are the number of channels, the number of nodes, packet length, or ToA, transmission period, and transmission scheme. Having more channels in the network decreases the opportunity for collision, thus increasing the value of both indicators. Given a fixed number of channels, however, a bigger packet (i.e., long length) indicates longer ToA and is likely to increase collisions and decrease the PDR. Please note that delivering the packet implies the transmission of more bits of data. The data period also influences LoRa MAC performance. If data are transmitted quite infrequently, the chance of collision decreases. LoRa has two options for transmission: confirmed and unconfirmed. Upon receiving a data packet from a node, with the confirmed message type, a gateway sends an additional packet back to the node to acknowledge the receipt of data. Unless the node receives the response, it retransmits the data, which places a considerable load on the network [10].
2.3. Security
Since LoRa devices operate for as long as 10 years after deployment, security must be future-proof [11]. The LoRaWAN security design adheres to principles such as standards, well-vetted algorithms, and end-to-end security, and it provides mutual authentication, integrity, and confidentiality. Mutual authentication is verified between a LoRa node and a LoRa gateway through Over-the-Air Activation (OTAA). This proof is made by calculating the AES-CMAC using AppKey at the device’s join request and receiver.
LoRa MAC and application messages are provided with origin authentication, integrity protection, replay protection, and encryption. This protection, combined with mutual authentication, allows network traffic to remain unchanged, comes from legitimate devices, is unintelligible to an eavesdropper, and prevents malicious actors from capturing and replaying. LoRaWAN security implements end-to-end encryption for application payloads exchanged between the end devices and application servers. All LoRaWAN traffic is protected using two session keys. Each payload is encrypted by AES-CTR and transmits a Message Integrity Code (MIC), which is filled with a frame counter and AES-CMAC, to prevent packet tampering and packet replay.
2.4. Regional Parameters
LoRa Alliance recommends using a specific media access control method to prevent saturation of the network capacity. For instance, the European government regulates the duty cycle of LoRa devices. It limits the fraction of time during which a device occupies a wireless channel in a day in an attempt to decrease the probability of a packet collision. Most existing research evaluating LoRa MAC performance is based on the duty-cycle scheme.
Unlike the European government, the Korean government permits a choice between the duty-cycle limitation or Listen-Before-Talk Adaptive Frequency Agility (LBT AFA) transmission management. The LoRaWAN specification for the KR 920–923 MHz unlicensed band in the LoRa Alliance [12] requires that only LBT be used for the maximum size of data transmission. A node with data to send in LBT first detects whether a radio channel is being used by another node (listening) before transmitting data (talking). When in use, it jumps to another channel and starts listening again. Korean regulations require that the node continues sensing a channel for more than 5 ms during the listening step, and a sensing threshold of dBm has been defined [13]. In addition, the transmission must be completed within 4 s. The sending node remains idle for more than 50 ms after a successful transmission. We refer interested readers to [12,13] for more details. For instance, they define the number of channels, transmission power, maximum payload size, etc.
2.5. Related Works
Noreen et al. described LoRa PHY performance theoretically [14]. They explained the transmission rate in terms of three basic parameters: BW, CR, and SF. Their results show that increasing the packet length results in a sharp increase in ToA.
SK Telecom [15], a leading telecommunication operator in Korea, presented its experimental results on LoRa transmission ranges at the IoT-LPWA working conference in 2016. LoRa nodes that are located outdoors transmit packets to a LoRa gateway with an output power of 14 dBm. In the experiment, the SF was set to 12, and retransmission was not conducted. The company announced that transmission ranges of 1.09 km, 1.54 km, and 3.03 km are achievable for dense urban, urban, and suburban areas, respectively. These specified values satisfy the requirement for a LoRa transmission success rate of above 90%. The researchers also deployed nodes inside the buildings on the first floor and performed a similar test. In this case, the communication coverage was measured to be about 2/3 of the performance measured outdoors. Augustin et al. [16] reported the result of suburban experiments in Paris. Cisco 910 as a gateway was installed outside a residential window at a height of about 5 meters. LoRa nodes were placed in 5 different locations so that their distances from the gateway were 600 m, 1400 m, 2300 m, 2800 m, and 3400 m. There were 3 options for SF values: 7, 9, and 12. The adaptive data rate and retransmission were not used. Experimental results show that the PDR is about 90% when SF 12 is used at 2800 m, and the ratio drops to less than 10% at SF 9. At 3400 m, only about 40% of the received packets have SF 12. Wixted et al. [17] evaluated the LoRa coverage in the Central Business District in Glasgow, Scotland. A LoRa gateway was installed on the roof of the 7th floor of a university building. Carrying nodes with SF 12 in a backpack, a tester moved around the city and measured the received signal strength. The experimental result shows that it is possible to successfully receive packets 2.2 km in the south direction and 1.6 km in the north direction (before passing through the hill). The authors mentioned that the east and west directions were not fully tested but were measured to about 2 km.
Erbati et al. [18] analyzed LoRa performance in an outdoor environment in Duisburg, Germany. A LoRaWAN gateway was installed in an eight-story building located in the city of Duisburg. Experiments were conducted in a non-LOS real-world environment where there exist various obstacles, such as buildings, cars, and trees. The distance varied from 300 m to 1850 m, and 500 data were sent from each spot. The following parameter settings were used: 21 bytes of payload, a CR of 4/5, SF 10, and 125 kHz bandwidth. Results show that the Received Signal Strength Indication (RSSI) value decreases logarithmically with increasing distance. A data packet is not decoded anymore when the distance becomes greater than 1,850 m, where a PDR of 69% is achieved.
Newmann et al. [19] deployed both the gateway and nodes inside to study LoRa performance in an indoor environment. In the experiments, the distances between nodes and the gateway were 0.50∼60 m. The result shows that RSSI decreases rapidly on a log scale with increasing distance compared with the outdoor environment, but it is reliable enough to be used indoors. However, when the distance becomes very small, packet errors occur frequently as a result of a bad cyclic redundancy check (CRC).
Adelantado et al. [20] referred to the duty-cycle constraint as a major factor limiting LoRa MAC performance. A higher SF value allows a wider communication range but also increases the ToA, which inevitably leads to an increase in the off-period duration under the constraint. The problem can be serious because, generally, nodes using high SF values are much more numerous than nodes using low SF values. The study applied 3 channels and a 1% duty cycle as the fixed parameters and simulated the packet reception ratio for a given packet length and number of nodes. As a result, although the packet length is small at 10 bytes, the packet reception rate decreases exponentially because of the increasing number of collisions as the number of nodes increases. Notably, it converges to almost zero when more than 1500 nodes are deployed. On the contrary, a small number of nodes decreases the probability of collision, but the throughput is limited by the duty cycle.
Abeele et al. [21] analyzed the scalability of large-scale LoRaWAN using the NS-3 simulator. LoRa MAC has been modeled as a pure ALOHA network that does not consider the capture effect or interference characteristics. Instead, the authors generated a LoRa error model from a preliminary simulation that measured the bit error rate on the baseband and used it as an interference model in the simulator. The simulation result shows that the packet reception ratio varies depending on how SF values are assigned when nodes are deployed. Performance is very poor when all nodes have the same SF. Assigning SF values randomly results in better performance than the fixed SF assignment, but it is still low: only a 20% ratio with 5000 nodes. They improved the performance by about two times compared with the random assignment method by using a PER (packet error rate) strategy that assigns the minimum SF value at which the PER falls below a certain threshold.
The authors ran another experiment that set the size of an application payload to 8 bytes and used a single channel. In this experiment, they increased the data period from 600 s to 60,000 s, varied the number of gateways from 1 to 4, and then evaluated MAC performance. Their results confirm that the PDR increases exponentially as the data period increases. With respect to the gateways, the PDR achieves 70%, 89%, and 96% when 1, 2, and 4 gateways are deployed in an area with 10,000 nodes that send data every 600 s. This illustrates the possibility of using multiple gateways to improve LoRa performance in a dense environment. Our experiments used the LBT scheme on multiple channels, so it is impossible to compare our results to theirs directly. However, both results indicate that there is a trade-off between the number of nodes and the data period to achieve a given level of LoRa MAC performance.
To and Duda [22] applied a Carrier-Sense Multiple Access (CSMA) technique to LoRa to improve LoRa scalability. When a node has a packet to send, it performs a Clear Channel Assessment (CCA) to test whether there is an ongoing transmission on a channel. The node transmits the packet only if the channel is clear; otherwise, it backs off for a random interval of time, with k slots of 1’s, where . The authors further proposed CSMA-10, a variant of CSMA, where the node listens to the channel, named the Clear Channel Gap (CCG), for an interval of 10 ms before attempting transmission. Their experimental results show that the proposed method can mitigate the probability of packet collision. This allows the deployment of 5500 nodes with a 90% PDR, whereas a general LoRaWAN deployment only allows less than 500 nodes to achieve the same packet delivery ratio.
3. Smart Energy Campus
The fundamental goal of a smart energy campus is to use the “energy” resource more efficiently on the campus, as depicted in Figure 4. To this end, a few energy devices are installed on the campus; they include solar panels, smart meters, thermostats, energy storage systems, etc. Conventional IoT data, such as room temperatures, are also collected by sensors. Upon detecting that a classroom is empty, an energy management system (EMS) turns off the lights and air conditioners in the room to improve the energy efficiency on the campus. Several nodes (energy devices, sensors, and actuators) are installed at locations where typical networks such as the Ethernet or Wi-Fi do not reach. For instance, Figure 5 depicts a solar panel and solar irradiance sensors installed on the roof of a building on the campus. A new installation of network cables, Wi-Fi routers, or other short-range wireless networks is often avoided because of high installation costs. LoRa is considered to be a promising alternative that provides wide area communications.
To establish a LoRa network for the smart energy campus testbed, we install gateway(s) and nodes (i.e., energy devices, sensors, and actuators) and set up their operational parameters. The first challenging question confronted is, “how do we deploy the gateway on the campus?” One may suggest that it is enough to install one gateway in the center of the campus since previous research shows that LoRa can reach up to several kilometers. However, the gateway may not communicate with a node installed inside a building located at the farthest corner of the campus. Once hundreds of nodes are installed, severe collisions can occur in the gateway. The LoRa network may need more than two gateways. In fact, we must plan to deploy gateway(s) to maximize LoRa performance. Previous studies, unfortunately, have yet to answer the question. To investigate the challenge and to ultimately establish the LoRa network, this paper introduces technical questions on the PHY, MAC, and application layers.
First, we ask the question, “how well does LoRa PHY perform in a combined indoor and outdoor environment?” LoRa is known to provide communication ranges of 15 km and 6 km in rural and urban areas, respectively. In practice, however, it may not achieve this performance as a result of various environmental factors. Even in a combined environment in which a gateway communicates with nodes that are inside different buildings and/or on the outside across from buildings, the factors become more complicated and unpredictable. The campus is 600 × 600 m in size and has around 30 buildings. Nodes are everywhere on the campus; solar panels are on building roofs and/or in the middle of parking spaces, whereas smart meters and sensors are inside buildings. Can a LoRa gateway communicate with all the smart meters on the campus? If not, what is the maximum communication range in a combined environment? How many gateways do we need to reach all of them?
The next question that this study raises is, “how do new regional parameters and regulations affect LoRa MAC performance?” In the LBT scheme, a back-off algorithm plays an important role. Upon detecting a busy channel, a node waits for a specified time duration (named the back-off time) before retrying to sense the channel. A short delay makes the node sense frequently, resulting in excessive energy consumption, whereas a long delay can increase the data transmission time, degrading performance. Back-off algorithms and their impacts on LoRa MAC, however, have been barely studied and evaluated, unfortunately. Moreover, some parameters in the regulations are impractical for LoRa and must be adjusted to achieve optimal performance. For instance, the maximum EIRP (Equivalent Isotropic Radiated Power) is as low as 14 dBm in LoRa communication, and the sensing threshold is defined as dBm in the regulations. In the listening step of LBT, this set of values implies that a node can detect a neighbor’s signal only when it is closer than 50 m from the neighbor. Given that a LoRa signal can span several kilometers, this setting is certain to cause disastrous collisions. Thus, it is necessary to find the optimal value of the threshold in LoRa. We note that this paper does not intend to ignore the regulations but to derive recommendations for amendments.
The last question is, “how do application requirements affect LoRa performance?” Different applications have disparate lists of performance requirements. In an autonomous vehicle system, for instance, data are processed in real time, and thus, the underlying communication technology must support it. Our campus testbed has more than 3000 nodes that transmit their sensor records every 3 min on average via LoRa communication. A node maintains 3–10 sensor points, meaning that each record contains 3–10 tuples of data. This determines a packet size of less than 32 bytes. The smart energy application runs machine learning algorithms and can thus tolerate a small amount of data loss, for example, 10%. Given this specification, how often does collision occur? Do we need more gateways to meet the packet loss requirement? If the packet size is halved, how many additional nodes can we install? To date, there are few experimental results showing the impacts of application parameters on LoRa MAC performance.
4. Experiments for LoRa PHY
In an attempt to answer the question, “how well does LoRa PHY perform in a combined indoor and outdoor environment?”, this part of the study includes setting up a testbed, running experiments, and analyzing the measurement data. Then, a simplified path loss equation is empirically determined based on the measurements, and it is used to estimate the maximum communication range/distance of LoRa in a combined environment.
4.1. Preliminary
The testbed consists of a LoRa node, a LoRa gateway, and a data server. Experiments run in a typical IoT communication pattern; that is, a node periodically sends data packets to a gateway that forwards it to a database server for further analysis.
A LoRa node is implemented using the MultiTech’s mDot™ MTDOT-X1P-SMA [23] equipped with an 8-inch omnidirectional dipole antenna with a gain of 3 dBi. It uses Semtech’s SX1272/73 LoRa communication module [24]. The node radiates signals at a transmission power of 11 dBm, and the SF value is set to 7 by default. The node moves around on the campus and transmits 100 data packets with a 1-byte payload length to a gateway once it stands in a fixed position. No retransmission policy is applied; the node does not check whether packets are successfully received after sending them out, and thus, some packets may be lost. A LoRa gateway is implemented using the MultiTech’s Conduit™ MTCDT-247A [25]. It has the same communication module and antenna and can thus communicate with the LoRa node. Upon receiving data, it forwards the data to a data server for further processing via the Ethernet. The gateway is installed on the roof of a five-story building about 15 m high (Building #7 in Figure 4) with no obstacles nearby, as shown in Figure 6.
Throughout the experiments, the gateway stays in the same position. Instead, we change the node’s location and conditions for communication so that as communication distance varies, the node is either on the inside or outside of a building, may be surrounded by a crowd (moving), and may have an insecure line of sight. By having these variables in the experiments, we can assess how well data signals are successfully received and decoded by the gateway. To this end, the gateway measures and records the Received Signal Strength Indication (RSSI) of all incoming signals.
Path Loss Model
The measurement data are then used for estimating a path loss model for analysis. Previous literature has studied various mathematical models for path loss estimation [26]. It is noted, however, that due to the complexity of signal propagation, it is impossible to derive a single model that accurately captures all path loss properties in different communication environments. Even developing a model that fits well to a specific environment can be achieved through a complex analytical model, such as the Indoor Dominant Path (IDP) model [27], or empirical measurement, which again fails to explain other communication environments. Therefore, it is often better to use a simple model that captures the core of signal propagation for a general analysis of various communication systems rather than develop a path loss model that approximates real-world channel status. Our analysis also follows this approach since the combined environment cannot be represented by a single model. To this end, this paper presents a simplified path loss model as a function of distance [28] as follows:
The dB attenuation is rewritten as
where and represent received and transmitted powers, respectively. K is a constant with no unit that depends on an antenna characteristic and average channel attenuation. is a reference distance to the far-field of an antenna, and is a path loss exponent describing how rapidly a signal’s power decreases with distance.
Because of the complexity of the antenna near-field, Equation (3) is generally valid at a transmission distance , where is typically assumed to be 1–10 m indoors and 10–100 m outdoors. The value of K is set to the free space path gain at distance , assuming the case of an omnidirectional antenna to approximate empirical measurements. The value of can be obtained in a way that minimizes the error with respect to empirical measurements. The experiments described in this section aim to (1) find so that it represents the combined environment and (2) then estimate the communication ranges.
4.2. Outdoor-Only Environment
The purpose of the first experiment is to evaluate the communication range of the testbed system in an outdoor-only environment and to verify whether the LoRa performance stated in the official specification can be reproduced in a real-world scenario. Figure 7a captures the scene of the first experiment on the campus, representing the LOS environment. The gateway (the blue dot) is on the roof of Building #7 at a height of about 15 m, and the node (the top right ✖ mark) is on the ground and 10 m from the gateway. As shown in Figure 7b, the node is on the outside, and a laptop computer powers the node and feeds it data to send. It moves around 200 m at intervals of 4 m to the lower left on the map. At each location, the node sends 100 packets to the gateway with no retransmission, and the gateway records the received signal power (i.e., RSSI).
Figure 8 shows the experimental results for the received power of the data signals measured and estimated with increasing distance from the gateway. The blue x marks represent the measurement data in the experiment from which we find the value and complete Equation (3) for the outdoor-only environment. The path loss exponent is computed to be 2.977. It is noted that the value is in the range of 2–4 in a normal LOS environment, but it increases to 4∼6 in a relatively lossy environment, such as buildings and other indoor environments.
The red line in the figure illustrates the computation of Equation 3. Using this model, we can estimate the maximum transmission range in which the gateway recognizes signals from the node. The technical document from Semtech indicates that the communication module has a receiving sensitivity of dBm in a LoRa network with a 125 kHz bandwidth [24]. When applying the sensitivity value to Figure 8, we can conclude that the maximum communication range becomes around 5.9 km in the outdoor-only environment. This result is almost the same as the value in the LoRa specification. However, using a lower SF value to increase the data rate can significantly limit the coverage. For instance, the communication distance decreases to 2.38 km because of the low sensitivity of dBm when the SF value is set to 7 at the node. Table 4 compares the maximum communication ranges in the outdoor environment reported in other experiments with our results.
4.3. Combined Indoor and Outdoor Environment
The next experiment evaluates LoRa PHY performance in the combined indoor and outdoor environment. Figure 9a depicts the campus map for this experiment. The gateway stays at the same location, and the nodes (✖ marks) are placed on both the inside and outside of the buildings. The red marks represent nodes inside two buildings—a library and a cafeteria. The library is next to Building #7, and we select two positions on the first floor of the library for the experiments. Nodes protected with plastic enclosures are thus positioned: one is on the floor, and the other is in the drawer, as shown in Figure 9b. There are few students in the area during the experiments. The cafeteria is around 220 m away from the gateway, where several nodes are deployed. Experiments are conducted during lunchtime so that the cafeteria would be crowded with students. The black marks in the figure represent outside nodes on the campus. One node is just next to the gateway, and thus, the LOS communication between them is secured. The other node is on the roadway past the library building. In this setting, the radio signals travel through the library building located in the middle to reach the gateway.
As described, the experiments include many variables, such as inside vs. outside, level of crowding, communication distance, and line of sight. However, the intention of this experiment is to find the simplified path loss model. Thus, this section illustrates the experimental results in a simple, combined manner. Figure 10 shows the received power of data signals measured and estimated with increasing distance from the gateway. The blue x marks representing the measurement data indicate that the RSSI value decreases with distance more rapidly than in the previous experiment. This is mainly attributed to the influence of buildings and obstacles around and in the middle. The path loss exponent, , is computed as 3.956, from which we complete Equation (3) for the combined indoor and outdoor environment (see the red line in the figure). The maximum communication ranges can then be estimated; with SF = 12 and SF = 7, the communication distances become around 2.03 km ( dBm) and 0.95 km ( dBm), respectively.
To estimate the maximum communication ranges more accurately, we investigate the details of the experimental results (the RSSI values). Figure 11 plots the numbers of data signals with increasing strength of the received power at the four measurement locations. A histogram shows how much the received power instantaneously varies for each measurement. The results in Histogram (a), collected from the library, are in the distinct shape of a Gaussian distribution. There are few students in the library, and thus, it seems likely that stationary obstacles primarily affect signal propagation. Histogram (b), from the cafeteria with few students, shows a similar pattern. In Histograms (c) and (d), however, the signal power is measured broadly over a wide range. In the cafeteria, there are many students, and some are moving around, which may meaningfully distort wireless signals. This implies that the communication distance can decrease to less than 2.03 km and 0.95 km in the real-world, combined environment.
It is noted that 2.03 km and 0.95 km are averaged values. This implies that a node located at the maximum communication distance may fail to transmit data to the gateway with a probability of 50% when assuming that the RSSI values simply follow Gaussian distribution, as shown in Figure 12. Therefore, the maximum range may be shortened if an application requires higher communication reliability. To compute the accurate maximum ranges in a conservative way, this section reports the worst-case measurement data. The standard deviation of the received power in the cafeteria with many obstacles and people moving around is 5.5 dB. It is computed that to increase the communication reliability from 50% to 90% at the maximum distance, the average receiving sensitivity shifts by 7.1 dB, from dBm to dBm. This reduces the maximum communication range from 2.03 km to 1.34 km. Similarly, 2.9 dB must be secured to provide 70% reliability. Table 5 summarizes the maximum communication ranges to achieve communication reliability of 50∼90% with all available SF values in the combined environment.
5. Experiments for LoRa MAC
This section examines LoRa MAC performance in the combined indoor and outdoor environment. To answer the question, “how do application parameters and regional, regulative parameters influence LoRa performance?”, we set up a simulation by taking the results from the previous section, running experiments, and analyzing the results. The goal of this section is to enumerate the impacts of the parameters and to find the optimal set of parameters for the smart energy campus scenario.
Preliminary
In the simulation, a gateway was at the center of a 2690 × 2690 m area, and nodes were deployed according to a uniformly random distribution around the gateway. Figure 13 shows the deployment of 3000 nodes, and all of them are within 1344.6 m from the gateway. By adopting the recommended node deployment strategy from [21], the distance from the gateway to a node determines the SF value at the node. To this end, we take the values from Table 5 in Section 4 (see the case of 90% communication reliability). Nodes whose distance is less than or equal to 630.9 m had SF values set to 7, nodes with a distance between 630.9 m and 751.3 m had SF 8, and so on. In this way, 1380 nodes are set to SF 7 (46%), and 330 nodes are set to SF 12 (11%). We note that this deployment strategy aims to maximize the network coverage, but it is possible that the collision rate increases as a result of the excessive number of nodes set to SF 7.
A node (e.g., ) periodically transmits a data packet at an EIRP of 14 dBm (i.e., 11 dBm of transmission power and 3 dBi of antenna gain). When transmits a packet, all other nodes and the gateway calculate the received signal power using the path loss, the Gaussian random noise obtained in the previous section, and the distance from the transmitting node. They then determine whether the data signal reaches them, implying that they can sense whether a channel (e.g., ) is in use. If is available, another node (e.g., ) can start transmitting its own data. If not, randomly selects another channel (e.g., ) out of 7 different channels, jumps to , and ensures that is not in use before sending data out. We note that the simulation implements 7 different channels according to the LoRa specification, ranging from 922.1 MHz to 923.3 MHz, with 14 dBm of EIRP in Korea [12]. If is unavailable, hops to another channel (). With this hopping technique, nodes try to avoid collisions. Upon receiving a data packet, the gateway decodes data only if the received power is greater than the receiving sensitivity (also known as the decoding threshold). Otherwise, it processes the packet as a loss. Also, all packets received at the gateway simultaneously are discarded because they are considered to be collisions. To focus on data delivery performance only, the nodes in the experiments transmit data messages of the unconfirmed type, indicating that the gateway does not send an acknowledgment back to the sender upon receiving a data packet.
This section reports the four different experiments (from Exp.A to Exp.D) in which we consider three parameters to represent application requirements (number of nodes, data size, and data period) and three regional, regulative parameters (sensing threshold for LBT, back-off algorithm, number of sensing counts) as shown in Table 6. Each experiment is iterated ten times, and the averaged results are demonstrated in the following subsections.
5.1. Impact of Payload Length on LoRa
The first experiment’s purpose is to examine how the payload length affects LoRa MAC performance. To this end, this subsection configures the parameters as shown in Table 6 (Exp.A). In the experiment, we fix four parameters. Each node sends a data packet every 15 s. The LBT sensing threshold is set to dBm, the median value of the range between dBm (as a sensitivity value at SF 7) and dBm (at SF 12), as reported in the previous section. The experiment uses a fixed 4 s back-off algorithm to reduce the possibility of collision. Upon detecting a radio channel that is busy or has collisions, a node chooses a random back-off time within 0∼4 s, during which it waits (i.e., it backs off) before trying to sense the channel condition again. The node can keep sensing the channel condition and hop over multiple channels unlimitedly until it finds an idle channel to send data.
The experiment varies two parameters. The payload length is increased from 4 bytes to 242 bytes. It is noted that the SF value at a node determines its maximum payload length according to the regional parameters in LoRa. In Korea, the maximum length for SF 7–10 is 242 bytes; for SF 11 and SF 12, the maximum lengths are 151 bytes and 65 bytes, respectively. This implies that although we set the payload length to 100 bytes in the experiment, nodes with SF 12 are still set to 65 bytes. The experiment increases the number of nodes from 200 to 3000 and measures the PDR.
Figure 14a illustrates the experimental results. As the packet length increases, the PDR decreases. This phenomenon becomes more prominent as the number of nodes increases. A PDR of 90% is achieved only when the length is less than 10 bytes and there are 200 nodes. To investigate the details, we split the results based on SF values for each number of nodes, as shown in Figure 14b. For the SF 12 case, the performance values saturate at around 65 bytes, which is consistent with the maximum length value for that SF setting. With 200 nodes and 242 bytes of payload, the average value remains around 80%. PDR performance for SF 10–12, however, drops below the average to as low as 35%. This implies that these SF values may not be adequate for use in a real-world testbed. The graphs also show that performance at higher SF nodes degrades dramatically as the number of nodes increases. At SF 12, for instance, a long ToA and short data period together increase the possibility of collision. Moreover, nodes with SF 12 are often far from each other, which leads to a failure in channel detection, even with the LBT scheme.
5.2. Impact of Data Period on LoRa
The previous subsection discloses that a short data period (frequent data transmission) deteriorates MAC performance, especially at higher SF nodes. To examine how the data period affects LoRa MAC performance, this experiment configures parameters as shown in Table 6 (Exp.B). In the experiment, we fixed the payload length at 65 bytes—the maximum value at SF 12—to minimize the impact of payload length. The data period is varied from 15 to 300 s with a 15 s interval. In the smart energy campus scenario, there is a heterogeneous mixture of devices deployed, and a maximum data period of 5 min is deemed reasonable for the scenario. Other parameters remain the same as in the previous experiment. The experiment measures the PDR by increasing the number of nodes from 200 to 3000.
Figure 15 shows the experimental results for the relationship between the data period and PDR. With 3000 nodes, a data period of 15 s leads to a PDR below 50% at worst. However, performance increases exponentially with increasing period values. For a period longer than 225 s, the PDR exceeds 90%, even with 3000 nodes. This implies that the data period becomes a key factor to improve LoRa MAC performance. To study its impact on different SF values, we present seven graphs in Figure 16a. They depict exponential curves with an increasing data period for all SF values. With 2000 nodes and SF 11, for instance, the PDR jumps from 1% to almost 90% when the data period increases to 300 s. Performance at higher SF nodes (10–12) highly degrades as the number of nodes increases. The PDR with SF 12 and a period of 150 s drops from 94% to 31% as the number of nodes increases from 200 to 3000.
Another observation is that the PDR at all nodes is above 90% when there are fewer than 500 nodes and the data period is longer than 180 s. If the campus testbed requires a shorter data period, the number of nodes must be reduced. When deploying 1500 nodes on the campus, the PDR increases to above 90% with a period of 225 s, except for SF 12 nodes. If this is the case, one solution is to exclude SF 12 nodes; there are 165 nodes at SF 12 (11%), and thus, the campus has 1335 nodes with which to ultimately satisfy a reliability requirement of 90%.
High PDR can also be achieved by reducing the payload length, as examined in the previous experiment. To explore the impact of payload length on the data period, we adjust the payload length from 65 bytes to 32 bytes and run the experiments. In a general energy campus scenario, each energy device contains 5–10 data points, each of which is represented by a maximum of 4 bytes. This experiment adopts a median value, 8 points. Figure 16b shows the results. The graphs reveal that the PDR at all nodes is above 90% when there are 1000 nodes and the data period is longer than 210 s. Alternatively, the data period can be reduced to 120 s with 500 nodes while satisfying the reliability requirement.
5.3. Impact of LBT Sensing Threshold on LoRa
As discussed briefly in Section 2.4 and Section 3, Korean regulations state that the LBT sensing threshold must be more than dBm. According to the experimental results in this paper and those from previous research, with a sensing threshold of dBm, the detection range becomes less than 50 m. This setting is highly likely to cause severe collisions, as a radio signal in LoRa reaches several kilometers in general. Low threshold values such as dBm, on the other hand, can cause a node to misinterpret noise as a normal signal, and thus, no data transmission is performed. This can result in long delays and/or low network use. To understand how the LBT sensing threshold affects LoRa MAC performance in detail, we configure the parameters as shown in Table 6 (Exp.C) and ran experiments. In the experiment, we fix the data period at 180 s and 60 s. The threshold value is increased from dBm to dBm with a 5 dBm interval. The other parameters remain the same as in the previous experiment.
The experimental results with a data period of 180 s are shown in Figure 17a. PDR performance does not worsen much as the threshold value increases. With 200 nodes, the PDR stays above 90% for all SF nodes over all threshold values. Even for SF 12, the PDR is 94% for a dBm threshold, which is analyzed in the following way. Recall that dBm indicates a detection range of around 50 m. Nodes with SF 12 are usually far from the gateway (1344 m at most), which implies that two nodes are likely to be more than 50 m away when there are few nodes. That is, nodes are hidden from each other, meaning that a node senses a channel is empty all the time and starts transmitting data immediately. However, there are only 22 nodes with SF 12 that send data packets every 180 s. This minimizes the possibility that two nodes send data simultaneously. Moreover, a signal at SF 12 is orthogonal to them at other SFs, avoiding another possibility for collision. These conditions result in high PDR performance. With 3000 nodes, on the other hand, the performance for SF 12 decreases from 62% to 45% as the threshold value increases from dBm to dBm. Recall that dBm at SF 12 indicates a detection range of 1344 m and that nodes with SF 12 are deployed at a distance between 1197 m and 1344 m from the gateway. Even with dBm, more than 50% of the nodes are still hidden from a given node. This leads to low performance. When the threshold value decreases to dBm, neighboring nodes that were within the detection range are now out of range. This increases the possibility for collision, resulting in a 45% performance.
As the number of nodes increases, performance degrades. The higher the SF value, the lower the PDR. An interesting observation is made for the SF 7 nodes. With 3000 nodes, PDR performance for SF 7 nodes goes below that for SF 8 nodes when the threshold becomes higher than dBm. It performs even worse than that for SF 9 nodes after a threshold of dBm. This is mainly attributed to the huge number of SF 7 nodes; around 1,380 nodes at SF 7 are deployed while there are 250 nodes and 300 nodes at SF 8 and 9, respectively. As the threshold increases, the detection range decreases, which prevents an SF 7 node from detecting that neighboring nodes are transmitting. This results in packet collision because there are many SF 7 nodes nearby. With 1500 nodes, on the other hand, fewer nodes are deployed, and thus, this hidden terminal problem barely affects PDR performance.
To highlight the impact of threshold values on MAC performance, the experiment presented in this subsection stresses the network more by reducing the data period from 180 to 60 s. The experimental results are shown in Figure 17b. With 3000 nodes, performance degradation for SF 7 nodes becomes noticeable; the PDR is 56% for a threshold of dBm. The graphs also illustrate that performance appears best at dBm for most cases of SF values and stabilizes after −120∼−110 dBm. This implies a recommended setting for the threshold value for LBT sensing of less than dBm for the best performance. It is also noted that when comparing the results in Figure 17a, lower PDR performance does not mean lower network performance. When using the longer period of 180 s, fewer data are transmitted, ultimately decreasing network use. Therefore, the possibility for collision decreases, although there are hidden terminals, minimizing the impact of the threshold value on PDR performance.
5.4. Impact of Back-Off Algorithm on LoRa
The aim of the fourth experiment is to examine how a back-off algorithm affects LoRa MAC performance. To this end, we configure the parameters that are shown in Table 6 (Exp.D) and described in this subsection. This experiment especially focuses on two parameters: the number of continuous sensing counts and a contention window (CW) algorithm. Neither parameter is defined in the LoRa regional parameters and regulations.
When sensing a channel in use, a node with LBT hops to another channel, randomly selected out of 7 available ones, and again senses the new channel’s condition. When all the channels are unavailable, the node continuously jumps over the channels until the occupation of a channel is released, which enables data transmission. At the same time, this situation, however, can worsen MAC performance because more transmission attempts intensify the competition for medium access. It is needed to limit the number of sensing counts. To scrutinize this behavior in LoRa, the experiment increases the number of continuous sensing counts from 0 to 10. A sensing count of 0 means that the node does not run LBT; that is, it starts transmitting data immediately without sensing.
Another problem arises when multiple nodes are waiting for the same channel to be released. As soon as the channel is released, several nodes attempt to transmit data simultaneously; data from two or more nodes lead to collisions. To mitigate this problem, most medium access control techniques introduce a back-off time based on a CW, which has not yet been applied to LoRa. This experiment run with three different CW algorithms. First, a fixed CW uses a fixed-size congestion window in which a maximum contention window () is fixed. Then, a node selects a random time from 0 s to for which it backs off before transmitting data. Initially, is set to 4 s, which is the maximum transmission time allowed by the regulations. Next, an exponential CW dynamically changes by using network feedback. It initially sets to 4 s and increases the value by a factor of 2 as the count of sensing trials at a node increases. The node randomly selects the back-off time in the CW range. Lastly, a ToA CW is the same as a fixed CW except that each node sets its own according to its SF vale. A node with SF 12 sets to 4 s, which is equal to the maximum time-on-air time at SF 12. In this way, a node with SF 7 sets to 1 s. The node randomly selects the back-off time in the CW range.
With the initial settings, our first experiment reveals that the PDR results remain the same for all numbers of sensing counts and for all algorithms. A careful investigation reveals that the initial of 4 s is too long. Moreover, having 7 available channels allows nodes to find an empty channel easily without sensing more than two consecutive times. To resolve the issue, we adjust the number of available channels from 7 to 3 and varied from 10 ms to 800 ms with a 10 ms interval. For the ToA CW, at each node was set to the real time-on-air time with 32 bytes of payload length given its SF value. In this way, the nodes with SF 7, 8, 9, and 12 set the value of to 66 ms, 123 ms, 226 ms, and 1428 ms, respectively. Figure 18 and Figure 19 illustrate the experimental results for a of 10 ms and 20 ms. We omit the results for the cases with a of longer than 20 ms because they do not show meaningful differences in performance. The left, middle, and right graphs in the figures show the results of fixed CW, exponential CW, and ToA CW algorithms, respectively.
The performance at higher SF nodes (10–12) does not change meaningfully with the increasing number of sensing counts. It is also not affected by the CW size. These findings imply that the back-off algorithm does not influence performance at higher SF nodes, but rather that it is primarily affected by other factors, such as the data period and payload length.
With respect to the ToA CW algorithm, the two graphs on the right in the figures are the same because does not change. The graph reveals that the PDR at SF 7 nodes becomes stable after reaching a sensing count of 5 and is greater than that at SF 8 and 9 nodes. Moreover, the PDR is lower than that at SF 8 nodes. The huge number of SF 7 nodes and the short (66 ms) explain these results: severe contention occurs among many SF 7 nodes, and thus, it takes time to detect an empty channel (i.e., more trials of sensing are needed). In the case of SF 8, contention is avoided after two consecutive sensing counts since there are fewer nodes (250 nodes). A similar pattern appears for SF 9 nodes (300 nodes) but with a worse PDR performance. The difference is mainly attributed to the relationship between the data period and their . Nodes at SF 9 send data every 60 s but must wait two times longer (226 ms at max) than the duration with SF 8 nodes. This increases the possibility of contention.
Regarding the fixed CW algorithm with a of 10 ms, PDR performance at low SF nodes (7–9) varies within a 10% range for all the sensing counts except for 0 (see the left graph in Figure 18). A short and fixed value explains this pattern. Each node retries data transmission after waiting for a very short back-off time, and these retransmission attempts quickly saturate the network capacity. Moreover, since is fixed, the intensity of contention does not lessen, even though the sensing count increases. When doubling to 20 ms, PDR performance rises with the increasing sensing count, as shown in the left graph in Figure 19. In particular, PDR performance at SF 7 nodes continuously increases. This indicates that a longer back-off time can lessen the network contention that occurs when a node keeps trying to transmit data. It is noted that with a sensing count of 10, PDR performance (85%) becomes as good as the maximum performance at SF 7 nodes with the ToA algorithm (see the right graph of the same figure). Recall that SF 7 nodes in two algorithms use fixed values: 66 ms and 20 ms. When using 66 ms, PDR saturates at a sensing count of 5 as compared with saturating at a sensing count of 10 when using a 20 ms back-off time. This indicates that the maximum performance of 85% in the fixed algorithm is a saturated value.
The exponential algorithm changes dynamically, unlike the other two. Figure 19 allows us to compare its performance at low SF nodes to the performance of the other two algorithms more accurately. In particular, the PDR at SF 7 nodes outperforms the others. Having a huge number of SF 7 nodes implies severe contention that can be alleviated by increasing gradually. Please note that the PDR exceeds 90% with a sensing count of more than 8. With nodes at SF 8 and 9, the exponential algorithm shows similar performance to that of the other fixed algorithms. Notably, when comparing performance at SF 8 nodes in the exponential and ToA algorithms, the former achieves a 90% PDR with a sensing count of 2 while the latter does so with a sensing count of 4. The difference is mainly attributed to the back-off time. is set to 123 ms in the ToA algorithm, in which a back-off time longer than 123 ms is reached after 4 sensing trials. This leads to the conclusion that a back-off time of around 123 ms should be set for SF 8 nodes to achieve 90% of the performance requirement with 250 nodes. Alternatively, the sensing count must be increased 4-fold. Comparing the two middle graphs in the figures allows us to examine the impact of on the exponential algorithm. The longer the , the better the performance; two average results (marked ALL) show the difference, and it is not that much. To investigate the impact, Figure 20 plots the performance curves with five different values. With 20 ms of , the algorithm performs slightly better than that with 10 ms. However, further increasing scarcely improves performance. It is also observed that the PDR stays constant after a sensing count of 8.
6. Deploying LoRa Gateway(s) on Campus
This section proposes a gateway deployment strategy to build the LoRa network for the smart energy campus scenario. We note that the proposed strategy shows an example of how the experimental results of this paper are applied to application requirements. In a similar way, one can use the resulting data to develop his/her own strategy. Table 7 lists the application parameters in our campus scenario. The campus is expected to deploy about 3000 nodes from which an energy application collects (non-)energy data every 15 s. Data are at most 32 bytes in size and must be transmitted within 300 ms. The application tolerates a network that has more than 90% communication reliability.
In a LoRa system with a 125 kHz bandwidth, it is not possible to use high SF settings (10–12) because they fail to satisfy the latency requirement of 300 ms for 32-byte data. This indicates that SF values are assigned to nodes differently. To this end, the following two types of parameters are considered. The communication range is limited to a maximum of 894.6 m (90% of reliability in Table 5). We compute ToA to ensure that the ToA value satisfies the latency requirement for 32-byte payload for each SF value. To this end, we use the following equation.
represents the number of programmed preamble symbols. denotes the number of symbol byte in payload and is determined by the payload length, the SF value, the presence of header, Adaptive Data Rate (ADR), and the CR value. represents a symbol duration. and are computed as follows:
Equations (4) and (6) show that the symbol duration increases when the SF value is increased, which leads to the increase of ToA. Table 8 summarizes ToA values with SF values. It unveils that SF 10–12 do not satisfy the latency requirement of 300 ms so that they cannot be used in the testbed. Figure 21 highlights 3000 nodes deployed on the campus testbed; the gateway is at the center, and low SF values are only assigned to nodes. When a SF 9 node transmits a packet, four SF 7 nodes and two SF 8 nodes on the same channel can send packets in sequence. Thus, SF 7 is assigned by 4/7 among all the nodes; similarly, SF 8 by 2/7 and SF 9 by 1/7. In this way, the campus has 57.1%, 28.6%, and 14.3% of SF 7, 8, and 9 nodes, respectively.
With a new SF assignment strategy that uses low SF values only, this section presents an experiment conducts with the parameters in Table 7. The number of nodes is increased from 0 to 3000 after setting the data period to 15 s, and then the PDR is recorded. As shown in Figure 22, the PDR decreases as the number of nodes increases; in particular, performance degrades sharply when there are more than 1500 nodes. Since the area becomes small in size, increasing the number of nodes intensifies the contention, resulting in an unfavorable performance (lower than 20%) with 3000 nodes. The figure also reflects that the maximum number of nodes that a gateway can handle is limited to 1670 to meet the 90% reliability requirement. This implies that more than two LoRa gateways must be deployed to connect to 3000 nodes on the campus.
It is noted that having more gateways means that some nodes are connected to two gateways simultaneously, leading to communication redundancy and thus improved reliability. At the same time, however, this requires advanced scheduling schemes and data processing modules, which can increase the complexity of the LoRa system. We leave this issue as future research work.
7. Discussion
This section discusses the limitations of this study and addresses application aspects of our research outcomes.
7.1. Limitations of Experiments and Simulations
This paper examines the parameters that influence LoRa PHY performance. We note that the hardware also affects the performance and is not discussed here. The received power in wireless communication is expressed as follows:
where represents transmitted power; and are the gains of the transmitting and receiving antennas, respectively; denotes wavelength; and d is the distance between two antennas. Because the maximum EIRP in LoRa is limited to 14 dBm in Korea, the transmission power should be suppressed to maintain the same EIRP if the antenna gain were to increase. As shown in Equation (7), however, high antenna gain can increase the received power at the receiver. M represents the hardware gain of the receiver influencing the strength of the received power. A hardware product that offers high gain must be selected as long as the cost allows. It is noted that the antenna gain used in the experiments is 3 dBi, for instance. If the testbed uses another antenna with a higher gain, the maximum communication range can increase. For example, using an antenna with a 10 dBi gain can extend the range from 1.34 to 2 km while satisfying the communication reliability requirement of 90%. However, a higher antenna gain comes with an increase in size, resulting in high costs and physical limitations.
This paper adopts the simplified path loss model in Equation (2). This model has been used for approximating path loss in the outdoor environment and provides general analysis for various systems. Most of the models, including the aforementioned, however, have not been proved to accurately predict the path loss in an indoor environment. In fact, it has been a challenge to develop an accurate path loss model for an indoor environment because the path loss properties inside a building are uncertain. Recent research has studied an IDP model [27,29] that considers every structural detail of a building to examine the properties. In the campus scenario, which includes a few buildings, it may not be possible to apply the model to all the buildings. Therefore, combining other methods with the model is expected to obtain more accurate results for the combined indoor and outdoor environment.
The lack of accurate models for an indoor environment is another limitation in our approach, nevertheless. Suppose that several nodes are deployed inside a building in which many people move around. Signal properties become completely random, and signal strength thus fluctuates. Figure 11 shows the variance of received signal strength when conditions are crowded. In this context, we estimated the communication range in the most conservative manner. One interesting observation, then, is that signal performance somewhat depends on the distance between a node and a gateway, and this finding is represented by the simplified model. However, we do not argue that our observations are finalized. A dense deployment of nodes may cause an unexpected drop in PDR performance, and measurements in a large area (e.g., at the city level) have not been examined yet. One finding from the experimental results is that our campus (600 × 600 m) needs to deploy two LoRa gateways primarily because of packet collision. This implies that the benefit of long-range communication in LoRa is somewhat limited and suggests that a new network strategy must consider the way by which multiple gateways can be managed.
7.2. Application Aspects of LoRa Deployment
LoRa will enjoy a variety of IoT applications, such as smart agriculture, smart cities, smart environments, smart healthcare, and smart buildings, all of which are expected to enhance the efficiency of business and improve our quality of life [30]. For instance, smart farming integrated with IoT technologies can measure the environmental conditions that affect crop production and to continuously monitor the health of livestock. This eventually reduces the environmental impact, maximizes yields, and minimizes costs. A smart city provides a framework in which advanced services for citizens are connected in such a way that they are expected to enhance the comfort of city life. These city services include lighting control, parking management, waste management, environmental monitoring, and smart metering. It is noted that different applications and services have dissimilar requirements for communication networks, indicating that different strategies for network deployment must be established. Smart traffic, for instance, requires a network to handle users’ mobility, whereas a network in the smart city must be able to support long-distance communications [31].
This study proposes a strategy for deploying gateways and nodes to configure LoRa networks for a smart energy campus. The smart campus scenario can be easily expanded to the smart city concept; a countless number of sensors, deployed in a wide area, generate data streams that are then collected and analyzed, enabling the management of city assets and resources more efficiently. In such a large-scale application, it may not be easy to find path loss models for every geographical section, analyze communication performance accurately, and combine the results to establish a network. Instead, our approach of adopting a simplified model to evaluate performance in a more comprehensive manner can benefit the application.
8. Conclusions
LoRa is expected to provide long-range communication (up to several kilometers) with low power and low cost. This will enable us to communicate easily with the countless pervasive IoT devices that have been disconnected or connected only via an expensive cellular network. A LoRa network, once established correctly, will lead to the emergence of sophisticated IoT services. Existing research has revealed several fundamental properties of LoRa. However, some research questions that are confronted when establishing a LoRa network on a real-world application testbed have yet to be unanswered. “What is the communication range of LoRa in a combined indoor and outdoor environment?”, “How do national regulations and application parameters influence LoRa performance?”, “Do we need to install more than two LoRa gateways on our campus?” To answer these questions, we built a real-world LoRa testbed and ran experiments that enabled us to find a simplified path loss model for LoRa PHY, revealing that the radio signal could reach up to 630–1344 m with various SF values in the combined environment. This paper also enumerates the impacts of the transmission period, payload size, and LBT on LoRa MAC performance after conducting intensive experiments and analyses. Based on the experimental results, it is recommended that the data period and the number of nodes are adjusted together to achieve the communication reliability requirement. Another result shows that a sensing threshold of dBm in the Korean regulations does not work well in LoRa. The results suggest optimal values for channel sensing and the LBT threshold and demonstrate that an exponential back-off algorithm outperforms others in LoRa. Taking into consideration both experimental results and the corresponding analyses, it is concluded that the campus needs to install two LoRa gateways to reach 3000 nodes while satisfying performance requirements of the smart energy application.
This paper finds room for performance advancement. For instance, an adaptive, dynamic back-off algorithm can be applied to LoRa, and such an action is expected to improve LoRa MAC performance. Once multiple gateways are equipped, nodes communicate with more than two gateways simultaneously, introducing a communication redundancy issue. Then, advanced scheduling and data processing algorithms must be developed to deal with these issues. These are interesting topics that remain to be studied in future research.
Author Contributions
E.-K.L. contributed to conceptualization, project administration, and validation; D.-H.K. contributed to software, data curation, and visualization; and J.K. contributed to investigation. All authors together contributed to all parts of writing.
Funding
This research was supported by the Korea Institute of Energy Technology Evaluation and Planning (KETEP) and the Ministry of Trade, Industry and Energy (MOTIE) of the Republic of Korea (No. 20168530050030).
Conflicts of Interest
The authors declare no conflict of interest.
Abbreviations
The following abbreviations are used in this manuscript:
| CR | Coding Rate |
| CSS | Chirp Spread Spectrum |
| CW | Congestion Window |
| LBT | Listen Before Talk |
| LoRa | Long Range |
| LoRaWAN | LoRa Wide Area Network |
| LPWAN | Low-Power Wide Area Network |
| MAC | Medium Access Control |
| PDR | Packet Delivery Ratio |
| PHY | Physical layer |
| SF | Spreading Factor |
| RSSI | Received Signal Strength Indication |
| ToA | Time on Air |
References
- Atzori, L.; Iera, A.; Morabito, G. The internet of things: A survey. Comput. Netw. 2010, 54, 2787–2805. [Google Scholar] [CrossRef]
- Kraijak, S.; Tuwanut, P. A survey on IoT architectures, protocols, applications, security, privacy, real-world implementation and future trends. In Proceedings of the 11th International Conference on Wireless Communications, Networking and Mobile Computing, Shanghai, China, 21–23 September 2015. [Google Scholar]
- Semtech LoRa Technology. Available online: https://www.semtech.com/lora (accessed on 29 January 2019).
- SX1272/73 Datasheet. Available online: https://lora-alliance.org/ (accessed on 29 January 2019).
- LoRa Alliance Technical Committee. LoRaWAN Specification, Version 1.1; LoRa Alliance, Inc.: Beaverton, OR, USA, 2017. [Google Scholar]
- A Technical Overview of LoRa and LoRaWAN, LoRa Alliance Technical Marketing Workgroup 1.0. Available online: https://lora-alliance.org/sites/default/files/2018-04/what-is-lorawan.pdf (accessed on 29 January 2019).
- Watteyne, T.; Mehta, A.; Pister, K. Reliability through frequency diversity: Why channel hopping makes sense. In Proceedings of the 6th ACM Symposium on Performance Evaluation of Wireless Ad Hoc, Sensor, and Ubiquitous Networks, Tenerife, Spain, 28–29 October 2009; pp. 116–123. [Google Scholar]
- All About LoRa and LoRaWAN. Available online: http://www.sghoslya.com/ (accessed on 29 January 2019).
- Advanced Communications and Sensing Products Division. LoRa Modem Design Guide, rev.1; Semtech Corporation: Camarillo, CA, USA, July 2013. [Google Scholar]
- Pop, A.I.; Raza, U.; Kulkarni, P.; Sooriyabandara, M. Does bidirectional traffic do more harm than good in LoRaWAN based LPWA networks? In Proceedings of the GLOBECOM 2017-2017 IEEE Global Communications Conference, Singapore, 4–8 December 2017; pp. 1–6. [Google Scholar]
- LoRaWAN Security. Available online: https://lora-alliance.org/sites/default/files/2018-04/lora_alliance_security_whitepaper.pdf (accessed on 29 January 2019).
- LoRa Alliance Technical Committee Regional Parameters Workgroup. LoRaWAN™ Regional Parameters, Version 1.1rB; LoRa Alliance, Inc.: San Ramon, CA, USA, January 2018. [Google Scholar]
- Korean Rule for Wireless System, No.2016-52. Available online: https://www.kca.kr/open_content/bbs.do? act=detail&msg_no=191&bcd=propagation (accessed on 29 January 2019). (In Korean).
- Noreen, U.; Bounceur, A.; Clavier, L. A study of LoRa low power and wide area network technology. In Proceedings of the 2017 International Conference on Advanced Technologies for Signal and Image Processing (ATSIP), Fez, Morocco, 22–24 May 2017; pp. 1–6. [Google Scholar]
- IoT Portal, SK Telecom. Available online: https://www.sktiot.com/iot/main/index (accessed on 29 January 2019).
- Augustin, A.; Yi, J.; Clausen, T.; Townsley, W.M. A study of LoRa: Long range & low power networks for the internet of things. Sensors 2016, 16, 1466. [Google Scholar]
- Wixted, A.J.; Kinnaird, P.; Larijani, H.; Tait, A.; Ahmadinia, A.; Strachan, N. Evaluation of LoRa and LoRaWAN for wireless sensor networks. In Proceedings of the 2016 IEEE SENSORS, Orlando, FL, USA, 30 October–3 November 2016; pp. 1–3. [Google Scholar]
- Erbati, M.M.; Schiele, G.; Batke, G. Analysis of LoRaWAN technology in an Outdoor and an Indoor Scenario in Duisburg-Germany. In Proceedings of the 2018 International Conference on Computer and Communication Systems (ICCCS), Nagoya, Japan, 27–30 April 2018; pp. 273–277. [Google Scholar]
- Neumann, P.; Montavont, J.; Noël, T. Indoor deployment of low-power wide area networks (LPWAN): A LoRaWAN case study. In Proceedings of the 2016 IEEE 12th International Conference on Wireless and Mobile Computing, Networking and Communications (WiMob), New York, NY, USA, 17–19 October 2016; pp. 1–8. [Google Scholar]
- Adelantado, F.; Vilajosana, X.; Tuset-Peiro, P.; Martinez, B.; Melia-Segui, J.; Watteyne, T. Understanding the limits of LoRaWAN. IEEE Commun. Mag. 2017, 55, 34–40. [Google Scholar] [CrossRef]
- Van den Abeele, F.; Haxhibeqiri, J.; Moerman, I.; Hoebeke, J. Scalability analysis of large-scale LoRaWAN networks in ns-3. IEEE Internet Things J. 2017, 4, 2186–2198. [Google Scholar] [CrossRef]
- To, T.H.; Duda, A. Simulation of lora in ns-3: Improving lora performance with csma. In Proceedings of the IEEE International Conference on Communications, Beijing, China, 16–18 August 2018; pp. 1–7. [Google Scholar]
- MultiConnect® mDot™ MTDOT-915-X1P-SMA-1. Available online: https://www.multitech.com/models/94557148LF (accessed on 29 January 2019).
- SX1272/73 Datasheet. Available online: https://www.semtech.com/uploads/documents/SX1272_DS_V4.pdf (accessed on 29 January 2019).
- MultiConnect® Conduit™ MTCDT-247A. Available online: https://www.multitech.com/models/94557274LF (accessed on 29 January 2019).
- Phillips, C.; Sicker, D.; Grunwald, D. A survey of wireless path loss prediction and coverage mapping methods. IEEE Commun. Surv. Tutor. 2013, 15, 255–270. [Google Scholar] [CrossRef]
- Applegate, D.; Archer, A.; Johnson, D.S.; Nikolova, E.; Thorup, M.; Yang, G. Wireless coverage prediction via parametric shortest paths. arXiv, 1805; arXiv:1805.06420. [Google Scholar]
- Goldsmith, A. Wireless Communications; Cambridge University Press: Cambridge, UK, 2005. [Google Scholar]
- Wölfle, G.; Wahl, R.; Wertz, P.; Wildbolz, P.; Landstorfer, F. Dominant path prediction model for indoor scenarios. In Proceedings of the German Microwave Conference (GeMIC), Ulm, Germany, 5–7 April 2005; Volume 27. [Google Scholar]
- LoRaWAN Applications. Available online: https://www.semtech.com/lora/lora-applications (accessed on 29 January 2019).
- Khutsoane, O.; Isong, B.; Abu-Mahfouz, A.M. IoT devices and applications based on LoRa/LoRaWAN. In Proceedings of the Annual Conference of the IEEE Industrial Electronics Society, Beijing, China, 29 October–1 November 2017; pp. 6107–6112. [Google Scholar]
Figure 1.
The LoRaWAN (MAC) protocol stack is implemented on top of LoRa modulation (PHY). The figure draws the corresponding concept in [6].
Figure 1.
The LoRaWAN (MAC) protocol stack is implemented on top of LoRa modulation (PHY). The figure draws the corresponding concept in [6].

Figure 2.
A LoRa network consists of nodes, gateways, network servers, and application servers. The figure draws the corresponding concept in [6].
Figure 2.
A LoRa network consists of nodes, gateways, network servers, and application servers. The figure draws the corresponding concept in [6].

Figure 3.
LoRa uses a chirp spread spectrum modulation technique. The figure also shows that LoRa symbols are modulated over an up-chirp of a 125 kHz bandwidth, and SF 9 takes exactly twice the time of SF 8. The figure was generated using the code in [8].
Figure 3.
LoRa uses a chirp spread spectrum modulation technique. The figure also shows that LoRa symbols are modulated over an up-chirp of a 125 kHz bandwidth, and SF 9 takes exactly twice the time of SF 8. The figure was generated using the code in [8].

Figure 4.
The airplane view of the university’s campus, which is around 600 × 600 m in size. A yellow dot represents Building #7, where a LoRa gateway is installed.
Figure 4.
The airplane view of the university’s campus, which is around 600 × 600 m in size. A yellow dot represents Building #7, where a LoRa gateway is installed.

Figure 5.
A solar panel and solar irradiance sensors are equipped on the roof of a building on the campus where conventional networks such as Ethernet and Wi-Fi are not connected. A LoRa node (the gray enclosure below the panel) collects and sends related data to a data server via LoRa communication.

Figure 6.
The LoRa gateway used in experiments is installed on the roof of a five-story building about 15 m high. The gateway is placed on top of a reinforced concrete column exposed to the roof of the building, and the roof is surrounded by a parapet and a guardrail.
Figure 6.
The LoRa gateway used in experiments is installed on the roof of a five-story building about 15 m high. The gateway is placed on top of a reinforced concrete column exposed to the roof of the building, and the roof is surrounded by a parapet and a guardrail.

Figure 7.
Experimental setup for the outdoor-only environment: a gateway and a moving node. (a) The gateway (blue dot) is on the roof of Building #7 at a height of about 15 m, and the node (✖ mark) is on the ground 10 m from the gateway. Thus, the straight-line distance between them is 18.028 m; (b) The LoRa node is placed on the ground for experiments and is controlled with a laptop computer that powers the node and feeds it data to send. It transmits 100 packets to the gateway once it stops at a location.

Figure 8.
RSSI (received signal power) values in the outdoor-only environment. The blue x marks represent the measurement data, and the red line draws the estimation of the RSSI with increasing communication distances [m] based on the measurement.
Figure 8.
RSSI (received signal power) values in the outdoor-only environment. The blue x marks represent the measurement data, and the red line draws the estimation of the RSSI with increasing communication distances [m] based on the measurement.

Figure 9.
Experimental setup for combined environment: a gateway and a node with an enclosure. (a) In the second experiment, the gateway stays at the location (Building #7), and nodes (✖ marks) are placed both on the inside and outside of the buildings; (b) A node is protected by a plastic enclosure and placed inside a building.

Figure 10.
RSSI (received signal strength) values in the combined indoor and outdoor environment. The value is computed as 3.956 based on the measurement from which the path loss equation is drawn (the red line). The maximum communication ranges are then estimated as 2 km and 0.95 km.
Figure 10.
RSSI (received signal strength) values in the combined indoor and outdoor environment. The value is computed as 3.956 based on the measurement from which the path loss equation is drawn (the red line). The maximum communication ranges are then estimated as 2 km and 0.95 km.

Figure 11.
Histogram of RSSI values at 4 different locations. (a,b) are recorded at the library and the cafeteria, respectively, where there are few people during experiments. (c,d) are from the crowded cafeteria; the results show that people moving around influence the signal strength. The average/standard deviation values in the histograms are (a) −79.616/3.0862, (b) −97.99/3.0068, (c) −100.51/4.9566, and (d) −93.319/5.4463 for the four locations.

Figure 12.
To estimate the maximum communication ranges more accurately, this section analyzes communication reliability at the maximum distance. The maximum range decreases to 1.34 km to achieve 90% reliability.
Figure 12.
To estimate the maximum communication ranges more accurately, this section analyzes communication reliability at the maximum distance. The maximum range decreases to 1.34 km to achieve 90% reliability.

Figure 13.
A gateway is at the center (0,0), and 3000 nodes are deployed according to a uniformly random distribution in a 2690 × 2690 m area. Nodes have different SF values according to their distance to the gateway.
Figure 13.
A gateway is at the center (0,0), and 3000 nodes are deployed according to a uniformly random distribution in a 2690 × 2690 m area. Nodes have different SF values according to their distance to the gateway.

Figure 14.
Experiments records the PDR as the payload length increases. We split the results based on SF values for each number of nodes.
Figure 14.
Experiments records the PDR as the payload length increases. We split the results based on SF values for each number of nodes.


Figure 15.
PDR rapidly increases and becomes saturated as the data period increases.

Figure 16.
We split the results of PDR values for variable data periods based on SF values for each number of nodes.
Figure 16.
We split the results of PDR values for variable data periods based on SF values for each number of nodes.


Figure 17.
Experiments record PDR as the LBT threshold increases. Graphs capture results with two different data periods, 180 and 60 s, for comparison.
Figure 17.
Experiments record PDR as the LBT threshold increases. Graphs capture results with two different data periods, 180 and 60 s, for comparison.


Figure 18.
We record PDR performance with an increasing number of sensing counts after setting to 10 ms. The left, middle, and right graphs represent the case of fixed, exponential, and ToA algorithms, respectively.
Figure 18.
We record PDR performance with an increasing number of sensing counts after setting to 10 ms. The left, middle, and right graphs represent the case of fixed, exponential, and ToA algorithms, respectively.

Figure 19.
Doubling ultimately affects PDR performance. Please note that the ToA algorithm sets values differently, and thus, the PDR does not change.
Figure 19.
Doubling ultimately affects PDR performance. Please note that the ToA algorithm sets values differently, and thus, the PDR does not change.

Figure 20.
PDR performance in the ToA algorithm increases as the number of continuous sensing counts increases and is saturated after a sensing count of 8. It also compares performances achieved with five different values.
Figure 20.
PDR performance in the ToA algorithm increases as the number of continuous sensing counts increases and is saturated after a sensing count of 8. It also compares performances achieved with five different values.

Figure 21.
A total of 3000 nodes are deployed with a uniform distribution. Low SF values (7–9) are allocated to nodes according to their locations.
Figure 21.
A total of 3000 nodes are deployed with a uniform distribution. Low SF values (7–9) are allocated to nodes according to their locations.

Figure 22.
PDR is measured in an experiment where the area becomes smaller and nodes are set to low SF values only. Performance degrades sharply when there are more than 1500 nodes.
Figure 22.
PDR is measured in an experiment where the area becomes smaller and nodes are set to low SF values only. Performance degrades sharply when there are more than 1500 nodes.


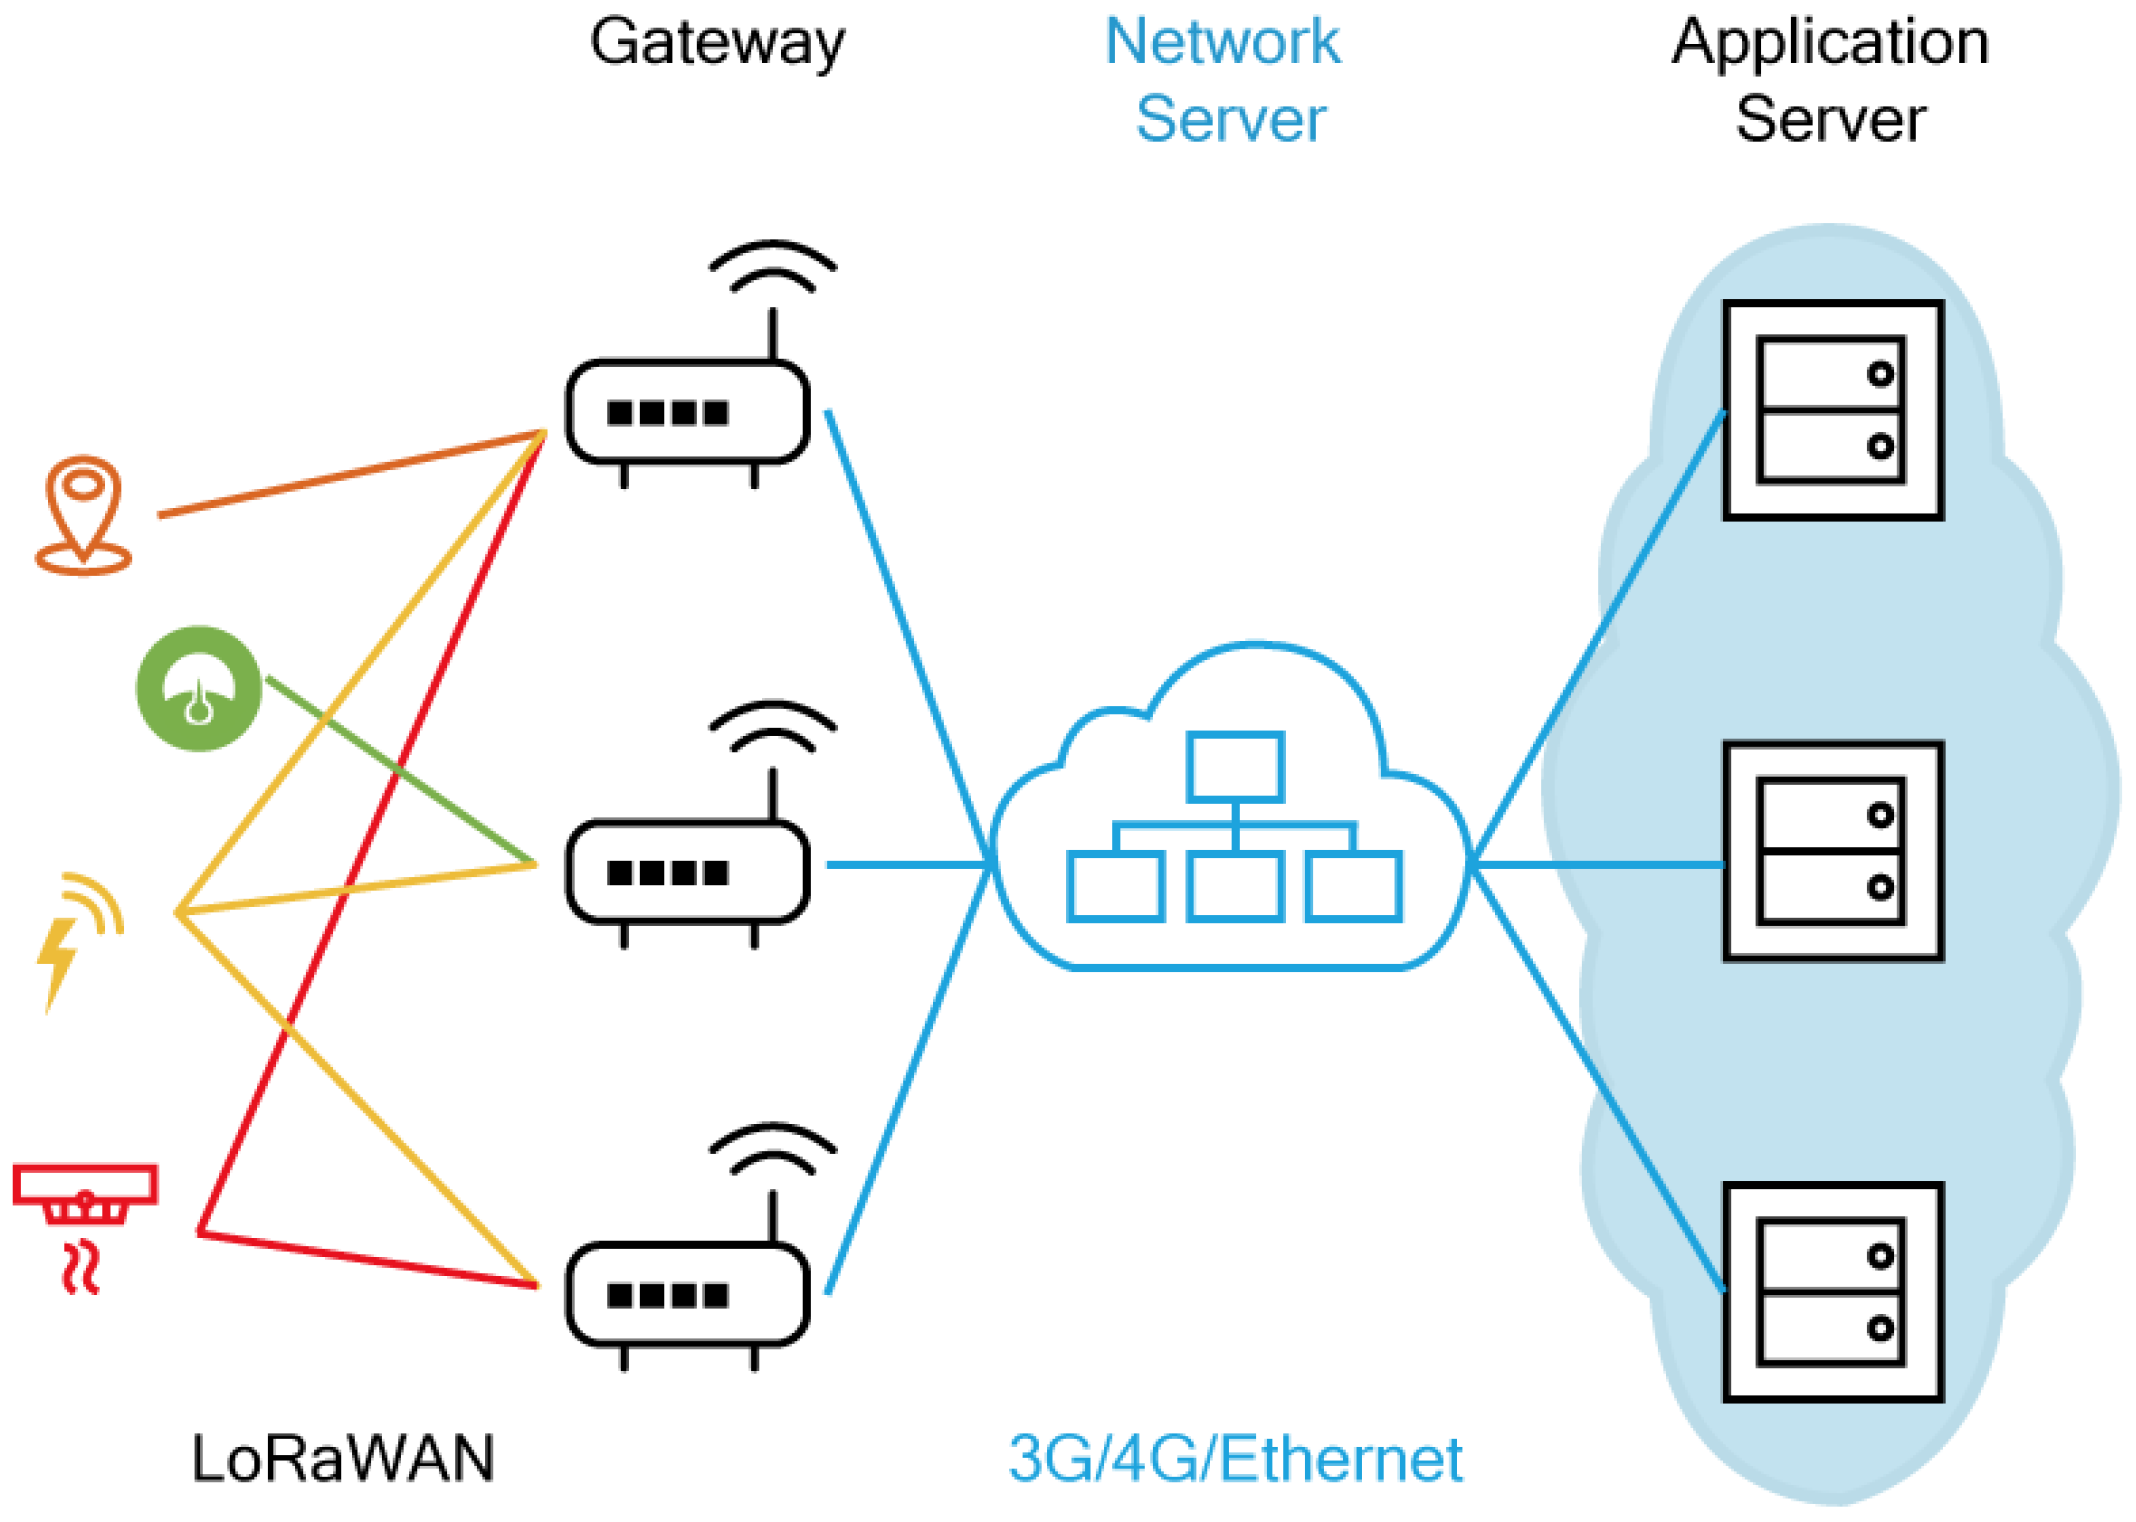
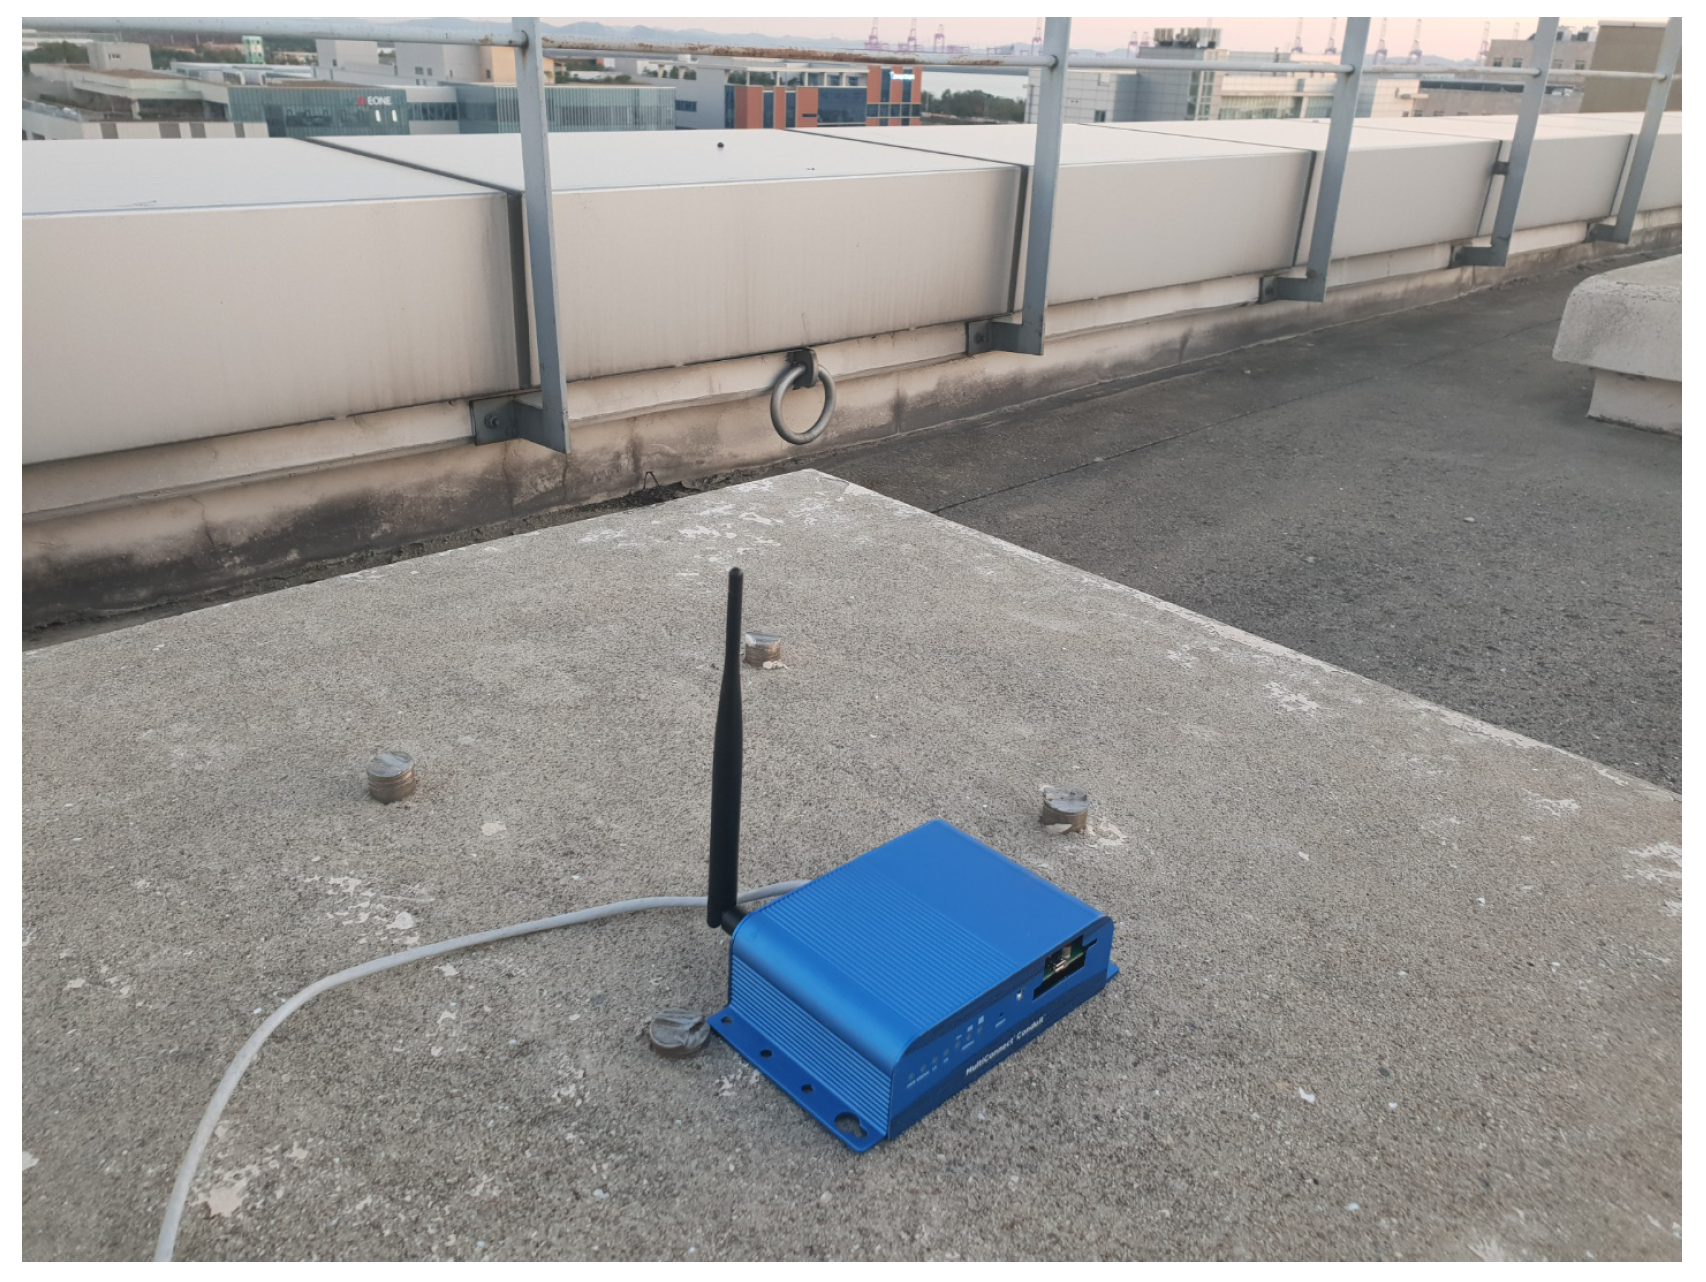
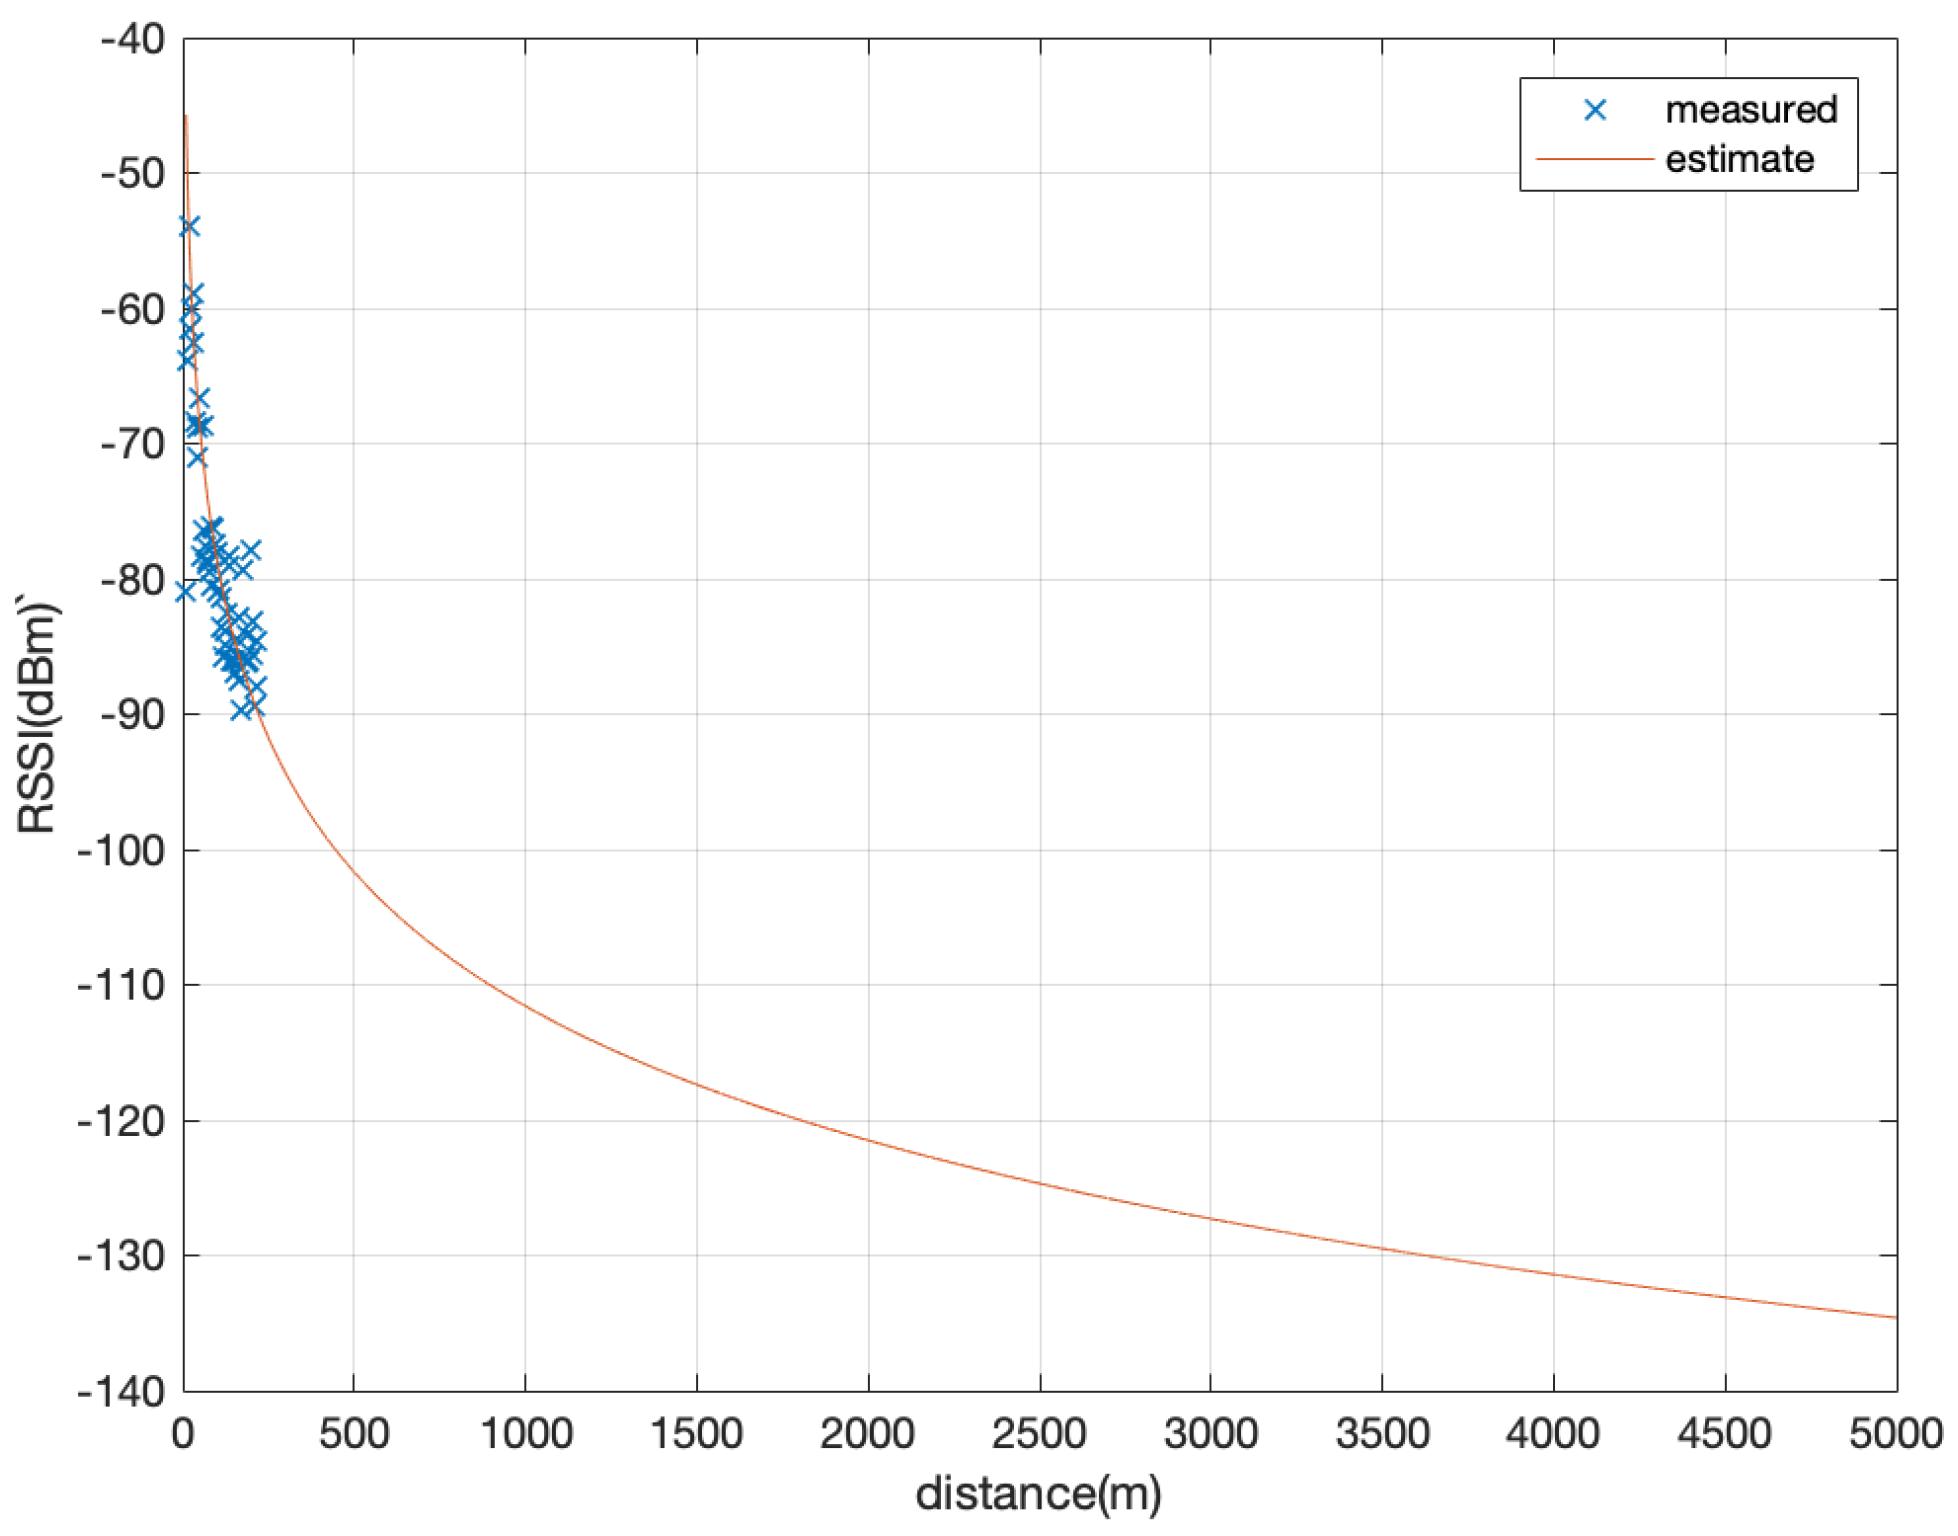
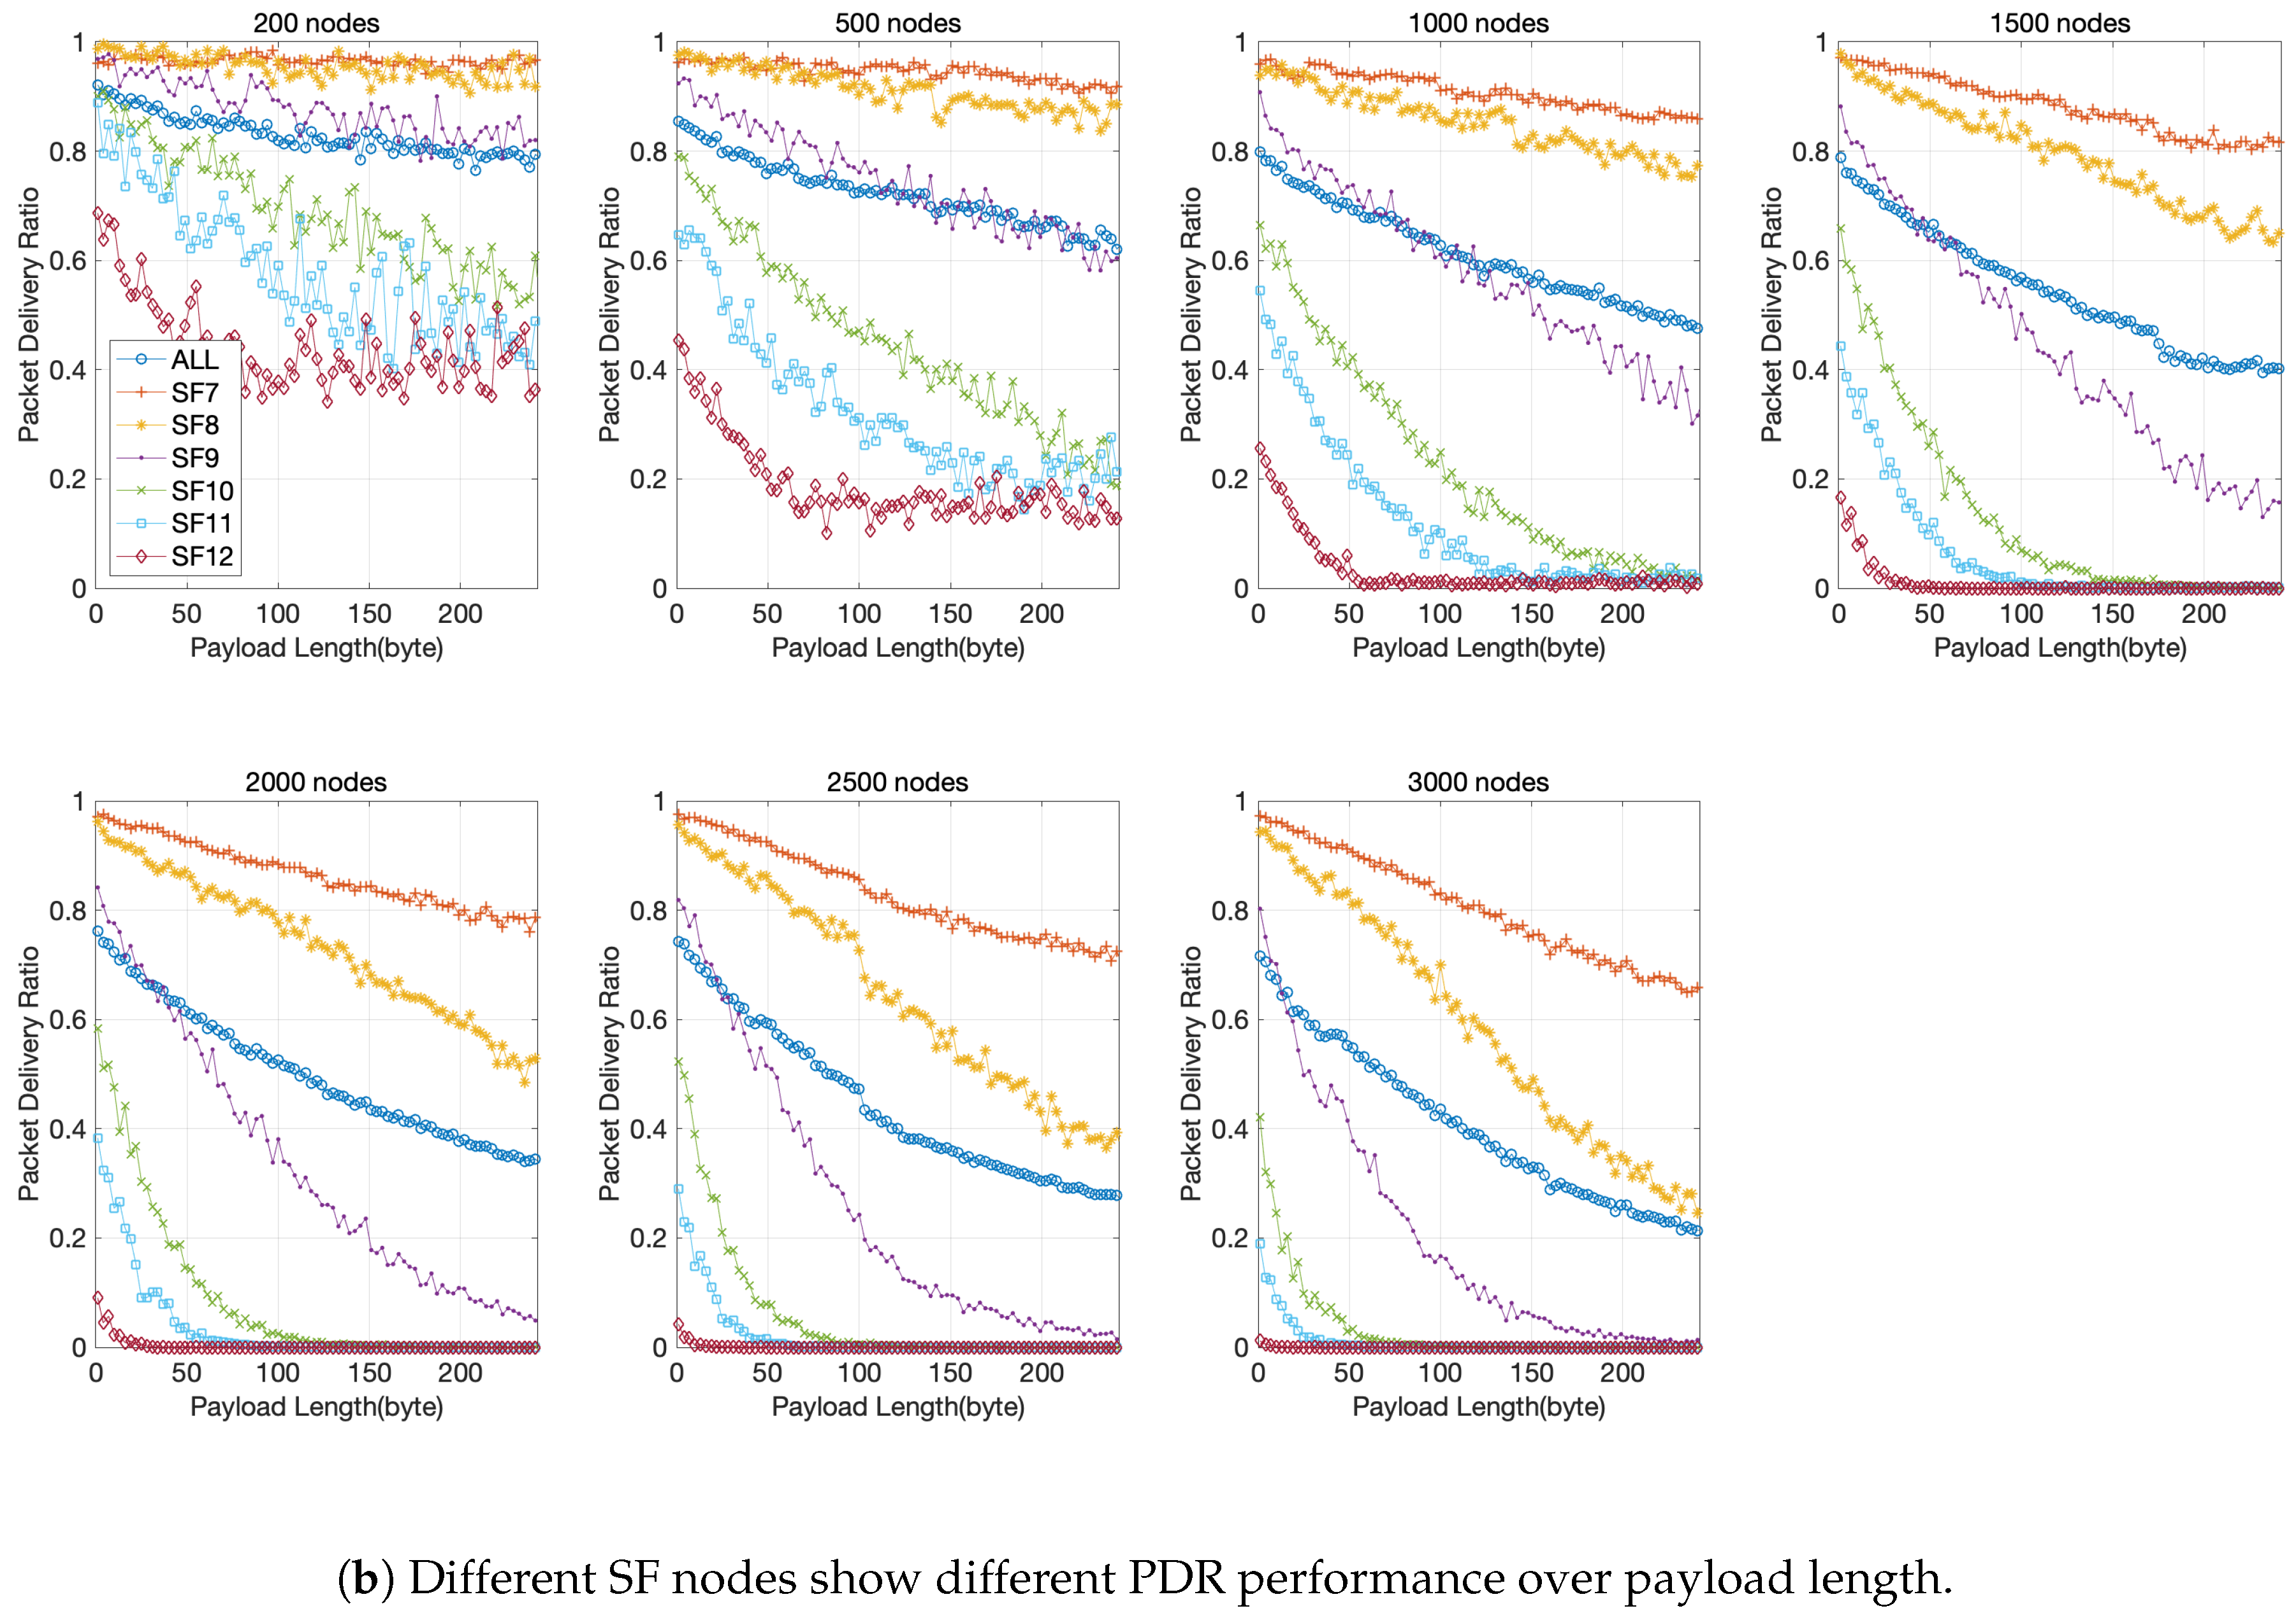
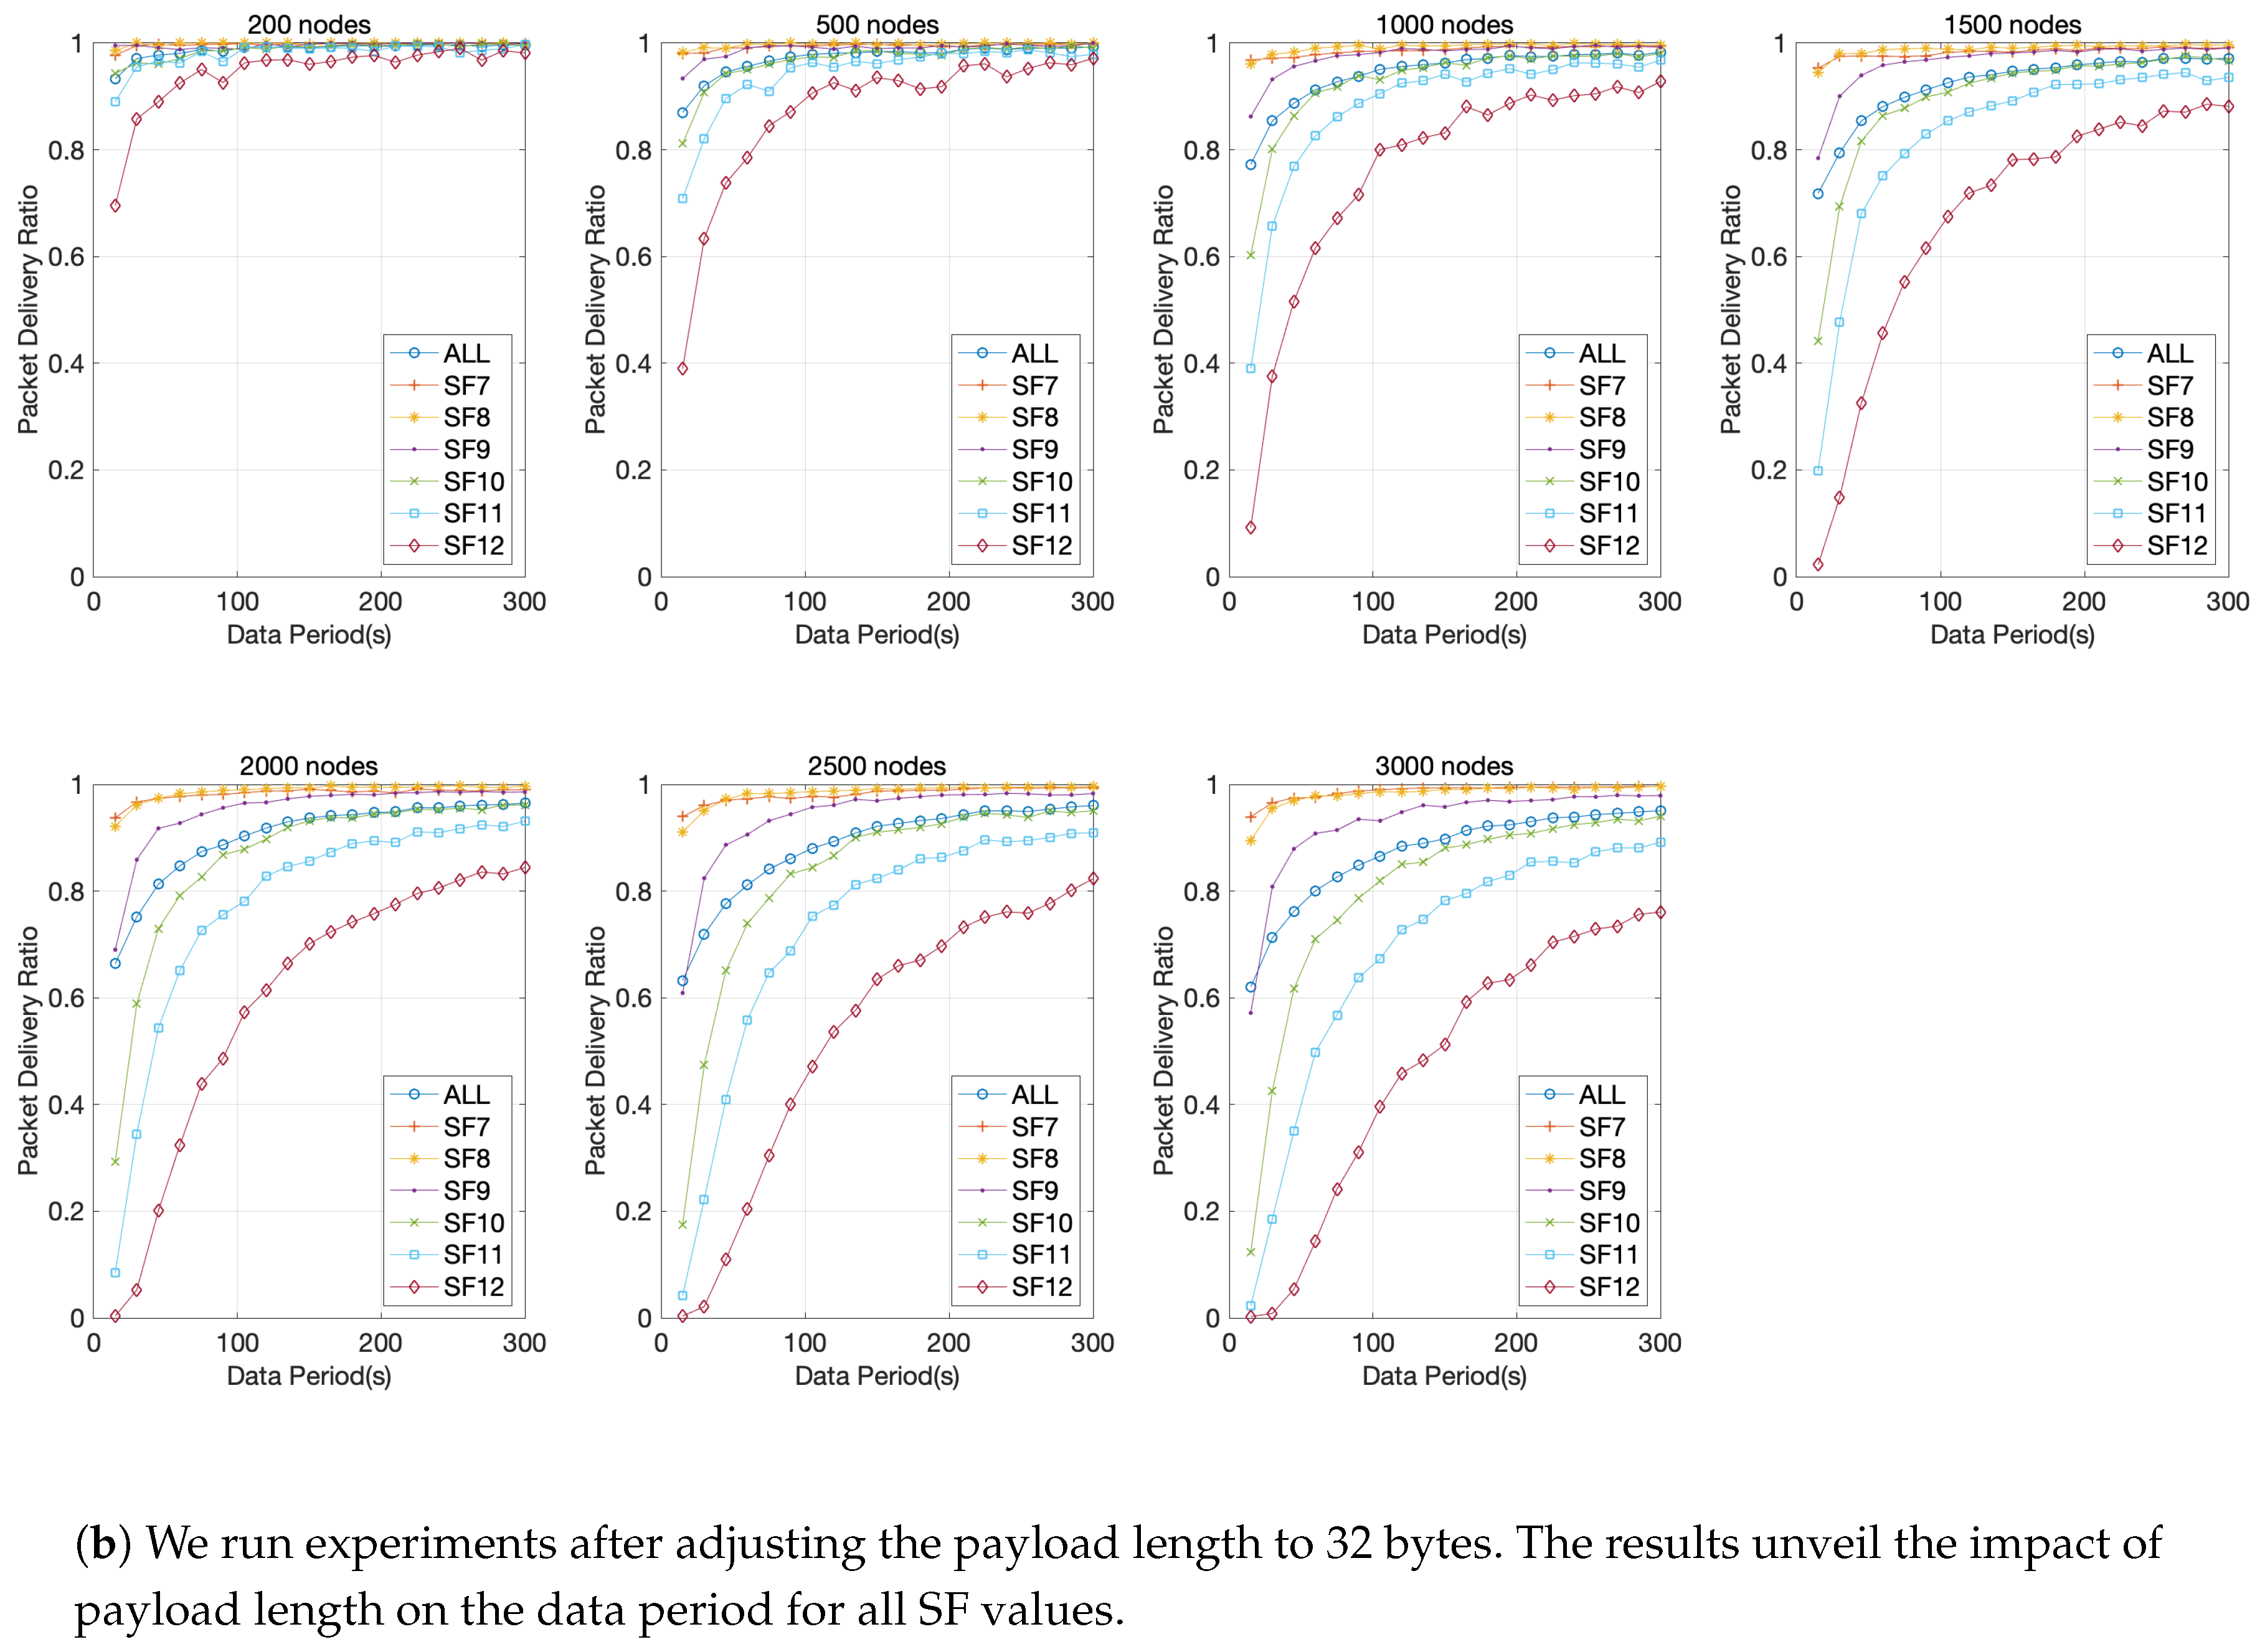
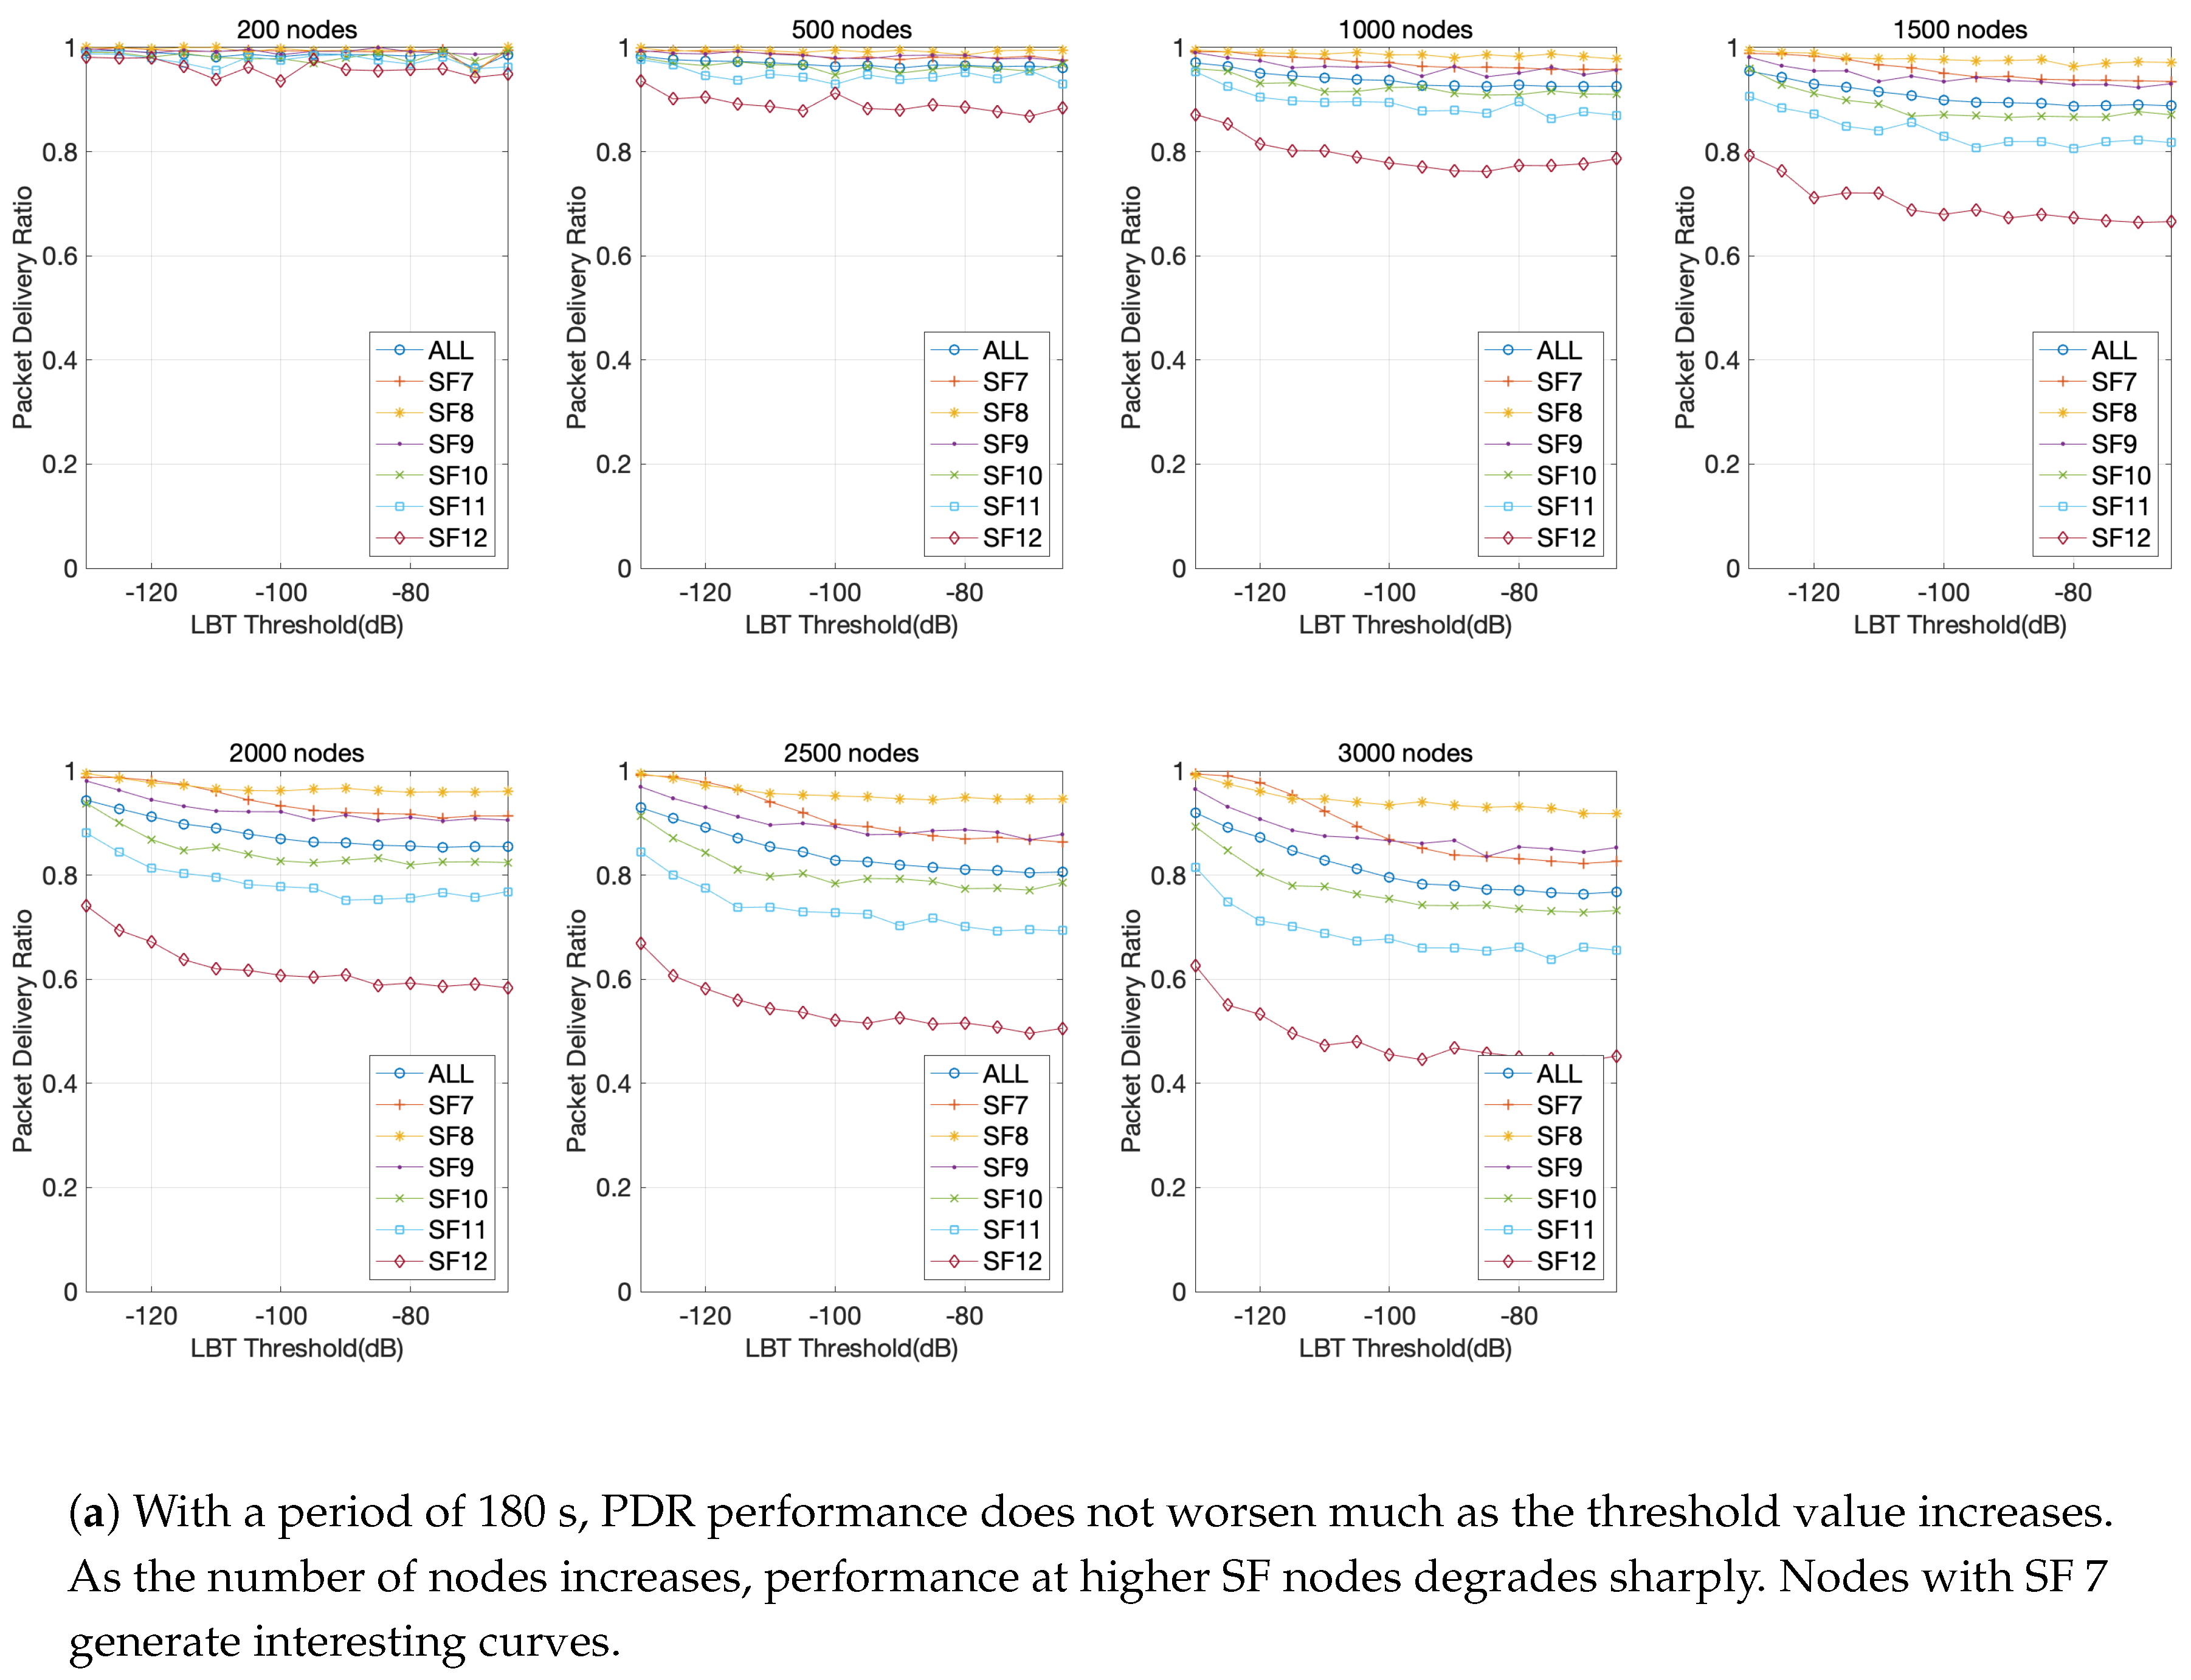
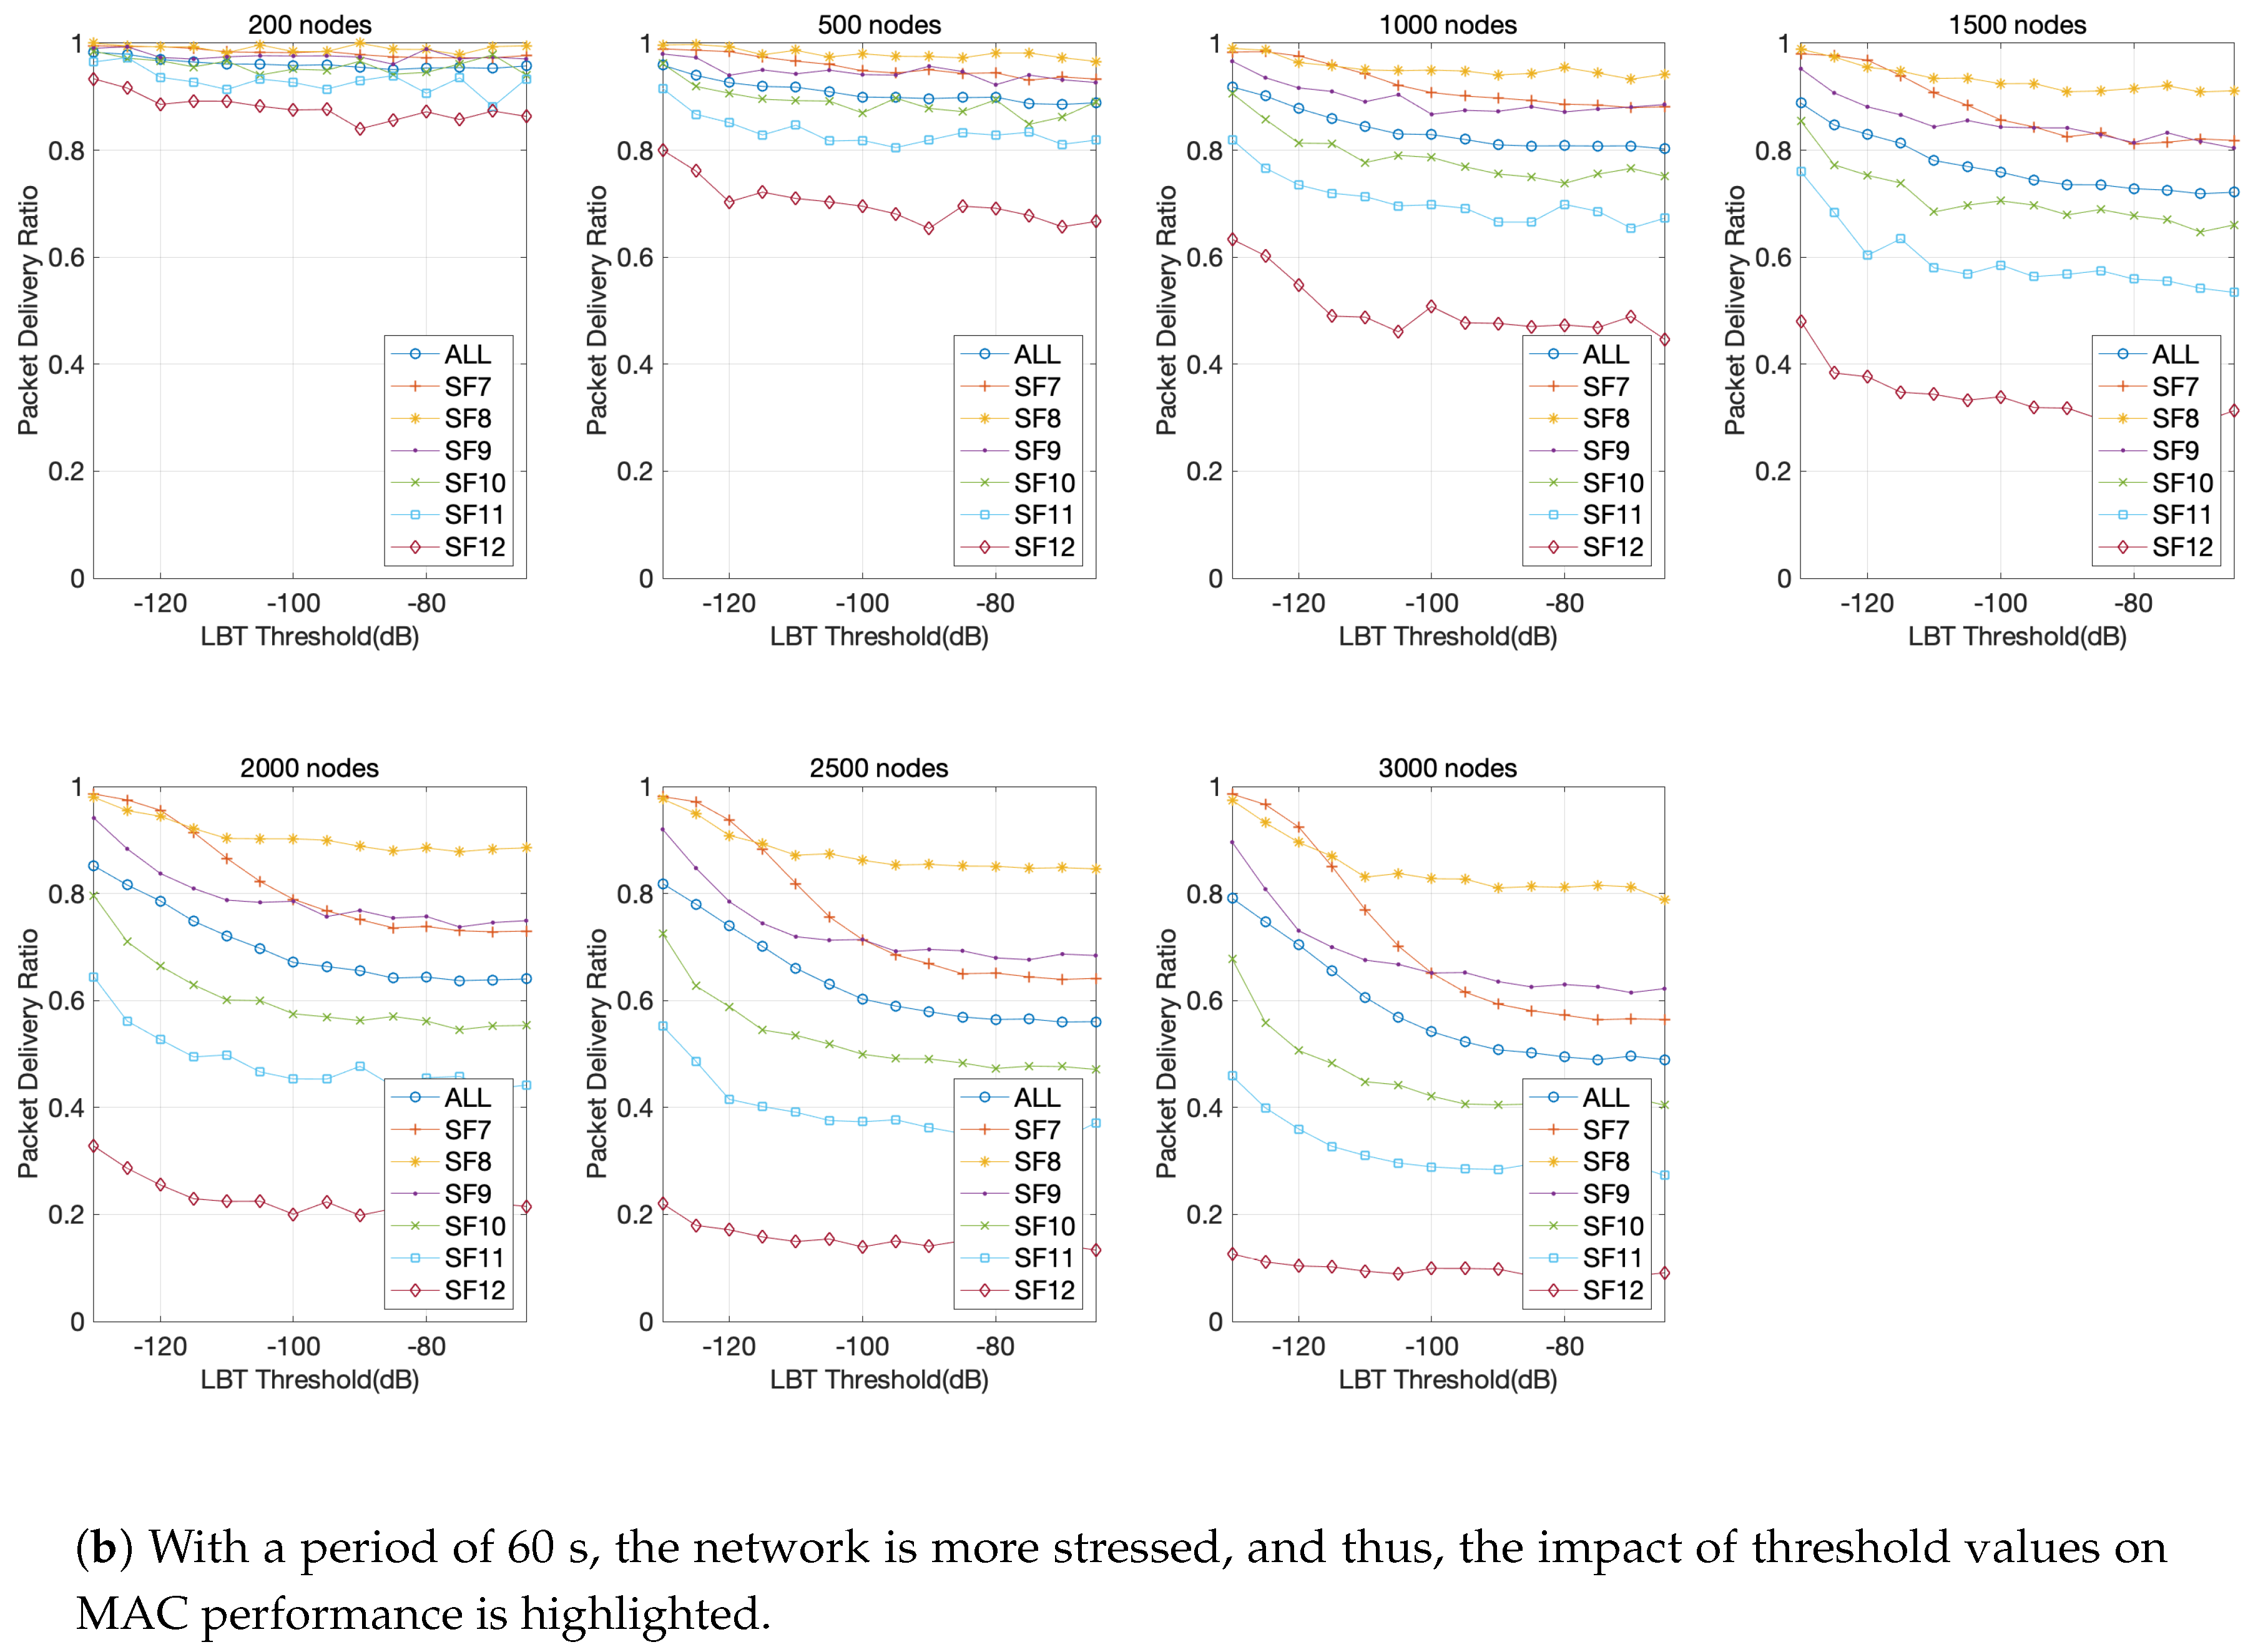
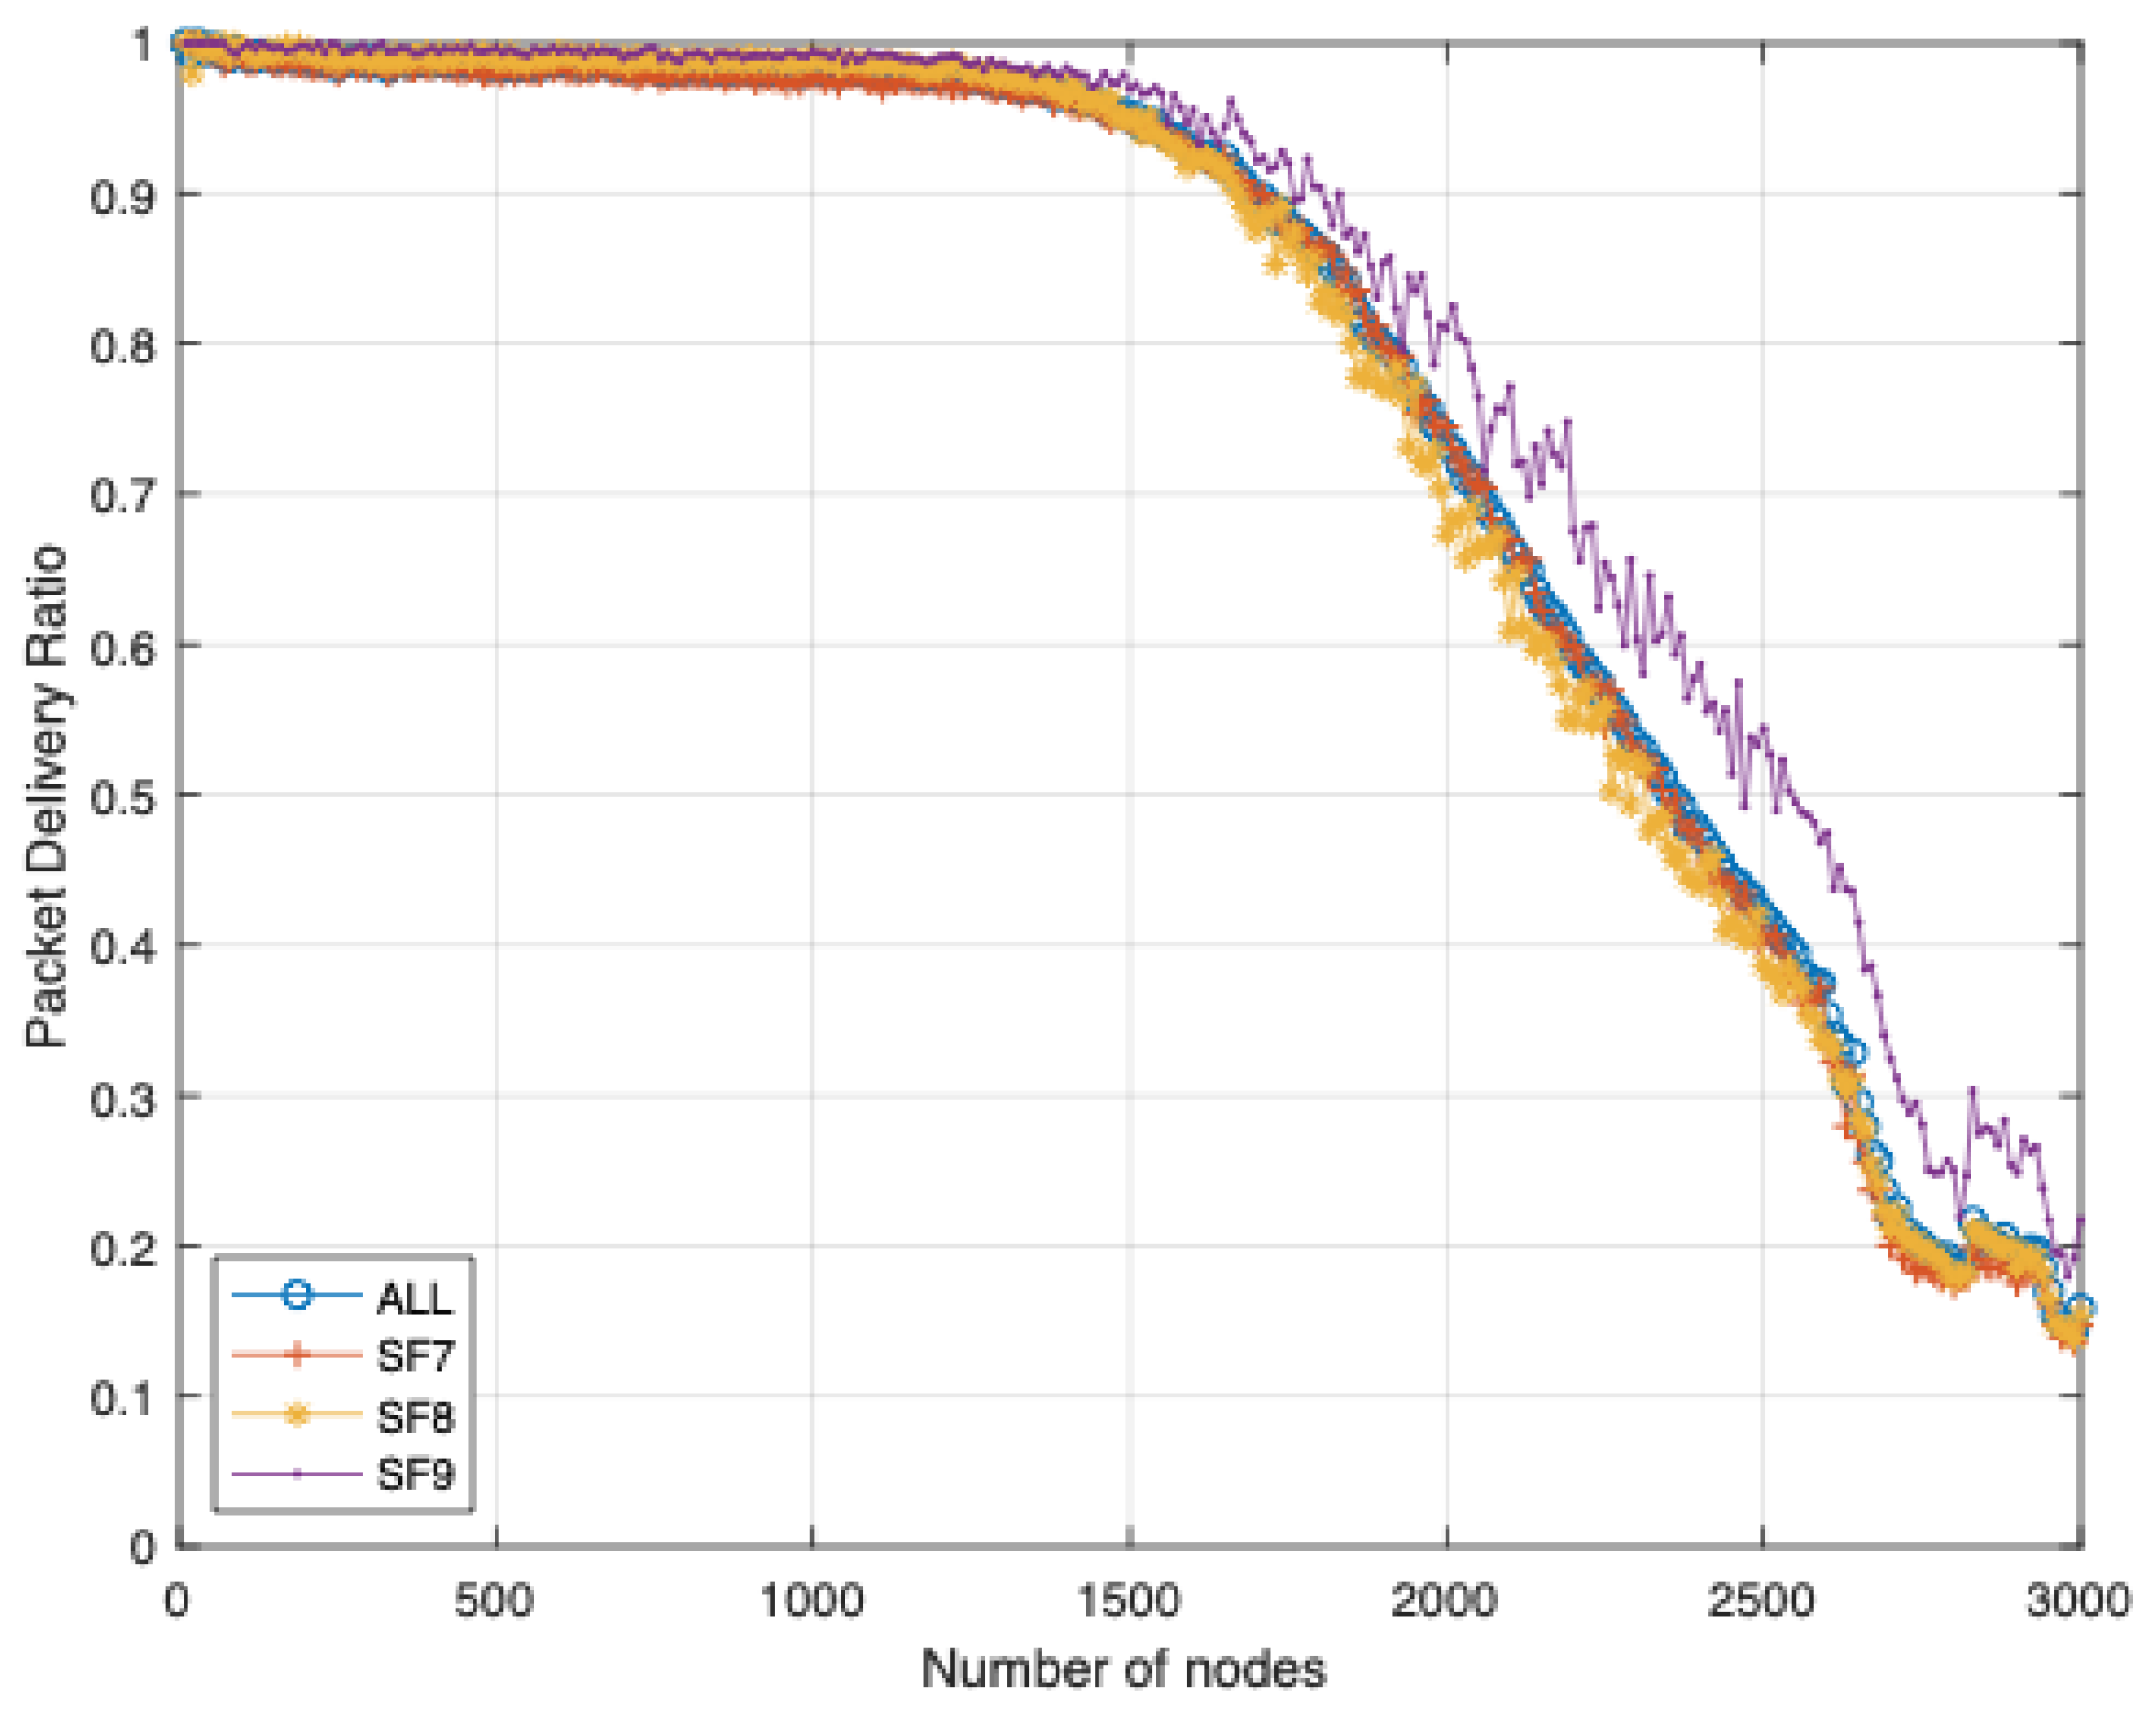
Table 1.
Wireless communications for IoT applications.
| Zigbee | Wi-Fi | Cellular | LPWAN | |
|---|---|---|---|---|
| Power | Low | High | High | Low |
| Data rate | 250 kbps | 1 Gbps | 7.2 Mbps | <100 kbps |
| Range | 100 m | 20 m | Range of cell | >1 km |
| Cost | Low | Normal | High | Low |
Table 2.
Low-Power Wide Area Network Technologies.
| LoRa | SigFox | LTE-M | |
|---|---|---|---|
| Frequency band | Unlicensed (800–930 MHz) | Unlicensed (800–930 MHz) | Licensed |
| Bandwidth | 500/250/125 kHz | 100 Hz | 20 MHz |
| Data rate | 50 kbps | 100 bps | 1 Mbps |
| Modulation | CSS | D-BPSK GFSK | QPSK 16QAM |
| EIRP | 14 dBm | 20 dBm | 23 dBm |
| Message/day | Unlimited | 140 | Unlimited |
| Max Payload | 243 byte | 12 byte | 1600 byte |
| Range | 15 km | 50 km | 11 km |
| Encryption | AES 128b | Not supported | LTE encryption |
| Lifetime | 8.75 years | 7.5 years | |
| Price | $5 | $5 | $13 |
Table 3.
LoRa MAC Parameters.
| Parameter | PDR [%] | Throughput [bps] |
|---|---|---|
| Number of channels | increase | increase |
| Number of nodes | decrease | increase |
| Payload length | decrease | increase |
| Data period | increase | decrease |
Table 4.
Comparison of communication ranges in the outdoor environment.
| Maximum Distance for 90% Reliability | |
|---|---|
| SK Telecom [15] | 3.03 km |
| Augustin et al. [16] | 2.8 km |
| Wixted et al. [17] | 2 km |
| Our result | 3.83 km |
Table 5.
Maximum coverage with various SF values to achieve different values of communication reliability.
Table 5.
Maximum coverage with various SF values to achieve different values of communication reliability.
| 50% | 70% | 90% | ||||
|---|---|---|---|---|---|---|
| RSSI | Coverage | RSSI | Coverage | RSSI | Coverage | |
| [dBm] | [m] | [dBm] | [m] | [dBm] | [m] | |
| SF 7 | −124 | 953.5 | −121.1 | 804.7 | 116.9 | 630.9 |
| SF 8 | −127 | 1135.4 | −124.1 | 958.2 | 119.9 | 751.3 |
| SF 9 | −130 | 1352.1 | −127.1 | 1141.1 | 122.9 | 894.6 |
| SF 10 | −133 | 1610.0 | −130.1 | 1358.8 | 125.9 | 1065.3 |
| SF 11 | −135 | 1808.8 | −132.1 | 1526.5 | 127.9 | 1196.9 |
| SF 12 | −137 | 2032.1 | −134.1 | 1715.0 | 129.9 | 1344.6 |
Table 6.
Parameters and values in four experiments.
| Parameters | Exp.A | Exp.B | Exp.C | Exp.D |
|---|---|---|---|---|
| Number of nodes | variable | variable | variable | 3000 |
| Payload length | variable | 65, 32 bytes | 32 bytes | 32 bytes |
| Data period | 15 s | variable | 60 s, 180 s | 60 s |
| LBT sensing threshold | dBm | dBm | variable | dBm |
| back-off algorithm | fixed 4 s | fixed 4 s | fixed 4 s | variable |
| Number of sensing | ∞ | ∞ | ∞ | variable |
Table 7.
Application requirements on the smart energy campus.
| Parameter | Requirement | Parameter | Requirement |
|---|---|---|---|
| Network coverage | 600 × 600 m | Number of nodes | 3000 |
| Max data length | 32 bytes | Data period | 15–150 s |
| Latency | 300 ms | Reliability | 90% |
Table 8.
ToA for each SF value for 32-byte data payload, 125 khz bandwidth, 8 preamble symbols, no header is presented, disabled ADR and CR of 4/5.
Table 8.
ToA for each SF value for 32-byte data payload, 125 khz bandwidth, 8 preamble symbols, no header is presented, disabled ADR and CR of 4/5.
| SF | 7 | 8 | 9 | 10 | 11 | 12 |
| ToA [ms] | 66 | 123 | 226 | 411 | 823 | 1482 |
© 2019 by the authors. Licensee MDPI, Basel, Switzerland. This article is an open access article distributed under the terms and conditions of the Creative Commons Attribution (CC BY) license (http://creativecommons.org/licenses/by/4.0/).
Share and Cite
MDPI and ACS Style
Kim, D.-H.; Lee, E.-K.; Kim, J. Experiencing LoRa Network Establishment on a Smart Energy Campus Testbed. Sustainability 2019, 11, 1917. https://doi.org/10.3390/su11071917
AMA Style
Kim D-H, Lee E-K, Kim J. Experiencing LoRa Network Establishment on a Smart Energy Campus Testbed. Sustainability. 2019; 11(7):1917. https://doi.org/10.3390/su11071917
Chicago/Turabian StyleKim, Dong-Hoon, Eun-Kyu Lee, and Jibum Kim. 2019. "Experiencing LoRa Network Establishment on a Smart Energy Campus Testbed" Sustainability 11, no. 7: 1917. https://doi.org/10.3390/su11071917
Note that from the first issue of 2016, this journal uses article numbers instead of page numbers. See further details here.