Adaptation to Climate Change and its Impacts on Wheat Yield: Perspective of Farmers in Henan of China


1
Institutes of Science and Development, Chinese Academy of Sciences (CASISD), Beijing 100190, China
2
University of Chinese Academy of Sciences (UCAS), Beijing 100049, China
3
Baoshang Bank Co., Beijing 100101, China
4
Infinite-Sum Modeling Inc., Beijing 100091, China
*
Author to whom correspondence should be addressed.
Sustainability 2019, 11(7), 1928; https://doi.org/10.3390/su11071928
Submission received: 26 February 2019
/
Revised: 19 March 2019
/
Accepted: 28 March 2019
/
Published: 1 April 2019
(This article belongs to the Special Issue Agroecology: Principles and Application for Efficient and Sustainable Agricultural Production)
Abstract
:This paper explored farm households’ autonomous climate change adaptation strategies and corresponding impacts on wheat yield. Based on a survey of 314 wheat farmers in rural China, results show that Chinese wheat farmers have a high rate of climate change awareness and adoption of climate change adaptation measures. Farmers’ cultivated area, cognition level and information accessibility on climate change significantly affect their adaptation decisions. However, these farmers are given limited adaptation strategies, mainly including increasing irrigation, and using more chemical fertilizer and pesticides. Through employing a simultaneous equations model with endogenous switching, we find farmers’ adaptation to climate change is maladaptive with negative effects on wheat yield. This study, therefore, suggests policymakers be mindful of farmers’ maladaptive responses to climate change and provide effective adaptation measures, to help farmers cope with the risks of climate change and ensure farmer’s livelihood security and sustainable agriculture development.
1. Introduction
Previous research has indicated that climate change, especially the increase of extreme weather phenomena, has a profoundly adverse effect on agriculture production [1,2,3,4,5,6,7]. A recent study shows that depending on the severity of climate change conditions, the average yield of barley wheat could fall from 3% to 17% worldwide [8]. How to overcome the risks of climate change on agriculture has gained extensive attention from researchers all over the world [2]. There are two main adaption categories, which are actors–private adaptation and public adaptation [9]. Private adaptations are autonomous adaptation–practices made by households, and public adaptations are planned adaptation–decisions made by governments [10].
Climate change is hitting farmers the hardest of all, especially in the least developed and developing countries [1,5]. Farmers autonomously adjust their production practices in response to climate change impacts depending on their existing knowledge and technology [11,12]. Several studies have researched the determinants of farmers’ adaptation decisions and measures to enhance their adaptive capacity [13,14,15,16]. Chen et al. (2014) found that, in China, farm characteristics and local governments’ policies are key factors affecting farmers’ climate change adaptation decisions.
In order to ensure food security, it is necessary to analyze farmers’ autonomous adaptation to climate change and investigate whether such adaptations can reduce climate-induced yield loss [12]. Several studies have assessed the impact of farmers’ climate change adaptation strategies on crop yields. Some studies found that farmers’ climate change adaptation significantly increases crop yield [12,17,18,19]. However, depending on different climatic, economic, social and institutional factors, farmers adopt different adaptation strategies [15], and some adaptation practices may lead to different effects according to different countries, regions and crop species.
China is a large agricultural country, with about 270 million people engaged in agricultural activity in 2012 [20]. Crop production is still dominated by small farm households in China, and wheat is one of the two staple food crops in China. Over the past century, China’s annual average temperature has risen higher than the global average; and by the end of 21st century, in most areas of China, the temperature is forecasted to rise from 1.3 °C to 5 °C [21]. It is necessary to understand farmers’ actual climate change adaptation practices and its impact on wheat yield especially because China’s agriculture sector is in a period of transition, facing various crises and challenges. Huang et al. (2015) analyzed wheat farmers’ adaptation and its impact on yield. However, they only took into account one adaptation strategy in extreme climate events. Therefore, little is known about whether Chinese farmers’ adaptation practices support farm productivity. This study investigates wheat farmers’ general adaptation strategies to climate change and the corresponding impact on farmers’ wheat yield.
2. Method
2.1. Study Area and Data Collection
This study focuses on Henan province due to its significance in China’s cereal production. Located in central China, Henan Province is one of the thirteen major grain cultivating areas. Based on relevant statistics, Henan Province’s cultivated land area and grain yield are both ranked second in the country [22]. Henan Province is located in the junction area of the subtropical and warm temperate zone, with clear climate transitional characteristics [21].
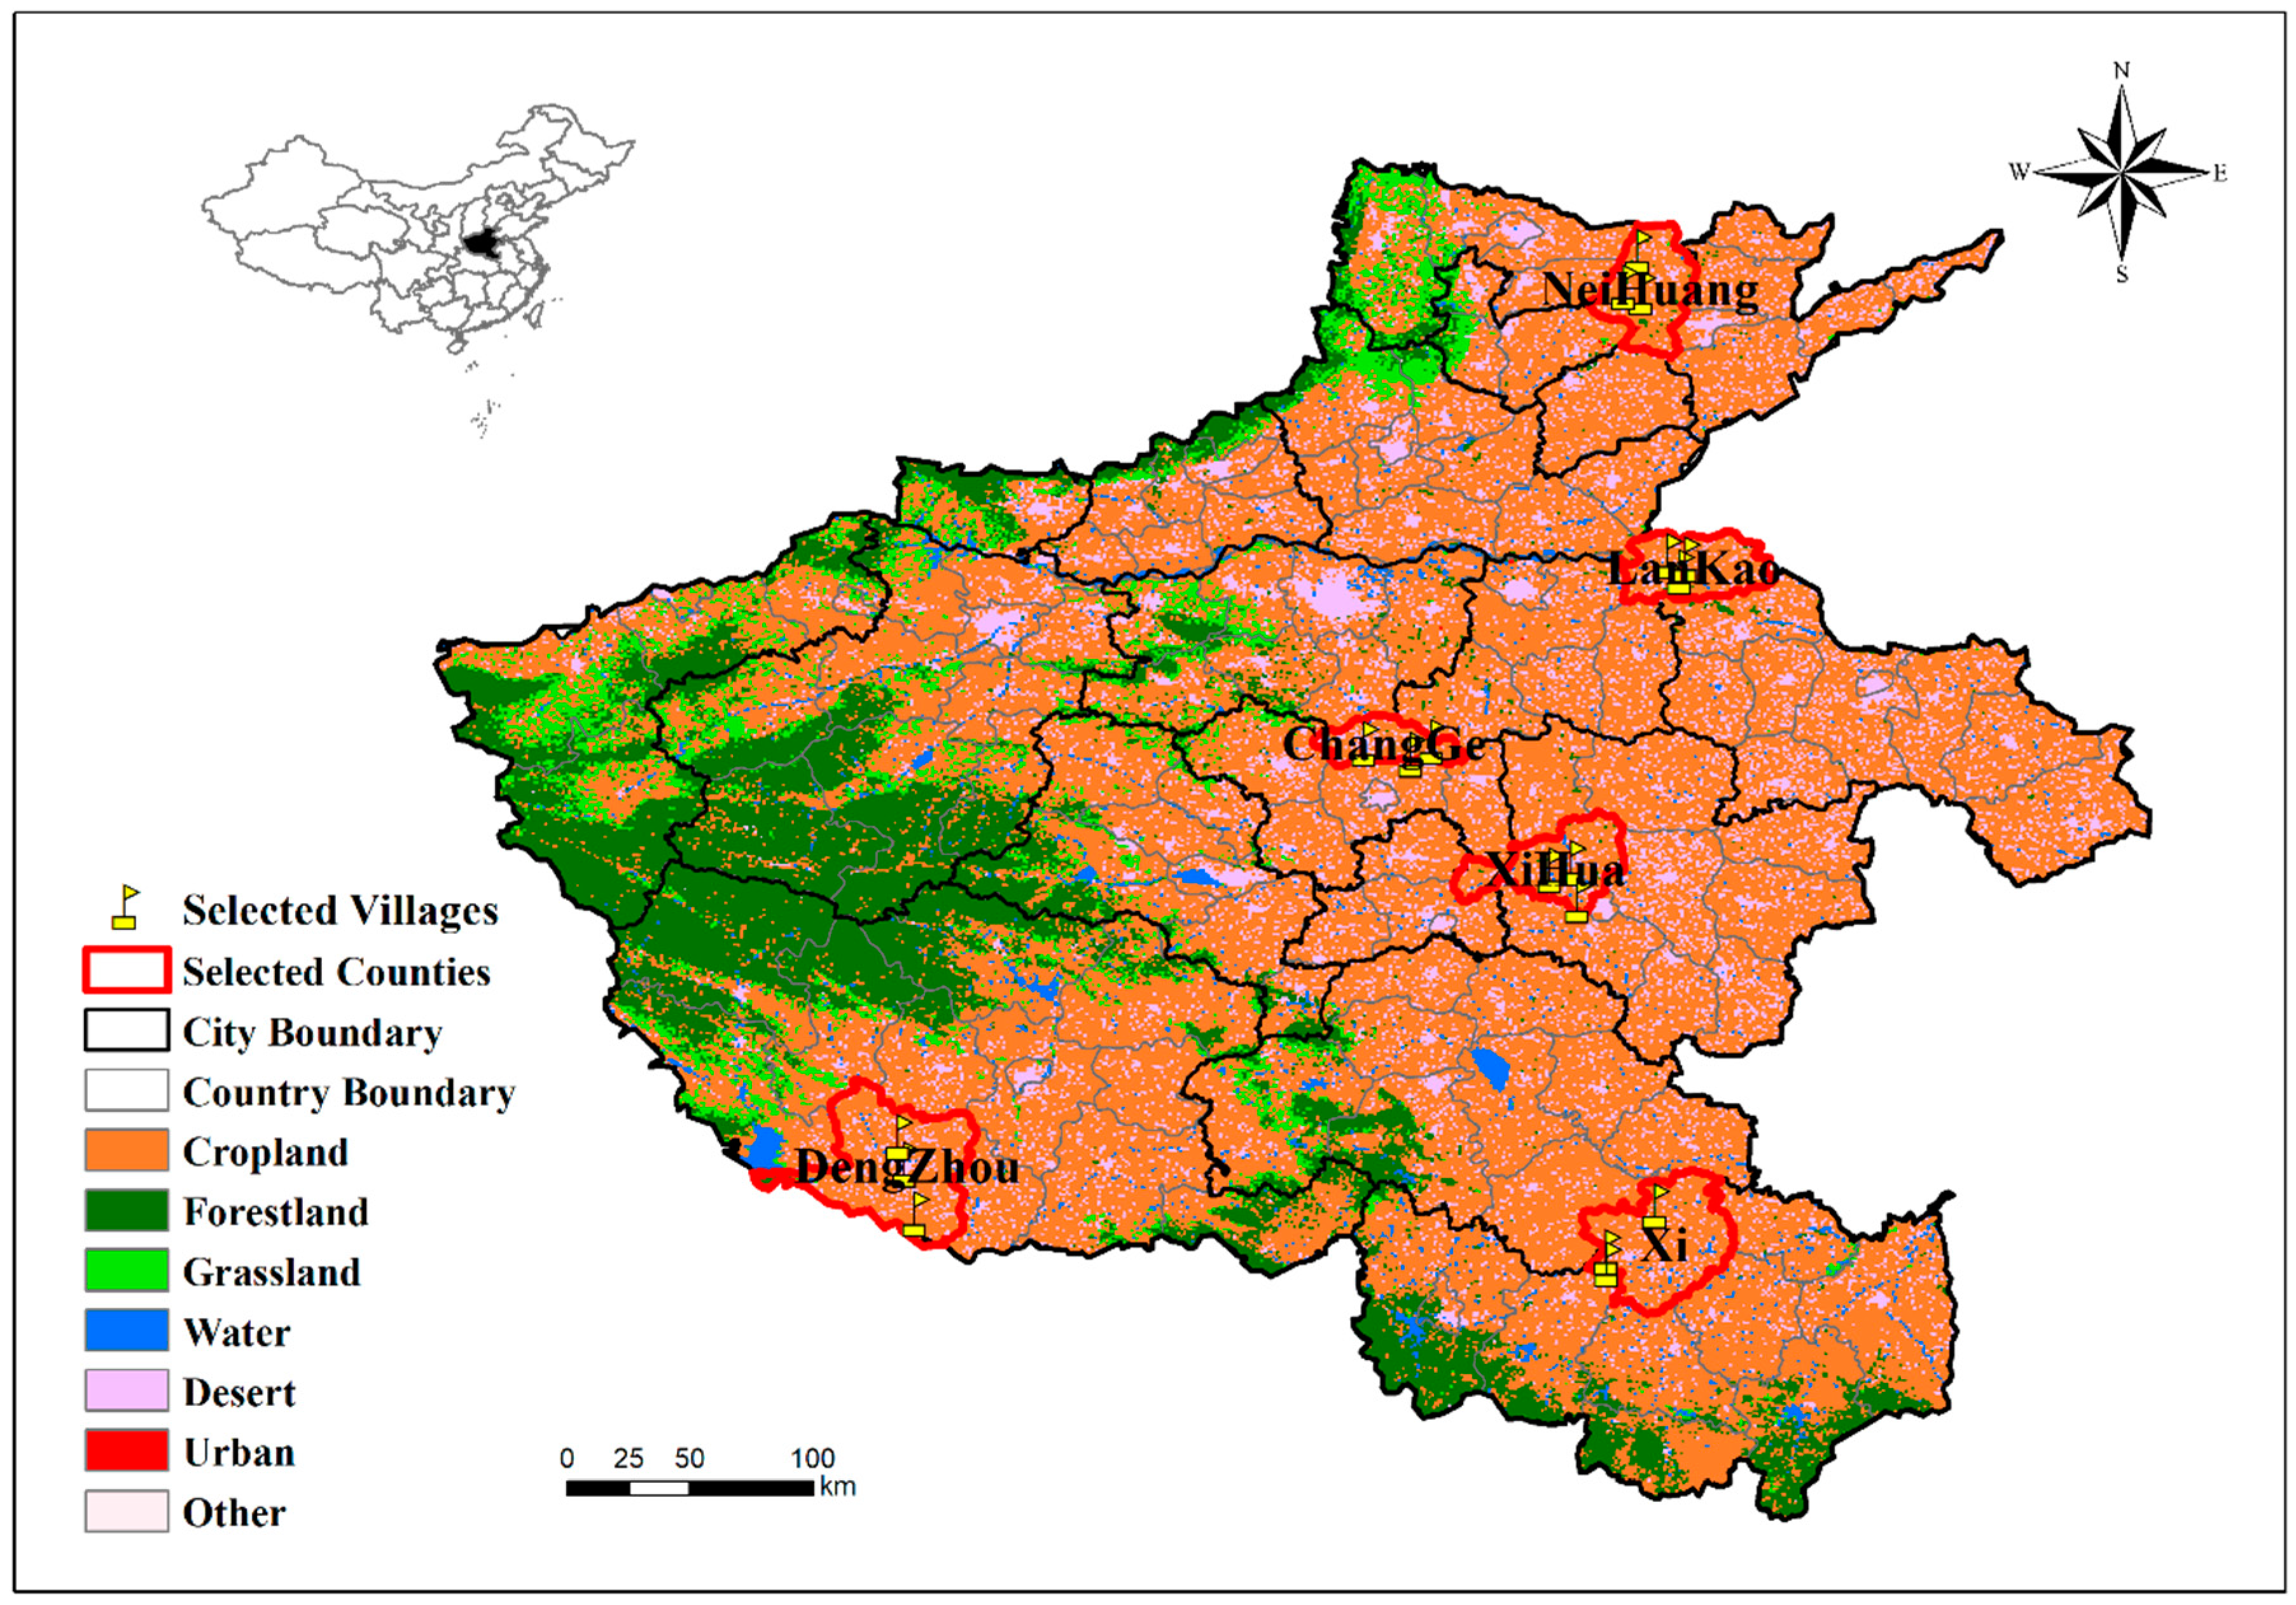
This study is based on a survey conducted on 360 farm households located within six traditional cropland zones in Henan province in January 2016. Rejecting the invalid ones, 314 questionnaires were collected with a return rate of 87.2%. The sampling procedure consisted of five steps. First, six cities (AnYang, KaiFeng, XuChang, ZhouKou, NanYang, XinYang) were selected based on geographical and climatic distribution characteristics, scattered in the east, south, west, north and central of Henan. Second, each county was randomly chosen from each city, so six counties (NeiHuang, LanKao, ChangGe, XiHua, DengZhou, Xi) were selected. Third, we randomly selected three rural towns from each county. Fourth, one sub-district division (village) was randomly selected from each town (see Figure 1). Finally, 20 farmers were randomly selected from each village from a list of farmers collected from the village committee.
In order to collect information concerning farmers’ characteristics and their actual adaptation strategies, a pre-tested structured questionnaire was used. We asked each farmer the following three contingent questions to ensure that their production adjustments were actual responses to climate change not due to other pressures [12]. (1) Do you perceive any changes in the local climatic condition in the last 10 years? If yes, what changes? (2) Does climate change have an impact on wheat production? If yes, what impact? (3) Do you adopt any actions in response to climate change? If yes, what actions?
2.2. Modelling Adaptation to Climate Change and Wheat Yield
Following Di Falco et al. (2011), a climate change adaptation decision and its effects on wheat yield can be simulated using a two-stage framework [12,19,23,24].
In the first stage, we employed a selection model for climate change adaptation decisions. It assumes that the risk-averse farmer household will implement climate change adaptation strategies if it generates net benefits, and the net benefits can be represented by a latent variable A*.
Farm i will choose to adopt climate change adaptation strategies (Ai = 1) if Ai* > 0, and 0 otherwise. The vector Z represents variables that influence farmers’ adaptation decisions. According to empirical literature on the determinants of farmers’ climate change adaptation decisions [12,15,18], this study chose farm household characteristics and climate information provided by extension agents as the dependent variables. Household characteristics include gender, age, education, labor share, the area under cultivation and climate cognition. The information from government mainly included weather warnings about frost and drought.
In the second stage, the effect of adaptation on wheat yield was modeled via the production technology. The simplest approach would have been to apply the ordinary least squares (OLS) method, taking adaptation as a dummy variable in the food productivity equation. However, assessing the impact of adaptation on wheat yield through the OLS approach may have created many potential problems. For example, adaptation may be potentially endogenous, which if true will lead to biased estimates [18]. In addition, problems such as sample selection bias and inconsistent estimates might rise and confound the results [12].
According to Di Falco et al. (2011), a simultaneous equation model of climate change adaptation and its impact on wheat yield with endogenous transformation was estimated with full information maximum likelihood. In our study, the variables regarding climate cognition and climate information were used as selection instruments. Table A1 shows that climate cognition and climate information significantly affected farmers’ adaptation decision, but they have no significant impact on the wheat yield of non-adaptors. Therefore, they can be considered as valid selection instruments.
In this paper, the endogenous switching regression model was selected to estimate the impact of climate change adaptation on wheat yield. Adaptors and non-adaptors have different yield functions.
where and are the wheat quantity produced per hectare specified in log for adopters and non-adopters respectively. is a vector of inputs specified in log form (e.g., seeds, fertilizers, manure, labor), is the parameter vector to be estimated, and ε is the error term.
Following Di Falco et al. (2011), the error terms in Equations (1)–(3) are assumed to have a trivariate normal distribution, with
Following Di Falco et al. (2011) and Khanal et al. (2018), the expected values of and are non-zero, given as:
and
Following Di Falco et al. (2011), the endogenous switching regression model can be used to investigate four conditional expectations of wheat yield.
Equations (7) and (8) represent the actual expectations observed in the sample. Equations (9) and (10) represent the counterfactual expected outcomes. In addition, the average treatment effect on the treated (TT) can be calculated using the difference between Equations (7) and (9). Similarly, the difference between Equations (10) and (8) can be calculated as the average treatment effect on the untreated (TU) for the household that actually did not adapt. For the group of “adopters”, the effect of base heterogeneity is the difference between Equations (7) and (10). Similarly, for the “non-adopters” group, the effect of base heterogeneity is measured using the difference between (9) and (8).
More details about the endogenous switching regression model can be found in Di Falco et al. (2011).
3. Results
3.1. Descriptive Statistics
Table 1 shows definitions and descriptive statistics of the surveyed farmer households. It shows that, on average, 91.7% of the farmers perceived climate changes and 82.8% of households adopted adaptation strategy in response to the changes for wheat cultivation; and 43% of households received external climate change information. Farmers adopted several measures to adapt their wheat crop to climate change. Overall, the major strategies were to increase the frequency and amount of irrigation, increase the use of chemical fertilizer and pesticides, and change crop variety. Moreover, about 63.3% of the farmers adopted more than one adaptation strategy and 2.3% of the households adopted more than three adaptation strategies. Overall, farmers were informed of the information about temperature rise and rainfall decrease at the research sites. More details about the farmer’s perception of climate change, the impacts of climate change on wheat production and farmer’s adaptation practices are presented in Figure A1.
In addition, we collected detailed production data in different production stages. Labor input was classified by household labor and employment. The household average wheat planting area was 0.771 hectare, and the average wheat yield was 6827 kg/hectare, which was above the national average at 5471 kg/h [20]. Major inputs from farmers were chemical fertilizer, household labor, and machinery, and they had low rental and employment expenses. The average age of household heads was 55 years old, and sixty percent of them received more than nine years’ education.
In this study, farmers that adopted at least one adaptation action were termed “adopters” and those not adopting any strategy as “non-adopters”. Table 2 shows differences in household characteristics between adopters and non-adopters. The average wheat yield for non-adopters was significantly higher than that of adopters. It is also evident that some inputs, such as the cost of employment expense and irrigation, was significantly higher for non-adopters than that of adopters. However, adopters had a higher perception of climate change and corresponding impact on wheat production, and access to climate change information.
3.2. Estimates of Climate Change Adaptation and Wheat Yield Equations
The endogenous switching regression model estimates adaptation decisions and yield outcome equations jointly [12]. Table 3 shows the results of endogenous switching regression.
The second column of Table 3 presents the estimated results of the adaptation selection equation representing the determinants of adopting climate change adaptation. The coefficient of area is positive and statistically significant, suggesting that farmers with larger cultivation area were more likely to employ climate change adaptation strategies. The effects of climate cognition and climate information were both positive and statistically significant, indicating that farmers who are aware of climate change and could obtain information about climate change were more likely to adapt to climate change.
The estimates presented in the third and fourth column of Table 3 account for the endogenous switching in the wheat yield function. The estimated coefficients of the correlation coefficients or are both not significantly different from zero, indicating there may be no sample selectivity bias in the sample [18]. However, the differences in the coefficients of the wheat yield equation between the adopters and non-adopters suggest heterogeneity in the sample [6,18]. The results in Table 3 indicate that area is an important factor in explaining lower wheat yield in both adopter and non-adopter groups. However, gender, education, farm manure, household labor, irrigation, and rent appear to have differentiated impacts on the wheat yield of adopters and non-adopters. The results in the third column indicate that education and irrigation are significant and positive factors in wheat yields among adopters. However, household labor input seems to have a negative and significant effect on the wheat yield of non-adopters.
Table 4 presents the expected farmers’ wheat yield under actual and counterfactual conditions and the estimated results of the average treatment effects and base heterogeneity effects. Cells (a) and (b) represent the expected wheat yield observed in the sample. Cell (c) represents the expected wheat yield of the adopters if they had decided not to adapt, and cell (d) represents the expected wheat yield of the non-adopters if they decided to adapt. Adopters would have produced about 1911 kg/ha (29%) more if they had not adapted. Similarly, non-adopters would have produced about 1039 kg/ha (14%) less if they had adapted.
In addition, the last row of Table 4 shows that adopters would have produced significantly more than the non-adopters in the counterfactual case. The significant heterogeneity effects imply that, regardless of the issue of climate change, the adopters are “better producers” than the non-adopters caused by some important sources of heterogeneity. The finding is consistent with Di Falco et al. (2011) and Khanal et al. (2018).
4. Conclusions and Discussion
This study found that over 90% of the wheat farmers are aware of climate change and over 80% of the households have autonomously adopted adaptation strategies. Farmers’ cultivated area, climate change cognition and information on climate change significantly determined their adaptation decisions. However, farmers have limited adaptation strategies, mainly including increasing irrigation, and using more chemical fertilizer and pesticides. Based on this study, farmers’ climate change adaptation strategies significantly decreased wheat yield, indicating that farmers’ climate change adaptation actions may be maladaptive.
Some studies also found maladaptive outcomes of some agricultural adaptation actions [25,26,27]. In this study, why did the measures fail to reduce climate risk and have adverse consequences? The following are the possible reasons for the failure of main adaptation actions.
First, according to Liu et al. (2010), in the grain-filling stage of winter wheat, the frequency and quantity of irrigation should be reduced appropriately [28]. Therefore, the farmers’ adaptation action to increase irrigation frequency and amount in response to reduced rainfall may lead to a negative effect on wheat yield, if they increase irrigation in an improper period. Second, in Ethiopia and Nepal, the input of fertilizer is a significant factor in higher food yields [12,18]. However, China has input utilizes about 52 times pesticides per hectare more than Ethiopian and Nepal; and China spent about 7 and 35 times fertilizer per hectare more than Ethiopian and Nepal respectively [29] China ranks first in the intensity of fertilizer used in agricultural production in the world, but fertilizer utilization is about 45%, far lower than the 60% utilization rate in developed countries [30]. Some empirical studies have shown that small farmers are risk-averse and would like to use a higher amount of fertilizer in order to avoid the negative impact of potential climate risks on agricultural production [31,32]. However, most farmer households have limited technical knowledge and a lack of agricultural labor force, depending on their traditional experience and habits, the phenomenon of farmer’s overuse of fertilizer is widespread and serious in China [32,33]. Overuse of chemical fertilizers may decline the fertility of arable land, cause water pollution [34], and erode sustainable development of agriculture [25]. Therefore, the adaptation action of increasing fertilizer in response to the climate change risk would raise food production when the use of fertilizer is insufficient, but instead farmers increasing use of fertilizers and pesticides likely have a negative effect on wheat yield and the environment, if the fertilizer and pesticide inputs are excessive and inefficient. Third, some farmers change crop varieties to plant drought tolerant and disease-resistant wheat varieties in response to reduced rainfall and increasing pest and disease damage. However, the drought tolerant and disease-resistant wheat varieties may not be high-yield varieties and the adaptability of a new variety in complex environmental factors may lead to crop failure.
There is no doubt that adaptation is an important part of reducing the negative effects of climate change, sustaining farmers’ livelihoods and ensuring agricultural sustainable development [35]. In particular, agriculture in China faces serious resource and environmental constraints, like water shortage and environmental degradation. However, small farmer’s autonomous adaptation may be maladaptive and unsustainable. Therefore, the local government in Henan should help small farmers implement appropriate and effective adaptation strategies because government is in charge of agricultural infrastructure construction (irrigation and water conservancy systems, the agricultural product quality monitoring system and the agricultural information system) and agricultural science and technology progress (agricultural science and technology research, and agricultural science and technology popularization) [36,37]. Otherwise, small farmers may waste their efforts and resources without benefit, and may even experience loss if they just rely on themselves. Based on our findings, on one hand, it is urgent to implement scientific irrigation and fertilization to increase the efficient use of fertilizers and water for the interests of farmers and the sustainable development of agriculture. On the other hand, it is advisable to pay more attention to seed variety research and development to provide farmers with wheat varieties that have high yields, drought tolerance, and disease resistance, and guide them to choose suitable varieties according to local conditions.
This study investigates the phenomenon of wheat farmers’ maladaptation to climate change in Henan of China. Reasons behind the phenomenon, and whether it represents a general condition across different regions or crop varieties, will be explored in further research.
Author Contributions
Conceptualization, S.Q. and Y.L.; Funding acquisition, Y.L.; Investigation, Y.L. and J.S.; Methodology, S.Q. and T.Z.; Supervision, Y.L.; Writing—original draft, S.Q.; Writing—review & editing, Y.L. and M.W.
Funding
This research was funded by the National Natural Science Foundation of China, grant number 71473241; The APC was funded by the National Natural Science Foundation of China, grant number 71473241.
Acknowledgments
Distinctive thanks to all respondents for their great support to our field research. And helpful comments from the reviewers and editors are appreciated.
Conflicts of Interest
The authors declare no conflict of interest.
Appendix A
Figure A1.
Percentage of farmers’ perception of climate change, climate change impacts on wheat production and farmers’ adaptation practices.
Figure A1.
Percentage of farmers’ perception of climate change, climate change impacts on wheat production and farmers’ adaptation practices.


Table A1.
Validity test of selection instruments.
| Model 1 | Model 2 | |
|---|---|---|
| Adaptation 1/0 | Wheat Yield per Hectare Produced by Non-Adopters | |
| Male | 0.246(0.238) | 0.116 **(2.09) |
| Age | −0.004(0.011) | 0.000120 (0.05) |
| Labor share | −0.549(0.443) | 0.144(1.31) |
| Education | 0.034(0.224) | 0.090(1.45) |
| Area | 0.016(0.011) | −0.060(−1.39) |
| Climate cognition | 1.889 ***(0.335) | 0.012(0.057) |
| Climate Information | 1.230 ***(0.273) | −0.147(0.111) |
| Seeds(log) | −0.031(−0.32) | |
| Pesticide(log) | 0.055(1.15) | |
| Farm manure(log) | 0.004(0.98) | |
| Chemical fertilizers(log) | 0.036(0.42) | |
| Machinery(log) | −0.00148(−0.26) | |
| Irrigation(log) | 0.00106 (0.14) | |
| Household labor input(log) | −0.085 *(−2.02) | |
| Employment expense(log) | 0.00375(0.62) | |
| Rental(log) | −0.089(−1.26) | |
| Rent (0/1) | 0.147(0.345) | |
| Cons | −0.849(0.704) | 8.916 ***(10.17) |
| χ2 = 87.67 *** | F-stat. = 1.85 | |
| Sample size | 314 | 54 |
Note: Model 1: Probit model (Pseudo R2 = 0.304); Standard errors in parenthesis. Model 2: Ordinary least squares (R2 = 0.445). T-value in parenthesis. *, ** and *** represent the statistically significant at 10%, 5% and 1%, respectively.
References
- Bandara, J.S.; Cai, Y. The impact of climate change on food crop productivity, food prices and food security in South Asia. Econ. Anal. Policy 2014, 44, 451–465. [Google Scholar] [CrossRef]
- IPCC. Climate Change 2014: Impacts, Adaptation, and Vulnerability. Summary for Policymakers; IPCC: Geneva, Switzerland, 2014. [Google Scholar]
- Lobell, D.B.; Burke, M.B.; Tebaldi, C.; Mastrandrea, M.D.; Falcon, W.P.; Naylor, R.L. Prioritizing climate change adaptation needs for food security in 2030. Science 2008, 319, 607–610. [Google Scholar] [CrossRef] [PubMed]
- Muller, C.; Cramer, W.; Hare, W.L.; Lotze-Campen, H. Climate change risks for African agriculture. Proc. Natl. Acad. Sci. USA 2011, 108, 4313–4315. [Google Scholar] [CrossRef] [PubMed] [Green Version]
- Parry, M.L.; Rosenzweig, C.; Iglesias, A.; Livermore, M.; Fischer, G. Effects of climate change on global food production under SRES emissions and socio-economic scenarios. Glob. Environ. Chang. 2004, 14, 53–67. [Google Scholar] [CrossRef]
- Piao, S.; Ciais, P.; Huang, Y.; Shen, Z.; Peng, S.; Li, J.; Zhou, L.; Liu, H.; Ma, Y.; Ding, Y.; et al. The impacts of climate change on water resources and agriculture in China. Nature 2010, 467, 43–51. [Google Scholar] [CrossRef] [PubMed]
- Schlenker, W.; Lobell, D.B. Robust negative impacts of climate change on African agriculture. Environ. Res. Lett. 2010, 5, 014010. [Google Scholar] [CrossRef] [Green Version]
- Xie, W.; Xiong, W.; Pan, J.; Ali, T.; Cui, Q.; Guan, D.; Meng, J.; Mueller, N.D.; Lin, E.; Davis, S.J. Decreases in global beer supply due to extreme drought and heat. Nat. Plants 2018, 4, 964–973. [Google Scholar] [CrossRef] [PubMed]
- Smit, B.; Skinner, M.W. Adaptation options in agriculture to climate change: a typology. Mitig. Adapt. Strateg. Glob. Chang. 2002, 7, 85–114. [Google Scholar] [CrossRef]
- Stage, J.; Limburg, K.; Costanza, R. Economic valuation of climate change adaptation in developing countries. Ann. N. Y. Acad. Sci. 2010, 1185, 150–163. [Google Scholar] [CrossRef] [PubMed]
- Leclère, D.; Jayet, P.-A.; de Noblet-Ducoudré, N. Farm-level Autonomous Adaptation of European Agricultural Supply to Climate Change. Ecol. Econ. 2013, 87, 1–14. [Google Scholar] [CrossRef]
- Khanal, U.; Wilson, C.; Hoang, V.-N.; Lee, B. Farmers’ Adaptation to Climate Change, Its Determinants and Impacts on Rice Yield in Nepal. Ecol. Econ. 2018, 144, 139–147. [Google Scholar] [CrossRef]
- Chen, H.; Wang, J.; Huang, J. Policy support, social capital, and farmers’ adaptation to drought in China. Glob. Environ. Chang. 2014, 24, 193–202. [Google Scholar] [CrossRef]
- Schlenker, W.; Lobell, B.D.; Bryan, E.; Ringler, C.; Okoba, B.; Roncoli, C.; Silvestri, S.; Herrero, M.; Nhemachena, C.; Rashid, H.; et al. Determinants of African farmers’ strategies for adapting to climate change: Multinomial choice analysis. Environ. Manag. 2010, 2, 22. [Google Scholar]
- Deressa, T.T.; Hassan, R.M.; Ringler, C.; Alemu, T.; Yesuf, M. Determinants of farmers’ choice of adaptation methods to climate change in the Nile Basin of Ethiopia. Glob. Environ. Chang. 2009, 19, 248–255. [Google Scholar] [CrossRef] [Green Version]
- Alauddin, M.; Sarker, M.A.R. Climate change and farm-level adaptation decisions and strategies in drought-prone and groundwater-depleted areas of Bangladesh: An empirical investigation. Ecol. Econ. 2014, 106, 204–213. [Google Scholar] [CrossRef]
- Abid, M.; Schneider, U.A.; Scheffran, J. Adaptation to climate change and its impacts on food productivity and crop income: Perspectives of farmers in rural Pakistan. J. Rural Stud. 2016, 47, 254–266. [Google Scholar] [CrossRef]
- Di Falco, S.; Veronesi, M.; Yesuf, M. Does adaptation to climate change provide food security? A micro-perspective from Ethiopia. Am. J. Agric. Econ. 2011, 93, 829–846. [Google Scholar] [CrossRef]
- Huang, J.; Wang, Y.; Wang, J. Farmers’ Adaptation to Extreme Weather Events through Farm Management and Its Impacts on the Mean and Risk of Rice Yield in China. Am. J. Agric. Econ. 2015, 97, 602–617. [Google Scholar] [CrossRef]
- NBSC. China Statistical Yearbook 2018; China Statistics Press: Beijing, China, 2018. (In Chinese) [Google Scholar]
- WGCNARCC. The Third National Assessment Report on Climate Change; Science Press: Beijing, China, 2015. (In Chinese) [Google Scholar]
- MOAC. China Agricultural Year Book 2015; China Agriculture Press: Beijing, China, 2015. (In Chinese) [Google Scholar]
- Khanal, U.; Wilson, C.; Hoang, V.N.; Lee, B.L. Autonomous adaptations to climate change and rice productivity: a case study of the Tanahun district, Nepal. Clim. Dev. 2018. [Google Scholar] [CrossRef]
- Khanal, U.; Wilson, C.; Lee, B.L.; Hoang, V.N. Climate change adaptation strategies and food productivity in Nepal: a counterfactual analysis. Clim. Chang. 2018, 148, 575–590. [Google Scholar] [CrossRef]
- Antwi-Agyei, P.; Dougill, A.J.; Stringer, L.C.; Codjoe, S.N.A. Adaptation opportunities and maladaptive outcomes in climate vulnerability hotspots of northern Ghana. Clim. Risk Manag. 2018, 19, 83–93. [Google Scholar] [CrossRef]
- Kihupi, M.L.; Mahonge, C.; Chingonikaya, E.E. Smallholder Farmers’ Adaptation Strategies to Impact of Climate Change in Semi-arid Areas of Iringa District Tanzania. J. Biol. Agric. Healthc. 2015, 5, 123–132. [Google Scholar]
- Müller, B.; Johnson, L.; Kreuer, D. Maladaptive outcomes of climate insurance in agriculture. Glob. Environ. Chang. 2017, 46, 23–33. [Google Scholar] [CrossRef]
- Liu, P.; Cai, H.; Wang, J. Effects of Soil Water Stress on Growth Development, Dry-matter Partition and Yield Constitution of Winter Wheat. Res. Agric. Mod. 2010, 37, 1049–1059. [Google Scholar]
- FAO. Food and Agriculture Data; FAO: Rome, Italy, 2018. [Google Scholar]
- Wu, L.; Yin, S.; Wang, J. Introduction to 2014 China Development Report on Food Safety; Peking University Press: Beijing, China, 2014. [Google Scholar]
- Paudel, K.P.; Lohr, L.; Martin, N.R. Effect of risk perspective on fertilizer choice by sharecroppers. Agric. Syst. 2000, 66, 115–128. [Google Scholar] [CrossRef]
- Huanguang Qiu, H.L. Effect of risk aversion on farmers’ overuse of fertilizer. Chin. Rural Econ. 2014, 3, 85–96. (In Chinese) [Google Scholar]
- Huang, J.; Hu, R.; Cao, J.; Rozelle, S. Training programs and in-the-field guidance to reduce China’s overuse of fertilizer without hurting profitability. J. Soil Water Conserv. 2008, 63, 165A–167A. [Google Scholar] [CrossRef]
- Tilman, D.; Fargione, J.; Wolff, B.; D’Antonio, C.; Dobson, A.; Howarth, R.; Schindler, D.; Schlesinger, W.H.; Simberloff, D.; Swackhamer, D. Forecasting agriculturally driven global environmental change. Science 2001, 292, 281–284. [Google Scholar] [CrossRef]
- Hailegiorgis, A.; Crooks, A.; Cioffi-Revilla, C. An Agent-Based Model of Rural Households’ Adaptation to Climate Change. J. Artif. Soc. Soc. Simul. 2018, 21, 4. [Google Scholar] [CrossRef]
- Wu, C. A Research on Rural Public Goods Supply System Development during the Transformation Period in China; Huazhong Agricultural University: Wuhan, China, 2007. (In Chinese) [Google Scholar]
- Cheng, X.; Wu, Q. The responsibility of the government in the rural public goods supply system. Rural Econ. 2009, 2, 54–58. (In Chinese) [Google Scholar]
Figure 1.
Location of study area.

Table 1.
Variable names, definitions and descriptive statistics for the sample.
| Variable | Description | Sample Mean | Std. Dev |
|---|---|---|---|
| Yield | Wheat output (kg/ha) | 6827.579 | 1749.542 |
| Area | Area under wheat in hectare | 0.771 | 1.992 |
| Seeds | Seeds use per hectare (RMB) | 1129.651 | 364.152 |
| Chemical fertilizer | Chemical fertilizers use per hectare (RMB) | 2476.440 | 697.026 |
| Farm manure | Farm manure use per hectare (RMB) | 171.858 | 564.062 |
| Pesticide | Pesticides per hectare (RMB) | 542.944 | 296.527 |
| Household labor | Household labor input per hectare (RMB) | 2638.080 | 2135.371 |
| Employment expense | Employment expense per hectare (RMB) | 180.419 | 581.991 |
| Machinery | Machinery cost per hectare (RMB) | 1526.853 | 701.715 |
| Irrigation | Irrigation cost per hectare (RMB) | 463.738 | 459.876 |
| Rental | Rental expense per hectare (RMB) | 32.684 | 94.295 |
| Male | Dummy = 1, if the head of farmer household is male, 0 otherwise | 0.723 | 0.448 |
| Age | Age of the household head | 55.124 | 10.417 |
| Education | Dummy = 1 if the household head had attained > 9 years of schooling, 0 otherwise | 0.615 | 0.487 |
| Labor share | The proportion of Labor force in the total household population | 0.604 | 0.221 |
| Climate cognition | Dummy = 1 if the respondent perceives climate change, 0 otherwise | 0.917 | 0.276 |
| Climate impact on wheat | Dummy = 1 if the respondent believes climate change impacts wheat production, 0 otherwise | 0.857 | 0.351 |
| Climate Information | Dummy = 1 if the respondent received pre-warning weather information, 0 otherwise | 0.430 | 0.496 |
| Adaptation | Dummy = 1 if the farming household adapted to climate change, 0 otherwise | 0.828 | 0.378 |
Table 2.
Farm and household characteristics of adopters and non-adopters.
| Variable | Adopters | Non-Adopters | Difference | ||
|---|---|---|---|---|---|
| Mean | Std. Dev. | Mean | Std. Dev. | ||
| Adaptation | 1.000 | 0.000 | 0.000 | 0.000 | |
| Yield | 6740.563 | 1831.214 | 7246.547 | 1213.885 | −505.984 ** |
| Area | 0.809 | 2.146 | 0.588 | 0.948 | 0.221 |
| Seeds | 1127.578 | 375.437 | 1139.629 | 306.923 | −12.051 |
| Pesticide | 2467.206 | 692.978 | 2520.898 | 721.167 | −53.692 |
| Farm manure | 144.332 | 521.404 | 304.387 | 727.207 | −160.055 |
| Chemical fertilizers | 544.795 | 300.001 | 534.028 | 281.712 | 10.767 |
| Household labor input | 2708.825 | 2219.873 | 2297.456 | 1644.566 | 411.369 |
| Employment expense | 133.105 | 478.036 | 408.226 | 905.401 | −275.121 ** |
| Machinery | 1547.522 | 651.598 | 1427.338 | 906.063 | 120.184 |
| Irrigation | 436.741 | 454.060 | 593.72 | 469.75 | −156.979 ** |
| Rental | 33.584 | 96.138 | 28.349 | 85.563 | 5.235 |
| Male | 0.731 | 0.444 | 0.685 | 0.469 | 0.046 |
| Age | 55.238 | 10.256 | 54.574 | 11.241 | 0.664 |
| Education | 0.612 | 0.488 | 0.63 | 0.487 | −0.018 |
| Labor Share | 0.597 | 0.218 | 0.637 | 0.236 | −0.040 |
| Climate cognition | 0.977 | 0.150 | 0.63 | 0.487 | 0.347 *** |
| Climate impact on wheat | 0.977 | 0.150 | 0.278 | 0.452 | 0.699 *** |
| Climate Information | 0.508 | 0.501 | 0.056 | 0.231 | 0.452 *** |
Note: ** and *** represent the statistically significant at 5% and 1%, respectively.
Table 3.
Endogenous switching regression results for climate change adaptation and impact on wheat yield.
Table 3.
Endogenous switching regression results for climate change adaptation and impact on wheat yield.
| Variable | Adaptation | Wheat Yield(log) | |
|---|---|---|---|
| Adopters | Non-Adopters | ||
| Male | 0.263 | −0.003 | 0.118 ** |
| (1.10) | (−0.07) | (2.55) | |
| Age | −0.002 | 0.001 | 0.000 |
| (−0.20) | (0.58) | (0.06) | |
| Labor share | −0.616 | 0.070 | 0.138 |
| (−1.36) | (0.98) | (1.48) | |
| Education | −0.017 | 0.065 * | 0.060 |
| (−0.07) | (1.91) | (1.15) | |
| Area | 0.298 * | −0.021 ** | −0.073 ** |
| (1.85) | (−2.55) | (−2.17) | |
| Seeds(log) | −0.053 | −0.098 | |
| (−1.28) | (−0.85) | ||
| Farm manure(log) | −0.002 | 0.006 * | |
| (−0.69) | (1.78) | ||
| Chemical fertilizers | 0.068 | 0.045 | |
| (1.26) | (0.64) | ||
| Pesticide(log) | 0.042 | 0.051 | |
| (1.57) | (1.27) | ||
| Household labor (log) | −0.009 | −0.105 *** | |
| (−1.19) | (−2.97) | ||
| Employment expense(log) | −0.007 | −0.001 | |
| (−1.35) | (−0.10) | ||
| Irrigation(log) | 0.012 *** | −0.002 | |
| (4.88) | (−0.27) | ||
| Machinery(log) | −0.007 | −0.006 | |
| (−1.10) | (−1.13) | ||
| Rental(log) | −0.009 ** | −0.009 | |
| (−2.26) | (−1.39) | ||
| Rent (0/1) | 0.157 | ||
| (0.43) | |||
| Climate cognition | 1.877 *** | ||
| (4.91) | |||
| Climate Information | 1.259 *** | ||
| (4.65) | |||
| Constant | −0.923 | 8.189 *** | 9.613 *** |
| (−1.34) | (16.63) | (9.81) | |
| −1.402 *** (−29.70) | |||
| −1.999 *** (−10.83) | |||
| 0.347(1.54) | |||
| 0.584(0.70) (0.70) | |||
Note: *, ** and *** represent the statistically significant at 10%, 5% and 1%, respectively; t-value in parenthesis.
Table 4.
Impact of adaptation on average expected wheat yield: treatment and heterogeneity effects.
| Sub-Samples | Decision Stage | Treatment Effects | |
|---|---|---|---|
| To Adapt | Not to Adapt | ||
| Adopters | (a) 6551.72 (49.211) | (c) 8463.331 (344.042) | TT = −1911.611 *** [−5.614] |
| Non-adopters | (d) 6167.134 (89.356) | (b) 7206.905 (110.097) | TU = −1039.771 *** [−13.716] |
| Heterogeneity effects | BH1 = 384.587 *** [3.770] | BH2 = 1256.427 *** [3.478] | |
Note: Standard errors in parenthesis and t-value in square brackets. *** represent the statistically significant at 1%.
© 2019 by the authors. Licensee MDPI, Basel, Switzerland. This article is an open access article distributed under the terms and conditions of the Creative Commons Attribution (CC BY) license (http://creativecommons.org/licenses/by/4.0/).
Share and Cite
MDPI and ACS Style
Quan, S.; Li, Y.; Song, J.; Zhang, T.; Wang, M. Adaptation to Climate Change and its Impacts on Wheat Yield: Perspective of Farmers in Henan of China. Sustainability 2019, 11, 1928. https://doi.org/10.3390/su11071928
AMA Style
Quan S, Li Y, Song J, Zhang T, Wang M. Adaptation to Climate Change and its Impacts on Wheat Yield: Perspective of Farmers in Henan of China. Sustainability. 2019; 11(7):1928. https://doi.org/10.3390/su11071928
Chicago/Turabian StyleQuan, Shuiping, Yingming Li, Jianxin Song, Tao Zhang, and Mingyue Wang. 2019. "Adaptation to Climate Change and its Impacts on Wheat Yield: Perspective of Farmers in Henan of China" Sustainability 11, no. 7: 1928. https://doi.org/10.3390/su11071928
Note that from the first issue of 2016, this journal uses article numbers instead of page numbers. See further details here.