Do Energy Conservation Strategies Limit the Freedom of Architecture Design? A Case Study of Minsheng Community, Taipei, Taiwan

1
Department of Architecture, National Taiwan University of Science and Technology, Taipei 106, Taiwan
2
Research Center for Biomaterials, Indonesian Institute of Sciences, Cibinong 16911, Indonesia
*
Author to whom correspondence should be addressed.
Sustainability 2019, 11(7), 2003; https://doi.org/10.3390/su11072003
Submission received: 17 January 2019
/
Revised: 24 March 2019
/
Accepted: 28 March 2019
/
Published: 4 April 2019
(This article belongs to the Special Issue Population Dynamics in the Changing Climate Systems)
Abstract
:The residential sector is one of the largest energy-consuming sectors in Taiwan. Taiwan applies building codes and appliance standards to reduce the total energy demand for buildings, especially for façade design. Some research studies demonstrate that design decisions regarding the envelope shape have a direct effect on a building’s energy performance. This paper presents a comparative study of four façade design strategies for low-rise residential buildings by combining energy performance and architectural creativity. The research aims to provide insights for Taiwan’s building designers and energy policymakers and to provide an overview of façade standards for residential buildings in urban areas that is not only innovative in design but also has an energy-saving potential. The approach used in this research combined the overhang and side fin shading design with an open plan, which allows for optimum daylight exposure across all spaces in order to reduce energy consumption.
1. Introduction
Over the past ten years, the average global temperature has increased at the fastest rate in recorded history [1]. The residential sector is one of the largest energy-consuming sectors in Taiwan. Its consumption accounted for 19% of the total electricity consumption in 2016 [2]. Taiwan is one of the industrial countries that is facing environmental issues, especially due to its high carbon emissions. At the end of 2008, Taiwan’s total greenhouse gas emission levels accounted for 1% of all global emissions [3]. With global warming and increased needs for comfort, building energy consumption is expected to rise, especially during summer in order to cool buildings.
Some developed countries apply building codes and appliance standards to reduce total energy demand for buildings [4,5,6]. The Taiwan government proposed a green building certification system called EEWH (Ecology, Energy, Waste Reduction, and Health) [7]. However, the Green Building Label can confuse occupants, since it can be an overwhelming task to understand what each classification means. There are many ways to evaluate a green building, and form is one of them. This is based on the fact that the characteristics of a building represent the idea and function of the building [8]. The first experience people have with a building, even before entering it, is its architectural design. Moreover, building form is a major factor in a building’s aesthetic and visual impact. Some research studies show that design decisions regarding the envelope shape have a direct effect on the energy performance of buildings [9,10,11]. This issue forces architects to come up with improved building design concepts with expensive high-tech solutions [12].
Regardless of the building forms, the building design should be aware of energy conservation. The actual amount of energy used in the building is often uncertain since it is based on user behavior. User influence will directly affect the building’s floor plan. In order to improve existing energy conservation strategies, detailed information of user behavior is required. In this study, TUS (time use survey) has recorded the information on individual’s activities during a 24-h period. These data were completed with personal information such as the individual’s occupation and demographic background. User behavior with detailed information will improve the building design [13].
The building form plays a significant role in the sustainable performance of buildings [14], reducing air-conditioning and lighting-energy consumption while simultaneously adapting to the local climate. The philosophy is to minimize overdesign and concentrate on reducing energy usage. The concept relies on the most basic design, and architects may thus lose some freedom to be creative. On the other hand, advanced technologies and high-technology energy-saving systems can create an aesthetic shape that can reflect environmental awareness about sustainability. However, architects often ignore climate-specific design principles and transfer modern architecture designs to different climate zones without adjustments [15,16]. Being tied to a green building image, architects sometimes forget the main function of the building design. This contradictory concept will therefore be a part of the main discussion in this paper.
This research aims to provide insights for Taiwan’s building designers and energy policymakers, by providing an overview of the typical façades of residential buildings in an urban area using a trustworthy DesignBuilder simulation engine. Building performance simulation (BPS) tools such as DesignBuilder can be helpful when performing an integrated analysis of the architectural design process [17]. The structure of this paper is as follows. First, the overview of Taiwan residential building was discussed. In this section, a typical floor plan and building form in Taiwan is concluded. The methodologies section then describes data measurements, TUS, Taiwanese climate condition, layout design and residential building design used in this study. The method section explains the buildings in the case study. A data analysis followed by the results section describe the energy simulation comparisons from four popular types of modern concrete residences. The effects of façade characteristics are then analyzed and compared. Last, model validation using comparative testing was used. All findings and consequences are summarized in the conclusion section.
2. Overview of Taiwan Residential Building
Taiwan was a Japanese colony between 1895 and 1945 [18]. During this period, many of the residential buildings were designed using Japanese concepts. A traditional verandah is a common style used as the outer corridor [19]. It is common for houses with this style to have a balcony in every unit (Figure 1). This opening is used for natural ventilation and daylight.
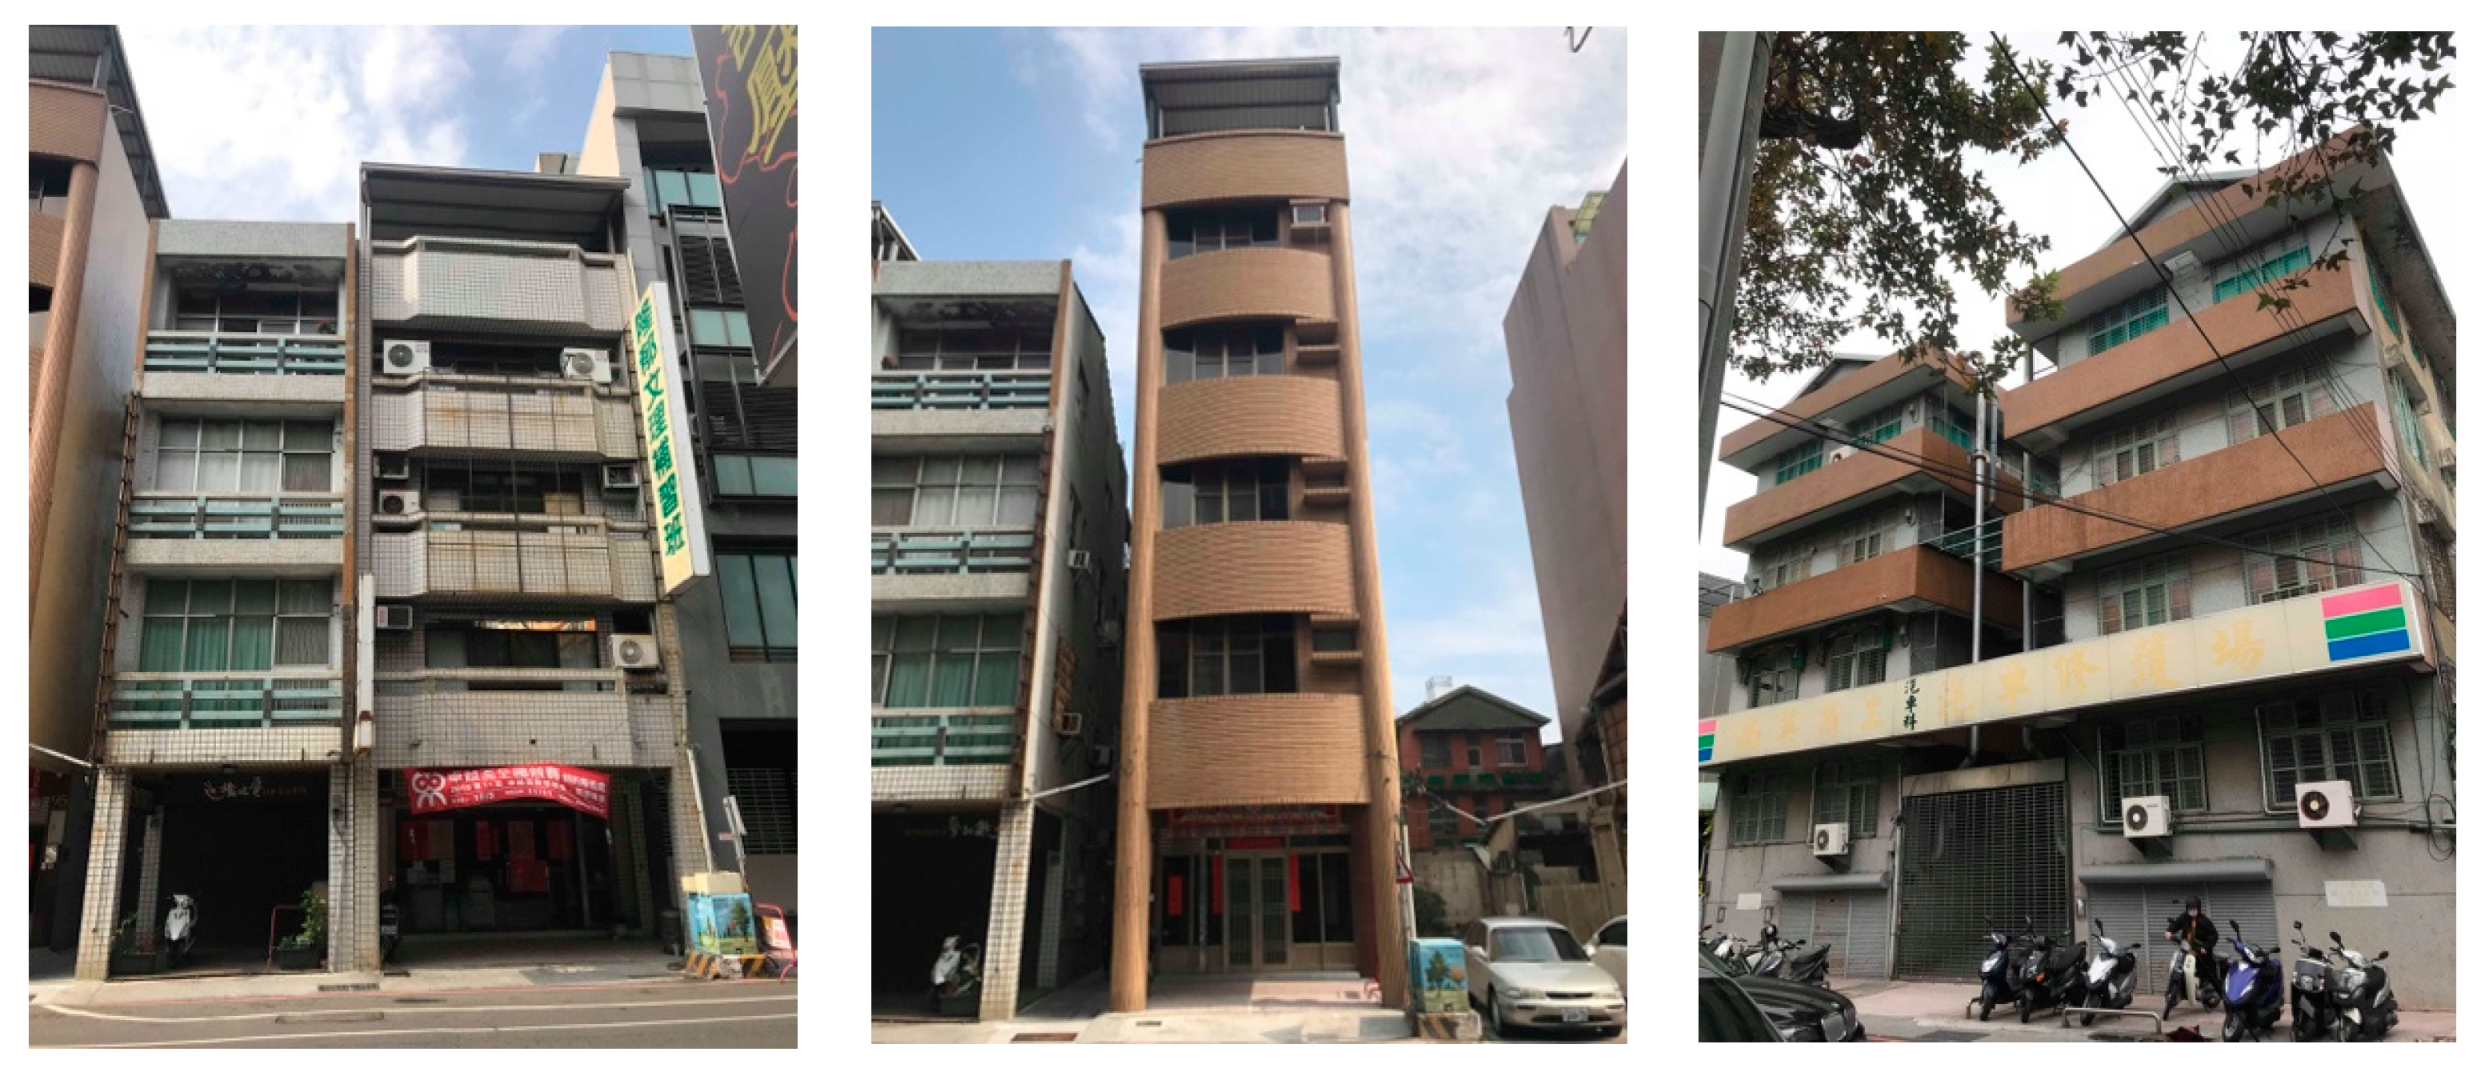
From the 1960s, Taiwan’s economy started to grow. Modern western architecture has become popular in Taiwan during the 1960s [19]. During that time, the government began to promote public housing and these were built as mostly western-style apartments that emphasize economic efficiency, simplicity, and practicality, in addition to aesthetics [20]. Since then, middle-rise residential buildings have been the most common type of dwelling (Figure 2). Constrained by this, architects lose some freedom to be creative. Since then, the majority of the country’s existing buildings use modern western architecture style.
Recently, an interest in green, known as the green building design, has increased dramatically [21]. This phenomenon also occurs in Taiwan. Green building is a design and building concept defined by sustainable environment and functionality, enabled by the development and rapid progress of technologies that are able to perform accurate analyses of complicated designs [22,23,24]. Modern trends usually express the purpose of buildings. Green architecture has more freedom design-wise because it employs complex technologies and aesthetic expression (Figure 3). A twisting smog-eating tower in Taipei is one of the ongoing green building projects, and it claims that it can reduce carbon dioxide annually [25]. However, some designers are being tied to a green building image and forget the main function of the façade. Thus, these buildings need to be evaluated to determine actual performance in line with predicted outcome [26].
Currently, all new buildings in Taiwan, both the public and private sectors, are required to comply with green building design. The Taiwan Government proposed a green building certification system called EEWH (Ecology, Energy, Waste Reduction, and Health). But on the other hand, Taipei only has a small percentage of new builds. The vast majority of existing buildings are old [27]. The Ministry of Interior has been promoting green building legislation for existing structures. However, an inadequate knowledge and information about green building concepts can confuse occupants, since it can be an overwhelming task to understand what each classification means. It is important to select energy efficient methods that are reversible. Both situations conclude that a need for the most basic design is simpler and cheaper.
3. Methodology
This paper discusses three main strategies in the design of multistory residential buildings for reducing energy consumption. It presents examples of energy performance based on three main parameters: Occupant behavior, building layout, and building design. The energy modeling was completed using DesignBuilder 5.5.2.007 (DesignBuilder Software Ltd, Stroud, Gloucestershire, United Kingdom) [28]. The software package has accurate time-driven modeling. Figure 4 illustrates the simulation procedure. The model was established by applying DesignBuilder to the building’s design. Energy consumption analysis was then conducted by inputting Taipei climate data. After the modeling was setup, the simulations were run to analyze the whole building’s simulation.
3.1. Minsheng Community’s TUS (Time Use Survey)
Elham Delzendeh et al. [13] reviewed more than 100 publications related to occupant energy behavior in buildings. According to the reviewed papers, the most frequent term used by scholars in this area is “occupant behavior.” An understanding of the high influence that the presence and behavior of occupants has on energy consumption leads to research innovations in occupant behavior and energy simulations [29,30,31]. Researchers conclude that the behavioral patterns of occupants significantly effects building energy usage [32]. Chiou et al. [33] developed a high spatial resolution model of energy used in residential buildings based on time use data by using Energy Plus. Diao et al. [34] focused on identifying and classifying occupant behaviors that lead to direct energy consumption outcomes. Moreover, the identification and classification of occupant behavior is one of the major factors that influences building energy consumption. The ability to model occupant behavior in the design would therefore lead to more realistic energy consumption results. Human behavior includes system operation and management, occupant behavior, and indoor environment condition. These factors work together to influence building energy use, as shown in Figure 5.
This research uses Minsheng occupants’ TUS for occupant behavior modeling. Minsheng community (1967) is one of the first residential districts in Taipei that was designed based on an American model community. The community was well-planned with the help of foreign planners in the 1960s and offered new ideas about how a good residential area should be designed during that period [35]. Because it was close to downtown Taipei City, housing mainly comes in the form of medium-rise apartments (Figure 8). The Taipei City Government plans to redevelop the Minsheng community. However, the old building consumes a considerable amount of energy [36,37,38]. For example, this was shown in our previous research presented to The Library of Institute of European and American Studies of Academia Sinica (IEAS) in Taipei, Taiwan [36]. The ratio between the total annual energy consumption and the floor area (EUI) of the IEAS Library is 11.63 kBtu/ft2/year. This result is higher than the consumption of current building. This paper aims to improve the knowledge and understanding of which strategy can be utilized to make the old building more energy efficient. Moreover, the analysis results can also give insights to building designers and energy policymakers about the best typical shape of residential building in an urban area.
TUS was chosen as an input variable in DesignBuilder. TUS recorded information about an individual’s activities during a 24-h period, as well as personal information such as the individual’s occupation and demographic background [34]. TUS used daily surveys in which respondents must transcribe their day as a series of episodes. TUS data were used to establish a more reliable causal relationship between Taiwanese behavior and residential energy demand. The Minsheng community is the first American-style integrated housing complex in Taipei, Taiwan (Figure 6). Minsheng TUS database has detailed occupant level data. These data have been classified to sub-house and sub-hour data of occupant load profile, HVAC (Heating, Ventilation, and Air Conditioning), lighting, and appliances.
Time use surveys are widely recognized by time-use social scientists as the most comprehensive corpus of data that can represent an occupant’s time use data in a detailed form. This survey, conducted using three years’ worth of census data collection, consisted of approximately 129 households with 510 residents that lived in the Minsheng community urban area. It recorded individuals’ 24-h time diaries of 15 min activity schedules. The survey employs three types of activity pattern during the workday, Friday (weekday-weekend transition day), and the weekend. Table 1 shows an example of a TUS record.
Energy time use in this complex was consistent with time use patterns in other housing complexes. Based on the Minsheng TUS database, families with four members were dominant with 50.39%, higher than any other family type. Thus, the four-member family type (parent and two children) was selected to represent Minsheng community household data for a further detailed study. However, there are some limitations related to error data that can decrease the validation of the data survey, such as:
- Incomplete occupant information and activity schedule;
- Incomplete occupant general information: age, gender, and activity;
- Less credible and reasonable data and activity schedule.
3.2. Taiwanese Climate Conditions
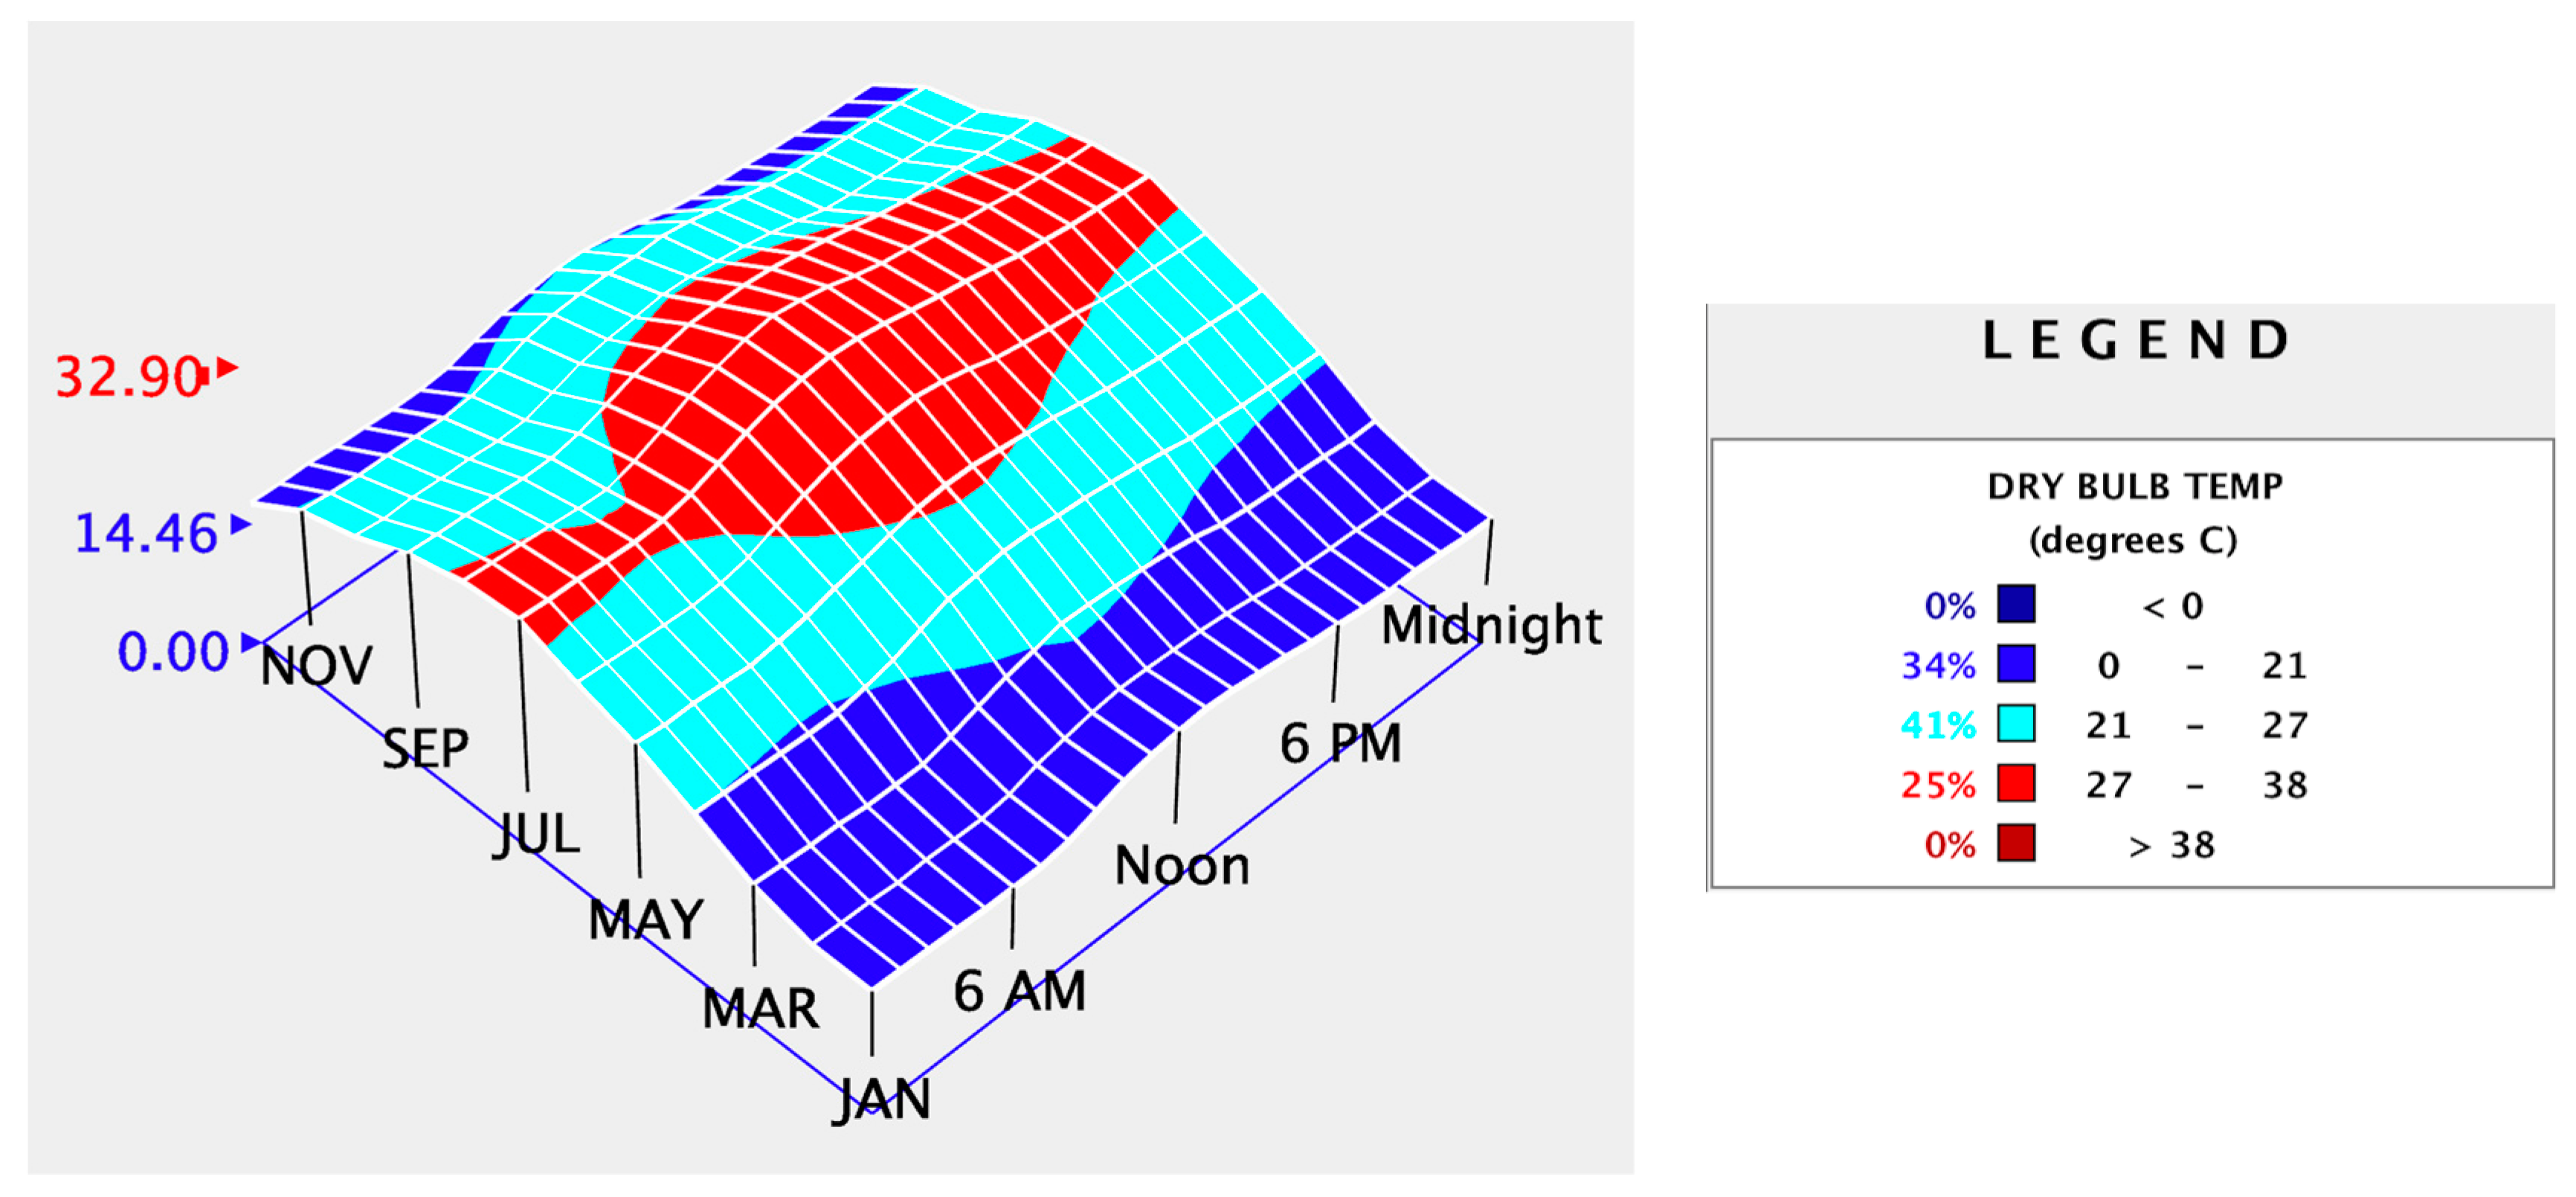
Taiwan is classified as a subtropical area. Some of its main characteristics are hot and dry summers and cold winters. Additionally, the Climate Consultant program provided us with all data concerning understanding of the local climate. Climate Consultant is a computer program that translates outdoor conditions to indoor comfort by using generalized assumptions about building design [39]. This program uses annual 8760-h EPW (EnergyPlus Weather file) format climate data and translates these raw data into graphical displays. During the summer season, the daily outdoor temperature reached 32 °C and the winter season reached 0 °C. January was the coldest month, representing winter, while July was the hottest month, representing summer. As shown in Figure 7, during the summer season, the daily outdoor temperature reached 32 °C and during the winter season it reached 0 °C.
3.3. Layout Design
Space layout is closely related to the household appliance location, especially air conditioners and lighting. Both play a crucial role in energy consumption. The layout design strategy manipulates the layout plan of a residential building to maximize its energy performance. Another important factor in house plan design is the partition’s material. Choosing a right wall partition might help designers to identify the best solution for reducing energy consumption, especially during the early design phase. Moreover, layout design will affect the building’s envelope, mainly because of window location and size.
The design is based on Ludwig Mies van der Rohe’s apartment design in Lake Shore Drive Apartments, Chicago, USA. His concept is called the open layout. Mies developed the use of exposed steel structures and glass to enclose spaces, using minimal structural framework [40,41]. He claims this strategy is one way to create an energy-efficient building. A typical single Taiwanese family house layout was chosen and redesigned by using an open plan in a rectangular shape (Figure 8). The two-bedroom generic house located in the south was 3 m deep and 3.5 m wide, with 3-m floor-to-ceiling height.
3.4. Residential Building Design
Four prototypes of residential buildings have been identified and their energy consumption were estimated using various envelope designs. These residential buildings that exhibit popular styles in Taipei were selected as case study buildings to simplify the model. Moreover, many studies [31,42,43] conclude that simple models have their own benefits, such as: Being more flexible, requiring less data, running faster, and being easier to interpret since the structure of the model is more easily understood. The process of simplification was focused on maintaining sufficient accuracy for addressing modelling objectives. In this case, identifying energy efficiency was the main focus in this research.
These buildings are low-rise houses (five stories). From this point forward, they will be called Building 1 (B1), Building 2 (B2), Building 3 (B3), and Building 4 (B4). The current study deals with the four different types, as shown in Table 2:
- A basic rectangular design with an overhang and a side fin located in the window that can control sunlight. This building design was replicated from a typical residential building in Taiwan that was developed in the 1960s. The overhang and side fin design could perform well year-round, reducing electricity compared to other shading designs [44]. The rectangular layout assumes four apartments on each floor, with two apartments on the south and two apartments on the north side (B1).
- A rectangular design layout with two apartments each on the south and the north side, with a corridor running along the north and the south façade (B2). The B2 style has a balcony in every unit.
- Building 3 is a common modern residential style in Taiwan. A square layout that contains one apartment each facing the south, west, north, and east directions. Each apartment has its own balcony (B3).
- B4 is a redesign from the new residential building “a twisting tower” in Taipei. A modern twist-angles (30°) design layout with a modern design, which allows the user to get more privacy and direct daylight. It has a basic square layout with four apartments on each floor (B4).
The general configuration of residential buildings in Taiwan is five stories, with four apartments on each floor, and each apartment is inhabited by a family of four. The total area of each apartment is 70 m2. In all the configurations, the WWR (Wall Window Ratio) is assumed to be 30%.
3.5. Building Model
Estimates of building energy consumption take into account complex interactions among weather conditions, occupant behaviors, and building characteristics [7]. Simulation tools can provide accurate predictions [45]. Energy simulation has been proven capable of reducing errors at the design stage and of effectively improving the efficiency of design [36,46,47]. In this study, DesignBuilder was applied to conduct an energy consumption simulation. By using DesignBuilder, energy consumption simulation was established based on the four residential building designs. There are three variable categories that influence household energy consumption. First is occupant system (occupant comfort and occupant behavior), in this case using TUS. Then the dwelling system, including HVAC (cooling), and lighting. Last is external environment systems.
Like all modeling software, DesignBuilder tools need validation. There are few techniques that can be used to assess the quality of a whole building energy simulation program [48]. In this research, comparative testing was used. The results from this program were compared with the results from time use data from one sample family. With this validation, a fast and reliable energy consumption estimate became possible.
The study started by using simulation tools. The research monitored energy usage of four typical modern residence buildings for the whole year. Then, envelope designs were analyzed via the simulation to determine the effects of different energy-saving design schemes. Moreover, DesignBuilder was provided with standard weather data. The building site configuration used the ASHRAE International Weather Files for Energy Calculation (ASHRAE IWEC). For simulation purposes, the general assumptions made in this study are described as follows:
- Occupancy of each apartment using Taiwanese time used data that are discussed in the next section;
- The air-conditioning was turned on when the room temperature was above 27 °C in a 24-h setting;
- Internal gains values are shown in Table 3;
- The default HVAC and COP (Coefficient of Performance) settings were used;
- Windows remained closed at all times; and
4. Simulation Results and Discussion
The research continued with building simulation. The research consisted of a total of 15 different simulation scenarios, three layout simulations (3 layouts × 1 family) and 12 building simulations (4 building types × 3 families). Three different time use family datasets were used. First, we started with a simple basic design house resided in by 13 families. Next, layout design simulation was analyzed. Space layout closely related to the household appliance location, especially air conditioner and lighting. Because Taiwan is located within a subtropical climate, electricity usage increases significantly during summer. Air-conditioning and lighting accounts for the highest portion of the year-around electricity consumption of household and commercial buildings [49]. Using solar gain of the exterior of building and cooling load analysis helped to evaluate the best strategies to reduce energy consumption. Lastly, model validation using comparative testing was used. The detailed results can be seen in the section below.
4.1. TUS Simulation Results
With the aim of achieving correct and assessable data and results, the compliance of simulations with standard calculation methods was fundamental. In total, 13 clusters were created from TUS data to represent the variation of household activity patterns. The selected family had two parents and two children. As shown in Figure 9, EUI analysis results from 13 families was recorded. The EUI (energy use electricity) is a measure of the annual total energy consumed per unit floor area when operating a building. Some clusters may therefore look like each other, such as clusters A (43.4 kWh/m2) and I (43 kWh/m2).
After the simulation process, family C (60.9 kWh/m2), D (63.8 kWh/m2), and E (74 kWh/m2) were found to consume higher energy than the other families (Figure 9). Among all the results, three families were selected to represent high (D), middle (M), and low (J) energy consumption.
4.2. Layout Simulation Results
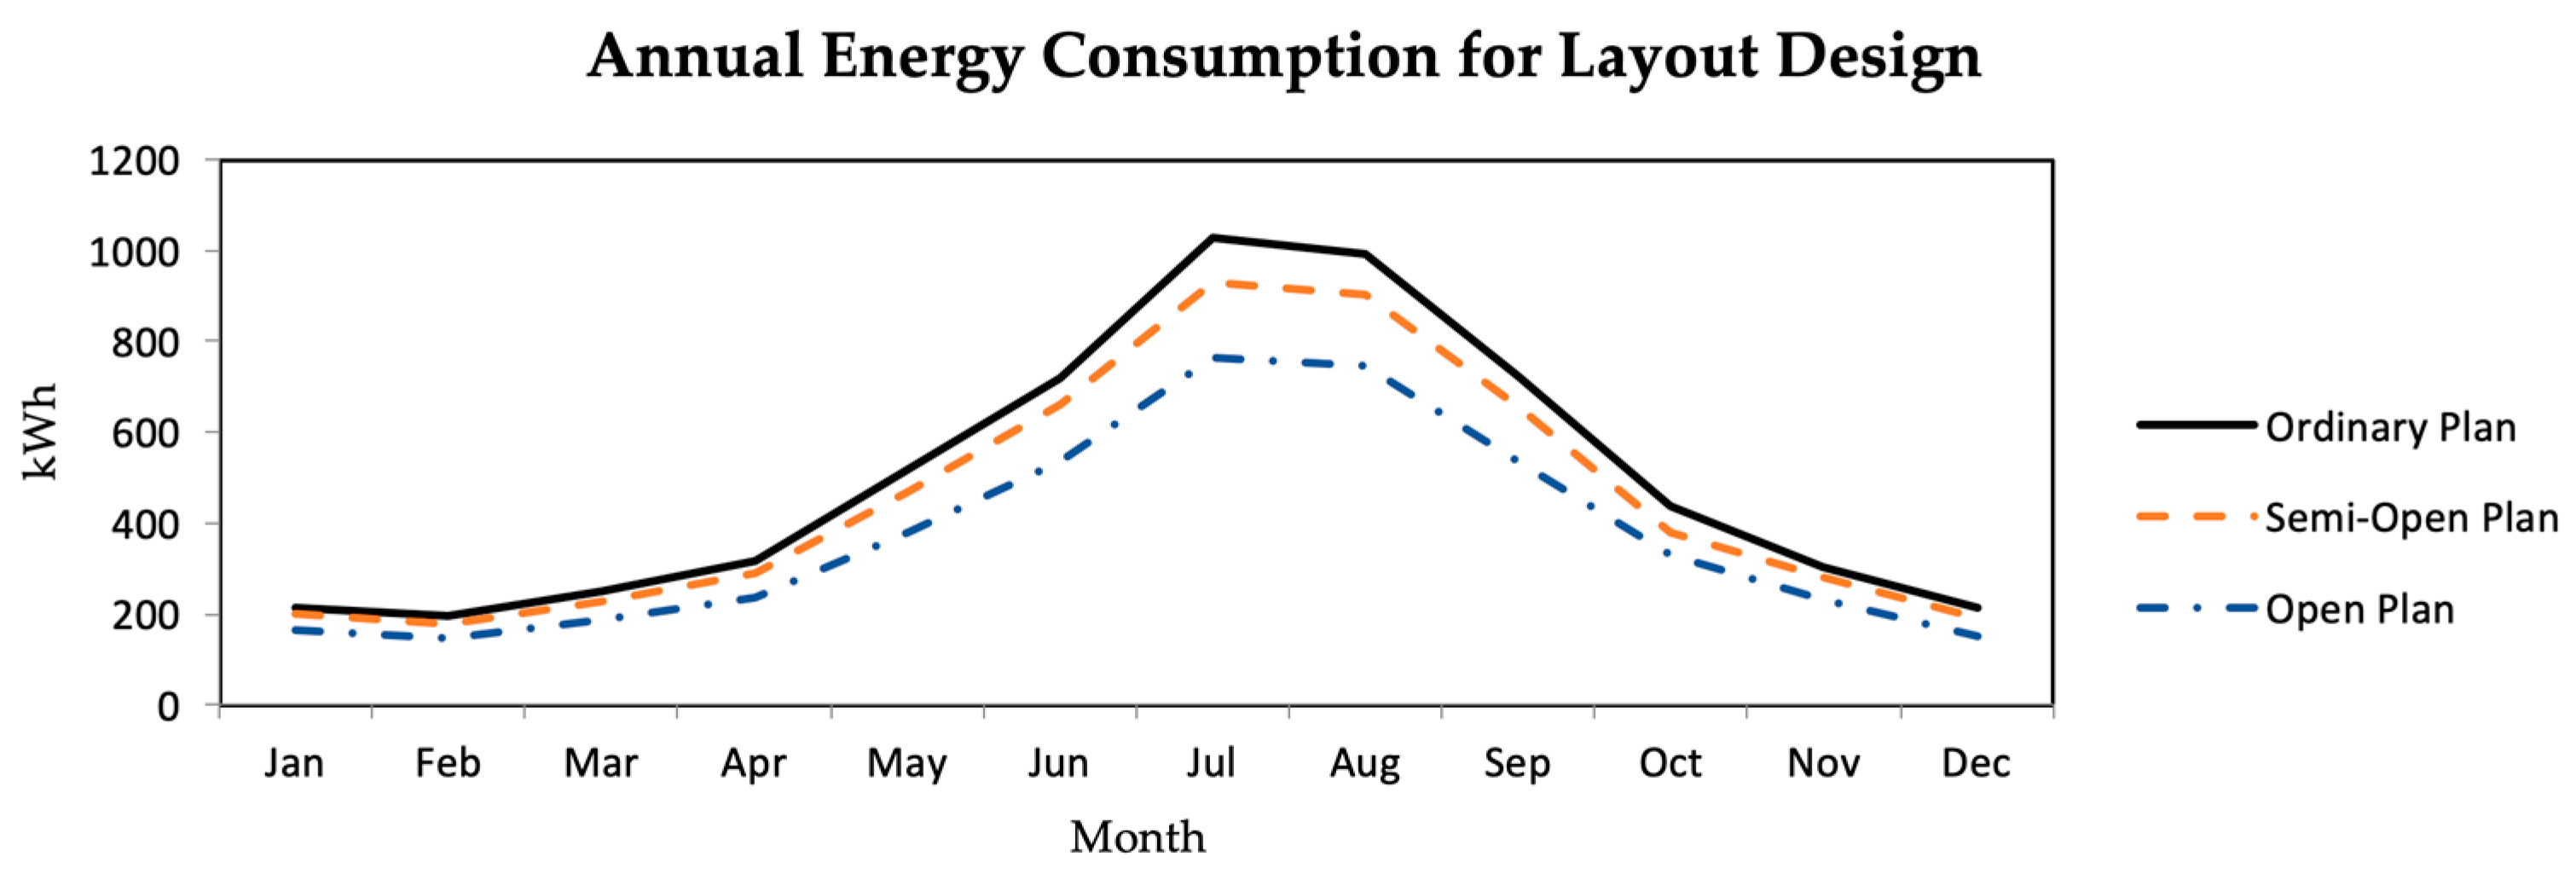
A layout design analysis was conducted as the next simulation step. This research compared an ordinary plan (which uses bricks as partition), a semi-open plan (which uses glass as partition), and open plan (without partition). As a preliminary simulation, we used Family D to compare three different layout plans. The annual energy consumption data of all three layout designs are summarized in Figure 10. Using the open plan provided the least energy consumption in comparison with the other cases, as shown in Figure 10. When compared to an ordinary plan, semi-open plan reduced 9% less annual energy consumption respectively, while open plan reduced 25% less annual energy consumption respectively. The open plan layout design reduced energy consumption for air conditioning and lighting.
For subsequent design simulations, the open plan was used as the base case simulation. An open plan was used to reduce cooling consumption and increase daylight. Each plan was designed based on each occupants’ pattern of daily activities, occupants’ age variations, as well as appliance, HVAC, and lighting equipment for daily activities. Three behavioral patterns and layout design were identified for future simulations, as shown in Table 6.
4.3. Solar Gain of the Exterior of a Building
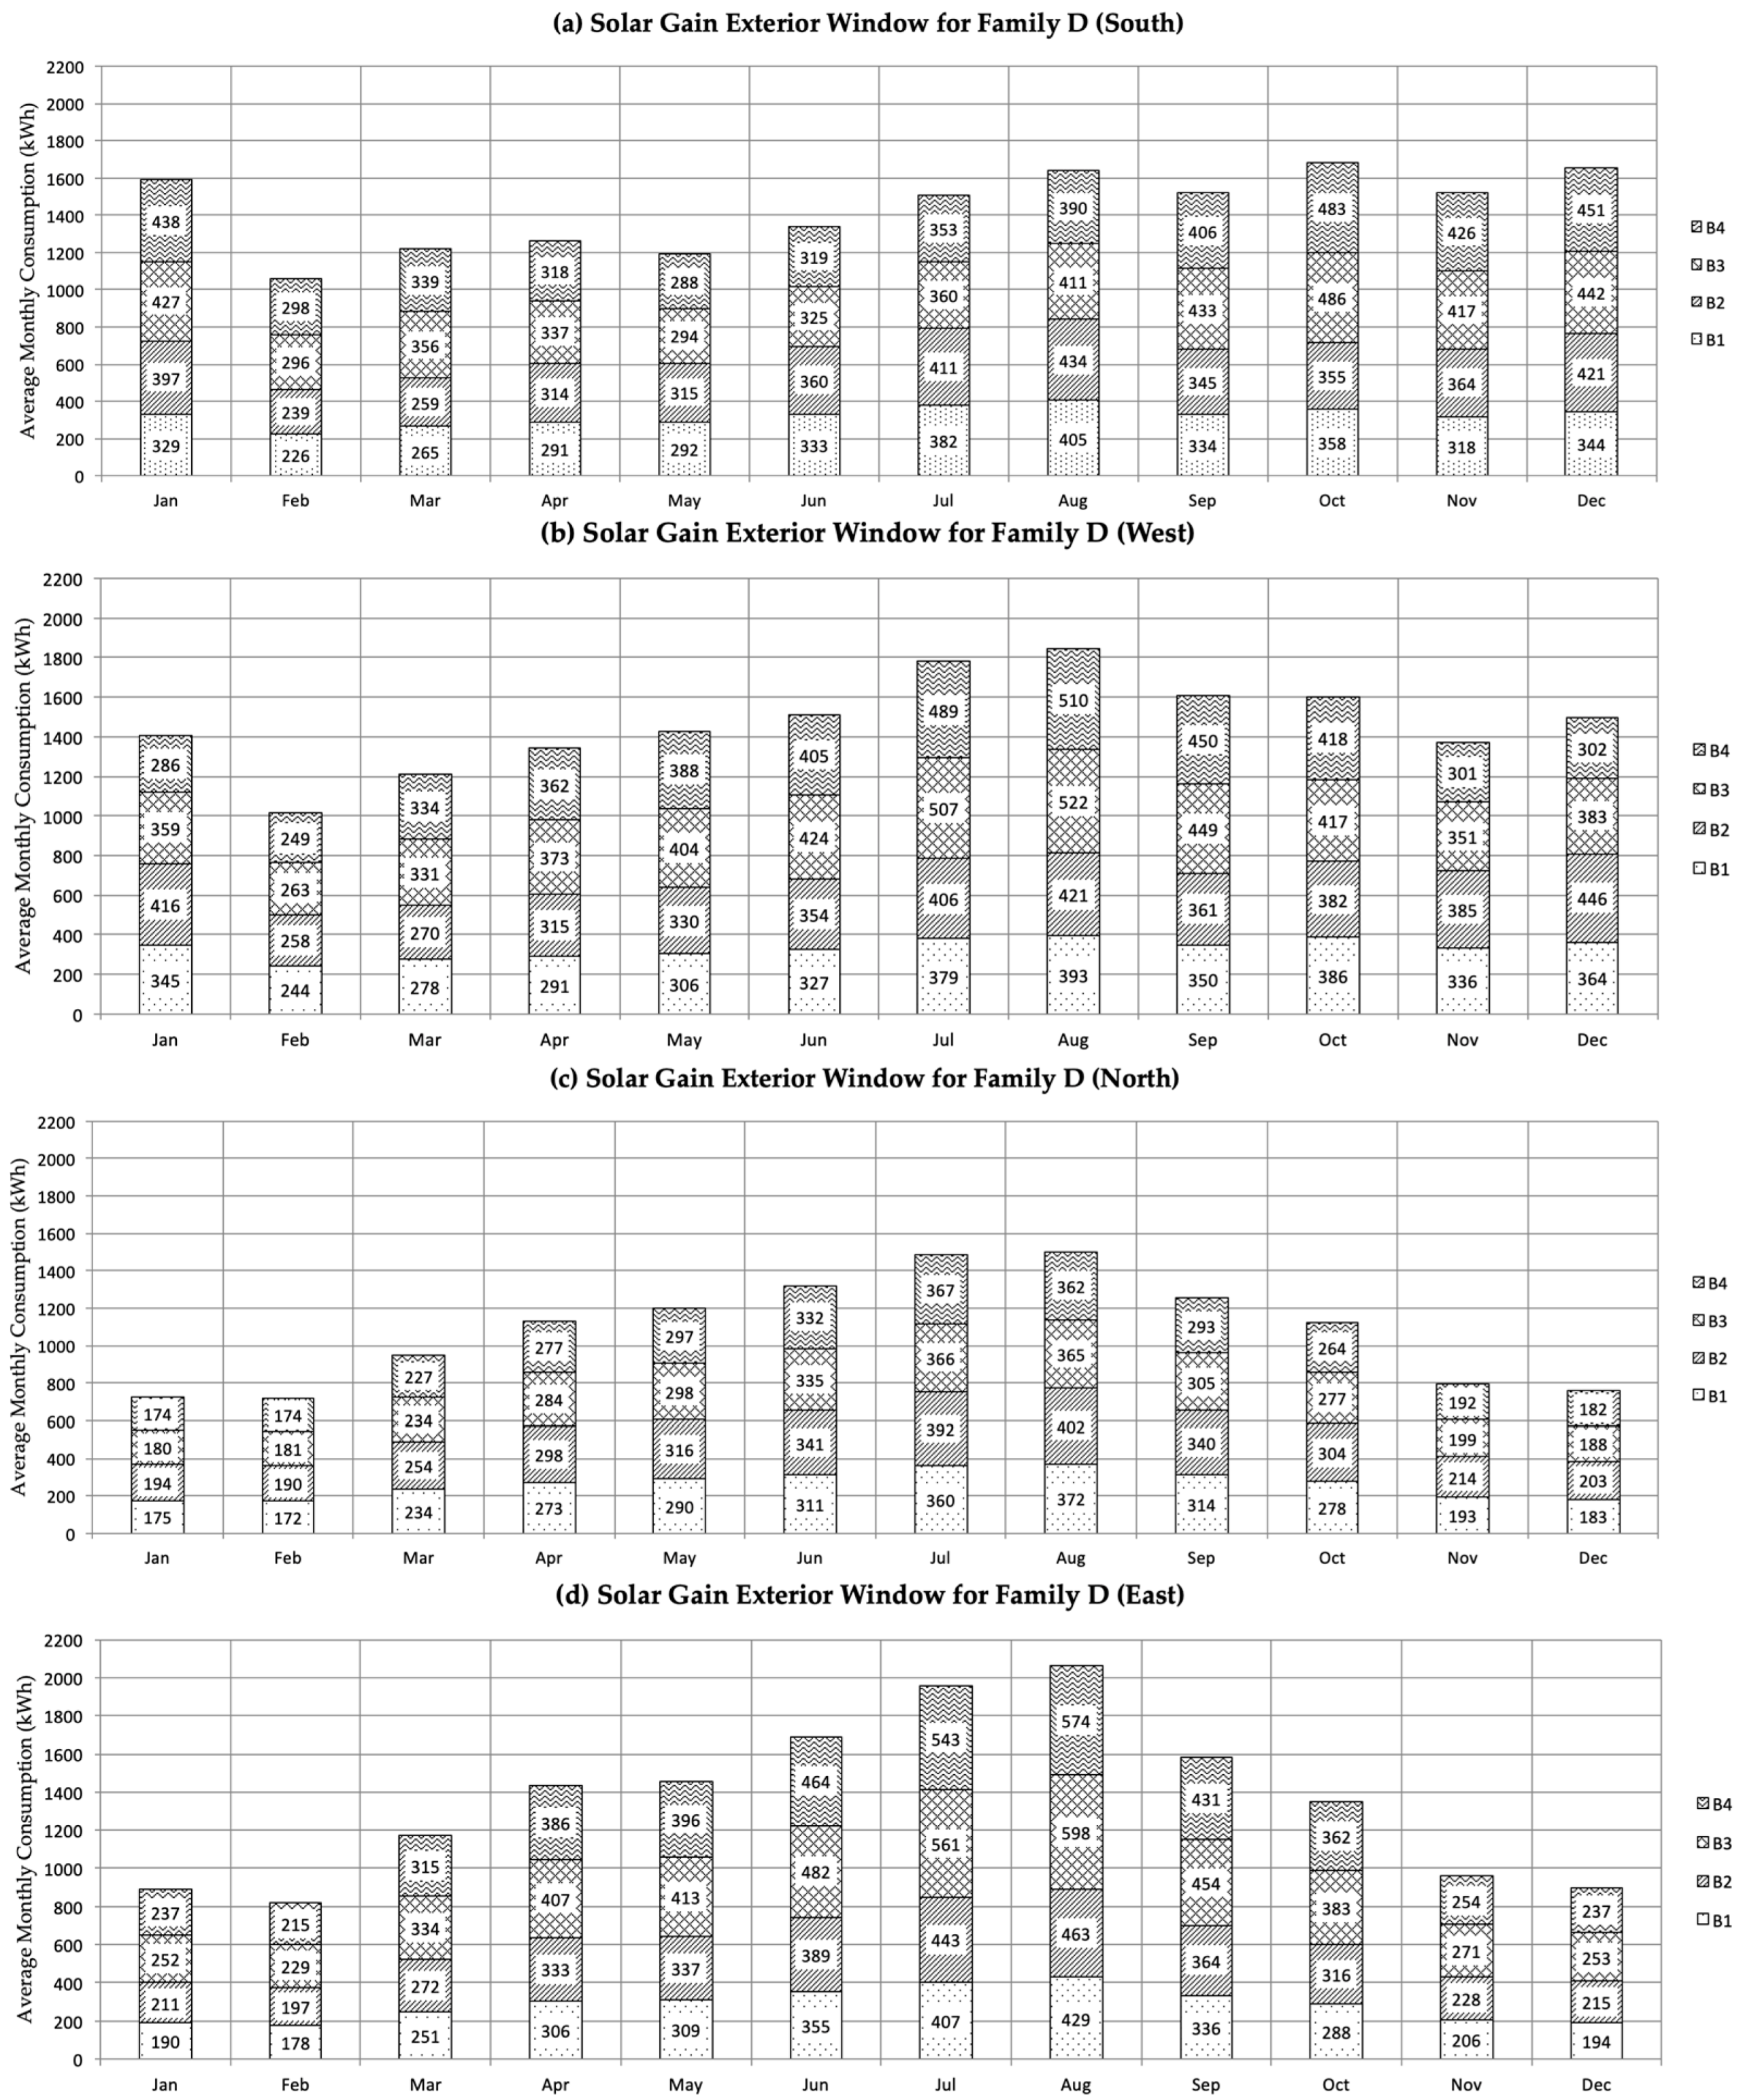
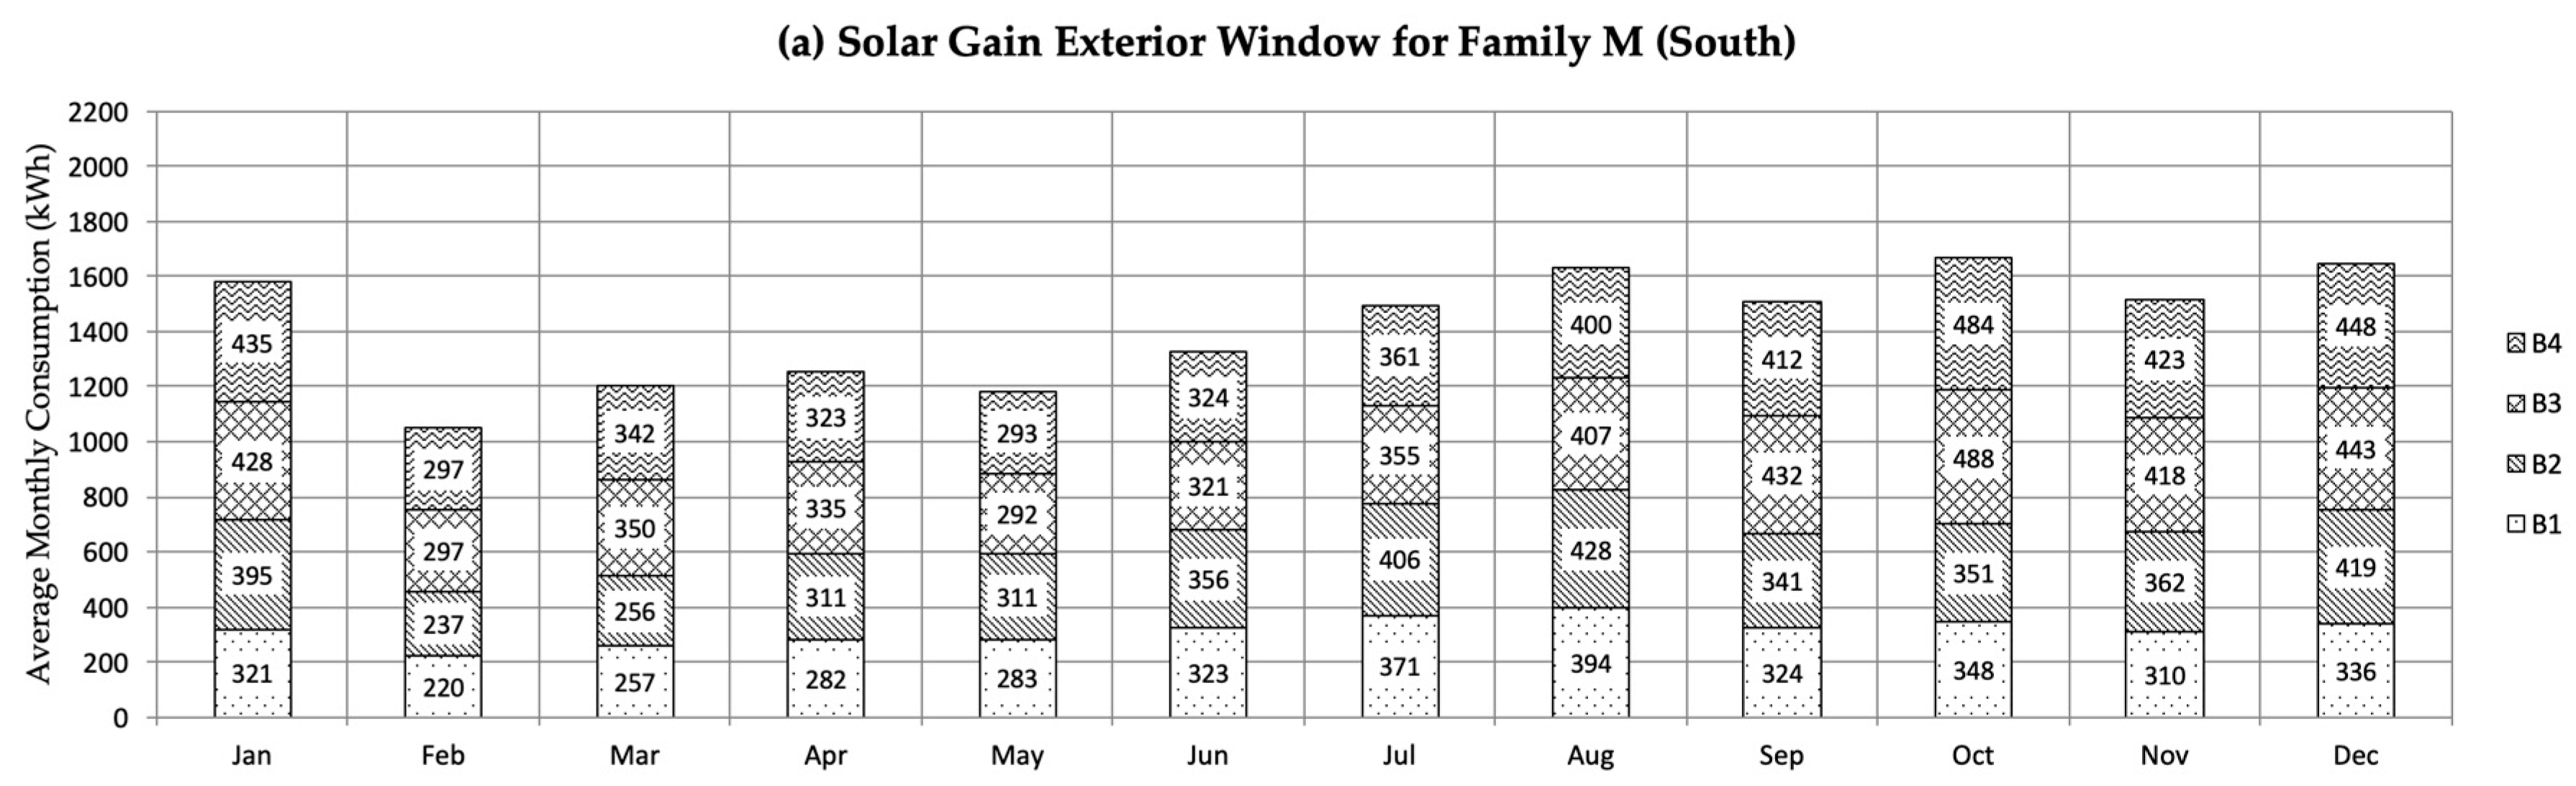
This study aimed to identify the best façade for residential building design in Taipei, Taiwan, by performing simulation tests on different prototype versions. By doing so, designers and planners could make more accurate predictions regarding building energy consumption in the design stage. Moreover, given a subtropical climate, the solar gain of the exterior from windows and the cooling load were the main factors in the design process. The subsequent simulation results focused on the solar gain of the exterior of a building and on cooling energy usage, since cooling energy will vary with the orientation of a window. Each building design (B1, B2, and B3) was simulated using three different families (families D, J, and M). This was done to enhance and validate the results. Figure 11, Figure 12 and Figure 13 show the average solar gain of the exterior of a building (kWh) using four envelope designs, over 12 months. In the summer season (represented in this paper as July and August), the solar gain load from windows was the highest compared to other months. Meanwhile, January and December (winter season) showed the lowest energy consumption. The performance of the south and north orientations were similar. Examining the results of Family D (Figure 11), the total energy consumption for B1 and B2 was almost the same. The results show that they are 23% lower than B3 and B4. Simple shading and a rectangular shape could reduce energy consumption more than a fancy modern style (B3, B4). The total energy consumption for Family J (Figure 12) shows similar results to Family D. Based on these results, we understand that user age is not an actual factor in a building’s energy performance. Family M (Figure 13) has the highest energy consumption and shows a similar trend in each month. The electricity consumption habits of this family (general lighting, task lighting, equipment) have a large impact on the total energy consumption. Overall, B1 has the lowest annual consumption for all families.
4.4. Cooling Load
The energy performance with regards to cooling for the whole floor of a residential building, featuring four low rise buildings, is presented in Figure 14, Figure 15 and Figure 16. The results indicated that the cooling load increased for the north orientation. More energy was consumed in the summer (July and August) than in January and December. In winter the cooling load energy consumption was quite small, contrary with summer cooling load energy consumption.
A simple design, B1 (opening combined with an overhang and side fin 0.5m_Building 1), can achieve additional savings of approximately 20% more than other building designs. In this case, taking apartment layouts and shapes into consideration shows that a unique architecture design does not always result in significant energy-saving potential. Based on this, neither the orientation nor the level of the buildings studied significantly influences electricity usage. There are two main reasons why building orientation and level does not have significant effects on energy consumption. Firstly, we are using the same activity template, occupancy and appliances data to simulate each building form (each building simulates for one family). Secondly, the building was simulated as a single building.
4.5. Model Validation
DesignBuilder is an EnergyPlus based software tool. EnergyPlus has been validated under the comparative standard method of test for the evaluation of building energy analysis computer programs building energy simulation test (BESTEST). BESTEST is a comparative set of tests which have become one of the most accepted methods to validate and test the simulation capabilities of the exterior envelope portions of building energy simulation programs [50,51]. The authors used DesignBuilder software since it also comes with extensive data templates for a variety of building simulation inputs such as occupancy schedules. These templates may be inputted with custom occupancy data, such as that obtained from the TUS Minsheng community. Some studies compared the energy consumption simulation results (using EnergyPlus) with actual values to get more accurate results [52,53]. Moreover, in this research, Minsheng family’s electricity consumption were collected to compare with simulated results. This validation means to diagnose internal sources error in simulation [54].
Both simulation and actual data were used for Family J. The comparison of electricity consumption results from the simulation with the actual consumption in housing (TUS) is summarized in Figure 17. Although time use and simulation used the same occupant behavior, the difference between the actual weather conditions and the outdoor conditions assumed in the simulation became one of the important factors. The consumption was similar for both actual and simulated results. However, during June, July, August, and September it demonstrated a large difference. Generally, shown differences in those months were less than 24% respectively. Oftentimes, simulation carried out during peak summer times can exhibit a high uncertainty due to large fluctuations in temperature over the month and the building’s corresponding occupancy variations.
5. Conclusions
The residential sector is one of the largest energy-consuming sectors in Taiwan. Most of the current building energy analysis research in Taiwan was based on building engineer and energy assessor. This research demonstrates building simulation analysis based on an architect’s point of view. In this paper, interior layout and exterior form were used as the main focus for reducing energy consumption. This paper will help designers to do better designs even if they have no simulation tools on hand, by proofing such results:
- Open plan is better than semi-open plan and ordinary plan in reducing energy consumption;
- Open plan can give the occupants more freedom to design based on their daily activities;
- Shading regardless of its form can help a lot to reduce energy consumption;
- It is highly recommended for designers to use basic designs as a preliminary concept before creating a complex design in order to achieve the best result.
The freedom of design in interior layout and exterior form will affect energy performance. These are the two most important areas of design decisions that architects must carefully consider in every project.
Author Contributions
Conceptualization, D.P.S.; methodology, Y.S.C.; software, D.P.S.; validation, D.P.S.; formal analysis, D.P.S. and Y.S.C.; investigation, D.P.S.; resources, Y.S.C.; data curation, D.P.S. and Y.S.C.; writing—original draft preparation, D.P.S.; writing—review and editing, D.P.S.; visualization, D.P.S.; supervision, Y.S.C.; project administration, D.P.S. and Y.S.C.; funding acquisition, Y.S.C.
Funding
This research received no external funding.
Acknowledgments
The authors are grateful to the ISAAC (Integrating Simulation and Analysis for Architectural Complexity) Lab at the National Taiwan University of Science and Technology (NTUST) of Taiwan (R.O.C.). The TUS data in this research was from the “Occupant-driven dynamic complex system model for community-scale building performance” research project sponsored by Taiwan’s Ministry of Science and Technology. This research was supported by the Indonesian Endowment Fund for Education (LPDP) of the Ministry of Finance of Indonesia.
Conflicts of Interest
The authors declare no conflict of interest.
References
- Ho, M.C. Green Building Promotion in Taiwan: Current Development and Future Perspectives Current Development and Future Perspective. Available online: http://unfccc.saveoursky.org.tw/2011cef/images/cadiis/presentation/s1t1.pdf (accessed on 15 August 2018).
- Hwang, J.J. Policy review of greenhouse gas emission reduction in Taiwan. Renew. Sustain. Energy Rev. 2011, 15, 1392–1402. [Google Scholar] [CrossRef]
- Liou, H.M. A comparison of the legislative framework and policies in Taiwan’s four GHG reduction acts. Renew. Sustain. Energy Rev. 2011, 15, 1723–1747. [Google Scholar] [CrossRef]
- Edenhofer, O.; Pichs-Madruga, R.; Sokona, Y.; Farahani, E.; Kadner, S.; Seyboth, K.; Adler, A.; Baum, I.; Brunner, S.; Eickemeier, P.; et al. Climate Change 2014: Mitigation of Climate Change. Available online: https://www.ipcc.ch/site/assets/uploads/2018/02/ipcc_wg3_ar5_frontmatter.pdf (accessed on 21 July 2018).
- Liu, F.; Meyer, A.S.; Hogan, J.F. Mainstreaming Building Energy Efficiency Codes in Developing Countries: Global Experiences and Lessons from Early Adopters. Available online: http://documents.worldbank.org/curated/en/284341468324865236/pdf/578770PUB0Main101public10BOX353783B.pdf (accessed on 25 July 2018).
- Feng, C.; Kuo, J.; Lin, C.H.; Hsu, M.W. Analysis of intelligent green building policy and developing status in Taiwan. Energy Policy 2016, 95, 291–303. [Google Scholar]
- Lin, K.L.; Jan, M.Y.; Liao, C.S. Energy consumption analysis for concrete residences: A baseline study in Taiwan. Sustainability 2017, 9, 257. [Google Scholar] [CrossRef]
- Vermette, C.H. Multistory building envelope: Creative design and enhanced performance. Sol. Energy 2018, 159, 710–721. [Google Scholar] [CrossRef]
- Zhou, Z.; Wang, C.; Sun, X.; Gao, F.; Feng, W.; Zillante, G. Heating energy saving potential from building envelope design and operation optimization in residential buildings: A case study in northern China. J. Clean. Prod. 2018, 174, 413–423. [Google Scholar] [CrossRef]
- Hachem, C.; Elsayed, M. Patterns of façade system design of enhanced energy performance of multistory buildings. Energy Build. 2016, 130, 366–377. [Google Scholar] [CrossRef]
- Mitterer, C.; Kunzel, H.M.; Herkel, S.; Holm, A. Optimizing energy efficiency and occupant comfort with climate specific design of the building. Front. Archit. Res. 2012, 1, 229–235. [Google Scholar] [CrossRef] [Green Version]
- Zemella, G.; Faraguna, A. Evolutionary Optimization of Façade Design: A New Approach for the Design of Building Envelopes, 1st ed.; Springer: London, UK, 2014; pp. 1–63. [Google Scholar]
- Delzendeh, E.; Wu, S.; Lee, A.; Zhou, Y. The impact of occupants’ behaviors on building energy analysis: A research review. Renew. Sustain. Energy Rev. 2017, 80, 1061–1071. [Google Scholar]
- Jacobs, J.B. Taiwan’s colonial experiences and the development of ethnic identities: Some hypotheses. Taiwan Comp. Perspect. 2014, 5, 47–59. [Google Scholar]
- Kajtazi, T.J.; Jakupi, A. Interpretation of architectural identity through landmark architecture: The case of Prishtina, Kosovo from the 1970s to the 1980s. Front. Archit. Res. 2017, 6, 480–486. [Google Scholar] [CrossRef]
- Zhang, M. Building Brand Identity: Sustainable Yet Iconic High-Rise Design for China’s Power Companies. 2008. Available online: http://global.ctbuh.org/ (accessed on 10 February 2019).
- Attia, S.; Gratia, E.; Herde, A.D.; Hensen, J.L.M. Simulation-based decision support tool for early stages of zero-energy building design. Energy Build. 2012, 49, 2–15. [Google Scholar] [CrossRef] [Green Version]
- Li, J.; Liu, X.; Liu, J.; Li, W. City profile: Taipei. Cities 2016, 55, 1–8. [Google Scholar] [CrossRef]
- Fu, C.C. A History of Modern Architecture in Taiwan, 1st ed.; Architectural Institute of Taiwan: Taipei, Taiwan, 2013; pp. 220–241. [Google Scholar]
- Taiwan Today. Buildings with Style. Available online: https://taiwantoday.tw/news.php?unit=20,20,29,35,35,45&post=26036 (accessed on 1 May 2018).
- Kriss, J.U.S. Green Building Council Certifies 50,000th Green Housing Unit uder LEED for Homes. Available online: https://www.usgbc.org/articles/us-green-building-council-certifies-50000th-green-housing-unit-under-leed-homes (accessed on 4 February 2019).
- Shiel, P.; Tarantino, S.; Fischer, M. Parametric analysis of design stage building energy performance simulation models. Energy Build. 2018, 172, 78–93. [Google Scholar] [CrossRef]
- Hensen, J.L.M. Building Performance Simulation for Design and Operation; Spon Press: New York, NY, USA, 2011; pp. 1–15. [Google Scholar]
- Habibi, S. The promise of BIM for improving building performance. Energy Build. 2017, 153, 525–548. [Google Scholar] [CrossRef]
- Lynch, P. Vincent Callebaut Architectures’ Double Helix Eco-Tower Takes Shape in Taiwan. Available online: https://www.archdaily.com/800209/vincent-callebaut-architectures-double-helix-eco-tower-takes-shape-in-taiwan (accessed on 2 February 2018).
- Bonde, M.; Ramirez, J. A post-occupancy evaluation of a green rated and conventional on-campus residence hall. Int. J. Sustain. Built Environ. 2015, 4, 400–408. [Google Scholar] [CrossRef] [Green Version]
- Huang, C.Y.; Lin, C.R.; Ho, M.C. Report on the State of Sustainable Building in Taiwan. Available online: http://www.iisbe.org/sbconferences/Taiwan_SB_Report_SB08.pdf (accessed on 29 January 2019).
- DesignBuilder. Available online: https://www.designbuilder.co.uk/ (accessed on 1 July 2017).
- Hong, T.; Taylor-Lange, S.C.; D’Oca, S.; Yan, D.; Corgnati, S.P. Advances in research and applications of energy-related occupant behavior in buildings. Energy Build. 2016, 116, 694–702. [Google Scholar] [CrossRef] [Green Version]
- Jia, M.; Srinivasan, R.S.; Raheem, A.A. From occupancy to occupant behavior: An analytical survey of data acquisition technologies, modeling methodologies and simulation coupling mechanisms for building energy efficiency. Renew. Sustain. Energy Rev. 2017, 68, 525–540. [Google Scholar] [CrossRef]
- Gaetani, I.; Hoes, P.J.; Hensen, J.L.M. Occupant behavior in building energy simulation: Towards a fit-for-purpose modeling strategy. Energy Build. 2016, 121, 188–204. [Google Scholar] [CrossRef]
- Hoes, P.; Hensen, J.L.M.; Loomans, M.G.L.C.; de Vries, B.; Bourgeois, D. User behavior in whole building simulation. Energy Build. 2009, 41, 295–302. [Google Scholar] [CrossRef]
- Chiou, Y.S.; Carley, K.M.; Davidson, C.I.; Johnson, M.P. A high spatial resolution residential energy model based on American Time Use Survey data and the bootstrap sampling method. Energy Build. 2011, 43, 3528–3538. [Google Scholar] [CrossRef]
- Diao, L.; Sun, Y.; Chen, Z.; Chen, J. Modelling energy consumption in residential buildings: A bottom-up analysis based on occupant behavior pattern clustering and stochastic simulation. Energy Build. 2017, 147, 47–66. [Google Scholar] [CrossRef]
- Chen, P.; Yen, Y. Necessity for diversity of commercial facilities for daily shopping in residential planning. In Proceeding of MATEC Web of Conferences, Hualien, Taiwan, 27–31 October 2017. [Google Scholar]
- Sari, D.P.; Chiou, Y.S. Achieving comfort and energy efficiency in modernism architecture heritage: The case of the library of the Institute of European and American Studies in Academia Sinica. Archotecture Sci. 2017, 15, 31–49. [Google Scholar]
- Kats, G.H. Green Building Costs and Financial Benefits; Massachusetts Technology Collaborative: Massachusetts, MA, USA, 2003; pp. 1–10. [Google Scholar]
- Wu, C.Y.; Lo, S.F. What makes a greener building? Lessons from Taiwan. J. Environ. Prot. 2018, 9, 957–972. [Google Scholar] [CrossRef]
- Milne, M. Climate Consultant. Available online: http://www.energy-design-tools.aud.ucla.edu/climate-consultant/ (accessed on 19 February 2019).
- Alfirevic, D.; Alfirevic, S.S. Open-plan in housing architecture: Origin, development and design approaches for spatial integration. Arhitektura i Urbanizam 2016, 43, 45–60. [Google Scholar] [CrossRef]
- Johnson, P.C. Mies van der Rohe. Available online: https://www.moma.org/documents/moma_catalogue_2734_300062055.pdf (accessed on 5 December 2017).
- Trcka, M.; Hensen, J.L.M. Overview of HVAC system simulation. Autom. Constr. 2010, 19, 93–99. [Google Scholar] [CrossRef] [Green Version]
- Kotiadis, K.; Robinson, S. Conceptual modeling: Knowledge acquisition and model abstraction. In Proceedings of the 2008 Winter Simulation Conference, Miami, FL, USA, 7–10 December 2008. [Google Scholar]
- Sari, D.P.; Chiou, Y.S. Energy saving potential from shading design for residential house in rural area. In Proceedings of the MATEC Web of Conferences, Bali, Indonesia, 26–29 September 2017. [Google Scholar]
- Huang, K.T.; Hwang, R.L. Future trends of residential building cooling energy and passive adaptation measures to counteract climate change: The case of Taiwan. Appl. Energy 2016, 184, 1230–1240. [Google Scholar] [CrossRef]
- Guo, S.J.; Wei, T. Cost-effective energy saving measures based on BIM technology: Case study at National Taiwan University. Energy Build. 2016, 127, 433–441. [Google Scholar] [CrossRef]
- Kaewunruen, S.; Rungskunroch, P.; Welsh, J. A digital-twin evaluation of net zero energy building for existing buildings. Sustainability 2019, 11, 159. [Google Scholar] [CrossRef]
- Hensen, J.L.M.; Radosevic, M. Teaching building performance simulation-some quality assurance issues and experiences. In Proceedings of the PLEA International Conference on Passive and Low Energy Architecture, Eindhoven, The Netherlands, 19–21 September 2004. [Google Scholar]
- Ministry of Economic Affairs, Bureau of Energy, R.O.C. Available online: https://www.moeaboe.gov.tw/ (accessed on 12 March 2017).
- Judkoff, R.; Neymark, J. International Energy Agency Building Energy Simulation Test (BESTEST) and Diagnostic Method; National Renewable Energy Laboratory: Golden, CO, USA, 1995.
- Michael, S.; Ryan, M.F.; Dimitri, C.; Chris, M. On-Site Generation Simulation with Energyplus for Commercial Buildings. Available online: https://eta.lbl.gov/ea/EMS/EMS_pubs.html (accessed on 8 March 2019).
- Eskin, N.; Turkmen, H. Analysis of annual heating and cooling energy requirements for office buildings in different climates in Turkey. Energy Build. 2008, 40, 763–773. [Google Scholar] [CrossRef]
- Fathalian, A.; Kargarsharifabad, H. Actual validation of energy simulation and investigation of energy management strategies (Case Study: An office building in Semnan, Iran). Case Stud. Therm. Eng. 2018, 12, 510–516. [Google Scholar] [CrossRef]
- Judkoff, R.; Wortman, D.; O’Doherty, B.; Burch, J. A Methodology for Validating Building Energy Analysis Simulations; National Renewable Energy Laboratory: Golden, CO, USA, 2008.
Figure 1.
High-rise residential buildings use verandahs as outer corridors (Japanese style).

Figure 2.
Middle and high-rise residential buildings of the most common type in Taiwan.

Figure 3.
A twisting, smog-eating tower in Taipei, Taiwan: (a) Design process; (b) under construction [25]; and (c) current condition.
Figure 3.
A twisting, smog-eating tower in Taipei, Taiwan: (a) Design process; (b) under construction [25]; and (c) current condition.

Figure 4.
Flowchart describing the building simulations’ process.

Figure 5.
Factors influencing building energy use.

Figure 6.
One of Minsheng community’s unit, located near the Keelung River (a), and one of the residential multistory buildings there (b).
Figure 6.
One of Minsheng community’s unit, located near the Keelung River (a), and one of the residential multistory buildings there (b).

Figure 7.
Psychometric chart for Taipei, Taiwan from the Climate Consultant program displaying January as the coldest month and July as the hottest month. Location: Taipei, Taiwan; Latitude/Longitude: 25.07ʹʹ N, 121.55ʹʹ E, Time Zone from Greenwich 8. Data Source: IWEC Data 466960 WMO Station Number, Elevation 6 m.

Figure 8.
Case-study building layouts. Left: Standard plan. Right: Open plan.

Figure 9.
Profile of energy use electricity (EUI) analysis resulting from 13 clusters; Minsheng, Taipei, Taiwan.
Figure 9.
Profile of energy use electricity (EUI) analysis resulting from 13 clusters; Minsheng, Taipei, Taiwan.

Figure 10.
Annual energy consumption of all layout designs (three layouts).

Figure 11.
Solar gain exterior window (kWh) results for Family D. From top to bottom: (a) South orientation; (b) West orientation; (c) North orientation; (d) East orientation.
Figure 11.
Solar gain exterior window (kWh) results for Family D. From top to bottom: (a) South orientation; (b) West orientation; (c) North orientation; (d) East orientation.

Figure 12.
Solar gain exterior window (kWh) results for Family J. From top to bottom: (a) South orientation; (b) West orientation; (c) North orientation; (d) East orientation.
Figure 12.
Solar gain exterior window (kWh) results for Family J. From top to bottom: (a) South orientation; (b) West orientation; (c) North orientation; (d) East orientation.

Figure 13.
Solar gain exterior window (kWh) results for Family M. From top to bottom: (a) South orientation; (b) West orientation; (c) North orientation; (d) East orientation.
Figure 13.
Solar gain exterior window (kWh) results for Family M. From top to bottom: (a) South orientation; (b) West orientation; (c) North orientation; (d) East orientation.


Figure 14.
Cooling load (kWh) results for Family D. From top to bottom: (a) South orientation; (b) West orientation; (c) North orientation; (d) East orientation.
Figure 14.
Cooling load (kWh) results for Family D. From top to bottom: (a) South orientation; (b) West orientation; (c) North orientation; (d) East orientation.

Figure 15.
Cooling load (kWh) results for Family J. From top to bottom: (a) South orientation; (b) West orientation; (c) North orientation; (d) East orientation.
Figure 15.
Cooling load (kWh) results for Family J. From top to bottom: (a) South orientation; (b) West orientation; (c) North orientation; (d) East orientation.


Figure 16.
Cooling load (kWh) results for Family M. From top to bottom: (a) South orientation; (b) West orientation; (c) North orientation; (d) East orientation.
Figure 16.
Cooling load (kWh) results for Family M. From top to bottom: (a) South orientation; (b) West orientation; (c) North orientation; (d) East orientation.


Figure 17.
Comparison of electricity consumption results of DesignBuilder with actual consumption in housing (TUS).
Figure 17.
Comparison of electricity consumption results of DesignBuilder with actual consumption in housing (TUS).


Table 1.
An example of a time use survey (TUS) records.
| Start Time | End Time | Activity Description | Location Description | Electricity |
|---|---|---|---|---|
| Weekday | ||||
| 00:00 | 01:00 | Washing | Bathroom | General lighting, hot water |
| 01:00 | 06:30 | Sleeping, dressing | Master bedroom | General lighting, night lighting |
| 06:30 | 07:30 | Washing | Bathroom | General lighting, hot water |
| 07:30 | 10:00 | Eating, sitting, cooking | Living room, kitchen | Gas stove, general lighting |
| 10:00 | 12:00 | Travel | ||
| 12:00 | 13:30 | Sitting relaxed | Living room | Mobile phone |
| 13:30 | 17:30 | Travel | ||
| 17:30 | 18:45 | Eating | Dining room | General lighting |
| 18:45 | 19:15 | Sleeping | Master bedroom | General lighting |
| 19:15 | 20:30 | Washing | Bathroom | General lighting, hot water |
| 20:30 | 22:45 | Eating, sitting | Living room | General lighting |
| 22:45 | 01:00 | Sitting relaxed | Living room | General lighting |
| Friday | ||||
| 00:00 | 01:00 | Watching television | Living room | Television |
| 01:00 | 07:45 | Sleeping, dressing | Master bedroom | General lighting, night lighting |
| 07:45 | 08:15 | Washing | Bathroom | General lighting, hot water |
| 08:15 | 10:00 | Eating, sitting, cooking | Living room, kitchen | Gas stove, general lighting |
| 10:00 | 12:00 | Sleeping | Master bedroom | |
| 12:00 | 13:30 | Sitting relaxed | Living room | Mobile phone |
| 13:30 | 17:30 | Travel | ||
| 17:30 | 18:00 | Eating | Dining room | General lighting |
| 21:00 | 22:00 | Watching television | Living room | Television, general lighting |
| 22:00 | 23:00 | Washing | Bathroom | General lighting, hot water |
| 23:00 | 00:00 | Sleeping | Bedroom | Night lighting |
| Weekend | ||||
| 00:00 | 00:30 | Washing | Bathroom | General lighting, hot water |
| 00:30 | 08:00 | Sleeping, dressing | Master bedroom | General lighting, night lighting |
| 08:00 | 09:00 | Eating, sitting | Living room | |
| 09:00 | 19:45 | Travel | ||
| 19:45 | 20:15 | Washing | Bathroom | General lighting, hot water |
| 20:15 | 00:30 | Eating, sitting | Living room | General lighting |
Table 2.
Four building designs modeled in this study.
| Name | Building Concept | Building Design | Site Plan | Detail |
|---|---|---|---|---|
| B1 |  |  |  |  |
 | ||||
| Typical Taiwanese house (1960s) | A basic rectangular design with an overhang and a side fin | Four apartments on each floor, with two apartments on the south side and two apartments on the north side | Top: Perspective view Below: Front view | |
| B2 |  |  |  |  |
 | ||||
| Typical Taiwanese house with Japanese concept | A traditional verandah is a common style used as outer corridor | Two apartments each on the south and the north side, with a corridor running along the north and south façade | Top: Perspective view Below: Front view | |
| B3 |  |  |  |  |
 | ||||
| Common modern residential style in Taiwan | Each apartment has its own balcony | A square layout that contains one apartment each facing the south, west, north, and east directions | Top: Perspective view Below: Front view | |
| B4 |  |  |  |  |
 | ||||
| New modern “a twisting tower” residential building in Taipei, Taiwan | A modern twist-angles (30°) design layout with a modern design, which allows the user to get more privacy and direct daylight | A square layout that contains one apartment each facing the south, west, north, and east directions | Top: pPrspective view Below: Front view |
Table 3.
DesignBuilder simulation input data.
| Variable | Value | Data |
|---|---|---|
| Design temperature | Cooling set-point | 27 °C |
| Target luminance | - | 150 lux |
| Minimum fresh air | Living room | 7.5 (l/s-person) |
| Bathroom | 10 (l/s-person) | |
| Kitchen | 12 (l/s-person) | |
| Natural ventilation | - | 27 °C |
| Weather data | Taiwan | - |
Table 4.
Material properties of building elements.
| Element | Construction | U-value (W/m2K) |
|---|---|---|
| Wall | Concrete + ceramic tile | 0.351 |
| Foundation | Concrete | 0.351 |
| Floor | Ceramic | 0.434 |
| Roof | Flat roof | 0.252 |
| Internal partition | - | 4.730 |
| Windows | Clear glass | 6.257 |
Table 5.
Electricity consumption values for household appliances.
| Space | Appliance | Power Consumed (W) |
|---|---|---|
| Living room | Television | 213 |
| General lighting | 28 | |
| Night lighting | 7 | |
| Computer | 250 | |
| Air conditioner | 1800 | |
| Master bedroom | General lighting | 28 |
| Night lighting | 7 | |
| Air conditioner | 1800 | |
| Fan | 75 | |
| Bedroom | General lighting | 28 |
| Night lighting | 7 | |
| Television | 213 | |
| Air conditioner | 1800 | |
| Fan | 75 | |
| Dining room | General lighting | 28 |
| Bathroom | General lighting | 28 |
| Kitchen | General lighting | 28 |
| Microwave | 800 | |
| Electric hot water | 380 | |
| Refrigerator | 58 | |
| Laundry room | General lighting | 28 |
| Washing machine | 2300 | |
| Lobby | General lighting | 28 |
Table 6.
Layout designs in DesignBuilder for the three different typical families in Taipei, Taiwan.
Table 6.
Layout designs in DesignBuilder for the three different typical families in Taipei, Taiwan.
| Family Name | Layout Design |
|---|---|
| Family D Occupant family members were husband (43), wife (39), daughter (9), and son (3). |  |
| The wife (39) and son (3) spent more time at home and consumed more energy. They combined their dining and living room. Bedroom 1 is for the husband (43), wife (39) and son (3); Bedroom 2 is for the daughter (9). | |
| Family J Occupant family members were husband (52), wife (52), son (16), and daughter (13). |  |
| Occupants combined their dining and living room. They spent most of their time outside during the daytime. The occupants had a unique schedule; they cooked on weekdays and Fridays. | |
| Family M Occupant family members were husband (46), wife (43), son (12), and son (9). |  |
| They cooked regularly (twice a day, for a minimum of 1 h and maximum of 2 h per day). Occupants were doing different activities in different spaces. |
© 2019 by the authors. Licensee MDPI, Basel, Switzerland. This article is an open access article distributed under the terms and conditions of the Creative Commons Attribution (CC BY) license (http://creativecommons.org/licenses/by/4.0/).
Share and Cite
MDPI and ACS Style
Sari, D.P.; Chiou, Y.-S. Do Energy Conservation Strategies Limit the Freedom of Architecture Design? A Case Study of Minsheng Community, Taipei, Taiwan. Sustainability 2019, 11, 2003. https://doi.org/10.3390/su11072003
AMA Style
Sari DP, Chiou Y-S. Do Energy Conservation Strategies Limit the Freedom of Architecture Design? A Case Study of Minsheng Community, Taipei, Taiwan. Sustainability. 2019; 11(7):2003. https://doi.org/10.3390/su11072003
Chicago/Turabian StyleSari, Dany Perwita, and Yun-Shang Chiou. 2019. "Do Energy Conservation Strategies Limit the Freedom of Architecture Design? A Case Study of Minsheng Community, Taipei, Taiwan" Sustainability 11, no. 7: 2003. https://doi.org/10.3390/su11072003
Note that from the first issue of 2016, this journal uses article numbers instead of page numbers. See further details here.