Spatial Considerations for Implementing Two Direct-to-Consumer Food Models in Two States
by
 and
and
Marilyn Sitaker
1, 
Jared T. McGuirt
2,
Weiwei Wang
3,
Jane Kolodinsky
3 and
Rebecca A. Seguin
4
1
Agricultural Ecology and Food Systems, The Evergreen State College, 2700 Evergreen Pkwy NW, Olympia, WA 98505, USA
2
Department of Nutrition, University of North Carolina at Greensboro, 319 College Avenue, 318 Stone Building, Greensboro, NC 27412, USA
3
Center for Rural Studies, University of Vermont, 206 Morrill Hall, Burlington, VT 05405, USA
4
Division of Nutritional Sciences, Cornell University, Savage Hall, Ithaca, NY 14853, USA
Sustainability 2019, 11(7), 2081; https://doi.org/10.3390/su11072081
Submission received: 1 March 2019
/
Revised: 2 April 2019
/
Accepted: 4 April 2019
/
Published: 8 April 2019
(This article belongs to the Special Issue Management of Community Supported Agriculture)
Abstract
:To open new markets, some farmers have adapted direct-to-consumer (DTC) models, such as Community Supported Agriculture (CSA), to reach new settings or audiences. We compared sociodemographic and geospatial contexts to farmers’ experience with one of two DTC innovations: a cost-offset CSA for low-income families and food boxes distributed through rural convenience stores. We geocoded addresses of thirteen farms and DTC pickup sites in two U.S. states (Vermont and Washington) and calculated road network distances from pickup to supermarket, farmers’ market, and farm. We compiled Census block-level demographic and transportation data, and compared it to postseason interviews to explore the effect of suitability of the pickup location; proximity to food retail; and potential farmer burden. Most pickup areas were heavily car-dependent, with low walkability and few public transportation options. Conventional sources of fresh produce were within six miles of most pickups, but farmers markets were further away. Despite modest profitability, both models were deemed worth pursuing, as they expanded farmers’ customer base. Farmers implementing the store-distributed food box were sensitive to market trends and customer needs in choosing pickup location. Farmers seemed more concerned with marketing in convenience store settings, and finding efficient ways to conduct recordkeeping than with delivery distances.
1. Introduction
Between 2002 and 2012, the growth in sales by small-scale producers outpaced that of total agricultural sales, despite the fact that these small-scale producers represent only about eight percent of farms in the U.S. [1,2,3,4]. By 2012, seventy percent of these farmers sold their product through direct-to-consumer (DTC) market channels such as farmers’ markets, farm stands, and community supported agriculture (CSA) subscriptions, capturing about a third of locally grown food sales [2]. Compared to conventional markets, which demand uniformity, large volumes, year-round availability, and nonperishability, DTC venues offer local producers several advantages: the ability to sell produce in season, in varieties of their choosing, at a scale they prefer, and with greater control over pricing and production practices [5]. Additionally, selling through DTC venues allows farmers to participate in a “moral economy” in which the goals of environmental sustainability and social wellbeing are valued along with farm profitability, and transactions include a strong focus on relationship building [6,7].
Eliminating the middleman can help farmers capture a larger proportion of the final consumer dollars, thereby increasing revenues [8,9,10,11,12]. Yet bypassing value-chain intermediaries means farmers must acquire new knowledge and take on additional duties and costs. For example, the resources required to attract and maintain a core group of customers [13], make deliveries, and staff sales booths [14] detracts from time in the field, eats into farmer incomes, and increases self-exploitation [15]. Nevertheless, many local farmers continue to sell through direct channels, motivated by a strong desire to provide locally grown foods to nearby consumers, cultivate social capital, and promote sustainable agricultural practices and land stewardship [7]. Being able to realize those ideals, however, may be challenging for farmers who also need to make a living [7,14].
Like all entrepreneurs, DTC farmers must continually adapt to changing market conditions to remain competitive [16]. In recent years, the number of local producers has increased, but DTC sales have plateaued [1,3,4], due to competition within and between DTC market channels, growth in intermediated market channels, and sales of local foods through supermarkets and online food delivery services [1,17]. Additionally, a shift in customer attitudes may contribute to slower growth: historically, DTC venues attracted consumers looking for “an environmentally and socially conscious alternative to the global food system” [18], that connects them to local growers of their food and provides support for farmer incomes and the local economy [19,20,21]. DTC customers may be starting to place greater value on convenience [1,20]. Previous research found that even members who stated support for a local food system became less willing to travel to the farm or CSA pickup site over time [22].
Therefore, human geography and the relationship between people and place are important for farmers to consider when making marketing and distribution decisions for their business. Selecting consumer-friendly hours of operation and pickup locations facilitates motivation to purchase from DTC venues [10]. For example, a recent modified choice experiment found that low-income consumers would be less interested in trying a CSA if the distance from their home to the pickup site was about the same as the distance to supermarket, unless the CSA offered significant cost savings [23]. Yet if the pickup site is too far from the farm, or outside established delivery routes, extra driving time and fuel costs cut into farmer profit [14]. Further, a rationale for buying locally grown produce is that shorter farm-to-consumer distances reduce the costs and environmental impacts of transportation. While some have found DTC approaches to have a smaller carbon footprint [24], few individual farms have the capacity to build infrastructure that is sufficiently efficient to rival that of the conventional food system [25]. When selecting pickup sites, farmers also need to consider the proximity and density of grocery stores and other DTC venues, as these outlets might either discourage or enhance CSA participation. For example, Lohr and colleagues describe location as the most accurate indicator of high-intensity competition for farmers market vendors, with the greatest competition occurring in urban core areas [26]. Alternatively, CSA pickup sites that are proximal to routine shopping destinations may be attractive to consumers, and also serve as a complementary source of additional ingredients [23].
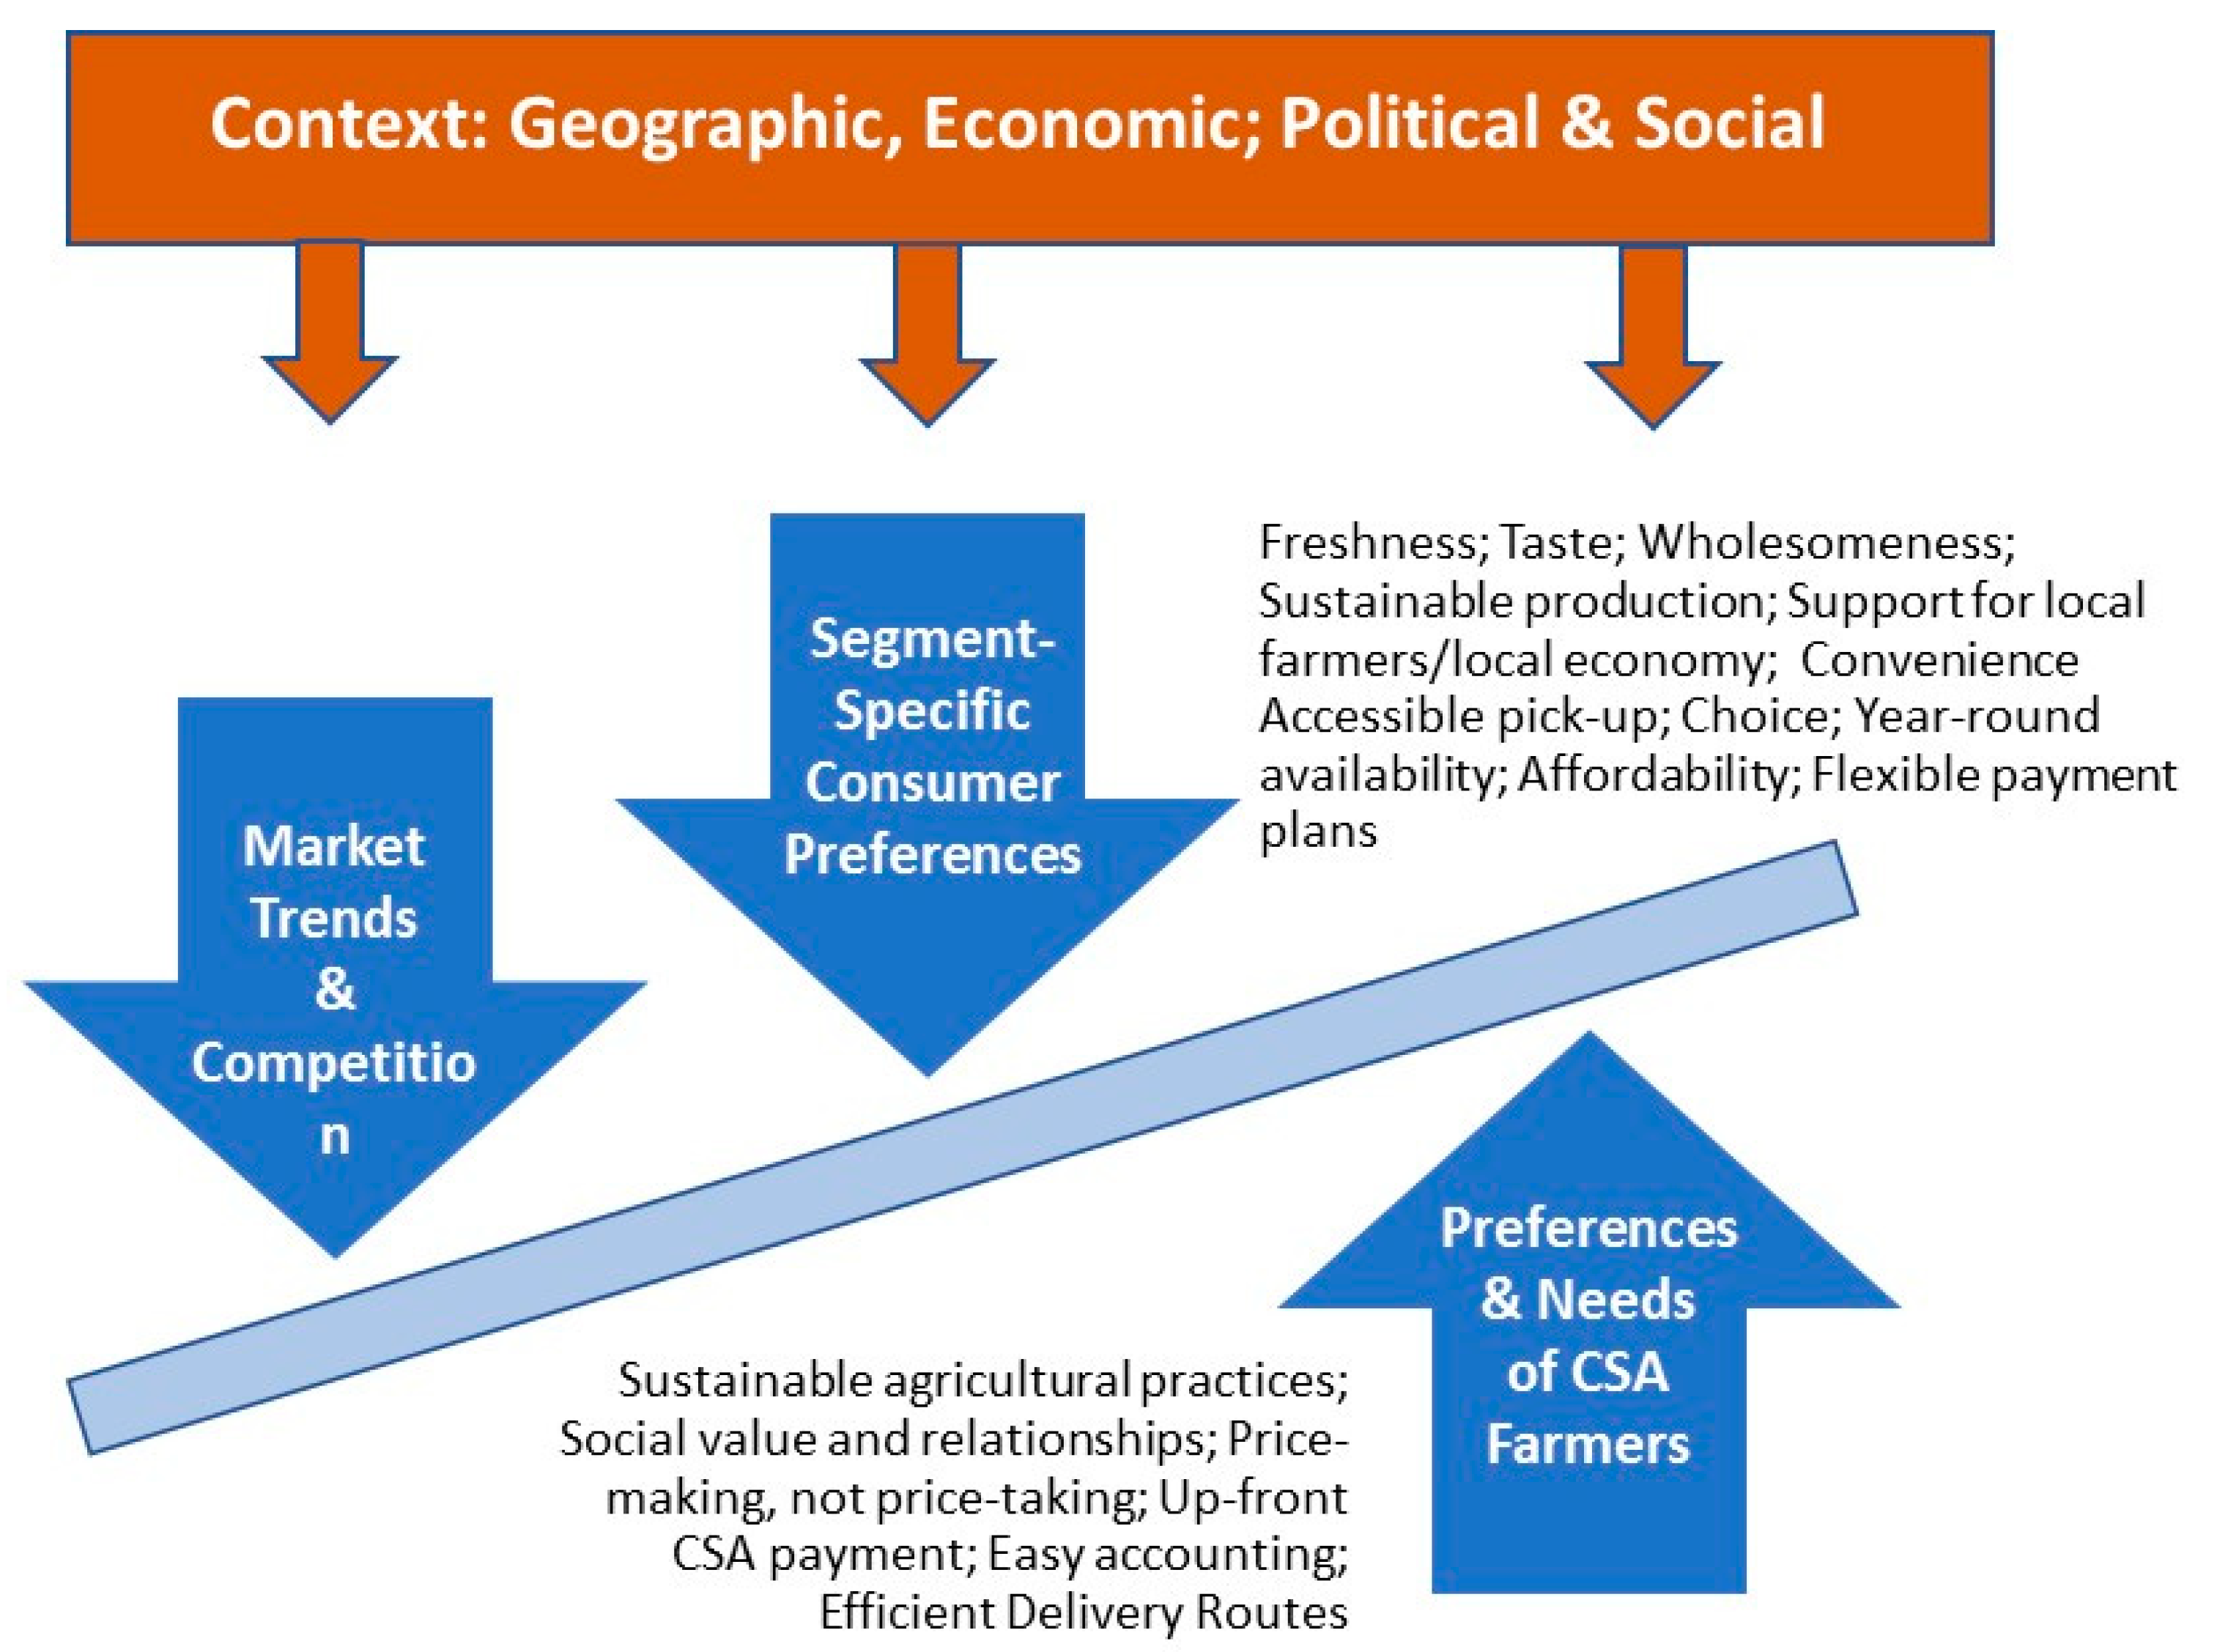
Figure 1 is a graphic representation of the competing forces small scale producers must balance in making decisions regarding their agricultural business. The preferences and needs of CSA farmers may motivate them to employ sustainable agricultural production practices, infuse business practices with social value and emphasize customer and community relationships [6,7]; yet self-preservation requires them to attend to practical preferences for autonomous price-setting; up-front CSA payment; streamlined accounting systems and efficient delivery routes [8,9,10,11,12,14]. Farmers must balance (and sometimes sacrifice) personal needs and preferences [15] in response to exogenous market trends and competition from other purveyors of local produce. Consumer preferences may motivate them to seek local foods for their freshness, taste, and wholesomeness [19], but also for environmental concerns and a desire to support local farmers and local economies [18,19,20,21]. Yet these consumers also want convenience in food shopping and preparation, easy-to-reach, acceptable pickup locations, affordability, and the same choice of items and year-round availability they could expect from a supermarket [1,20,22]. It should be noted that while all consumers may share these needs and preferences, the order and magnitude of their importance varies by market segment, and is less well understood for low income and rural consumers regarding local foods). In this system, the social demographics and geography of the area and the political, and economic context at the local, national, and global level influence market trends [16,23,26], and the needs and preferences of both farmer and consumer.
Local producers have demonstrated ingenuity in response to slower sales growth, adapting historical DTC models to address changing preferences of existing customers and accommodate the needs of new market segments [27]. Farmers have experimented with changing the scale and variety of their products, extending their season, and incorporating e-commerce [28]. More local growers now accept supplemental nutrition assistance program (SNAP) benefits, offer flexible payment plans, or employer and health plan incentives [28]. Spatial considerations are central to many of these adaptations, as farmers often select pickup sites conveniently located at worksites, hospitals, or on consumer’s daily travel routes [27,29]. Emerging business models, such as multifarm cooperatives and community partnerships, complement these modifications, lowering risks for individual farmers and facilitating outreach to new market segments [27,29].
Two examples of business innovation are farm boxes distributed in stores and cost-offset CSAs (CO-CSAs). Both innovations are variants of the traditional CSA model; in that model, subscribers pay a lump sum to the farmer prior to the season, in return for a “share” of a farmer’s crop, distributed regularly to CSA members as produce is harvested during the growing season [30]. The CSA market channel has been identified as perhaps the most optimal of DTC approaches for small scale farmers, due to its relative efficiency in balancing labor input and risk with sales volume and unit profits. [31] However, these same authors note that a combination of different marketing channels is usually required to maximize farm profitability overall, while others report that farmers who use only direct-to-consumer sales strategies tend to see lower earnings than those who use mixed marketing strategies [32].
The store-distributed food box offers consumers a CSA-style box of seasonal produce but does not require upfront payment or full-season commitment from the consumer [33]. Retailers may receive a small transaction fee in return for allowing the food boxes to be preordered at their rural convenience stores for pickup later in the week. Thus, the retailer can offer customers fresh local produce without having to risk spoilage/waste, invest in extra equipment or space [34], and may potentially gain from increased foot traffic in the store [33]. The farmer benefits by gaining a new market venue, and rural residents have increased opportunities to buy locally grown foods more conveniently, without needing to commit their funds upfront. The store-distributed food box retains many features of a direct market CSA (farmer-selected box items), yet also has an advantage of an intermediated sales approach (pickups in rural retail sites). Thus, it may be considered as a hybrid of DTC and intermediated approaches [35].
The CO-CSA operates more like a traditional CSA, but varies primarily in payment options. In the CO-CSA, funds are obtained through grants, donations, and/or fundraising to cover a portion of the individual share cost ahead of the season. The consumer then commits to paying the remaining balance, either upfront or in installment payments [36,37]. Thus, the customer benefits by getting a discounted share, while the farmer still begins the season with much-needed preseason working capital. To further overcome barriers to participation, CO-CSA programs may accept SNAP benefits, arrange for alternative pickup times/sites, and/or allow exchange of unwanted items [29].
There is a paucity of available literature on how well these types of DTC innovations are working in terms of farmer experience marketing strategies, and farm profitability. Recent CO-CSA-related research notes problems with participant drop-out, members picking up food on assigned days or making payments on time [38,39]. Some CO-CSA farmers in these studies liked the guaranteed sales associated with the CO-CSA model, but those with no prior CSA experience struggled with the logistics of weekly packing and distribution [1,27]. Most of this scant research has focused on operational factors, without examining spatial, sociodemographic, and environmental contexts surrounding farm and distribution locations, all of which might influence farmer experience and operation success. If farmers set up distribution in areas that don’t match the target audience, sales and efficiency may suffer [26,40]. Similarly, DTC operations may have limited success if they select locations with too much competition from retail and other DTC venues [26,41]. Further, there is little research specifically on how spatial/logistical considerations affect farmers’ motivation to begin or continue to offer a particular DTC approach.
1.1. Study Purpose
In this paper, we use a mixed-methods approach to consider the sociodemographic and geospatial contexts alongside farmers’ experience with two DTC innovations in an eastern and western U.S. state (Vermont and Washington). We describe the demographic, transportation, and commercial context of each community where pickup transactions occur. We consider how these contextual factors may have affected implementation of the DTC innovation in terms of (1) how suitable/accessible was the pickup location; (2) proximity of pickup to conventional food retail and other DTC venues; and (3) potential burden that delivery to these locations might place on the farmer. We then qualitatively describe farmers’ experience with these two CSA variants in terms of the perceived benefits, challenges, and continuation plans. Finally, we consider ways in which geospatial context might have shaped those experiences and plans.
1.2. Design and Setting
Farm Fresh Food Boxes (F3B), a store-distributed food box program, was a multidisciplinary USDA-funded research and extension study that offered technical assistance to participating farmer-retailer pairs implementing F3B to improve rural consumers’ access to fresh, local produce [33]. F3B implementation varied in duration from one to six months (mean = 2.6 months). F3B box prices were set between $11 and $30, and two farmers offered both a full-size box and a smaller, lower-priced box Total F3B sales in the first season ranged from $150 to $2720 (mean = $730). We analyzed 2017 Postseason interview data from three farms each in Vermont and Washington participating in the F3B study (total farms = 6). Local cooperative extension staff on the study team identified potential F3B retail pickup sites and enrolled them in the study if the retailer and farmer willing to partner together. Each farm paired with a single retailer (total pickup sites = 6).
The Farm Fresh Foods for Healthy Kids (F3HK) study was a multistate, USDA-funded randomized trial that investigated how CO-CSA membership, combined with tailored nutrition education, affected caregiver and child eating behaviors and food security in low-income families [36]. F3HK implementation varied in duration from 15–24 weeks (mean = 19 weeks), with seasonal prices ranging from $365 to $900. With the grant-funded 50% cost-offset, participants paid between $9 and $21 per week. Three farmers offered three sizes at graduated prices, one offered two sizes, and the others offered one size. F3HK participants ranged from two to ten participants per farm, and total full-price sales ranged from $1155 to $6745 (mean = $2629). We analyzed 2016 postseason interview data with four Vermont and three Washington farms participating in the F3HK study (total farms = 7). Participating farmers selected the F3HK pickup site in consultation with study staff in each state. One Vermont farm offered on-farm pickup only, two offered pickups at the farm and offsite, and one offered offsite pickup only. All three WA farms had one offsite pickup site each (total pickup sites = 8). The set of farms implementing the two DTC innovations and all corresponding pickup locations were mutually exclusive across studies.
2. Materials and Methods
2.1. Analysis of Quantitative and Geospatial Data
Demographic data were obtained from the U.S. Census (American Community Survey; 2012-2016, 5-year estimates) at the Census Block Group level, including total population, median age, median income, percent with high school degree, percent minority, percent in poverty, percent receiving Supplemental Nutrition Assistance Program (SNAP) benefits, and percent who drove cars to work [42]. We used the WalkScore website (www.walkscore.com) [43], to generate additional transportation-related data, including the pickup sites’ proximity to public transit and its “walkability” (a validated measure of proximity to and amount of amenities that can be accessed on foot) [44,45,46]. Walk Scores range from 0–100, with higher values indicating greater walkability [43].
We collected the physical addresses of participating F3B and F3HK farms (n = 13) and their pickup locations (retailers and CSA share distribution points, n = 14). To characterize other food retailers in the area, we obtained the addresses of supermarkets (NAICS 445110) and Farmers’ Markets from the RefUSA business database, from NOFA-VT, and the Washington State Farmers Market Association, respectively [47,48,49]. Address points were batch geocoded with the Google Maps Application Programming Interface (API) through the BatchGeo website, and geocoded to the highest level of accuracy possible, either to the rooftop (street address precision) or range-interpolated (interpolated between 2 precise points) levels [50,51].
ArcGIS and Google API were used to generate road network distance from farm-to-pickup site and from pickup site-to-nearest farmers markets and -supermarkets. Two-mile road network buffers were generated to obtain counts of Farmer’s Markets, supermarkets, and other grocery stores near each pickup site [52].
Descriptive statistics were generated for the demographic, transportation, and geospatial variables, consisting of counts, means, and proportions, and then aggregated to the state level for each DTC innovation. We averaged pickup location statistics for DTC innovations in each state to facilitate comparisons.
2.2. Analysis of Qualitative Data
Postseason interviews conducted in VT and WA with F3B Farmers (2017) and CO-CSA farmers (2016) after the first season of implementation were transcribed verbatim, imported into NVivo version 11 (QSR International), and coded by topic. One analyst reviewed each interview transcript and developed themes and subthemes deductively across all question categories. A second analyst double-coded all transcripts, and then both reviewers met to discuss and resolve discrepancies. This process was repeated twice to achieve a kappa of at least 0.75. A third researcher conducted finer-grained coding, which was reviewed and double-coded by the original analyst. Reviewers 1 and 3 then met to discuss and resolve any remaining discrepancies to arrive at a final set of analytic findings.
Qualitative findings were grouped into the following general dimensions of satisfaction/experience with the novel DTC approach: (a) benefits to the farm in terms of increased profitability or increased customer base; (b) challenges and drawbacks; (c) logistical considerations, particularly as they affected farmer burden and consumer access to the pickup site; (d) perceived effect of neighboring food retailers, and (e) plans to change pickup location or other accommodations for the following season. To connect farmer experience to geospatial context, we used a naming convention of identifying each farm by the state’s initials, with the farm to pickup distance, and pickup to supermarket distance as superscripts. For example, “WA10/18” refers to a farm in Washington where the farm to pickup distance is ten miles and the pick up to nearest SM distance is 18 miles.
We end the presentation of findings with a synthesis of quantitative and qualitative results to answer the three study questions concerning accessibility of pickup location, influence of nearby local food venues, and farmer burden associated with logistics.
3. Results
3.1. Quantitative Findings
Table 1 displays variables that describe the sociodemographic context of the pickup sites where F3B (the store-distributed food box program) and F3HK (the cost-offset CSA) transactions occur. This includes demographic characteristics, features of the commercial food retail environment, and geospatial characteristics of participating study farms and pickup sites.
3.1.1. Community Demographics
Though all implementation census tracts had small populations, F3B pickup communities in VT were generally more populous than their WA counterparts (average population 1750 and 740, respectively). F3HK pickup communities in VT and WA had similar population sizes, 1376 and 1307 respectively, although there was wide variation for sites within each state. For both DTC innovations, VT pickup sites included areas characterized as rural, micropolitan/rural, and large urban centers, according to their Rural Urban Commuting Area (RUCA) designation (See Appendix A, Table A1: Network Distances). In contrast, most WA pickup sites were in metropolitan areas that are commuter communities for a nearby, larger city.
On average, F3B pickup communities tended to be older and more affluent than F3HK areas, with most having median HH incomes above $66,000. F3HK specifically targeted low-income families with children and those communities tended to have younger, less affluent residents. F3HK, which specifically addressed food access for a low-income population, tended to have pickups in communities with a higher average percentage of nonwhite residents (14.6% for VT, 18% for WA), people living in poverty (19.6% for VT, 25% for WA), and households receiving Supplemental Nutrition Assistance Program (SNAP) benefits (25% for VT, 31% for WA). There was little variation in the percentage of high school graduates across DTC innovations in both states.
3.1.2. Transportation Environment
We used measures of the transportation environment to investigate how easily potential customers could get to pickup sites. The ease with which errands could be done by foot was generally low, though walkability scores showed wide variation within states, particularly for individual F3HK pickup communities, which had scores as low as 4 in VT and as high as 69 in WA. Public transportation was nonexistent in most pickup communities, with the exception of one F3HK location each in VT and WA. In general, pickup locations were in highly car-dependent areas where 75 to 88 percent of workers drove their cars to work, on average.
3.1.3. Geospatial Results
We calculated the distance from pickup to nearest Supermarket (SM) and Farmers’ markets (FM), as well as the number of SM and FM within a two-mile radius, to get a sense of potential benefit or challenge that conventional and alternative food retail venues might pose to F3B and F3HK pickup sites.
For WA F3B farmers, the closest SM was relatively far away from the pickup site (9.4 miles on average). For the other F3B and F3HK implementation sites, competing SM were generally more proximal (under three miles on average). In keeping with the metropolitan nature of its pickup areas, WA F3HK sites had both the most proximal SM distances (within 1.1 mile on average), as well as the largest number of SM within a two-mile radius (five on average). Competition from other DTC venues appeared to be sparse in most areas, as the majority of individual pickup sites for both DTC innovations had no FM within a two-mile radius, and the driving distance to the closest FM was more than 10 miles for five sites (See Appendix A, Table A1: Network Distances). WA F3HK had the shortest average pickup to FM distance (2.2 miles) and VT F3B had the longest (19 miles).
Lastly, we calculated farm-to-pickup distances to estimate potential farmer travel burden. On average, F3HK farmers in VT and F3B farmers in both states travelled between 3.5 and 5.5 miles to deliver their product to the pickup site. Travel distances varied widely within each state; three VT F3HK farms offered on-farm pickup, for which the farm to pickup site was zero. In contrast, Washington F3HK farmers travelled an average of 17.9 miles to their pickup sites and there were no on-farm pickups.
3.1.4. Context Summary
On average, the two DTC models in both states showed low walkability, high car dependence, lack of public transportation and few farmers markets within two miles of pickup. F3B pickup locations tended to have older, wealthier residents, with lower proportion of nonwhite population, people living in poverty, and SNAP participation. For both DTC models, WA pickups were more likely to be located in metropolitan or commuter communities. F3B locations in VT had the smallest population compared to other F3B and F3HK study sites. In WA, F3B locations had the longest average pickup to SM distance, and F3HK locations had the shortest pickup to SM distance; VT sites for both DTC models had distances that fell in between these extremes. WA farmers implementing F3HK had the longest average farm to pickup site driving distance.
3.2. Qualitative Findings
For each DTC innovation, we report findings from qualitative interviews on farmers’ overall experience, in terms of farm profitability, growing the customer base, and helping to achieve a farm’s mission. We then describe farmers’ perceptions of how pickup location, setting and presence of neighboring local produce outlets affected implementation in terms of suitability/consumer access, farmer burden, and competition or complementarity. (See Appendix A, Table A2: Representative Quotes from Farmer Interviews: Key findings by State.)
3.2.1. Farm Fresh Food Boxes (F3B)
Most F3B farmers felt that F3B had little effect on profitability after the first season, explaining that the number of boxes sold was too small to make a difference. All three WA F3B farmers said that proximity to the retail pickup site make their deliver routes “easy” (VT F3B farmers did not mention delivery as either burdensome or easy). While some said having established pack-out and distribution processes made it easy to add F3B, others noted additional labor was required to do these things, as well as take weekly orders from retailers, which cut into profits.
Nonetheless, farmers recognized that trying something new takes time and “requires some effort to get off the ground” (VT2/6). They remained intrigued by the F3B model, seeing its value as “…a new channel” (VT4/0.6)) that prompted them to “…think about the ways in which we can reach people and market better” (WA6/6). Farmers saw F3B as a way to attract new customers in order to offset increasing DTC market saturation, particularly among the type of dedicated customers motivated by personal and altruistic reasons as described in previous studies [20,21]. As one farmer remarked:
“CSAs in general are kind of a little tapped out, in this locality at least, you know? Everyone who is ‘right’ to sign up for a CSA probably has already done so.”—(WA1/4)
Farmers noted the availability of local produce in “almost all retail settings—stores, restaurants, a lot of CSAs…farm stands…farmer’s markets” (VT 4/0.2), and online meal-in-a-box kits “like Blue Apron” (VT4/0.6), which drew business away from their existing DTC operations, as described in previous research [1]. Farms also noted the impact of economic trends on local food-shopping habits. As one farmer explained, referring to the economic boom in a nearby major city:
“…people are being pushed into these eastern countries all up and down western Washington in search of affordability. But if they’re driving down valley every day, they can also shop at Fred Meyer and Costco and Walmart and, you know…and the food co-op.”—WA10/18
In some cases, geographic isolation restricted food access, creating an opportunity for F3B to fill the gap. For example, one farmer noted a steady demand for local food among the highly educated staff at a nearby state park. Because the retail partner was one of two small convenience store/gas stations in a valley with restricted access during winter, she thought F3B had potential for success because “it’s a long drive to get to good food” (WA10/18).
However, high poverty compounded geographical challenges to food access for some in this are: “there’s a lot of poor people that, you know, don’t have vehicles that can get them up and down the valley” (WA10/18). However, low income families in this community had some access to fresh produce through the local food pantry, to which she and other farmers donated unsold vegetables. Similarly, another farmer (WA6/6) noted a high reliance on home gardens in the retail partner’s town. Thus, F3B might be less appealing to some, because it’s hard to “…convince people to buy things when they’re going to…get it for free” (WA10/18).
Some farmers thought local food enthusiasts might still exist in rural areas that lack fresh produce venues. This type of consumer might eagerly embrace F3B, particularly when “… the closest store that sells any produce within, you know, 30 min or 45 min, … [only has] iceberg lettuce, and the pink pale tomatoes” (VT4/0.2). For these consumers, both VT and WA farmers agreed the ideal F3B setting would be an old-fashioned “mom-and-pop” corner store. As described by one farmer, this type of store:
“… has a different feel to it…They sell beer and they have cigarettes, but the cigarettes are tucked behind the counter… You go in there and there are aisles of cereal boxes, and there are cold cases where you can get milk, and eggs, you know? And kinda like that place where it’s like, “Oh, yeah, we’re out of eggs.” And you run down to the corner and grab some, you know, to finish baking Christmas cookies…”—WA1/4
Further, these stores were perceived by farmers as a community gathering place, with a credibility that conferred a “seal of approval” on local items sold there:
“…general stores and mom and pop stores, you know, they’ve been around…and the family that owns them is well known. And, you know, so if they’re committed and talking it up and giving time to it, it’s almost like people think, “Oh, this is worthwhile, because, you know, the Johnsons are into it.”—VT4/0.2
Yet farmers also spoke of another untapped pool of consumers, described as, “people who don’t know they really want that stuff” (VT4/0.2). They agreed that convenience stores, where most F3B implementation took place, were a good place to find people who don’t typically seek local produce. They also noted that these stores were often in walkable, centralized locations, which addressed potential transportation and convenience barriers for shoppers (VT4/0.6). For example, one farmer selected their retail partner with likely consumer travel routes in mind:
“We targeted stores [for F3B implementation] that are sort of people’s drive-by stores. Like, they drive by, they stop, they make their purchase, they go. So, there’s a little bit in terms of the efficiency, like they don’t have to go specifically drive somewhere else to make the purchase”—(VT4/0.2)
In addition to transportation barriers, F3B farmers evidenced keen awareness of other well-documented impediments to buying local produce [20], including actual cost, perception that local produce is “more expensive”, inadequate cooking skills and lack of nutrition knowledge. Describing their efforts to mitigate cost barriers, one farmer said they priced their CSA and F3B “at the low end of the spectrum” (WA10/18), compared to neighboring CSAs. Another stated their boxes were priced such that there was “no better value, anywhere in the county, for the amount of money, for the amount of produce that they were getting” (VT4/0.6). Nevertheless, farmers were perplexed as to why they did not have more sales. As one farmer mused:
“You know, we haven’t had a ton of success in terms of volume, so I was trying to figure out, like, you know, is it the price? Is it the … wrong products for the customer that’s there? You know, is it the convenience that isn’t there? Like--what is it that’s not working?”—VT4/0.2
Federally funded nutrition incentive programs, such as those used in farmers’ markets, were suggested by two farmers (VT4/0.6, WA1/4) as another way to attract more lower-income customers to try F3B. Other suggestions included altering the package size, contents, and price point to market F3B as a snack, lunchtime accompaniment, salad or “quick meal prep” (VT4/0.2).
Aside from instituting creative adaptations, farmers described their biggest challenge as determining “who is the customer that would buy this product at this type of store?” (VT4/0.2). Farmers recognized that convenience stores are not perceived as places to buy healthy foods, or to do weekly grocery shopping. They are places where “you go grab something quick, you grab your lunch quick, or you get that gallon of milk that you forgot, or maybe they have ice cream on sale…” (VT4/0.2). As one farmer concluded, they are not venues to “find people who are ripe for change, necessarily” (WA1/4).
According to food marketing researchers, nutrition knowledge, cooking skills, price, and convenience affect purchase behaviors by influencing underlying attitudes [20,53,54]. Attitudes, comprising beliefs, values and norms, are hard to change, but can shift when consumers learn about “the advantages of local food production and believe in its relevance” [53]. These shifts can ultimately lead consumers to buy local foods—particularly when knowledge and logistical barriers are lowered. The comments of some F3B farmers touched upon these issues and they saw themselves as part of this process as “a direct source, an educational source and a community gathering place” (VT4/0.2) and recognized that marketing their product required “actually talking to people, encouraging them…” (WA6/6).
In most locations, F3B was promoted with exterior sandwich boards, in-store posters and displays, and occasional mention through social media or list-serves. However, in the absence of experiential education offered by farmers, this was not enough to convey F3B’s advantages:
“I think it’s going to come down to just, like, marketing and how to really demonstrate what it is and how, like, what a great value it is and why they should do it. You know, it’s not enough just to sort of, like, put a picture on a poster…”—VT2/6
Farmers also felt that retailer buy-in, along with the ability to convey F3B’s unique advantages, was an essential prerequisite for success, of equal importance to location and setting. As one farmer noted:
“Wherever the store is conveniently located-- that should be a good fit. But really it always has a lot to do with store personnel. You know, the store manager, or store personnel, they’ve gotta be excited about it, or it’s just gonna be, like, you know, a sack of potatoes in the back room for them.”—VT4/0.6
3.2.2. Farm Fresh Foods for Healthy Kids (F3HK)
Four F3HK farmers (three in VT, one in WA) felt that the first season had too few F3HK customers to generate much profit. Others (one in VT, two in WA) said that adopting the innovation had a small but promising positive financial impact, saying that it was “economically a net benefit” (VT12/2), that they “picked up more money” (WA17/1). Additionally, one farmer (VT0/0.5) mentioned extra revenue from collateral sales when customers retrieved shares at their farm stand, saying that F3HK participants “…often want to buy other things with their EBT [electronic benefit transfer] card, which is really cool.”
Aside from profitability, F3HK farmers found study participation to be beneficial in other ways. For example, one farmer felt F3HK would help her expand her business in a new location, saying: “We do all our shares in … [major city] area and we’re interested in trying to shift some of our market to [the local county]” (WA17/1). Farmers appreciated the cost-offset funding provided by study, as well as recruitment of new members in the form of study participants. Additionally, the study’s help in obtaining necessary approvals and equipment to accept EBT payments made it easier for farms to attract low-income customers not enrolled in the study, which further diversified their customer base. One farmer explained that the having an EBT in a central location helped increase CSA membership among those who pay with SNAP benefits. This also helped streamline distribution and recordkeeping:
“Frequently [before the study] the driver would show up to a drop site and couldn’t wait around for the EBT customer to come and physically swipe the card, so we would leave the box and then not receive payment for that week. And so, this helped a lot, having a central location with a window of time where people could come.”—WA26/1
Contrasted with other DTC models that provide more choice and flexibility, this farmer felt being able to accept EBT payments put the farm on more equal footing with farmers’ markets that have nutrition incentive programs:
“… as a whole of being comparable [with farmers’ markets] —the ability to accept EBT and have that central location! I mean all over the place, farmers markets …you can switch out things in your box, you can talk to somebody from the farm—that’s what people really want. For future people wanting to join, [accepting EBT is] definitely a huge deal to them and I think in the future that’s going to increase our profits a lot, too.”—(WA26/1)
Yet one farmer felt differently about being able to accept EBT because “…honestly nobody ever used their food stamps. I never used it [EBT machine] at all,” (WA10/1). This farmer also found checks and cash payments to be problematic because delivery staff didn’t carry change and wasn’t prepared to record payments and pickups: “…there was just a lot of fuss for two customers. (WA10/1).
In most instances, F3HK farms chose pickup locations that were on-site or at existing CSA pickup locations. For example, one farmer offered CSA pickups at the farm and two hospitals that previously had a farm-to-healthcare program. The hospital most proximal to participants’ home address was selected for F3HK pickups, because the other hospital was 17 miles away. After noting that CO-CSA customers were often late for pickups, necessitating subsequent farm pickup, the farmer decided to switch to on-farm pickups next season. This farmer felt the arrangement would be more convenient for her and for her CO-CSA members:
“…given the fact that people are paying with cash sometimes, we’re a lot better set up to record and give change and that sort of thing at the farm stand…Also, people have lots more flexibility on when they come”—WA10/1
Another farmer (WA26/1) who arranged for F3HK participants to pick up shares at the community center in the subsidized apartment complex where participants lived, and was perplexed with the number of missed pickups and drop outs. This farmer decided to relocate the pickup next season to a more centrally located nonprofit organization serving low income families, motivated by a desire to ensure better accessibility by foot or by bus for CO-CSA members with EBT benefits. Both farmers also planned to better accommodate CO-CSA members by offering a longer time window for pickup and allowing shareholders to “switch things out” if they wished (WA26/1). Another farmer, (VT14/8) also planned to offer a market-style choice the following season.
When asked specifically whether implementing the F3HK added significant burden in terms of deliveries, most farmers demurred, explaining either that F3HK pickups were at the farm or “piggybacked on a regular delivery site” (WA10/1). One farmer didn’t mind making a slight detour, saying “It’s not that big a deal to drive another 10 [miles]” (WA17/1). This farmer could foresee bundling trips that in the future, which would increase profitability through increased efficiency: “…we could tie in [CO-CSA sites] with nonsubsidized people at the same time.” (WA17/1). This was the farmer who also had said that F3HK pickups were purposely located in a county where they wanted to attract new business.
Vermont farmers said their greatest F3HK implementation challenge was the increased administrative burden of weekly recordkeeping, additional staffing of the pickup site, and legwork needed to follow up on missed payments and pickups:
“It’s a lot of extra time…if they want to pay weekly. In order to make sure that we’re there when they’ll be there, because we don’t generally hang out for the whole pickup time…so we’re talking about shifting our schedules or the pickup time”—VT0/0.5
Additionally, as previously mentioned (WA 10/1), follow-up effort was required when pickups were missed. Although pickup times and locations were described when participants were enrolled in the study, farmers felt that repeated explanations were necessary to offset dropped pickups, remarking “there’s just an educational component on the farmer’s part” (VT 0/0.5):
“I think that the CSA model is pretty unfamiliar for people and if they don’t quite know what they’re getting into, there were a lot of missed shares. We’d drop a share off and the CSA member thought she was at a different place or kept switching, didn’t really realize the commitment to a site or to a time”—(VT 0/0.5)
Despite the added work, most farmers said there was enough traction for them to feel that, given time, this model could be of benefit:
“But at the end of the day, like I said before, I can’t scoff at some other entity coming and handing me 9 CSA members. That’s a huge benefit to the farm.”—VT12/2
Further, farmers recognized that implementing something new might take time to show results:
“I would say, as much as anything, it was probably just learning about the potential of how it might work… But I guess because I knew that it was a new program and trying to get things rolling, I was willing to hang in there with it”—WA 17/1
3.2.3. Qualitative Interview Summary
First season sales were modest for both DTC models in both states; some farmers remarked that that it takes time and effort to launch a new business strategy. WA F3B farmers felt proximity to retailers made deliveries “easy,” while communication and coordination with retailers were the biggest challenges. Similarly, F3HK farmers reported minimal delivery-related burden, even when they had to drive a certain distance. They were more vexed by increased recordkeeping and missed share follow up.
Most F3B farmers selected pickup sites with public transportation and customer travel routes in mind. However, these farmers were more concerned with the setting than with location, noting that while customers who frequented convenience stores were unlikely to have tried local foods, they were also harder to entice to do so. Most F3HK farmers offered pickup at existing CSA drop sites or on-farm, though two WA F3HK farmers drove to new pickup sites further away. Two WA F3HK farmers intentionally selected pickup locations that were close to CO-CSA members’ homes.
To help customers overcome barriers to purchase, F3B farmers tried keeping prices low, and discussed ideas for tailoring F3B size and contents to suit customer tastes. Though all F3B farmers marketed using simple signage at the pickup location, they felt that more consumer education was needed on the advantages of local foods. In contrast, F3HK farmers did not advertise, because new CO-CSA members were recruited by study staff. Additionally, the study also provided tailored nutrition education for CO-CSA members to support behavioral change. Still, F3HK farmers experienced attrition and missed pickups, and planned to switch to more accessible locations and offer some market-style choices to meet CO-CSA members’ needs.
Despite challenges and low financial gain in the first year, farmers implementing F3B and F3HK saw benefits in terms of reaching a new group of customers. F3B farmers in both states spoke of geographic, economic, and demographic factors that led to market saturation, noting widespread availability of local produce in conventional stores and nearby DTC outlets. They saw potential for F3B to reach customers who might not seek to buy local foods otherwise. F3HK farmers welcomed the opportunity offered by the study to expand CSA membership among low-income families, especially those who pay using EBT.
4. Discussion
In this section, we synthesize demographic and geospatial results with qualitative findings to evaluate pickup sites in terms of suitability and customer access, potential competition, and farmer burden. (See Appendix A, Table A3: Synthesis of Quantitative and Qualitative Results). We then summarize findings across both DTC approaches and both states, and end with a discussion of study limitations.
4.1. Suitability/Accessibility of the Pickup Location
Pickup sites for both DTC models were mainly located in smaller communities outside of large urban centers. Most areas were heavily car dependent, with low walkability and few or no public transportation options. F3B, which aimed to increase access to fresh locally grown foods in rural areas, tended have pickup sites in more sparsely populated areas. F3HK, aimed at reaching low income families, tended to have pickup sites in areas with a higher proportion of minority populations, people living in poverty, and households receiving SNAP benefits. These differences were not surprising, given the nature of the studies. Further, the F3B pickup sites were identified by extension staff based on their proximity to F3B farms and the rural retailer’s willingness to participate. In contrast, the F3HK pickup sites were selected by the farmer, in consultation with study staff, and were frequently located existing CSA pickup sites or on-farm.
Farmers’ knowledge of community context aligned with contextual data findings. For example, F3B farmers in both states were aware of geographic isolation, poverty and lack of transportation in their communities and recognized a need to overcome these barriers for their product to sell. Further, they were mindful of local conditions when choosing retail partners; as evidenced by the VT farmer who selected a store along a well-travelled route. Similarly, WA F3HK farmers chose CO-CSA pickup locations with customer convenience in mind.
F3B farmers seemed more concerned about the suitability of the setting than the location’s accessibility. While some were pleased with their choice of a “mom-and-pop” pickup site, feeling it to be the best setting for F3B, others were perplexed as to how to pitch their product to convenience store shoppers. F3HK farmers, who were not required to actively market the CO-CSA, said little about the effect of logistics on member recruitment and retention. However, one WA F3HK farmer wondered why participants to drop out despite having what the farmer perceived as a highly convenient pickup location.
4.2. Effect of Neighboring Food Venues
For both models, we found conventional sources of fresh produce within six miles of most pickup sites, except for one WA F3B and one VT F3HK site. In WA, the average pickup to SM distance was longest for F3B locations and shortest for F3HK. VT F3B and F3HK pickup sites had pickup to SM distances that fell in between these extremes. In general, F3B FM were located much further away from pickup sites in VT than in WA. Pickup to FM distances were much shorter for most F3HK farms, and some VT F3HK farms chose to actually hold their pickups at the local FM.
Most F3B farmers were aware of DTC market saturation and the effect of increasingly available local foods in nearby stores, restaurants and online on their business, with no discernable pattern by state, or proximity to SM of FM. One WA F3B farmer noted that people with access to food pantries and gardens would be less likely to buy local food elsewhere. Yet this farmer also felt that F3B might fill a niche market among park staff in her geographically isolated community. In contrast, F3HK farmers did not mention other local food outlets, with the exception of a WA F3HK farmer who felt that the study’s help in setting up infrastructure to accept EBT put them on more equal footing with a local FM nutrition incentive program.
4.3. Potential Farmer Burden Related to Pickup Distance
We observed large variations across both models in individual farm to pickup distances. F3B farmers had modest farm to pickup distances and said proximity to the retailer made for easy delivery. WA F3HK farmers had the longest average farm to pickup driving distance. Yet when asked, WA farmers cited the desire to expand business to a new area and having another CSA pickup site in the same city as reasons for not minding the driving distance. Driving distances did not appear to be burdensome for these farmers.
4.4. Summary of Findings
U.S. farmers implementing F3HK and F3B in VT and WA saw positive benefits to the farm in terms of reaching a new market segment, growing the customer base and increasing local food access for those who otherwise might not participate in a CSA. This finding underscores the commitment small-scale producers have to the social goals that comprise a “moral market,” as previously reported by Guthman and colleagues, who found that most local farmers supported equitable access to the produce they grow, and have made an effort to do so [9]. In general farmers with CSA operations show reasonable profitability when compared to other types of DTC operations [55]. For example, a recent economic analysis of CSA farm operations in Massachusetts found that compared to other small-scale producers, CSA farm operations earned more income, though it was much less than the median income for U.S. households overall [56]. However, neither DTC innovation in this study generated sizable revenue for farmers in the first season; F3B and F3HK farmers both had mixed reactions to this lack of profitability. Nonetheless, farmers saw potential in the model, as evidenced by the improvements they planned for the next year. They appeared to understand that it takes time for a new business idea to catch on.
Farmers implementing both models said the pickup location posed no extra burden to them, even when the farm to pickup distance was sizable, either because they were bundling with trips to other CSA pickup sites, or it served their purpose of opening new market locations. However, farmers mentioned other challenges. F3B farmers found that communicating and coordinating with the retailer took extra time, while F3HK farmers found the extra recordkeeping and follow-up for missed pickups and payments burdensome, issues that have been mentioned in previous studies [38,39]. For example, farmers participating in a CO-CSA intervention subsidized by a local nonprofit were somewhat surprised that despite the offer of free CSA, some families did not pick up their shares, but concluded, “It’s not for everyone” [39]. Similarly, a CO-CSA program sited within Head Start and operated by a nonprofit noted high attrition rates, difficulties in getting parents to pick up food and make payments, and communication inconsistencies with participating farmers as a result of high staff turnover [38].
F3B farmers may have taken more risks in implementing a new DTC model than F3HK farmers, as the latter were provided with customers (study participants), and a 50% preseason subsidy. F3B farmers received technical assistance from Cooperative Extension staff, but box sales (and therefore farmer profitability) were more influenced by market forces. Perhaps for those reasons, F3B farmers were more vocal in expressing their awareness of market trends, and their understanding of how local demographic, economic, and competitor contexts affect their businesses [16]. F3HK farmers had less to say on these topics, although as experienced, small-scale farmers, they undoubtedly had a similar level of knowledge and awareness of those issues.
Many F3HK farmers used on-farm or pre-existing CSA pickup sites that were presumably already acceptable to their market-share CSA customers. Nonetheless, as White and colleagues reported, F3HK participant focus groups revealed that some CO-CSA members found it difficult to incorporate pickup into regular travel patterns [57], an issue also described by Quandt et al. [58] though this was not reported by Hoffman, et al., who investigated a CO-CSA with pickups conveniently located in Head Start where parents brought their children [39]. Andreatta et al. found arranging for a volunteer home delivery for households without access to a car or public transportation addressed this issue [38]. For F3B and F3HK farmers, understanding the needs and preferences of a new consumer group, and selecting appropriate pickup settings and locations in response, was challenging. Farmers striving to open new markets using these DTC approaches would benefit from further research on the attitudes, preferences and needs of rural and low-income consumers regarding locally produced foods. Specifically, F3B farmers might benefit from skill-building trainings to help them develop strategic marketing and outreach strategies. Previous research has noted that most consumers lack of awareness of the reasons to buy local foods, leading them to be less likely to purchase it [59]. Additionally, growers selling exclusively through DTC channels may need additional training in marketing their product, as previous research showed them to have fewer marketing skills than those who sell through intermediated channels [32], which is related to lower farm profitability for this group.
Finally, it should be noted that many consider local food value chains as a solution to the problem of global food security in the face of population growth, poverty, and climate change [60,61]. Local food value chains consist of food producers, processors, distributors, and retailers working to maximize social and economic return on investment. They have the potential to be both productive and sustainable by conserving the environment and natural resource base; developing resilience to climate change, price fluctuations and consumer needs; and improving people’s health and livelihoods [61]. Embedded in the concept is the goal of providing “meaningful and equitable employment for farmers, laborers, and their families” and “making food accessible to a wide demographic of consumers” [62]. Yet a viable local food system requires not only the commitment of actors directly involved in each step of the value chain, but also societal support and investment, reflected in public policy. In the U.S., farmers benefit from two U.S. Department of Agriculture grant programs, the Farmers Market Promotion Program and the Local Food Promotion Program, authorized in the 2002 Farm Bill. These programs aim to remove cost barriers to local food by funding programs that incentivize farmers market shopping or subsidize the purchase of community supported agriculture (CSA) subscriptions, which can provide community members with regular access to local produce throughout the growing season. However, farm businesses are still largely at the mercy of market forces beyond their control [15,62].
4.5. Study Limitations
This study focuses on thirteen farms in a north-eastern and north-western part of the U.S. While these farms share many of the same characteristics and concerns of farms in other states, they also have unique sociodemographic and geographic characteristics that distinguish them from one another and from farms in other regions in the U.S. Thus, caution should be exercised when generalizing results from this study to other areas.
Another limitation is that farmers were not asked directly about how geospatial features may have impacted implementation of the new DTC model, although comments on these topics emerged spontaneously during interviews. None of the farmers in either study was asked their opinion on how nearby supermarkets or farmers’ markets might have affected consumer interest in their product. Asking specific questions about context might have elicited additional, more detailed information. Additionally, F3B and F3HK farmer interviews were drawn from different question sets, geared toward the respective aims of each study, making comparison challenging. For example, F3B farmers were asked to comment on the suitability of the retail partner location, while F3HK farmers were only asked about pickup sites in the context of whether the site required additional staff resources.
5. Conclusions
This paper marks an initial attempt to consider farmers’ experience with piloting a DTC innovation and the possible influence of geospatial characteristics. Our findings suggest that farmers may be willing to try something new if they perceive it to have potential, even if they experience challenges during implementation and regardless of variations in spatial characteristics. Our findings confirm other studies [21,22,23] that show location as an important factor, but not the only one that contributes to farmer burden or consumer behavior.
A key finding from qualitative interviews with the F3B farmers was a desire to better understand what would motivate a convenience store shopper to purchase local produce in that setting. It would therefore be valuable to interview convenience store shoppers to assess their attitudes about local foods and compare findings with farmer interviews and geospatial data, similar to a recent study involving F3HK farmers and participants [63]. Further, hierarchical modelling using consumer surveys employing themes that emerged from consumer interviews could help us better understand the relative influence of consumer attitudes, sociodemographic characteristics (at both household and area level), and geospatial factors on consumer behavior.
Research on the benefits of specific DTC models for farmers is scarce, and often limited to discrete geographic areas. As farmers explore new DTC models, there is a need for more investigation into what farmers know about their customers and local contexts, how they know it, the logistical choices and accommodations they make in response to that knowledge, and the success of their efforts to meet customer tastes and preferences. To explore these questions, we therefore recommend that future research ascertain the relative importance of multiple factors related to consumer purchase behavior for rural and low-income market segments, including consumer attitudes; peer influence; location and cultural sensitivity of the venue; product characteristics and price. Because geospatial context is important, validated measures should be developed, and used to study the role and impact of nearby conventional and alternative food retail outlets on DTC operations. Research on farmer experiences in implementing new DTC models should consider asking specific questions about how geospatial context shapes their decisions and affects their business.
There is much to be explored with regard to how sociodemographic and geospatial factors and the degree to which farmers respond to known consumer needs affects the success of implementing innovative DTC models, and include economic parameters to estimate farmer profitability. Mixed- methods approaches that consider farmer and consumer perspectives alongside quantitative contextual data are needed. Hierarchical modelling using consumer surveys with emergent themes from consumer interviews could help increased understanding of the relative influence of consumer attitudes, sociodemographic characteristics (at both household and area level), and geospatial factors on consumer behavior. Future research should also include a broader and more diverse representation of small-scale farms across the U.S.
Author Contributions
Conceptualization, M.S., J.T.M., W.W., R.A.S., and J.K.; Data curation, J.M.T; Formal analysis, M.S., J.M.T. and W.W.; Funding acquisition, R.A.S., J.K., and M.S.; Investigation, M.S. and W.W.; Methodology, M.S., J.M.T. and W.W.; Project administration, J.K. and R.A.S.; Writing–original draft, M.S.; Writing–review & editing, J.T.M., W.W., R.A.S., and J.K.
Funding
This research was supported by the National Institute of Food and Agriculture, U.S. Department of Agriculture (USDA), under award numbers 2016-67023-24853 (Farm Fresh Food Boxes) and 2015-68001-23230 (Farm Fresh Foods for Healthy Kids). USDA had no role in the design, analysis or writing of this article. Jane Kolodinsky is the Principle Investigator for Farm Fresh Food Boxes study; Rebecca A. Seguin is the Principal Investigator for Farm Fresh Foods for Healthy Kids study.
Acknowledgments
We would like to thank the farmers who took part in this research, Lauren Greco who assisted with data collection for Farm Fresh Food Boxes, and Florence Becot who assisted with initial coding of Farm Fresh Food for Healthy Kids farmer interviews.
Conflicts of Interest
The authors declare no conflict of interest.
Appendix A

Table A1.
Network distances.
| Farm Fresh Food Boxes | Farm Fresh Foods for Healthy Kids | ||||||||
|---|---|---|---|---|---|---|---|---|---|
| Farm | Farm to Retail (mi) | Retail to Supermarket (mi) | Retail to Farmers’ Market (mi) | RUCA Code | Farm | Farm to Pickup (mi) | Pickup to Supermarket (mi) | Pickup to Farmers’ Market (mi) | RUCA Code |
| VT2/6 | 2.1 | 6 | 17.5 | 5.0 | VT0/0.5 | 0 | 0.5 | 16.7 | |
| VT4/0.2 | 4.2 | 0.2 | 0.0 | 1.0 | VT12/2 | 0 and 11.9 | 1.6 | 11.1 | |
| VT4/0.6 | 4.2 | 0.6 | 38.0 | 10.6 | VT0/2 | 0 | 1.7 | 0.8 | |
| ----- | ----- | ----- | ----- | ----- | VT14/8 | 14 | 8.4 | 2.8 | |
| Average | 3.5 | 2.3 | 19.0 | ----- | Average | 5.18 | 3.05 | 6.3 | ----- |
| WA1/4 | 0.9 | 4.1 | 4.2 | 2.0 | WA10/1 | 10.3 | 1.4 | 1.3 | 2.0 |
| WA6/6 | 5.6 | 5.7 | 19.4 | 2.0 | WA26/1 | 26.5 | 1.1 | 0.8 | 2.0 |
| WA10/18 | 9.9 | 18.3 | 5.7 | 2.1 | WA17/1 | 16.9 | 0.9 | 4.5 | 2.1 |
| Average | 5.5 | 9.4 | 9.8 | ----- | Average | 17.9 | 1.1 | 2.2 | ----- |
For more information on Rural-Urban Commuting (RUCA) Codes and how they are defined, please see https://www.ers.usda.gov/data-products/rural-urban-commuting-area-codes/documentation/.
Table A2.
Representative quotes from farmer interviews: key findings by state.
| Representative Quotes from Farmer Interviews: Key Findings by State | ||||
|---|---|---|---|---|
| F3B Vermont | F3B Washington | F3HK Vermont | F3HK Washington | |
| DTC model’s profitability & other benefits | VT4/0.6: “It’s another venue to sell our produce … I was hoping to reach some other type of customers and citizens that, for whatever reason, didn’t have access to what we were growing…You know, it did help sort of draining out some of the surplus, which is what I wanted it to do.” | WA1/4: “[F3B] stood out to me as something that was good and had potential. “ WA2: “… it made us continue to think about the ways in which we can reach people and market better.” | VT0/0.5: “It hasn’t [made money]. Just with the two [CO-CSA] people, there wasn’t that big of a difference. It was really nice to get half of the cost up front” VT12/2: “…it was economically a net benefit despite the challenges and frustrations… It’s hard for me to… scoff at 9 x $360. That’s income for the farm.” | WA10/1: “If I thought that it had made a huge positive [financial]… impact, I would know… Now in the feel-good impact—it’s there.” WA26/1: “I would say it increased it because … we picked up more money. The cost of doing the deliveries and stuff … it was still a gain to do it.” |
| DTC model’s impact on increasing customer base | VT2/6: “Calling it a food box instead of the CSA… making it accessible in locations that are not sort of your typical CSA locations—I appreciate that effort to just make it, make CSA, a little bit more of an accessible concept and locations.” | WA6/6 “…people who hear about us through the [F3B] marketing and then who buy the boxes and get hooked on the food and the experience…if we can continue to grow the program and get more boxes, that supports us financially…to be able to build a successful financial business” | VT12/2: “And also it was going to be a huge benefit for our farm to have 10 to 20 new CSA members. In our experience, usually when people become CSA members, we have a really high retention rate. | WA26/1: “I think what really worked well was helping things to be more accessible so that people could use their EBT benefits” WA17/1: “We do all our shares in [County B] in the [major city] area and we’re interested in trying to shift some of our market to [County A].” |
| Farmer’s awareness of food access barriers | VT2/6: “…perceptions that, you know, buying organic food is more expensive…lack of time and… resources to cook [fresh produce] …we definitely see there’s sort of, like, a big skill gap in folks VT 4: Farmer: I would say maybe transportation, convenience, and maybe money, financial reasons. | WA10/18: “…the barriers, I think, are education and money… most of my clientele from my CSA has really been associated even with the national parks… a more educated community… They’ve had college degrees and they share about their food. And it’s a long drive to get to good food. | ||
| Effect of geographic isolation/food deserts | VT4/0.2: “[if] the closest store that sells any produce within, you know, 30 min or 45 min, or something, and all they have is the… iceberg lettuce, and the pink pale tomatoes, you know, then those people might be psyched [about] fresh veggies” | WA10/18: “there’s two small convenience stores and gas stations in the last town of our valley…that becomes a dead-end in the winter…in the mountains, the pass is closed. And the only people that go up there are skiers in the winter and snowmobilers.” | ||
| Competition from conventional and other DTC venues | VT4/0.2: “…our food is going to be more expensive than at Costco or Walmart, I think the local… agricultural products in general are really available now in almost all retail settings, you know, stores, restaurants, a lot of CSAs, a lot of farm stands, a lot of farmer’s markets.” | WA6/6: “[the pickup] it’s in a really small, little town … demographically, [it] is mostly older people who have their own gardens or just people passing through who aren’t necessarily thinking about getting vegetables from a farm that they don’t know about.” | WA26/1:”…being comparable, the ability to accept EBT and have that central location… farmers markets that offer that kind of model where… you can switch out things in your box, you can talk to somebody from the farm, that’s what people really want… in the future, [offering similar features] that’s going to increase our profits” | |
| DTC Model and farmer burden | VT4/0.2: “It [staffing and resource expenditures] didn’t change it much. I mean, you know, in terms of pack-out and distribution, we’re already all set up for that, and it was such a low volume…It was not like we had to shift our pack-out timing or anything because we have so much to do.” | WA1/4: “The proximity of the location was definitely a life saver just because, you know, it was not something that I was able to, going back to habit, create really effective ones that I could ingrain into my schedule.” | VT0/0.5: if they want to pay weekly–in order to make sure that we’re there when they’ll be there … we’re talking about shifting our schedules or the pickup time or I- don’t-know-what, so it’s easier for somebody to be there. | WA10/1:” Basically, people brought checks or they brought cash and that presented a bit of an issue because we don’t generally carry change for the pickup site” WA17/1:… if we are going to be doing CSA delivery, that we could tie in with nonsubsidized people at the same time… basically it allowed me …to make it worthwhile to deliver to some people in [town A] |
| Pricing Accom-modations | VT4/0.6: “…we kind of subsidize the pricing of what we’re putting in the box to reach a certain price point…We gave away a lot of produce at a really good price… I was pricing the produce in the box … almost below wholesale prices.” | WA10/18: “…you know, my CSA is pretty cheap because my clientele is not high-income… I certainly review other people’s CSA [prices] … I see I’m always on the low end of the spectrum. | WA26/1:”… people are pretty much buying things at cost anyway by joining a CSA. It’s really hard for a farmer to make that cost even lower and offer a discount sometimes, but a pretty minimal discount, because so much of that price is just going directly into [paying operating expenses for] the farm. “ | |
| Pickup location--suitability | VT4/0.2: “[at convenience stores], you go grab something quick, you grab your lunch quick, or you get that gallon of milk that you forgot, or maybe they have ice cream on sale…But you’re not going out to go grocery shopping when you stop there typically. | WA1/4: “I would be the happiest person in the world if 7-11s were selling fresh food. But I don’t think those are the spot where you’re gonna be able to snag people, unless you are doing, like, heavily promoted, subsidized options, you know?” | VT0/0.5: “…we’d love to have [pickup] it at the farm but because of neighbors, we can’t have that much traffic on the road… But we’re building a house and a new barn sort of up the road, so we could have a different access road and not be sharing the road with the summer camp.” | WA26/1: “I am curious about why people dropped out of the program, particularly residents at [apartment complex that also served as pickup site] who it seemed like a very accessible thing. Did they give you [researches] reasons why they were dropping out, or did they just stop coming?” |
| Suggestions & planned changes | VT4/0.2: “…that maybe it’s a smaller price point, a smaller package, and something that they can display where people can see the product and grab and go. You know, you market it as more of like a quick meal prep. Or a quick lunch addition. Or, you know, here’s your salad for the week or something.” VT4: [At] the farmers market, there’s “crop-cash” that people on [EBT] cards get…[this could be] tied in where they could use it on, you know, the farm box and stuff like that. | WA1/4: “…try to expand the venues at which this can be offered. So don’t confine it necessarily to stores, if you will. I think the community centers, and health clubs” WA10/18: “I don’t really understand how far social media reaches into impoverished communities. That’s one question. … for example, how many of them have smartphones and are on Facebook? … you know--how do you outreach into rural communities?” | VT0/0.5 “…instead of putting everybody’s share in a single box, we have 8 boxes out and one would have kale and one would have tomatoes and it would say take one bunch of kale and a pound of tomatoes.” VT12/2: “… as long as …it’s not against the research policies or if I’m not collecting food stamps in advance from someone, I think I’m going to tell them that’s how we’re going to do it [monthly rather than weekly installments]” | WA26/1:”Well, we were talking about having the dropsite at the [nonprofit CBO]. I think that could change things and might make it more accessible to people–a window of time and then also give them choice with their box if they need to switch things out.” WA17/1: “I would like to make a couple of changes but the main one being I’d like to discuss the possibility of having the pickup site be at our fruit stand. “ |
Table A3.
Synthesis of quantitative and qualitative results.
| Question | Quantitative Findings | Qualitative Findings | Comments |
|---|---|---|---|
| How suitable/accessible was the pickup location? | --Both DTC models in VT & WA had low walkability, high car dependence, lack of public transportation in pickup areas. --VT pickup locations were in more rural areas for both models | --F3B farmers in both states recognized geographic isolation, lack of public transportation and car-dependence as potential issues for customers 1 --F3B farmers spoke more about the suitability of setting than suitability of location. --2 WA F3HK farmers specifically said they selected pickup sites with customer convenience in mind | --Although RUCA codes designations showed VT to have more rural locations, there were pockets of more isolated and rural areas within WA for both DTC models. |
| Did farmers feel other nearby food venues enhanced or detracted from implementation? | --Both DTC models VT & WA had few farmers markets within two miles of pickup sites. --WA F3B locations had the longest average pickup to SM distance --WA F3HK locations had the shortest pickup to SM distance --VT F3B and F3HK pickup sites had pickup to SM distances that fell in between these extremes | --VT F3B farmers said local produce was common in conventional stores and nearby DTC venues --WA F3B farmers said food pantries and gardens were additional sources of local food --a WA farmer thought geographic isolation combined with few local stores, might provide a niche for F3B --Accepting EBT put F3HK on more equal footing with nutrition incentives at FM, according to a WA farmer --F3HK in WA and VT did not mention other local food venues in interviews | --All VT F3HK farms, and one WA F3HK farm, pickup either on-farm or at existing CSA drop sites --VT & WA F3B farmers were equally likely to mention the effect other local food venues, despite differences in pickup to SM distances |
| How did actual farm to pickup distances correspond with farmer’s perceived delivery time burden? | WA farmers implementing F3HK had the longest average farm-to-pickup site driving distance | --F3HK farms in both states reported deliveries constituted no burden, but said extra staff time was required to handle payment transactions and maintain records --WA F3B farmers said proximity to the retailer made for easy delivery but noted interacting with retailers took extra time. | --All VT F3HK farms, and one WA F3HK farm, had pickups either on-farm or at existing CSA drop sites --Only F3HK farmers were asked specifically about burden related to deliveries |
1 A WA F3HK farmer said customers missed pickups due to delays in picking up children from school or children napping.
References
- Tropp, D. Why Local Food Matters: The Rising Importance of Locally-Grown Food in the US Food System; No. 160752; United States Department of Agriculture: Washington, DC, USA, 2013.
- US Department of Agriculture. 1992 Census of Agriculture; US Department of Agriculture: Washington, DC, USA, 1994.
- US Department of Agriculture. 2007 Census of Agriculture; US Department of Agriculture: Washington, DC, USA, 2009.
- US Department of Agriculture. 2012 Census of Agriculture; US Department of Agriculture: Washington, DC, USA, 2014.
- Sitaker, M.; Kolodinsky, J.; Pitts, S.J.; Seguin, R. Do entrepreneurial food systems innovations impact rural economies and health? Evidence and gaps. Am. J. Entrep. 2014, 7, 3–16. [Google Scholar]
- Kloppenburg, J.; Hendrickson, J.; Stevenson, G.W. Coming in to the foodshed. Agric. Hum. Values 1996, 13, 33–42. [Google Scholar] [CrossRef]
- Key, N.; Roberts, M.J. Nonpecuniary Benefits to Farming: Implications for Supply Response to Decoupled Payments. Am. J. Agric. Econ. 2009, 91, 1–18. [Google Scholar] [CrossRef]
- Brown, C.; Miller, S. The impacts of local markets: A review of research on farmers markets and community supported agriculture (CSA). Am. J. Agric. Econ. 2008, 90, 1298–1302. [Google Scholar] [CrossRef]
- Guthman, J.; Morris, A.W.; Allen, P. Squaring farm security and food security in two types of alternative food institutions. Rural Soc. 2006, 71, 662–684. [Google Scholar] [CrossRef]
- Feenstra, G. Local Food Systems and Sustainable Communities. Am. J. Altern. Agric. 1997, 12, 28–36. [Google Scholar] [CrossRef]
- Morgan, T.K.; Alipoe, D. Factors affecting the number and type of small-farm direct marketing outlets in Mississippi. J. Food Distrib. Res. 2001, 32, 125–132. [Google Scholar]
- King, R.; Hand, M.S.; DiGiacomo, G.; Clancy, K.; Gomez, M.I.; Hardesty, S.D.; Lev, L.; McLaughlin, E.W. Comparing the Structure, Size, and Performance of Local and Mainstream Food Supply Chains; ERS-99; U.S. Department of Agriculture, Economic Research Service: Washington, DC, USA, 2010.
- Cone, C.A.; Myhre, A. Community-supported agriculture: A sustainable alternative to industrial agriculture? Hum. Organ. 2000, 59, 187–197. [Google Scholar] [CrossRef]
- Jarosz, L. The city in the country: Growing alternative food networks in Metropolitan areas. J. Rural. Stud. 2008, 24, 231–244. [Google Scholar] [CrossRef]
- Galt, R.E. The moral economy is a double-edged sword: Explaining farmers’ earnings and self-exploitation in community-supported agriculture. Econ. Geogr. 2013, 89, 341–365. [Google Scholar] [CrossRef]
- McKee, E. It’s the Amazon World: Small-Scale Farmers on an Entrepreneurial Treadmill. Cult. Agric. Food Environ. 2018, 40, 65–69. [Google Scholar] [CrossRef]
- Guptill, A.; Wilkins, J.L. Buying into the food system: Trends in food retailing in the US and implications for local foods. Agric. Hum. Values 2002, 19, 39–51. [Google Scholar] [CrossRef]
- Morgan, E.; Severs, M.; Hanson, K.; McGuirt, J.; Becot, F.; Wang, W.; Kolodinsky, J.; Sitaker, M.; Jilcott Pitts, S.; Ammerman, A.; et al. Gaining and Maintaining a Competitive Edge: Evidence from CSA Members and Farmers on Local Food Marketing Strategies. Sustainability 2018, 10, 2177. [Google Scholar] [CrossRef]
- Feldmann, C.; Hamm, U. Consumers’ perceptions and preferences for local food: A review. Food Qual. Prefer. 2014, 40, 152–164. [Google Scholar] [CrossRef]
- Pole, A.; Kumar, A. Segmenting CSA members by motivation: Anything but two peas in a pod. Br. Food J. 2015, 117, 1488–1505. [Google Scholar] [CrossRef]
- Bean, M.; Sharp, J.S. Profiling alternative food system supporters: The personal and social basis of local and organic food support. Renew. Agric. Food Syst. 2011, 26, 243–254. [Google Scholar] [CrossRef]
- Ostrom, M.R. Community supported agriculture as an agent of change: Is it working. In Remaking the North American Food System; Hinrichs, C., Lyson, T., Eds.; University of Nebraska Press: Lincoln, NE, USA, 2007; pp. 99–120. [Google Scholar]
- McGuirt, J.T.; Pitts, S.B.J.; Hanson, K.L.; DeMarco, M.; Seguin, R.A.; Kolodinsky, J.; Ammerman, A.S. A modified choice experiment to examine willingness to participate in a Community Supported Agriculture (CSA) program among low-income parents. Renew. Agric. Food Syst. 2018, 1–18. [Google Scholar] [CrossRef]
- Perez, J.; Allen, P.; Brown, M. Community Supported Agriculture on the Central Coast: The CSA Member Experience; Center for Agroecology and Sustainable Food Systems, University of California: Santa Cruz, CA, USA, 2003. [Google Scholar]
- Mittal, A.; Krejci, C.C.; Craven, T.J. Logistics Best Practices for Regional Food Systems: A Review. Sustainability 2018, 10, 168. [Google Scholar] [CrossRef]
- Lohr, L.; Diamond, A.; Dicken, C.; Marquardt, D. Mapping Competition Zones for Vendors and Customers in U.S. Farmers Markets; US Department of Agriculture: Washington, DC, USA, 2011.
- Woods, T.; Ernst, T.; Tropp, D. Community Supported Agriculture–New Models for Changing Markets; U.S. Department of Agriculture: Washington, DC, USA, 2017.
- Rossi, J.J.; Woods, T.A.; Allen, J.E. Impacts of a Community Supported Agriculture (CSA) Voucher Program on Food Lifestyle Behaviors: Evidence from an Employer-Sponsored Pilot Program. Sustainability 2017, 9, 1543. [Google Scholar] [CrossRef]
- Wholesome Wave. How to Start a CSA Nutrition Incentive Program. Available online: https://www.wholesomewave.org/sites/default/files/network/resources/files/How-to-Start-a-CSA-Incentive-Program-Toolkit.pdf (accessed on 22 February 2019).
- Kolodinsky, J.M. Community Supported Agriculture. In The Sage Encyclopedia of Food Issues; Albala, K., Ed.; Sage: Los Angeles, CA, USA, 2015; pp. 204–209. ISBN 978-1-4522-4301-6. [Google Scholar]
- LeRoux, M.N.; Schmit, T.M.; Roth, M.; Streeter, D.H. Evaluating marketing channel options for small-scale fruit and vegetable producers. Renew. Agric. Food Syst. 2010, 25, 16–23. [Google Scholar] [CrossRef]
- Park, T.; Mishra, A.K.; Wozniak, S.J. Do farm operators benefit from direct to consumer marketing strategies? Agric. Econ. 2014, 45, 213–224. [Google Scholar] [CrossRef]
- Smith, D.; Greco, L.; Van Soelen Kim, J.; Sitaker, M.; Kolodinsky, J. Farm Fresh Food Box: An Innovative Business Model for Rural Communities. In Rural Connections; University of Vermont: Burlington, VT, USA, 2018; pp. 25–28. [Google Scholar]
- Haynes-Maslow, L.; Osborne, I.; Jilcott Pitts, S.; Sitaker, M.; Byker Shanks, C.; Leone, L.; Maldonado, A.; McGuirt, J.; Andress, L.; Bailey-Davis, L.; et al. Rural Corner Store Owners’ Perceptions of Stocking Healthier Foods in Response to Proposed Changes to the United States’ Supplemental Nutrition Assistance Program Retailer Rule. Food Policy 2018, 81, 58–66. [Google Scholar] [CrossRef]
- Bauman, A.; Mcfadden, D.T.; Jablonski, B.B.R. The Financial Performance Implications of Differential Marketing Strategies: Exploring Farms that Pursue Local Markets as a Core Competitive Advantage. Agric. Resour. Econ. Rev. 2018, 47, 1–28. [Google Scholar] [CrossRef]
- Seguin, R.A.; Ammerman, A.S.; Hanson, K.L.; Kolodinsky, J.; Pitts, S.B.J.; Sitaker, M. Farm Fresh Foods for Healthy Kids: Innovative Cost-Offset Community Supported Agriculture Intervention to Prevent Childhood Obesity and Strengthen Local Agricultural Economies. J. Nutr. Educ. Behav. 2017, 49, S120. [Google Scholar] [CrossRef]
- Kolodinsky, J.M.; Sitaker, M.; Morgan, E.H.; Connor, L.M.; Hanson, K.L.; Becot, F.; Pitts, S.B.; Ammerman, A.S.; Seguin, R.A. Can CSA Cost-Offset Programs Improve Diet Quality for Limited Resource Families? Choices 2017, 32, 1–10. [Google Scholar]
- Andreatta, S.; Wickliffe, W. Managing farmer and consumer expectations: A study of a North Carolina farmers market. Hum. Org. 2002, 61, 167–176. [Google Scholar] [CrossRef]
- Hoffman, J.A.; Agrawal, T.; Wirth, C.; Watts, C.; Adeduntan, G.; Myles, L.; Castaneda-Sceppa, C. Farm to family: Increasing access to affordable fruits and vegetables among urban head start families. J. Hunger. Environ. Nutr. 2012, 7, 165–177. [Google Scholar] [CrossRef]
- Blake, M.K.; Mellor, J.; Crane, L. Buying Local Food: Shopping Practices, Place, and Consumption Networks in Defining Food as “Local”. Ann. Assoc. Am. Geog. 2010, 100, 409–426. [Google Scholar] [CrossRef]
- McGuirt, J.T.; Pitts SB, J.; Ward, R.; Crawford, T.W.; Keyserling, T.C.; Ammerman, A.S. Examining the influence of price and accessibility on willingness to shop at farmers’ markets among low-income eastern North Carolina women. J. Nutr. Educ. Behav. 2014, 46, 26–33. [Google Scholar] [CrossRef]
- United States Census Bureau. 2012–2016 American Community Survey 5-Year Estimates [Data File]. 2016. Available online: http://www.huduser.org/Datasets/IL/IL08/in_fy2008.pdf (accessed on 26 February 2019).
- Walkscore. Available online: http://www.walkscore.com (accessed on 26 February 2019).
- Carr, L.J.; Dunsiger, S.I.; Marcus, B.H. Walk score as a global estimate of neighborhood walkability. Am. J. Prev. Med. 2010, 39, 460–463. [Google Scholar] [CrossRef]
- Duncan, D.T.; Aldstadt, J.; Whalen, J.; Melly, S.J. Validation of Walk Scores and Transit Scores for estimating neighborhood walkability and transit availability: A small-area analysis. Geo J. 2013, 78, 407–416. [Google Scholar] [CrossRef]
- Hirsch, J.A.; Moore, K.A.; Evenson, K.R.; Rodriguez, D.A.; Roux AV, D. Walk Score® and Transit Score® and walking in the multi-ethnic study of atherosclerosis. Am. J. Prev. Med. 2013, 45, 158–166. [Google Scholar] [CrossRef]
- Ref USA. 2018. Available online: http://resource.referenceusa.com/ (accessed on 26 February 2019).
- National Organic Farmers Association-Vermont (NOFA-VT). Available online: https://nofavt.org/ (accessed on 26 February 2019).
- Washington State Farmers Market Association. Available online: http://wafarmersmarkets.org/ (accessed on 26 February 2019).
- Google Maps Application Programming Interface (API). Available online: https://developers.google.com/maps/documentation/javascript/reference/geocoder#Geocoder.geocode (accessed on 26 February 2019).
- BatchGeo. Available online: https://batchgeo.com/ (accessed on 26 February 2019).
- ARC GIS. Proximity Analysis [Commonly Used Tools]. Available online: http://desktop.arcgis.com/en/arcmap/10.3/analyze/commonly-used-tools/proximity-analysis.htm (accessed on 26 February 2019).
- Zepeda, L.; Deal, D. Organic and local food consumer behaviour: Alphabet Theory. Int. J. Consum. Stud. 2009, 33, 697–705. [Google Scholar] [CrossRef]
- Sirieix, L.; Delanchy, M.; Remaud, H.; Zepeda, L.; Gurviez, P. Consumers’ perceptions of individual and combined sustainable food labels: A UK pilot investigation. Int. J. Consum. Stud. 2013, 37, 143–151. [Google Scholar] [CrossRef]
- Pinchot, A. The Economics of Local Food Systems: A Literature Review of the Production, Distribution, and Consumption of Local Food; University of Minnesota, Extension Center for Community Vitality: Duluth, MN, USA, 2014; Available online: https://conservancy.umn.edu/bitstream/handle/11299/171637/2014-Economics-of-Local-Food-Systems.pdf?sequence=1 (accessed on 26 March 2019).
- Paul, M. Farmer Perspectives on Livelihoods Within Community Supported Agriculture. Economics Department Working Paper Series, Paper 212. 2016. Available online: http://scholarworks.umass.edu/econ_workingpaper/212 (accessed on 26 March 2019).
- White, M.J.; Pitts, S.B.J.; McGuirt, J.T.; Hanson, K.L.; Morgan, E.H.; Kolodinsky, J.; Seguin, R.A. The perceived influence of cost-offset community-supported agriculture on food access among low-income families. Publ. Health Nutr. 2018, 21, 2866–2874. [Google Scholar] [CrossRef]
- Izumi, B.T.; Higgins, C.E.; Baron, A.; Ness, S.J.; Allan, B.; Barth, E.T.; Smith, T.M.; Pranian, K.; Frank, B. Feasibility of using a community-supported agriculture program to improve fruit and vegetable inventories and consumption in an underresourced urban community. Prev. Chronic Dis. 2013, 10, E136. [Google Scholar]
- Bailey, J. Regional Food Systems in Nebraska: The Views of Consumers, Producers and Institutions; Center for Rural Affairs: Lyons, NE, USA, 2013; Available online: http://files.cfra.org/pdf/ne-food-systems-report.pdf (accessed on 26 March 2019).
- Van Berkum, S.; Dengerink, J.; Ruben, R. The Food Systems Approach: Sustainable Solutions for a Sufficient Supply of Healthy Food; No. 2018-064; Wageningen Economic Research: Den Haag, The Netherlands, 2018; Available online: https://knowledge4food.net/wp-content/uploads/2018/10/180630_foodsystems-approach.pdf (accessed on 28 March 2019).
- Global Harvest Initiative. GAP Report: Measuring Global Agricultural Productivity. 2015. Available online: https://www.globalharvestinitiative.org/GAP/2016_GAP_Report.pdf (accessed on 28 March 2019).
- Pilgeram, R. The only thing that isn’t sustainable…is the farmer: Social sustainability and the politics of class among Pacific Northwest farmers engaged in sustainable farming. Rural Soc. 2011, 76, 375–393. [Google Scholar] [CrossRef]
- McGuirt, J.T.; Sitaker, M.; Jilcott Pitts, S.; Ammerman, A.; Kolodinsky, J.; Seguin, R. A mixed-methods examination of the geospatial and sociodemographic context of a direct-to-consumer food system innovation. J. Agric. Food Syst. Commum. Dev. under review.
Figure 1.
Farmers balance personal needs with exogenous forces in business decision-making.

Table 1.
Context in which F3B and F3HK transactions occur.
| Farm Fresh Food Box | Farm Fresh Foods for Healthy Kids | |||
|---|---|---|---|---|
| Demographic Characteristics | Vermont | Washington | Vermont | Washington |
| Population Range | 1057–2321 | 461–952 | 690–2309 | 755–1860 |
| Mean [Standard deviation (SD)] | 1750 (641) | 740 (252) | 1376 (745) | 1307 (553) |
| Median Age Range | 38–47.4 | 37.5–50.7 | 29–54 | 26–38 |
| Average (SD) | 42.5 (4.7) | 45.8 (7.2) | 38 (9.6) | 31 (6) |
| Median HH Income Range | $50,662–$93,281 | $24,830–$100,735 | $20,284–$66,938 | $35,083–$52,708 |
| Average (SD) | $69,949 ($21,595) | $66,438 ($38,477) | $45,972 ($18,374) | $42,313 ($9228) |
| % H.S. Graduates Range | 10.0–20.0 | 12.0–22.0 | 9.0–23.0 | 6.0–27.0 |
| Average (SD) | 14 (5.3) | 16 (5.3) | 16.4 (5.7) | 15.7 (10.6) |
| % Minority population Range | 3.0–6.0 | 5.0–26.0 | 0.0–51.0 | 9.0–27.0 |
| Average (SD) | 5.0 (1.7) | 12.7 (11.6) | 14.6 (20.7) | 18.0 (9.0) |
| % Living in Poverty Range | 2.7–5.4 | 0.0–12.0 | 2.7–51.8 | 15.7–25.6 |
| Average (SD) | 4.2 (1.4) | 4.8 (6.3) | 19.3 (18.9) | 25.0 (10.0) |
| % HH receiving SNAP Range | 3.0–25.0 | 3–40.0 | 5.0–56.0 | 14.0–43.0 |
| Average (SD) | 12.3 (11.4) | 14.3 (22.3) | 25.6 (21.1) | 31.0 (15.1) |
| Transportation Environment | Vermont | Washington | Vermont | Washington |
| Walk Score Range | 24–44 | 12–20 | 4–66 | 21–69 |
| Average (SD) | 34.3 (10.0) | 17.0 (4) | 27 (24.5) | 44 (24.1) |
| Transit Score Range | 0 | 0 | 0–39 | 0–27 |
| Average (SD) | 0 | 0 | 8 (17.4) | 9 (15.6) |
| % Drive to work Range | 47.1–89.6 | 70.6–93.3 | 47.1–89.6 | 75.4–95.7 |
| Average (SD) | 88.0 (5.2) | 83.6 (11.7) | 75.0 (18.7) | 83.5 (10.8) |
| Geospatial Characteristics | Vermont | Washington | Vermont | Washington |
| Farm-to-pickup (mi) | 2.1–4.2 | 0.9–9.9 | 0–14.0 | 10.3–26.5 |
| Average (SD) | 3.5 (1.2) | 5.5 (4.5) | 5.2 (7.1) | 17.9 (8.15) |
| # SM within a 2 mi radius | 0–2 | 0–3 | 0–5 | 4–7 |
| Average (SD) | 0.7 (1.2) | 1.0 (1.7) | 1.6 (2.1) | 5.0 (1.7) |
| Pickup to Supermarket | 0.2–6 | 4.1–18.3 | 0.5–8.4 | 0.9–1.4 |
| Average (SD) | 2.3 (3.2) | 9.4 (7.8) | 2.8 (3.2) | 1.1 (0.3) |
| # FM within a 2 mi radius | 0–1 | 0 | 0–5 | 0–2 |
| Average (SD) | 0.3 (0.6) | 0 | 1.2 (2.2) | 1.0 (1.0) |
| Pickup to FM (miles) | 0–38 | 4.2–19.4 | 0.3–16.7 | 0.8–4.5 |
| Average (SD) | 18.5 (19) | 9.8 (8.4) | 6.3 (7.2) | 2.2 (2.0) |
* ACS 2015 estimates were unavailable for one town due to small population size.
© 2019 by the authors. Licensee MDPI, Basel, Switzerland. This article is an open access article distributed under the terms and conditions of the Creative Commons Attribution (CC BY) license (http://creativecommons.org/licenses/by/4.0/).
Share and Cite
MDPI and ACS Style
Sitaker, M.; McGuirt, J.T.; Wang, W.; Kolodinsky, J.; Seguin, R.A. Spatial Considerations for Implementing Two Direct-to-Consumer Food Models in Two States. Sustainability 2019, 11, 2081. https://doi.org/10.3390/su11072081
AMA Style
Sitaker M, McGuirt JT, Wang W, Kolodinsky J, Seguin RA. Spatial Considerations for Implementing Two Direct-to-Consumer Food Models in Two States. Sustainability. 2019; 11(7):2081. https://doi.org/10.3390/su11072081
Chicago/Turabian StyleSitaker, Marilyn, Jared T. McGuirt, Weiwei Wang, Jane Kolodinsky, and Rebecca A. Seguin. 2019. "Spatial Considerations for Implementing Two Direct-to-Consumer Food Models in Two States" Sustainability 11, no. 7: 2081. https://doi.org/10.3390/su11072081
Note that from the first issue of 2016, this journal uses article numbers instead of page numbers. See further details here.