Effect of Mix Constituents and Curing Conditions on Compressive Strength of Sustainable Self-Consolidating Concrete


College of Engineering, Abu Dhabi University, PO Box 59911, Abu Dhabi, UAE
Sustainability 2019, 11(7), 2094; https://doi.org/10.3390/su11072094
Submission received: 3 March 2019
/
Revised: 31 March 2019
/
Accepted: 3 April 2019
/
Published: 8 April 2019
(This article belongs to the Special Issue Sustainable Civil Engineering Materials)
Abstract
:The production of cement requires significant energy and is responsible for more than 5% of global CO2 emissions; therefore it is imperative to reduce the production and use of ordinary portland cement (OPC). This paper examines the compressive strength development of low water-to-binder (w/b) ratio self-consolidating concrete (SCC) in which 90% of the cement is replaced with industrial by-products including ground granulated blast furnace slag (GGBS), fly ash, and silica fume. The emphasis in this paper is on replacing a large volume of cement with GGBS, which represented 10% to 77.5% of the cement replaced. Fresh properties at w/b ratio of 0.27 were examined by estimating the visual stability index (VSI) and t50 time. The compressive strength was determined after 3, 7, 28, and 56 days of curing. The control mix made with 100% OPC developed compressive strength ranging from 55 MPa after three days of curing to 76.75 MPa after 56 days of curing. On average, sustainable SCC containing 10% OPC developed strength ranging from 31 MPa after three days of curing to 56.4 MPa after 56 days of curing. However, the relative percentages of fly ash, silica fume, and GGBS in the 90% binder affect the strength developed as well. In addition, this paper reports the effect of the curing method on the 28 day compressive strength of environmentally friendly SCC in which 90% of the cement is replaced by GGBS, silica fume, and fly ash. The highest compressive strength was achieved in samples that were cured for three days under water, then left to air-dry for 25 days, compared to samples cured using chemical compounds or samples continuously cured under water for 28 days. The study confirms that SCC with 10% OPC and 90% supplementary cementitious composites (GGBS, silica fume, fly ash) can achieve compressive strength sufficient for many practical applications by incorporating high amounts of GGBS. In addition, air-curing of samples in a relatively high temperature (after three days of water curing) produce a higher 28 day compressive strength compared to water curing for 28 days, or membrane curing.
1. Introduction
This paper outlines the findings of a study to evaluate the compressive strength of self-consolidating concrete (SCC) in which up to 90% of ordinary Portland cement (OPC) is replaced with industry by-products including GGBS, fly ash, and silica fume. These pozzolanic materials convert calcium hydroxide (Ca(OH)2), a hydration by-product of OPC, to calcium silicate hydrate (C-S-H) gel [1]. In this study, the amount of GGBS used to replace cement is the largest compared to fly ash and silica. This is intended to support the recycling of the vast amount of GGBS produced by the steel industry. GGBS comes out of blast-furnaces as molten slag at temperatures as high as 1400 °C to 1500 °C and is then rapidly quenched into a glass state [2]. Rapid quenching with large quantities of cool water, applied through high-pressure water jets, produces granulated slag with a high glass content [2]. In addition, GGBS was shown to enhance the durability and strength development in SCC. The increase in the strength of concrete containing GGBS as a partial replacement of OPC is due to the increased hydration products caused by pozzolanic reactivity, and due to the finer pore structure [3].
GGBS reduces the expansion of concrete associated with alkali-silica reaction (ASR) and prevents the loss of mechanical properties [4]. Hogan and Meusel [2] tested SCC containing GGBS with replacement ratios up to 65% and demonstrated that concrete expansion due to ASR decreases as the replacement ratio increases. A loss in compressive strength due to ASR may be as high as 50% after 50 years of ASR reaction [5].
Sengul and Tasdemir [6] concluded that the partial replacement of OPC with fly ash or slag is more effective in decreasing the chloride penetration permeability than reducing the w/b ratio. Compared to mortar samples without GGBS, 20 mm cubic samples in which OPC was partially replaced with GGBS (5%, 15%, 25%, and 35%) performed better in terms of a loss in compressive strength when placed in sodium chloride (NaCl) and sodium sulfate (Na2SO4) solution [3]. After 180 days of exposure to NaCl/Na2SO4 solutions, decrease in compressive strength was the least in mortar samples where 25% or 35% of OPC was partially replaced with GGBS. One way partial replacement of OPC with GGBS enhances durability of concrete is through the reaction of tricalciumaluminate (C3A) with free chloride ions Cl− found in pore solution, in the presence of Ca(OH)2, to produce stable chloroaluminate compounds such as Friedel’s salt (C3A·CaCl2·10H2O) and Kuzel’s salt as shown in Equations (1) and (2) [3]. This process, known as chemical chloride binding, is exhibited in cement pastes containing supplementary cementitious materials (SCMs) with high content of C3A. Physical chloride binding occurs when ions are absorbed directly by C-S-H gel. The high amount of C3A is a characteristic of GGBS while Ca(OH)2 is a cement hydration product.
C3A + Ca(OH)2 + 2Cl− + 10H2O → C3A·CaCl2·10H2O + 20H−
C3A + 0.5Ca(OH)2 + 0.5CaSO4 + 2Cl− + 10H2O → C3A·(CaCl2)0.5·(CaSO4)0.5·10H2O + OH−
Chloride binding, which contributes to enhancing the durability of reinforced concrete, is largely due to the formation of Friedel’s salt, and this binding capacity generally increases with the content of C3A in the SCM, such as GGBS [7].
Partial replacement of OPC with a combination of glass powder (GP) and GGBS may enhance the durability of concrete by decreasing water absorption as measured by the sorptivity test. It was demonstrated that a partial replacement of 50% OPC with a combination of 15% glass powder (GP) and 35% GGPS decreased water absorption of concrete [8]. Under an elevated temperature as high as 700 °C, a loss in compressive strength and mass in concrete made with 100% OPC was comparable to concrete made with up to 50% GGBS [9]. However, under elevated temperatures, an increase in carbonation depth was observed in concrete with GGBS replacement up to 50% compared to control concrete with 100% OPC.
The replacement ratio of cement with GGBS affects the extent of improvement in mechanical properties and durability. Mohamed and Najm [10] tested several SCC mixes with w/b of 0.36 where OPC was partially replaced with GGBS in the range of 0% to 80%. The authors noted that the highest 28-day compressive strength was obtained when 35% of the cement was replaced with GGBS and surpassed the control mix prepared with 100% OPC. Replacing cement with more than 35% GGBS in binary OPC-GGBS SCC mixes results in a reduction of compressive strength compared to the compressive strength corresponding to the optimum replacement ratio, and possibly lower than the control mix. This is consistent with the findings of Sengul and Tasdemir [6] that suggest replacing 50% of OPC with GGBS produced 28-day strength lower than the control mix when w/b was 0.6, higher than the w/b of 0.36 used in the study by Mohamed and Najm [10]. Mansour et al. [11] demonstrated that the compressive strength of SCC cubes after 7 days and after 28 days of water curing increased with an increase in the replacement percentage of OPC with GGBS from 5% to 25%. Dadsetan and Bai [12] tested 100 mm cubes SCC samples (w/b = 0.45) in which OPC was partially replaced with 10%, 20%, and 30% GGBS, and demonstrated that the compressive strength increased with replacement ratio and surpassed the control mix. In a concrete strength/durability study where 50% of OPC was partially replaced with various combinations of glass power (GP) (45% to 5% in decrements of 5%) and GGBS (5% to 45% in increments of 5%), the optimum GGBS replacement for maximum compressive strength was found to be 35% (along with 15% GP) after 3, 7, and 28 days of curing [8]. It is important to note that the 35% optimum GGBS replacement ratio occurred in studies using 150 mm concrete cubes. However, in 20 mm cubic mortar samples, it was shown that the 35% GGBS replacement ratio provides the highest compressive strength after 180 days of curing [3]. The trend of increasing the compressive strength with an increase in GGBS replacement ratio up to an optimum replacement ratio includes concrete made consistent with studies that use non-recycled aggregates or mixing water. Majhi et al. [13] prepared and tested concrete mixes that use recycled aggregates and reported a decrease in compressive strength with an increase in GGBS replacement ratios from 10% to 60%. Dinakar et al. [14] developed a mix design method for SCC in which GGBS is used to replace OPC with percentages ranging from 20% to 80%. The authors also noted that 35% is the optimum GGBS replacement of OPC that produces the highest 28-day compressive strength.
The effective curing of concrete structures is critical for the hydration of binders to proceed and for the design compressive strength to be achieved [15]. Water curing is the most commonly used method in construction practice, where water is applied all over the freshly cast structural elements, that are often covered with burlap, continuously for three to seven days. The purpose of water curing is to retain water in the structural elements in order to entrap the moisture needed for hydration of the binder [16]. American Concrete Institute (ACI) 301 [17] recommends the minimum curing period to be the time required to achieve 70% of the specified compressive strength. Traditional curing methods serve their intended purpose but often require significant amounts of water to cure all structural elements [16]. Membrane-forming curing compounds are known to enhance durability but their effect on compressive strength development may vary depending on the type of curing compound. Curing compounds provide a membrane to prevent moisture loss which allows hydration reaction to proceed and strength development to continue. ASTM C309 [18] refers to two types of curing compounds, clear compounds which may or may not contain dyes, and white pigmented compounds.
Xue et al. [16] indicated that concrete samples cured using acrylic-based, paraffin-based, silicate-based, or composite-based, all demonstrated lower drying shrinkage and permeability. The membrane-forming curing compounds resulted also in an enhanced compressive strength, flexural strength, and crack resistance. The investigators observed that acrylic-based curing compounds outperformed the other compounds included in their study, in terms of improved durability and mechanical properties. However, Saarthak et al. [19] concluded that compressive strength is not sensitive to the type of curing compound used. Ibrahim et al. [20] concluded that when curing compounds are used, the durability and strength of the concrete are the same or better than those of concrete cured using the typical water-based method. The investigators argued that the curing method has a pronounced effect on durability but a limited effect on the concrete’s compressive strength. Yash et al. [21] argued that membrane-forming curing compounds produce concrete with strength and durability properties that are 80% to 90% better than concrete cured by exposure to air in room temperature, or concrete under wet cotton mat burlap. To the contrary, Al-Gahtani [22] observed that the 28-day compressive strengths of concrete cured under wet burlap were higher than concrete cured using acrylic-based or water-based curing compounds.
The objective of this study is to evaluate compressive strength development in concrete in which 90% of OPC is replaced with supplementary cementitious composites including high volume GGBS and smaller amounts of silica fume and fly ash. In addition, it is desired to evaluate the effectiveness of various curing methods in developing the compressive strength of the sustainable mixes evaluated in this study. Curing method affects the rate of hydration which is important because concrete containing a high volume of GGBS exhibits slower strength development at an early age [23]. Three curing methods are examined in this study, water-curing, air-curing, and curing using membrane-forming chemical compounds.
2. Experimental Program
2.1. Compressive Strength Development in 90% Replacement Self-Consolidating Concrete
2.1.1. Materials and Mix Composition
This study examined the strength development of SCC mixes containing 10% cement OPC and 90% recycled industrial by-products including GGBS, fly ash, and silica fume. The water-to-binder (w/b) ratio was kept at 0.27 for all trial mixes. OPC used in this study complies with ASTM C150 [24]. The total number of trial mixes is 16 including one control mix prepared with 100% OPC and 15 trial mixes in which OPC was partially replaced with industrial by-products in the range of 10% to 90%. Four of the 14 mixes were dedicated to study the effect of replacing OPC with GGBS (binary mix) in percentages of 10%, 20%, 30%, and 40%. GGBS used in this complies with BSI 6699:1992 [25]. In terms of reactivity, GGBS used in this study classifies as Grade 80 per ASTM C989 [26]. In the remaining 10 of the 14 SCC mixes, 90% of OPC was replaced with various combinations of GGBS, fly ash, and silica fume. Class F fly ash used in the study complies with ASTM C618 [27] and also complies with BS EN 450-1 [18]. The total SiO2 + Al2O3 + Fe2O3 = 95.67% far higher than the minimum of 70% indicated in ASTM C618 [27] for class F fly ash. Silica fume used in this study complies with ASTM C1240 [28]. Silica fume has an SiO2 content of 90.4%, greater than the minimum of 85% indicated in ASTM C1240 [28]. In the environmentally friendly mixes G1 to G10, GGBS ranged from 50% to 77.5% of the total binder content as shown in Table 1. This high replacement ratio supports the goal of recycling large amounts of slag while reaping their long-term benefits on the strength and durability of SCC. It was shown that mixes with GGBS as a partial replacement of OPC outperformed traditional concrete in terms of reduced shrinkage, lower creep, and lower permeability [1]. The total binder content for all of the 15 mixes was maintained at 624 kg/m3.
The mineral and oxide compositions of OPC and GGBS used in the experimental program were obtained using X-ray diffraction (XRD) analysis and are shown in Table 1. Similarly, the particle size distribution and intensity of OPC and GGBS are shown in Figure 1a,b. The amorphous nature of GGBS caused by the rapid cooling and granulation is clearly shown in Figure 1a as indicated by the hump between approximately 25° and 35°. The spikey profile of Figure 1b is indicative of the crystalline nature of OPC.
Crushed coarse aggregate for each of the 15 mixes is 888 kg/m3 and total fine aggregate content is 720 kg/m3, resulting in a ratio of fine aggregate (FA) to total aggregate (TA) of 0.45. The maximum aggregate size is 10 mm. The gradations of coarse and fine aggregates are shown in Figure 2a,b.
All mixes used a polycarboxylate-based superplasticizer produced and marketed by the BASF Corporation with dosage maintained at 1.388% by the weight of total binders for most mixes. In some mixes, the superplasticizer was increased to 1.506% in order to maintain flowability of 700 mm and stability of the SCC mixes. Flowability and stability were also controlled by using viscosity modifying admixture (VMA) ranging from 0.1 to 0.169 by weight of binders, depending on the mix. Superplasticizer and VMA dosages were within the manufacturer’s recommended limits and the appropriate dosages were selected by trial and error to achieve the desired flowability and stability.
2.1.2. Mixing Method and Fresh Properties
The mixing water is combined with 85% of the superplasticizer and the remaining 15% retained for separate usage. The mixes were prepared by initially mixing for two minutes the aggregates, sand, cement, desired amount of GGBS and, for G1 to G10, fly ash and silica fume were also added to the amounts shown in Table 2. After two minutes of mixing, one third of the total mixing water solution (includes the superplasticizer) is added to the mixer and mixing is continued for two additional minutes. The second third of the mixing water solution was added and mixing was continued for two more minutes. The last third of the mixing water solution was added and the mixing was continued for two minutes. After 8 min of mixing, the VMA and remaining 15% of the superplasticizer were added and mixing continued for two more minutes. After a total of 10 min of mixing, concrete is poured into molds to produce 150 × 150 × 150 mm cubes, 100 × 200 mm cylinders, and 150 × 300 mm cylinders. Samples were removed from moulds after 24 h and submerged into water until the compression test day. The compression test for cubes was done in accordance with BS EN 12390 [29].
Table 2 shows the 16 mixes tested for compressive strength including one control mix, 5 binary (OPC + GGBS) mixes, and 10 sustainable mixes (10% OPC + 90% SCMs). The 10 environmentally friendly mixes (G1 to G10) contain GGBS, silica fume, fly ash, and 10% OPC. The presence of fly ash and GGBS together in concrete reduces the total free shrinkage, despite the fact the GGBS increases autogenous shrinkage [30]. However, in order to decrease cracking potential due to restrained shrinkage in SCC mixing with high volume GGBS, extended moist curing beyond three days is recommended [31]. Mixes G8, G9, and G10 contain 70% or more GGBS, therefore, longer moist curing period of 7 days is recommended to enhance shrinkage cracking resistance. Silica fume was used in mixes G1 to G10 in the range of 2.5% to 20% due to its contribution to strength and durability. For instance, using up to 10% silica fume was reported to increase compressive strength of concrete exposed to aggressive 15% Na2SO4 solution compared to a control mix, a phenomenon attributed to the activation of pozzolanic activity of silica fume by sodium sulfate [32].
Binary mixes with GGBS greater than 10% exhibited some segregation or bleeding and was assigned a VSI greater than zero, therefore, required adjustments of the percentages of superplasticizer and VMA. This is consistent with the finding of Boukendakdji [33]. Environmentally friendly mix G3 which contains 20% silica fume also exhibited a higher viscosity and compared to mixes with lower contents of silica fume, as well as some segregation. In the remaining sustainable mixes, silica fume content was kept below 20% for the enhanced contribution to workability and strength. Increasing the amount of GGBS increased the flowability of the mix, therefore the amount of superplasticizer was adjusted to ensure appropriate spread was achieved while maintaining a stable mix. Mixes deemed unacceptable in terms of flowability or stability were discarded and the dosage of superplasticizer and VMA were increased/decreased as needed.
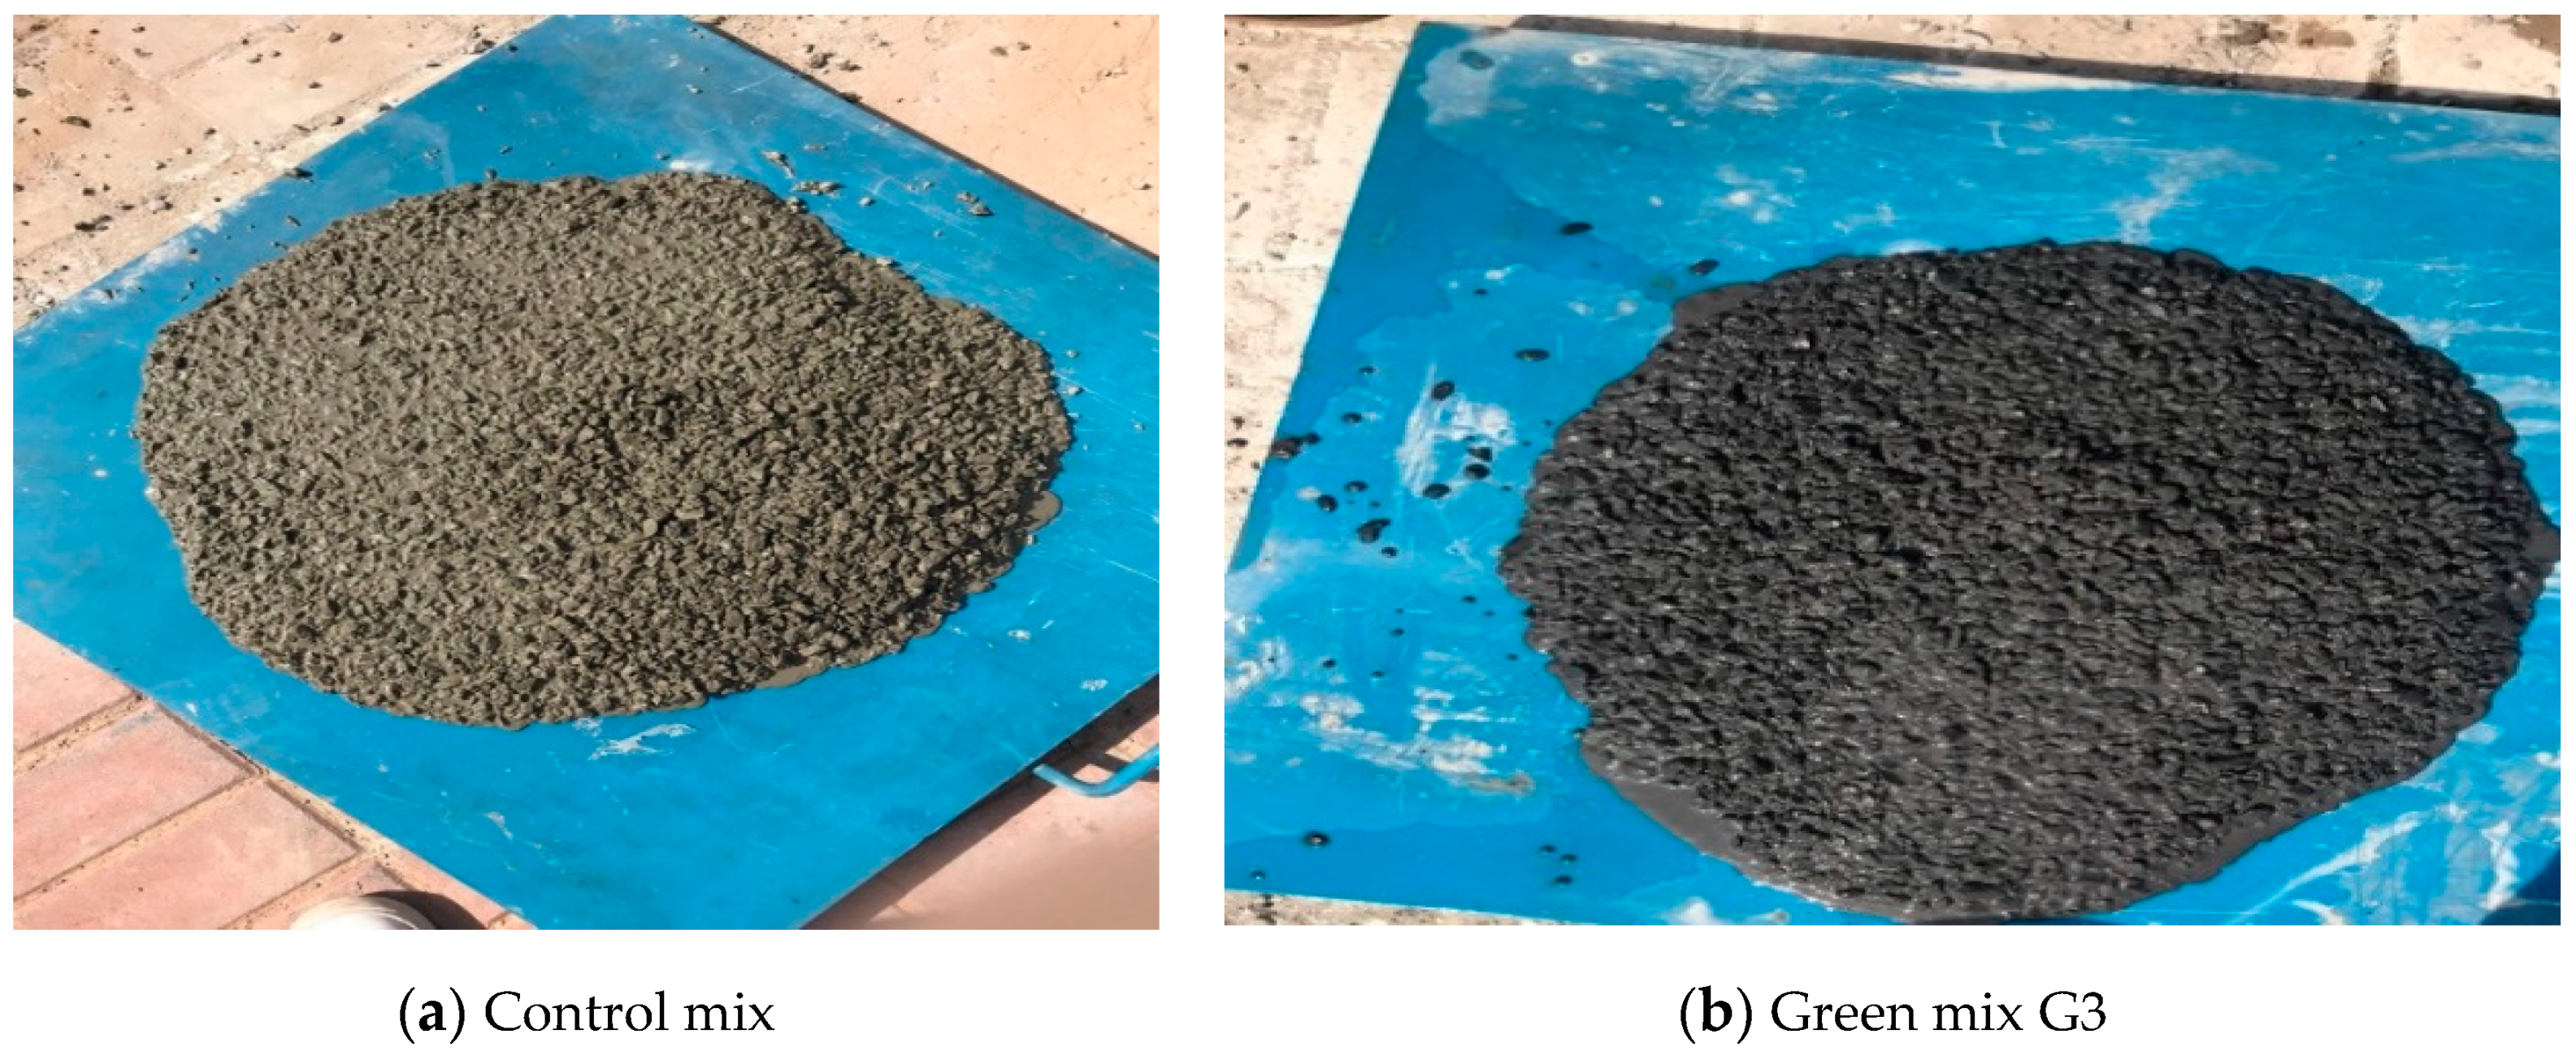
Figure 3a shows the slump-flow test result for the control mix (100% OPC) and Figure 3b shows the slump-flow result for the environmentally friendly mix G3. Mix G3 contains the highest silica fume content of 20% and developed the highest 56-day compressive strength amongst the sustainable mixes G1 to G10. However, consistent with the literature [33], G3 has the lowest flowability of the 10 sustainable mixes as indicated by the highest t50 time.
2.2. Effect of Curing Compounds on 28-day Compressive Strength of 90% Replacement Self-Consolidating Concrete
In this part of the study, a new set of 18 sustainable SCC mixes and two control mixes were developed to examine the effect of the curing method on the development of 28-day compressive strength. The sole binder for the two control mixes is OPC. The binder for the 18 sustainable SCC mixes consists of 10% OPC while the remaining 90% of the binder is a combination of GGBS in large amounts in addition to silica fume and fly ash [34]. The trial mixes were divided in two sets, one set consists of 9 sustainable concrete mixes along with one control mix developed with a w/b ratio of 0.36, while the second is similar to the first set but prepared using a lower w/b ratio of 0.33. The total number of samples tested in compression was 120 standard 150 mm × 150 mm × 150 mm cubes. The details of the mix constituents, test methods and fresh properties are reported by Mohamed and Najm (2019). Table 3 lists binder contents of the two sets of sustainable SCC mixes. The high content of GGBS (60% to 80%) is motivated by: 1) recycling the largest amount of this industrial by-product, and 2) GGBS enhances strength and durability of concrete significantly [10].
The purpose of the tests reported in this part of the paper is to examine the effect of curing method on the strength development of environmentally friendly SSC with high volume GGBS ranging from 60% to 80%. The three curing methods used in this study are summarized as follows.
Method 1: Concrete cubes are submerged under potable water in curing tanks under room temperature for 28 days, then tested in compression.
Method 2: Concrete cubes are submerged under water in curing tanks for three days then air-cured for 25 days under direct exposure to the sun outside of the laboratory. During the curing period, the temperature ranged from 31 °C at night to 44 °C during the day. This is a typical temperature range during the summer months in Abu Dhabi, UAE.
Method 3: After demoulding, acrylic-based curing was applied to concrete samples which were then left in the lab under room temperature until the compression test day. The curing compound is distributed under the commercial name MasterKure 181 and complies with ASTM C309 [18] Type 1 and class B (a resin translucent compound without dye).
3. Results and Discussion
3.1. Binary GGBS + OPC SCC Mixes
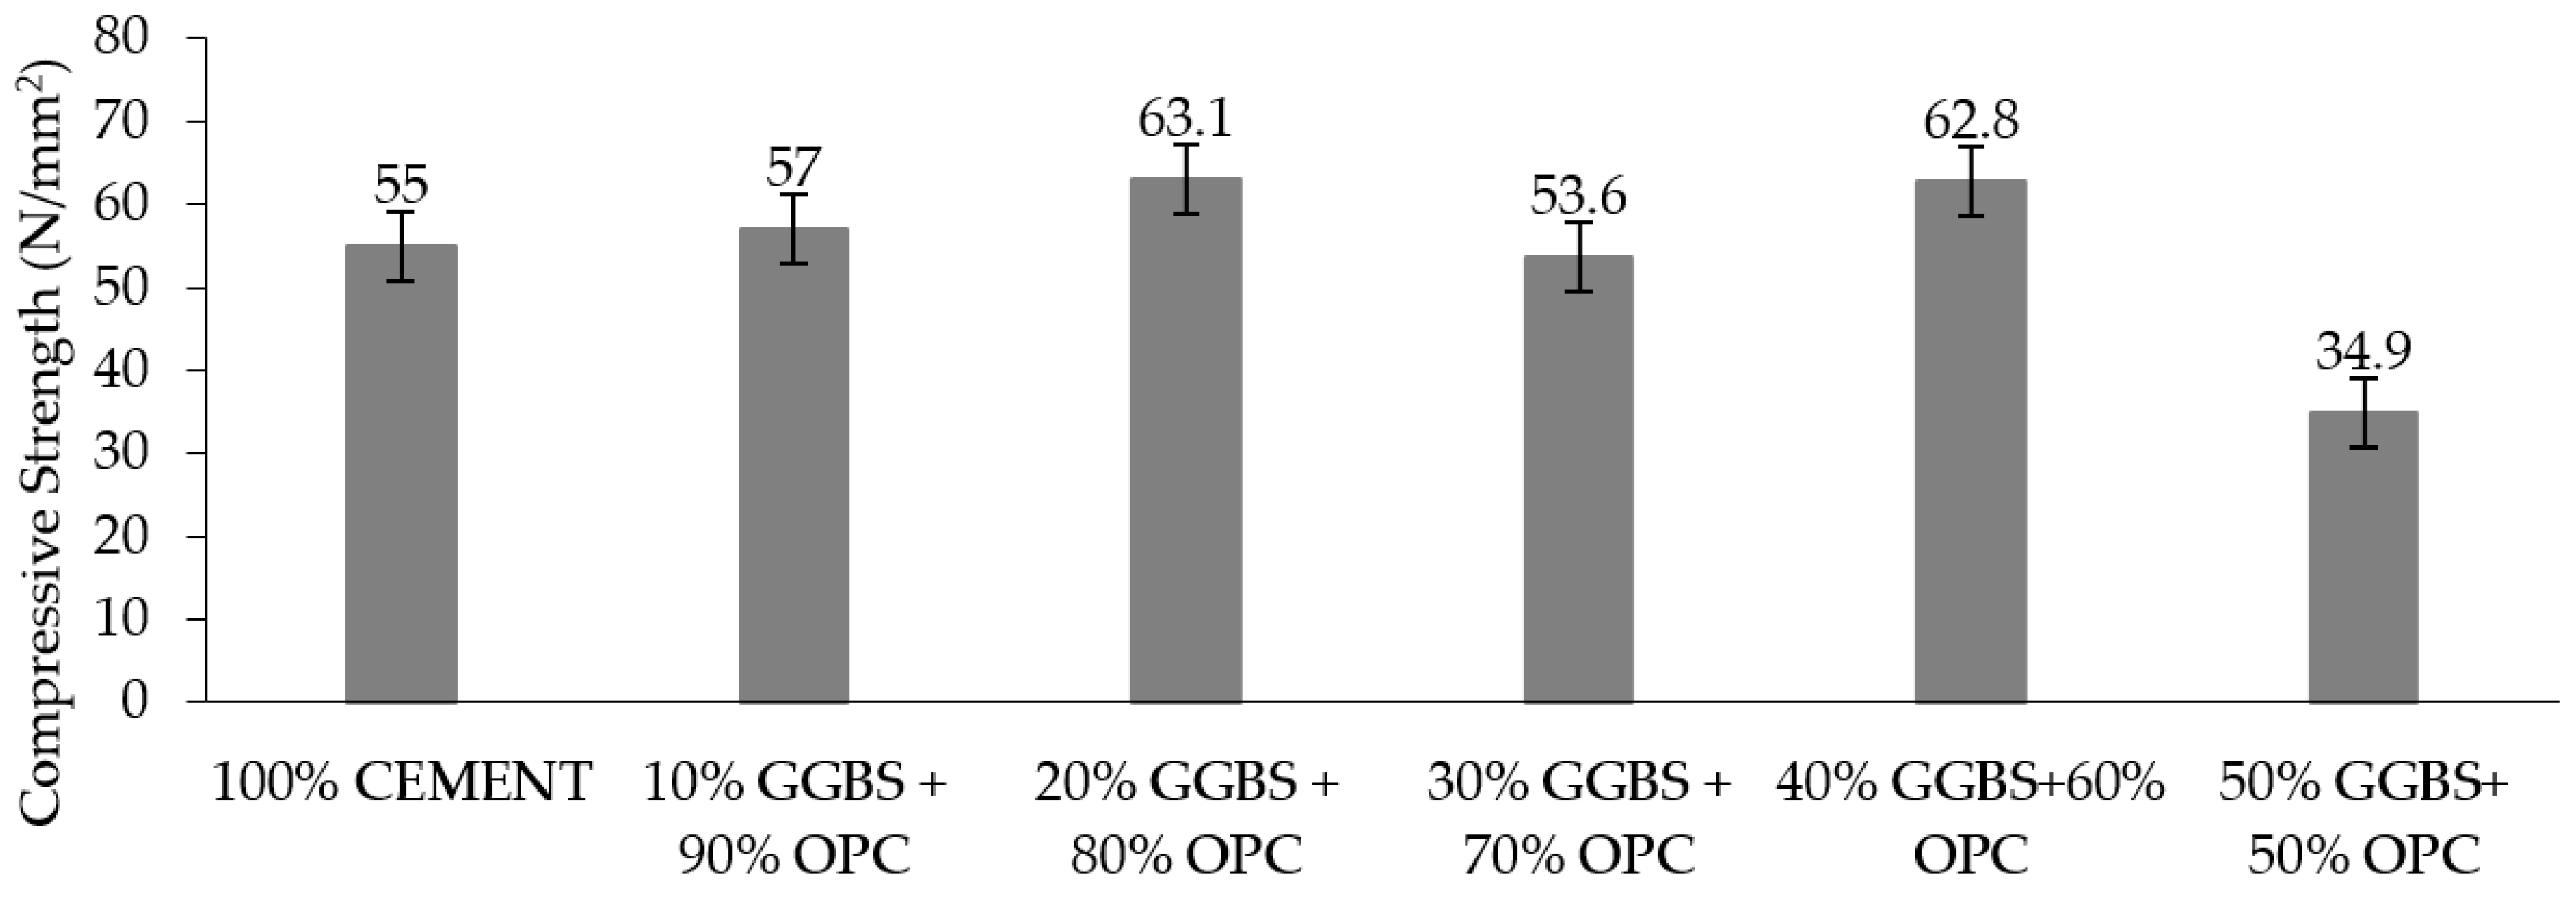
Binary GGBS/OPC mixes were tested to determine the compressive strength after 3, 7, 28, and 56 days of water curing. In addition to the control mix made with 100% OPC, five mixes were created in which OPC was replaced with GGBS with ratios of 10%, 20%, 30%, 40%, and 50%. Figure 4 shows the compressive strength after three days of water curing. The SCC mix with 20% GGBS surpassed the control mix reaching 63.1 MPa. It is worthy to note that the compressive strength of 30% GGBS and 70% OPC is inconsistent with the trend in Figure 5 and Figure 6 below in which 30% is noted to be approximately the optimum GGBS percentage for maximum compressive strength in binary mixes. Therefore, this value is likely to be human error.
After seven days of curing, the SCC mix with 30% GGBS and 70% OPC produced the highest compressive strength of 78.45 N/mm2 compared to all binary mixes, and higher the than the control mix as shown in Figure 5.
It is worthy to note that when the GGBS replacement ratio is low (10% or 20%), the effect on compressive strength compared to the control mix is minimal after 3, 7, or 28 days of curing. This is consistent with finding in the literature for 10% GGBS replacement ratio in a study that used a w/b ratio of 0.36 [1].
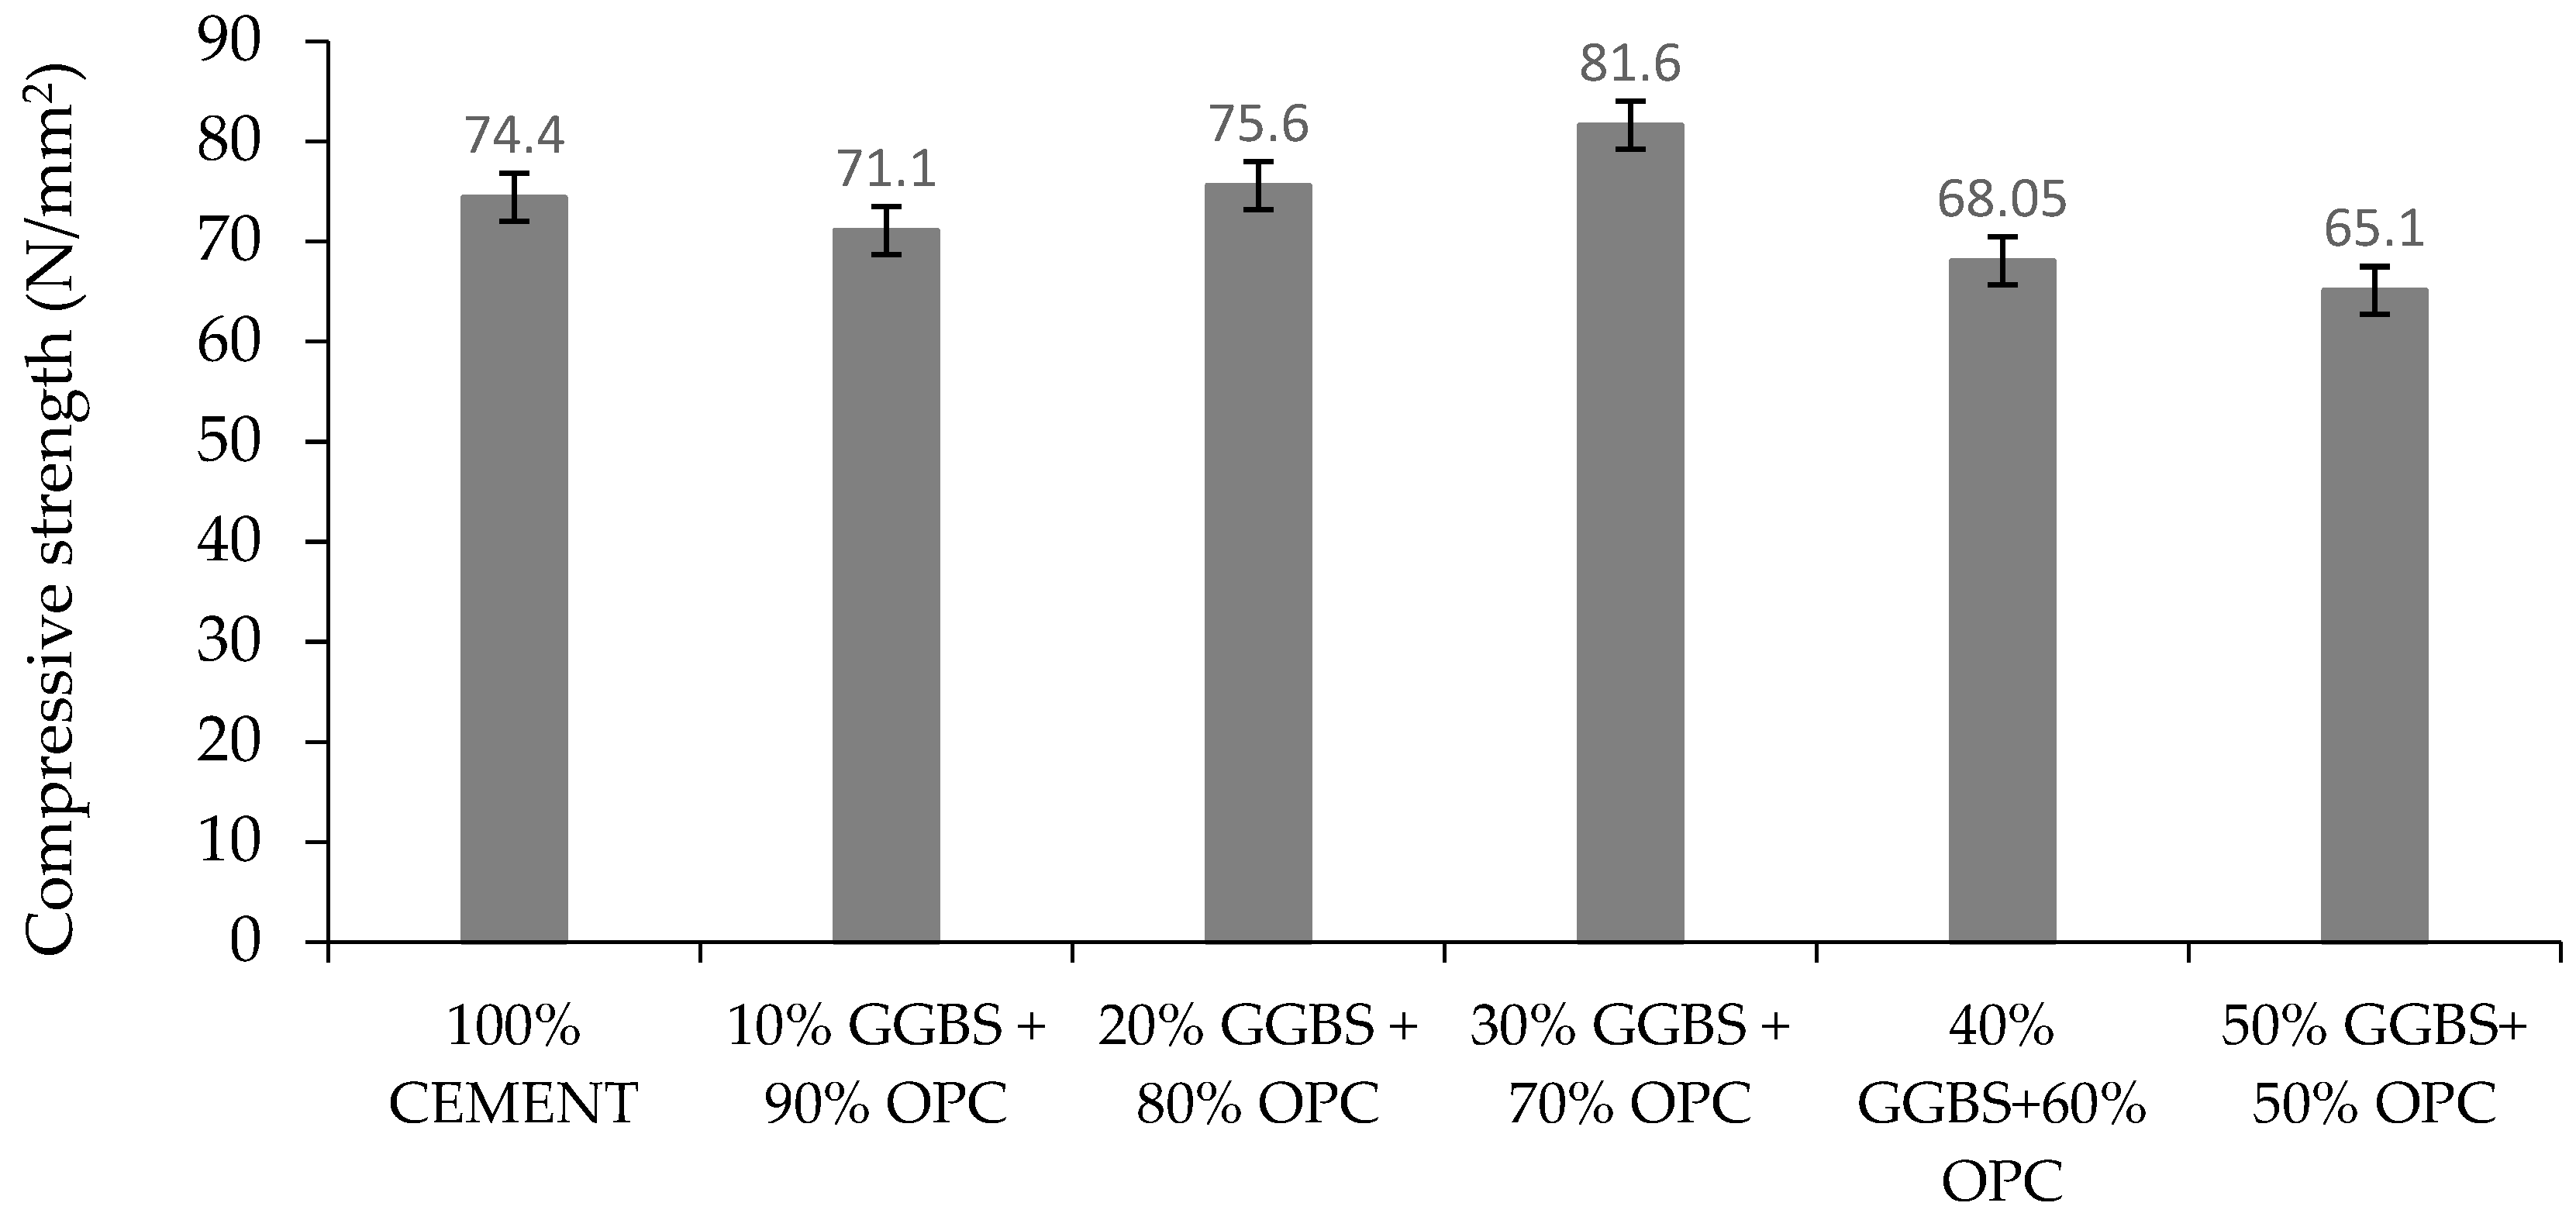
After 28 days of curing, the SCC mix with 30% GGBS and 70% OPC reached the highest compressive strength of 81.6 MPa compared to all binary mixes as well as the control mix. As shown in Figure 6, compressive strength increased with increase in GGBS replacement ratio until the optimum value of 30%, then the compressive strength decreased with further increase in replacement percentage. This is consistent with the findings of Mohamed and Najm [10] where 35% was the optimum GGBS replacement ratio, as the authors didn’t examine the 30% replacement ratio.
Figure 7 shows the effect of increased replacement ratio from 10% to 80% for SCC mixes at w/b ratio of 0.35 [10]. This likely due to the fact that GGBS will convert Ca(OH)2 produced by the hydration of OPC to form more C-S-H that is responsible for strength development [1]. The abundance of GGBS beyond the optimum value may mean that not enough Ca(OH)2 is produced by the hydration of OPC to be bound by GGBS to form C-S-H, due in part to a limitation in the percentage of OPC (10%).
The binary mix with 10% GGPS developed slightly lower compressive strength compared to the control mix after 56 days of curing as shown in Figure 8, which is similar to the behavior after 28 days of curing. The 30% GGPS replacement ratio remained the optimum value giving the highest 56-day compressive strength compared to the control mix. However, up to a 50% GGBS replacement percentage, the compressive strength is very close to the control mix prepared using 100% OPC.
Shape and Size Effects on Strength Development of Binary OPC+GGBS Concrete
In today’s international construction market, engineers may be supplied with compressive strength data for cubes or cylinders of various sizes permitted by various recognized testing standards. In order to evaluate the effect of sample size and shape on the strength development of binary OPC+GGBS concrete, additional standard cylindrical samples were prepared and tested in accordance with ASTM C39 [35]. Cylindrical sample sizes were 100 mm × 200 mm and 150 mm × 300 mm. Compressive strength is shown in Table 4 for the control mix, and mixes in which cement was partially replaced with 10%, 20%, 30%, 40%, and 50% GGBS. The total number of samples for all sample sizes and ages of curing is 90 cubes and cylinders. Each compressive strength value in Table 4 is the average of two cubes or cylinders.
Table 5 shows the ratio of the compressive strength of 150 × 300 mm cylinder to 150 mm cube. It can be seen that ratio of large cylinder (150 mm × 150 mm) strength the standard cube (150 mm) strength for the control mix ranges from 0.97 after 7 days of curing to 0.9 after 56 days of curing. The average of the binary mix increases mildly form 0.73 after 7 days of curing to 0.75 after 56 days of curing.
Table 5 also shows that the ratio of the compressive strength of a large cylinder to a small cylinder changes from 1.28 after 7 days of curing to 1.17 after 56 days of curing. The average of the binary (OPC + GGBS) mixes ranges from 1.15 after 7 days of curing to 0.92 after 56 days of curing. It is noted that the larger cylinders are stronger than the smaller cylinders for the control mix (100% OPC) and the 30% GGPS (70% OPC) mixes for all ages of curing. This is because these two mixes have generally the highest compressive strength of the binary (GGPS + OPC) mixes. This is consistent with the findings of Vandegrift and Schindler (2008) who concluded that at higher strength levels, larger cylinders may be stronger than small cylinders, while at lower strength levels smaller cylinders are stronger.
3.2. Environmentally-Friendly Low Cement Content SCC Mixes
Sustainable SCC mixes containing 10% OPC and 90% pozzolans increased in compressive strength from 3 days to 56 days of curing. In mixes G1 to G10, GGBS content ranged from 47.5% to 77.5%. Mixes with such a high GGBS content were shown to exhibit very high resistance to chloride penetration even after one day of curing [35]. Similarly, quaternary mixes containing 20% OPC and 80% SCMs (GGBS, silica fume, and fly ash) were shown to have very high resistance to chloride penetration [36]. Figure 9 shows that both 100% OPC concrete and 10% OPC mix increased in compressive strength but the ratio of 100% OPC concrete to the 10% OPC concrete decreased from 1.77 after three days of curing to 1.36 after 56 days days of curing. Further, 10% OPC mixes (G1 to G10) developed a competitive average compressive strength of 51.4 MPa after 28-days of curing, which is suitable for many practical applications. The 90% cement replacement is a combination of GGBS, silica fume, and fly ash which contributed to the competitive compressive strength of 51.55 MPa. Elchalakani et al. [37] developed a 10% OPC (90% GGBS) concrete mix using recycled aggregates and achieved a 28-day compressive strength of 30.5 MPa at a w/b ratio of 0.37.
Table 6 shows the strength development after 3, 7, 28, and 56 days of curing for the environmentally friendly mixes which contain 10% OPC and 90% SCMs with high volume GGBS ranging from 47.5% to 77.5%. The 28-day strength range was from 41.55 MPa to 58.25 MPa, which is suitable for many professional practice applications.
Sustainable mix G1 contains 40% fly ash, 47.5% GGBS, 2.5% silica fume, and 10% OPC. This mix developed the lowest 3-day compressive strength, mostly due to the large amount of fly ash (40%) but the mix developed the second highest compressive strength (61.1 MPa) after 56 days of curing. The pozzolanic reaction due to the 2.5% silica fume is likely to tail off early while the 40% fly ash along with the relatively high GGBS content continues the reaction beyond 28 days. SCC mixes containing a high volume of fly ash are generally durable and demonstrated a high resistance to weight loss caused by sulfate attack [38].
Mixes with fly ash content greater than 20%, such as G1, G2, G4, and G5 developed 28-day compressive strengths between 39.95 MPa to 49.9 MPa which are on a lower range amongst the 10 environmentally friendly mixes. G2 concrete, despite the relatively high fly ash content (25%) developed the highest 28-day compressive strength of 49.9 MPa in this group (G1, G2, G4, and G5), possibly due to the optimum amount of silica fume (15%). In binary mixes OPC + silica fume concrete prepared at a w/b of 0.35, 15% was found to be the optimum OPC replacement ratio by silica fume for the highest compressive strength [10,39,40,41].
Sustainable mix G3 developed a high 28-day compressive strength of 51.9 MPa and continued to develop the highest compressive strength of 71.6 MPa of all of the sustainable mixes after 56-days of curing. This may be attributed to the following: (1) it is in the low slag content group (G1, G2, G3), consistent with the fact that the higher the slag content above optimum value of 35%, the lower the 28-day compressive strength [10], and (2) the fly ash content (20%) is the optimum value, and (3) the high silica fume content (20%) which was shown to enhance compressive strength in ternary mixes [42]. Drying shrinkage decreases with increase in replacement ratio of OPC with silica fume, up to 25% [43].
However, in ternary and quaternary SCC mixes, the prediction of compressive strength based on the percentages of the contents of SCMs requires further experimental and analytical studies [44].
Mix G4 has higher fly ash content (30%) compared to G3 and lower silica fume (2.5%). Lower silica fume content and high fly ash content together resulted in lower 28-day compressive strength of 44.25 MPa for G4 after 28 days of compared to G3. Jawahar et al. [45] reported a 28-day compressive 32.26 MPa for SCC mix with 30% fly ash replacement of OPC using w/b of 0.36 (higher than w/b of 0.27 used in this study). Therefore, the use of quaternary mix in this study by including silica fume and slag led to reducing both the use of OPC and the competitive compressive strength.
The competitive compressive strength of the environmentally friendly mixes after 28 and 56 days of curing was primarily due to the quaternary mix constituents complementing each other, where silica fume supports short-term strength development while fly ash and GGBS support long term strength development. Wongkeo et al. [46] demonstrated that combining silica fume and fly ash to partially replace OPC produced a higher compressive strength compared to replacing OPC with fly ash alone for the same replacement ratios (50%, 60%, and 70%).
3.3. Influence of Curing Method on 28-Day Compressive Strength of Sustainable Self-Consolidating Concrete
This section discusses the effect of curing method on development of 28-day compressive strength of 150 mm cubic samples. Figure 10 and Figure 11 show the compressive strength of samples cured using three curing methods and prepared using w/b of 0.36 and 0.33, respectively. The curing method had a limited effect on the magnitude of 28-day compressive strength of the control mixes (G1 and G2), for both w/b ratios. However, for all sustainable SCC mixes, Figure 10 and Figure 11 show that, air-curing leads to the highest 28-day compressive strength. This may be due to the higher curing temperature of air-curing samples compared to lab-cured samples. It may also be due to the higher moisture content of the samples cured under water, which may lead to decrease in compressive strength. The Fib Model Code for Concrete Structures [47] recognizes the effect of curing temperature and concrete age on development of compressive strength. The compressive strength of concrete, fcm(t), at various ages is given by Equation (3):
where the concrete grade dependent coefficient s = 0.25 for fcm < 60 MPa (grade 42.5 N).
fcm(t) = βcc(t) · fcm
βcc(t) = exp(s · [1 − (28/t)0.5])
The adjusted curing age, Δti, taking into account the effect of curing temperature is given by
tT = Δti · exp[13.65 − 4000/(273 + T(Δti))]
The average temperature of sun cured samples T(Δti) = 37.5°C for a duration of Δti = 25 days, gives the adjusted concrete age as tT = 53.86 days. This gives the coefficient βcc(t) = 1.072. Therefore, sun-curing is expected to result in compressive strength that is approximately 7.2% higher than lab curing. While both Figure 10 and Figure 11 show higher compressive for sun-cured samples compared to samples curing in the laboratory, the percentage increase varies widely, depending on mix constituents.
Furthermore, the highest 28-day compressive strength of all sustainable mixes and curing methods occurred in samples cured under the sun and contained 12.5% and 15% micro-silica (G1.4, G1.5, G2.4, and G2.5). The 15% optimum silica fume replacement percentage was also observed to develop the maximum 28-day compressive strength in binary OPC/silica fume mixes [10]. Figure 10 and Figure 11 confirm that samples cured using membrane-forming acrylic compound produces higher compressive strength compared to samples cured under water bath.
4. Conclusions
Environmentally friendly self-consolidating concrete (SCC) mixes were developed with a low w/b ratio using only 10% ordinary portland cement (OPC) and 90% recycled industrial by-products including fly ash, silica fume, and GGBS. The SCC mixes recycle larger amounts of GGBS (45.5% to 77.5%) in addition to smaller amounts of fly ash and silica fume at smaller percentages. The following observations were made through the experimental program:
- The compressive strength of binary GGBS + OPC surpassed the compressive strength of control mix (100% OPC) when 30% of OPC is replaced with GGBS, after 7, 28, and 56 days of water curing. The 28-day compressive strength of the binary mix with 30% GGBS reached 81.6 MPa compared to 76.75 MPa for the control mix (100% OPC).
- For the control mix, the ratio of compressive strength of 150 mm × 300 mm cylinders to 150 mm cubes was high, ranging from 0.97 for samples tested after 7 days of water curing to 0.91 for samples tested after 56 days of curing. In contrast, the ratio of compressive strength of large cylinders to smaller cylinders (100 mm × 200 mm) was higher and ranged from 1.28 after 7 days of curing to 1.17 after 56 days of curing. Therefore, for high compressive strength, the ratio strength of cylinders to cubes remains lower than 1.0. However, the strength of large cylinders compared to smaller cylinders is higher than 1.0 for high strength, and lower than 1.0 for lower strength.
- Compressive strength development in quaternary mixes containing 10% OPC and 90% supplementary cementitious materials (SCM) is sensitive to variations in the amount of constituent pozzolanic materials. The 28-day compressive strength for these environmentally friendly mixes ranged from 41.25 MPa to 58.25 MPa, depending on the amounts of GGBS, fly ash, and silica fume. The 56-day compressive strength ranged from 43.75 MPa to 71.6 MPa.
- Air curing of sustainable concrete by exposure to direct sun (after three days of water curing) produces the highest 28-day compressive strength compared to curing using membrane-forming curing compound and submerging concrete samples in water. A favourable temperature outside the lab helped to accelerate 28-day compressive strength.
- Sustainable concrete cured using membrane-forming acrylic-based curing compound exhibited relatively higher 28-day compressive strength compared to continuous submerging of concrete samples under water for 28 days.
- Air-cured cubes achieved the highest compressive strength (76 MPa) compared to water curing, and compared to curing using a chemical compound. The high compressive strength of air-cured samples occurred in concrete mixes containing high GGBS contents of 72.5% (G2.4) or 70% (G1.4) GGBS along with 12.5% (G2.4) or 15% (G1.4) silica fume.
Author Contributions
Conceptualization, O.A.M.; validation, O.A.M.; formal analysis, O.A.M.; investigation, O.A.M.; data curation, O.A.M.; writing—O.A.M.; writing—review and editing, O.A.M.; visualization, O.A.M.; supervision, O.A.M.; project administration, O.A.M.; funding acquisition, O.A.M.
Funding
This research was funded by Abu Dhabi Department of Education and Knowledge (ADEK) Award for Research Excellence–AARE 2017, AARE17-204. Additional funds were provided by the Office of Research and Sponsored Programs (ORSP) at Abu Dhabi University, grant # 19300290.
Acknowledgments
The author appreciate the support of Janette Laconsay who created the figures and organized the manuscript.
Conflicts of Interest
The authors declare no conflict of interest.
References
- Gedam, B.N.; Bhandari, N.M.; Upadhyay, A. Influence of Supplementary Cementitious Materials on Shrinkage, Creep, and Durability of High-Performance Concrete. J. Mater. Civ. Eng. 2016, 28. [Google Scholar] [CrossRef]
- Hogan, F.; Meusel, J. Evaluation for Durability and Strength Development of a Ground Granulated Blast Furnace Slag. Cem. Concr. Aggreg. 1981, 3, 40–52. [Google Scholar] [CrossRef]
- Li, G.; Zhang, A.; Song, Z.; Liu, S.; Zhang, J. Ground granulated blast furnace slag effect on the durability of ternary cementitious system exposed to combined attack of chloride and sulfate. Constr. Build. Mater. 2018, 158, 640–648. [Google Scholar]
- Beglarigale, A.; Yazici, H. Mitigation of detrimental effects of alkali-Silica reaction in cement-based composites by combination of steel microfibers and ground-granulated blast-Furnace slag. J. Mater. Civ. Eng. 2014. [Google Scholar] [CrossRef]
- Mohamed, O.A.M.; Rens, K.L.; Salnaker, J.J. Time effect of alkali-aggregate reaction on performance of concrete. J. Mater. Civ. Eng. 2001, 13, 143–151. [Google Scholar] [CrossRef]
- Sengul, O.; Tasdemir, M.A. Compressive Strength and Rapid Chloride Permeability of Concretes with Ground Fly Ash and Slag. J. Mater. Civ. Eng. 2009, 21, 494–501. [Google Scholar] [CrossRef]
- Thomas, M.D.A.; Hooton, R.D.; Scott, A.; Zibara, H. The effect of supplementary cementitious materials on chloride binding in hardened cement paste. Cem. Concr. Res. 2012, 42, 1–7. [Google Scholar] [CrossRef]
- Ramakrishnan, K.; Pugazhmani, G.; Sripragadeesh, R.; Muthu, D.; Venkatasubramanian, C. Experimental study on the mechanical and durability properties of concrete with waste glass powder and ground granulated blast furnace slag as supplementary cementitious materials. Constr. Build. Mater. 2017, 156, 739–749. [Google Scholar] [CrossRef]
- Li, Q.; Li, Z.; Yuan, G. Effects of elevated temperatures on properties of concrete containing ground granulated blast furnace slag as cementitious material. Constr. Build. Mater. 2012, 35, 687–692. [Google Scholar] [CrossRef]
- Mohamed, O.A.M.; Najm, O. Compressive strength and stability of sustainable self-consolidating concrete containing fly ash, silica fume, and GGBS. Front. Struct. Civ. Eng. 2017, 11, 406–411. [Google Scholar] [CrossRef]
- Mansoor, J.; Shah, S.A.R.; Khan, M.M.; Sadiq, A.N.; Anwar, M.K.; Siddiq, M.U.; Ahmad, H. Analysis of Mechanical Properties of Self Compacted Concrete by Partial Replacement of Cement with Industrial Wastes under Elevated Temperature. Appl. Sci. 2018, 8, 364. [Google Scholar]
- Dadsetan, S.; Bai, J. Mechanical and microstructural properties of self-compacting concrete blended with metakaolin, ground granulated blast-furnace slag and fly ash. Constr. Build. Mater. 2017, 146, 658–667. [Google Scholar] [CrossRef]
- Majhi, R.K.; Nayak, A.N.; Mukharjee, B.B. Development of sustainable concrete using recycled coarse aggregate and ground granulated blast furnace slag. Constr. Build. Mater. 2018, 159, 417–430. [Google Scholar] [CrossRef]
- Dinakar, P.; Sethy, K.P.; Sahoo, U.C. Design of self-compacting concrete with ground granulated blast furnace slag. Mater. Des. 2013, 43, 161–169. [Google Scholar] [CrossRef]
- Mohamed, O.A.M.; Najm, O. Effect of Curing Methods on Compressive Strength of Sustainable Self Consolidated Concrete. IOP Conf. Ser. Mater. Sci. Eng. 2019. [Google Scholar] [CrossRef]
- Xue, B.; Pei, J.; Sheng, Y.; Li, R. Effect of curing compounds on the properties and microstructure of cement concretes. Constr. Build. Mater. 2015, 101, 410–416. [Google Scholar] [CrossRef]
- ACI 301-16. Specifications for Structural Concrete; ACI Committee 301: Farmington Hills, MI, USA, 2016. [Google Scholar]
- ASTM International. ASTM C309/Liquid Membrane-Forming Compounds for Curing Concrete; ASTM International: West Conshohocken, PA, USA, 2011. [Google Scholar]
- Surana, S.; Pillai, R.; Santhanam, M. Performance evaluation of curing compunds using durability parameters. Constr. Build. Mater. 2017, 148, 538–547. [Google Scholar] [CrossRef]
- Ibrahim, M.; Shameem, M.; Al-mehthel, M.; Maslehuddin, M. Effect of curing methods on strength and durability of concrete under hot weather conditions. Cem. Concr. Compos. 2013, 41, 60–69. [Google Scholar] [CrossRef]
- Nahata, Y.; Kholia, N.; Tank, T.G. Effect of Curing Methods on Efficiency of Curing of Cement Mortar. Int. Conf. Chem. Biol. Environ. Eng. 2014, 9, 222–229. [Google Scholar] [CrossRef]
- Al-Gahtani, A.S. Effect of curing methods on the properties of plain and blended cement concretes. Constr. Build. Mater. 2010, 24, 308–314. [Google Scholar] [CrossRef]
- Xu, G.; Tian, Q.; Miao, J.; Liu, J. Early-age hydration and mechanical properties of high volume slag and fly ash concrete at different curing temperatures. Constr. Build. Mater. 2017, 149, 367–377. [Google Scholar] [CrossRef]
- ASTM C150/C150M. Standard Specification for Portland Cement; ASTM International: West Conshohocken, PA, USA, 2017. [Google Scholar]
- BSI 6699:1992. Specification for Ground Granulated Blast-Furnace Slag for Use with Portland Cement; British Standards Institution: London, UK, 1992. [Google Scholar]
- ASTM C989/C989M-18. Standard Specification for Slag Cement for Use in Concrete and Mortars; ASTM International: West Conshohocken, PA, USA, 2018. [Google Scholar]
- ASTM C618-17a. Standard Specification for Coal Fly Ash and Raw or Calcined Natural Pozzolan for Use in Concrete; ASTM International: West Conshohocken, PA, USA, 2017. [Google Scholar]
- ASTM C1240-15. Standard Specification for Silica Fume Used in Cementitious Mixtures; ASTM International: West Conshohocken, PA, USA, 2015. [Google Scholar]
- BS EN 12390-3:2009. Testing Hardened Concrete Part 3. Compressive Strength of Test Specimens; British Standards Institution: London, UK, 2009. [Google Scholar]
- Zhao, Y.; Gong, J.; Zhao, S. Experimental study on shrinkage of HPC containing fly ash and ground granulated blast-furnace slag. Constr. Build. Mater. 2017, 155, 145–153. [Google Scholar] [CrossRef]
- Altoubat, S.; Badran, D.; Junaid, M.T.; Leblouba, M. Restrained shrinkage behavior of Self-Compacting Concrete containing ground-granulated blast-furnace slag. Constr. Build. Mater. 2016, 129, 98–105. [Google Scholar] [CrossRef]
- Williams, M.; Ortega, J.M.; Sanchez, I.; Cabeza, M.; Climent, M.A. Non-Destructive Study of the Microstructural Effects of Sodium and Magnesium Sulphate Attack on Mortars Containing Silica Fume Using Impedance Spectroscopy. Appl. Sci. 2017, 7, 648. [Google Scholar] [CrossRef]
- Boukendakdji, O.; Kadri, E.; Kenai, S. Effects of granulated blast furnace slag and superplasticizer type on the fresh properties and compressive strength of self-compacting concrete. J. Cem. Concr. Compos. 2012, 34, 583–590. [Google Scholar] [CrossRef]
- Yehia, S.; Farrag, S.; Helal, K.; El-Kalie, S. Effects of Fly Ash, Silica Fume, and Ground-Granulated Blast Slag on Properties of Self-Compacting High Strength Lightweight Concrete. J. Eng. Technol. 2015, 3, 22–30. [Google Scholar]
- ASTM C39/C39M-18. Standard Test Method for Compressive Strength of Cylindrical Concrete Specimens; ASTM International: West Conshohocken, PA, USA, 2018. [Google Scholar]
- Mohamed, O. Durability and Compressive Strength of High Cement Replacement Ratio Self-Consolidating Concrete. Buildings 2018, 8, 153. [Google Scholar] [CrossRef]
- Elchalakani, M.; Basarir, H.; Karrech, K. Green Concrete with High-Volume Fly Ash and Slag with Recycled Aggregate and Recycled Water to Build Future Sustainable Cities. J. Mater. Civ. Eng. 2016, 29, 04016219. [Google Scholar] [CrossRef]
- Dinakar, P.; Babu, K.G.; Santhanam, M. Durability properties of high volume fly ash self-compacting concretes. Cem. Concr. Compos. 2008, 30, 880–886. [Google Scholar] [CrossRef]
- Bingol, A.F.; Tohumcu, I. Effects of different curing regimes on the compressive strength properties of self-compacting concrete incorporating fly ash and silica fume. Mater. Des. 2013, 51, 12–18. [Google Scholar] [CrossRef]
- Mohamed, H.A. Effect of fly ash and silica fume on compressive strength of self-compacting concrete under different curing conditions. Ain Shams Eng. J. 2011, 2, 79–86. [Google Scholar] [CrossRef]
- Turk, K.; Mehmet Karatas, M.; Gonen, T. Effect of Fly Ash and Silica Fume on Compressive Strength, Sorptivity and Carbonation of SCC. KSCE J. Civ. Eng. 2013, 17, 202–209. [Google Scholar] [CrossRef]
- Wongkeo, W.; Thongsanitgarn, P.; Chaipanich, A. Compressive strength and drying shrinkage of fly ash-bottom ash-silica fume multi-blended cement mortars. Mater. Des. 2012, 36, 655–662. [Google Scholar] [CrossRef]
- Hassan, A.A.A.; Lachemi, M.; Hossain, K.M.A. Effect of metakaolin and silica fume on the durability of self-consolidating concrete. Cem. Concr. Compos. 2012, 34, 801–807. [Google Scholar] [CrossRef]
- Raharjo, D.; Subakti, A.; Tavio. Mixed Concrete Optimization Using Fly Ash, Silica Fume and Iron Slag on the SCC’s compressive strength. Procedia Eng. 2013, 54, 827–839. [Google Scholar] [CrossRef]
- Jawahar, J.G.; Sashidhar, C.; Reddy, I.V.R.; Peter, J.A. Micro and macrolevel properties of fly ash blended self-compacting concrete. Mater. Des. 2013, 46, 696–705. [Google Scholar] [CrossRef]
- Wongkeo, W.; Thongsanitgarn, P.; Ngamjarurojana, A.; Chaipanich, A. Compressive strength and chloride resistance of self-compacting concrete containing high level fly ash and silica fume. Mater. Des. 2014, 64, 261–269. [Google Scholar] [CrossRef]
- International Federation for Structural Concrete (fib). Fib Model Code for Concrete Structures—MC2010; International Federation for Structural Concrete (fib): Lausanne, Switzerland, 2010. [Google Scholar]
Figure 1.
(a) particle size distribution of OPC and GGBS, (b) intensity and profile of GGBS. Compared to OPC.
Figure 1.
(a) particle size distribution of OPC and GGBS, (b) intensity and profile of GGBS. Compared to OPC.

Figure 2.
(a) gradation of coarse aggregates, (b) gradation of fine aggregates.

Figure 3.
Stability of SCC mixes and assessment of VSI.

Figure 4.
Compressive strength of binary OPC-GGBS SCC mixes after 3-days of curing.

Figure 5.
Compressive strength of binary GGBS-OPC SCC mixes after 7-days of curing.

Figure 6.
Compressive strength of binary GGBS+OPC SCC mixes after 28-days of curing.

Figure 7.
Effect of replacing up to 80% of OPC with GGBS on 28-day compressive strength [10].
Figure 7.
Effect of replacing up to 80% of OPC with GGBS on 28-day compressive strength [10].

Figure 8.
Compressive strength of binary GGBS+OPC SCC mixes after 56 days of curing.

Figure 9.
Compressive strength of control mix and sustainable 10% OPC mix.

Figure 10.
Results for 0.36 w/b ratios.

Figure 11.
Results for 0.36 w/b ratios.


Table 1.
Chemical constituents of Ordinary Portland Cement (OPC) and GGBS.
| SiO2 | Al2O3 | Fe2O3 | CaO | MgO | SO3 | Na2O | K2O | TiO2 | P2O5 | ZnO | Mn2O3 | Cl | |
|---|---|---|---|---|---|---|---|---|---|---|---|---|---|
| OPC | 19.58 | 4.23 | 3.56 | 65.92 | 1.00 | 4.32 | 0.21 | 0.67 | 0.24 | 0.12 | 0.02 | 0.08 | 0.05 |
| GGBS | 35.60 | 13.19 | 1.13 | 42.44 | 3.76 | 1.70 | 0.91 | 0.41 | 0.52 | 0.10 | 0.00 | 0.24 | 0.01 |
Table 2.
Amounts of mix constituents and visual stability index observed for each mix.
| MIX | CEMENT (%) | FLY ASH (%) | SILICA FUME (%) | GGBS (%) | VSI (0-3) |
|---|---|---|---|---|---|
| Control | 100 | 0 | 0 | 0 | 0 |
| 90% OPC + 10% GGBS | 90 | 0 | 0 | 10 | 0 |
| 80% OPC + 20% GGBS | 80 | 0 | 0 | 20 | 2 |
| 70% OPC + 30% GGBS | 70 | 0 | 0 | 30 | 1 |
| 50% OPC + 50% GGBS | 50 | 0 | 0 | 50 | 2 |
| G1 | 10 | 40 | 2.5 | 47.5 | 1 |
| G2 | 10 | 25 | 15 | 50 | 0 |
| G3 | 10 | 20 | 20 | 50 | 0 |
| G4 | 10 | 30 | 2.5 | 57.5 | 1 |
| G5 | 10 | 25 | 5 | 60 | 1 |
| G6 | 10 | 20 | 10 | 60 | 1 |
| G7 | 10 | 20 | 5 | 65 | 0 |
| G8 | 10 | 10 | 10 | 70 | 0 |
| G9 | 10 | 10 | 5 | 75 | 0 |
| G10 | 10 | 10 | 2.5 | 77.5 | 0 |
Table 3.
Green SCC Mixes [Mohamed and Najm 2019].
| w/b = 0.36 | w/b = 0.33 | ||||||||||
|---|---|---|---|---|---|---|---|---|---|---|---|
| No. | Name | Cement % | Fly Ash % | Micro Silica % | GGBS % | No. | Name | Cement % | Fly ash % | Micro Silica % | GGBS % |
| 1 | G1 | 100 | 0 | 0 | 0 | 11 | G2.0 | 100 | 0 | 0 | 0 |
| 2 | G1.1 | 10 | 5 | 5 | 80 | 12 | G2.1 | 10 | 5 | 5 | 80 |
| 3 | G1.2 | 10 | 5 | 7.5 | 77.5 | 13 | G2.2 | 10 | 5 | 7.5 | 77.5 |
| 4 | G1.3 | 10 | 5 | 10 | 75 | 14 | G2.3 | 10 | 5 | 10 | 75 |
| 5 | G1.4 | 10 | 5 | 12.5 | 72.5 | 15 | G2.4 | 10 | 5 | 12.5 | 72.5 |
| 6 | G1.5 | 10 | 5 | 15 | 70 | 16 | G2.5 | 10 | 5 | 15 | 70 |
| 7 | G1.6 | 10 | 10 | 5 | 75 | 17 | G2.6 | 10 | 10 | 5 | 75 |
| 8 | G1.7 | 10 | 15 | 5 | 70 | 18 | G2.7 | 10 | 15 | 5 | 70 |
| 9 | G1.8 | 10 | 20 | 5 | 65 | 19 | G2.8 | 10 | 20 | 5 | 65 |
| 10 | G1.9 | 10 | 25 | 5 | 60 | 20 | G2.9 | 10 | 25 | 5 | 60 |
Table 4.
Compressive Strength (quantity between parenthesis is the coefficient of variation (%)).
| Compressive Strength (MPa) | |||||||||
|---|---|---|---|---|---|---|---|---|---|
| 7 Days of Curing | 28 Days of Curing | 56 Days of Curing | |||||||
| 150 mm Cubes | 100 mm × 200 mm Cylinders | 150 mm × 300 mm Cylinders | 150 mm Cubes | 100 mm × 200 mm Cylinders | 150 mm × 300 mm Cylinders | 150 mm Cubes | 100 mm × 200 mm Cylinders | 150 mm × 300 mm Cylinders | |
| Control (100% OPC) | 68.1 (1.66) | 51.6 (4.38) | 65.8 (4.72) | 74.4 (0.76) | 54.3 (11.46) | 67.85 (0.14) | 76.75 (1.01) | 58.45 (0.84) | 68.6 (4.94) |
| 10% GGPS | 70.3 (0) | 59.9 (0) | 50.6 (4.75) | 71.1 (3.77) | 61.7 (4.58) | 56.1 (3.78) | 72.65 (2.62) | 65.8 (4.29) | 57.25 (5.06) |
| 20% GGPS | 70.15 (9.17) | 43.2 (0) | 48.4 (3.21) | 75.6 (0) | 57.9 (10.01) | 50 (0) | 76.55 (1.01) | 58.2 (13.61) | 54.95 (2.96) |
| 30% GGPS | 78.45 (6.21) | 32.1 (1.76) | 46.8 (5.13) | 81.6 (0.69) | 45.25 (3.28) | 51.05 (9.28) | 82.25 (1.46) | 48.8 (0) | 52.55 (0.67) |
| 50% GGPS | 63.75 (7.65) | 44.4 (1.59) | 42.9 (4.94) | 65.1 (0.86) | 57.55 (2.08) | 45.2 (12.82) | 74.5 (1.32) | 68.6 (0) | 46.35 (11.75) |
Table 5.
Ratio of compressive strength of different sample size after 7-, 28-, and 56-days of curing.
Table 5.
Ratio of compressive strength of different sample size after 7-, 28-, and 56-days of curing.
| Item | Ratio 150 × 300 mm Cylinders/150 mm Cubes | Ratio of 150 × 300 mm/100 × 200 Cylinders | ||||
|---|---|---|---|---|---|---|
| 7 days | 28 days | 56 days | 7 days | 28 days | 56 days | |
| Control | 0.97 | 0.91 | 0.9 | 1.28 | 1.25 | 1.17 |
| 10% GGPS | 0.72 | 0.79 | 0.79 | 0.84 | 0.91 | 0.87 |
| 20% GGPS | 0.69 | 0.66 | 0.72 | 1.12 | 0.86 | 0.94 |
| 30% GGPS | 0.6 | 0.63 | 0.64 | 1.46 | 1.13 | 1.08 |
| 50% GGPS | 0.67 | 0.69 | 0.62 | 0.97 | 0.79 | 0.68 |
| Average (OPC, GGBS) | 0.73 | 0.74 | 0.75 | 1.15 | 0.96 | 0.92 |
Table 6.
Strength development 150 mm cubes after 3, 7, 28, and 56 days of curing for the environmentally friendly mixes (number between parenthesis represents the coefficient of variation (%)).
Table 6.
Strength development 150 mm cubes after 3, 7, 28, and 56 days of curing for the environmentally friendly mixes (number between parenthesis represents the coefficient of variation (%)).
| Compressive Strength (MPa) | |||||
|---|---|---|---|---|---|
| OPC (10%) | GGBS + Fly Ash+ Silica Fume (%) | 3 Days of Curing | 7 Days of Curing | 28 Days of Curing | 56 Days of Curing |
| 10 | 90 | 8.9 (0.88) | 33.35 (7.13) | 39.95 (7.08) | 61.1 (2.56) |
| 10 | 90 | 19 (10.01) | 33.8 (7.42) | 49.9 (7.25) | 58.2 (9.02) |
| 10 | 90 | 32 (3.17) | 38.175 (6.90) | 51.9 (2.79) | 71.6 (0.82) |
| 10 | 90 | 38.5 (6.83) | 43.45 (9.35) | 44.25 (3.51) | 47.35 (1.68) |
| 10 | 90 | 21.4 (6.62) | 33.5 (8.46) | 41.55 (2.54) | 43.75 (1.51) |
| 10 | 90 | 18.15 (7.44) | 38.6 (7.81) | 50 (2.26) | 51.45 (9.67) |
| 10 | 90 | 37.85 (9.77) | 38.9 (7.59) | 58.25 (3.23) | 59.95 (1.45) |
| 10 | 90 | 26.9 (2.20) | 40.8 (3.74) | 52.3 (1.19) | 54.65 (2.24) |
| 10 | 90 | 33.9 (11.98) | 45.55 (2.8) | 51.35 (1.67) | 60.5 (0.75) |
| 10 | 90 | 35.4 (3.57) | 40.4 (4.81) | 50.8 (4.54) | 56.4 (1.87) |
© 2019 by the author. Licensee MDPI, Basel, Switzerland. This article is an open access article distributed under the terms and conditions of the Creative Commons Attribution (CC BY) license (http://creativecommons.org/licenses/by/4.0/).
Share and Cite
MDPI and ACS Style
Mohamed, O.A. Effect of Mix Constituents and Curing Conditions on Compressive Strength of Sustainable Self-Consolidating Concrete. Sustainability 2019, 11, 2094. https://doi.org/10.3390/su11072094
AMA Style
Mohamed OA. Effect of Mix Constituents and Curing Conditions on Compressive Strength of Sustainable Self-Consolidating Concrete. Sustainability. 2019; 11(7):2094. https://doi.org/10.3390/su11072094
Chicago/Turabian StyleMohamed, Osama Ahmed. 2019. "Effect of Mix Constituents and Curing Conditions on Compressive Strength of Sustainable Self-Consolidating Concrete" Sustainability 11, no. 7: 2094. https://doi.org/10.3390/su11072094
Note that from the first issue of 2016, this journal uses article numbers instead of page numbers. See further details here.