Validation of Sustainability Benchmarking Tool in the Context of Value-Added Wood Products Manufacturing Activities


Department of Forestry and Natural Resources, Purdue University, West Lafayette, IN 47907, USA
*
Author to whom correspondence should be addressed.
Sustainability 2019, 11(8), 2361; https://doi.org/10.3390/su11082361
Submission received: 6 March 2019
/
Revised: 8 April 2019
/
Accepted: 15 April 2019
/
Published: 19 April 2019
(This article belongs to the Special Issue Sustainable Intelligent Manufacturing Systems)
Abstract
:The primary objective of this study was to validate the sustainability benchmarking tool (SBT) framework proposed by the authors in a previous study. The SBT framework is focused on benchmarking triple bottom line (TBL) sustainability through exhaustive use of lean, six-sigma, and life cycle assessment (LCA). During the validation, sustainability performance of a value-added wood products’ production line was assessed and improved through deployment of the SBT framework. Strengths and weaknesses of the system were identified within the scope of the bronze frontier maturity level of the framework and tackled through a six-step analytical and quantitative reasoning methodology. The secondary objective of the study was to document how value-added wood products industries can take advantage of natural properties of wood to become frontiers of sustainability innovation. In the end, true sustainability performance of the target facility was improved by 2.37 base points, while economic and environmental performance was increased from being a system weakness to achieving an acceptable index score benchmark of 8.41 and system strength level of 9.31, respectively. The social sustainability score increased by 2.02 base points as a function of a better gender bias ratio. The financial performance of the system improved from a 33% loss to 46.23% profit in the post-improvement state. Reductions in CO2 emissions (55.16%), energy consumption (50.31%), solid waste generation (72.03%), non-value-added-time (89.30%), and cost performance (64.77%) were other significant achievements of the study. In the end, the SBT framework was successfully validated at the facility level, and the target facility evolved into a leaner, cleaner, and more responsible version of itself. This study empirically documents how synergies between lean, sustainability, six-sigma and life cycle assessment concepts outweigh their divergences and demonstrates the viability of the SBT framework.
1. Introduction
Ongoing resource scarcity, climate change, and economic stability concerns accompanied by world population projections create a necessity to take decisive actions for generating effective and timely solutions to sustainability problems. This makes sustainability one of the main drivers of the latest innovation wave. Today, most Fortune 500 companies operate dedicated sustainability units/departments and C-suite level sustainability executives [1]. All over the world, governments, NGOs, higher education institutions, and corporate organizations are embracing sustainability initiatives and evolving into more sustainable versions of themselves. Achieving sustainability is a must to ensure survival of future generations [2]. In some cases, this is happening through enforced laws and regulations, while in other cases, by means of voluntary auditing and reporting [3]. Working towards achievement of true sustainability often results in economic and social gains. For instance, city councils are beginning to release sustainability reports to gain buy-in from the society [4], while internationally-recognized corporations are investing in advertising and marketing activities that highlight their sustainability actions and corresponding outcomes to increase their market share by attracting consumers who prioritize sustainability over other factors [5]. Moreover, the increased well-being and standards of living of a community as a function of corporate social responsibility (CSR) efforts of a company located in the same region as the community is also evident in the literature [6]. Many organizations are using voluntary sustainability initiatives to their advantage and avoiding cost-of-non-compliance with existing and upcoming regulations. Increased job satisfaction of employees due to increased social sustainability within the walls of their work area was also documented [7]. Considering all these primary and secondary benefits of achieving a certain level of sustainability, one could conclude that no effort dedicated to ensuring, achieving, or maintaining sustainability at any level is wasted. The concept of sustainability still has a vast amount of untapped potential. This potential has not gone unnoticed by researchers. Theoretical and conceptual tools and frameworks to assess and benchmark the sustainability level of various organizations across all business sectors [8] are being developed. One of these frameworks is the sustainability benchmarking tool (SBT) and its underlying framework proposed by Tasdemir et al. (2019) [9]. The success of similar tools and frameworks has been evident in the literature. This study builds upon two previous publications of the authors. Therefore, further information about the methodology and a comprehensive evaluation of the existing literature can be found by reviewing those publications. The first publication provides descriptive and contextual analysis on lean-driven sustainability and previously-proposed frameworks [8], while the second study explains the theoretical and conceptual details of the sustainability benchmarking tool framework [9].
The underlying motivation for industry and the product preference of the authors could be summarized as follows: (1) the wood products’ industry has been failing to become a frontier of any innovation wave, although it was one of the very first industries in the known history of civilization [10]; (2) this industry segment has relatively low profit margins when compared to other industries [11] and could significantly benefit from investments made towards triple bottom line sustainability; (3) a small-sized manufacturing operation was preferred to document that SMEs could benefit from sustainability initiatives as much as large organizations; (4) studies assessing and benchmarking the sustainability performance of the value-added wood products’ industry and SMEs are relatively scarce and have untapped potential; (5) the authors of the study believe that the wood products’ industry has a great true sustainability potential since its raw material, the wood, is the sole construction material that is entirely renewable, recyclable, and biodegradable [12]; it also offers a natural carbon sequestration opportunity [13]; (6) the preferred SME has a manageable degree of complexity and was able to accommodate controlled scientific experiments. Details, characteristics, and contingencies of the case study are provided in the following section.
2. The Objectives
The objectives of this study were (1) to validate the sustainability benchmarking tool (SBT) framework proposed by the authors in a previous study and (2) to document how value-added wood products’ industries can take advantage of the natural properties of wood to become frontiers of sustainability innovation.
3. Case Study
The SBT framework was deployed in a unique manufacturing facility that produces value-added wood products. The facility is located in the U.S. Midwest and was built upon 3393 sq. ft. of land in 1910. The facility operates based on an 8 h/shift, 1 shift/day schedule and 5 days/week. Two days in a week, the manufacturing facility is dedicated to the production of cutting boards glued up from nine U.S. Midwest hardwood species for final consumer use. Currently, a batch production system is in place, and a batch size is six cutting boards. Manufacturing of hardwood cutting boards has been ongoing in this facility since 2000. Therefore, the abundance of historical process data creates the optimal foundational setting for a validation study. The design of the product, product specifications, and bill-of-materials (BOM) can be seen in Figure 1. The facility has three major suppliers for raw materials and local final customers who pick the finished products up from the facility. Two of the three raw materials are being transported from suppliers with pick-up trucks, and the third raw material is being directly shipped by a supplier to the manufacturing facility. Detailed information about supplier locations can be seen in Appendix A. The original manufacturing process involves 10 processes: (Process 1) rip-saw and cross-cut to rough dimensions, (Process 2) jointing and planing, (Process 3) processing to final width, (Process 4) gluing, clamping, and curing, (Process 5) processing to final thickness, (Process 6) board separation, (Process 7) CNC processing, (Process 8) laser engraving, (Process 9) manual edge smoothing and surface finishing, and (Process 10) inspection, packaging, storing, and shelving for retail. On average, the annual demand rate is around 120 batches for a total of 720 cutting boards. Production and inventory management strategies are based on the make-to-stock (MTS) strategy. The organization hires part-time employees for manufacturing of cutting boards in addition to one full-time supervisor. The pre-improvement process flow of the facility and part specifications for manufacturing of hardwood cutting boards can be viewed in Figure 2.
4. Materials and Method
4.1. Materials and Process
Materials used in cutting board production include Titebond Ultimate III brand PVA Glue, Howard Food Grade Mineral Oil, Uline S3578 Recycled Kraft Paper, Uline S3632 Plastic Bags, and lumber of nine U.S. Midwest hardwood species, grown and harvested in the region. Non-biodegradable materials of the process, namely polyvinyl acetate adhesive (PVA) (Franklin International, Columbus, IN, USA) at 40% solid content that is used during panel assembly and plastic bags (high-density polyethylene (HDPE)) that are used for packaging, have an influence on the economic and environmental performance of the facility based on the usage and waste amount parameters.
The species include white oak (Quercus alba), hickory (Carya cordiformis), walnut (Juglans nigra), soft maple (Acer saccharinum), red oak (Quercus rubra), yellow poplar (Liriodendron tulipifera), ash (Fraxinus Americana), cherry (Prunus serotina), and hard maple (Acer saccharum). One could explore in detail the properties of the above-stated species in the Wood Handbook published by the USDA Forest Products Laboratory [12]. Manufacturing operations were performed at 10 different stations involving 13 pieces of industrial machinery and equipment, as documented in Table 1. Energy consumption rates and time-in-operation values of each piece of equipment can be viewed in the same table. Cost of the materials used in production, as well as cost of labor are given in Appendix B. Transportation and shipping modes and associated cost factors of procured raw materials are also listed in Appendix A.
Weight data were collected by an AND EK-2000i digital scale. A stopwatch was used during time studies. The NIOSH Sound Level Meter iOS application through an Apple iPhone 7 Plus with an internal microphone was used to measure noise level for each process based on NIOSH standards [14]. Measurement parameters included an 80-dB threshold, 3-dB exchange rate, fast time weighting, and A frequency. A set of experiments was conducted to validate the SBT framework and to assess and improve the sustainability performance of the organization under a controlled environment to ensure scientific merit. For glue station improvement, the Rockler 57361 Glue Applicator Tip Set and AceLite LED T8 Integrated Shop Lights with color temperatures of 3000 K (warm), 4500 K (neutral), and 6000 K (cool) were used.
4.2. Methods
Within this study, the SBT framework was validated through a case study in the context of a value-added wood products’ manufacturer as defined by the small and medium-sized enterprise (SME) definition of the European Commission and the U.S. International Trade Commission [15,16]. The validation study was designed to be a facility-level sustainability assessment based on the bronze frontier maturity level as defined by Tasdemir et al. (2019) [9].
Pre-improvement true sustainability performance of the target system was compared to post-improvement performance in several categories. The methodology for this validation study followed six implementation steps defined by Tasdemir et al. (2019) [9]. The time studies were conducted on 30 pre-improvement batches and 30 post-improvement batches by using a stopwatch to generate input for various assessments such as value-added time, cost, and energy consumption analysis. Historical process data from pre-improvement batches (varying batch numbers for different purposes, but 30 at least for any assessment) and post-improvement data obtained from thirty post-improvement batches provided input for SBT modules, namely, the value stream map (VSM) of current and future states, the work environment risk assessment rating (WERAR), the economic, environmental, and social performance module, and the true sustainability index (TSI) module. Information from these modules was then used to populate the true sustainability score for the organization and to highlight strengths and weaknesses. The target company was evaluated within the scope of the bronze frontier maturity level of SBT framework, involving six key performance indicators (KPIs) per TBL pillar (18 in total), as shown in Table 2. Define-measure-analyze-improve-control (DMAIC) steps were included in the integrated structure of six implementation steps. Moreover, a comparative cradle-to-gate LCA analysis was conducted on pre- and post-improvement manufacturing states. The system boundary started from the material extraction, included production, and ended with waste treatment. At the point of substitution (APOS) (allocation approach), expansion of product systems was preferred to avoid allocating within treatment systems. Ecoinvent 3.4 [17] was the lifecycle inventory database, while Brightway2 [18] was the preferred computing framework. The Tool for Reduction and Assessment of Chemicals and Other Environmental Impacts (TRACI) [19,20] was the life cycle impact assessment (LCIA) tool used to analyze the environmental impacts of operations. Minitab 18 was used for statistical analysis. AutoCAD 2019 was used to draw scaled plant layouts. Moreover, Companion by Minitab was used to keep track of the implementation and to create process maps and three-ladder current and future state maps. Excel was used to gather, organize, and analyze the data for both pre- and post-improvement batches.
In Step 1, stakeholders of the company, stakeholder expectations, and the cost of non-compliance with stakeholder expectations were identified. In Step 2, problems faced at the organizational level were identified and the supply chain structure of the company was created. An SBT framework implementation team (SBTFIT) involving three people was also formed in this step. The team had weekly meetings to manage the validation study, identify and document manufacturing process problems, as well as brainstorm improvement ideas. During the first two steps, SIPOC (suppliers-inputs-process-outputs-customers) and detailed process mapping were the primary lean tools used. Step 3 consisted of data gathering, evaluation, and creation of the current three-ladder value stream map. In Step 4, current work environment risk ratings and control mechanisms were identified, and corresponding penalty coefficients were assigned into one of eleven risk categories based on the risk probability/impact matrix given in Appendix C. Within this step, 5S and Gemba walks were used. Gemba walks were conducted by an ISO 9001:2008 Quality Management System Internal Audit and Six-Sigma Black Belt certified professional. In these steps, the three-ladder current state map, the main module of the sustainability benchmarking tool, was created by processing historical manufacturing data, cost factors, and time study outcomes in Companion by Minitab. The results combined with work environment risk assessment rating (WERAR) audit outcomes and sustainability performance modules were used to create the SBT framework user interface in Microsoft Excel. Before feeding historical and collected data into the engine of SBT and populating true sustainability performance results for the target manufacturing system, measurement system analysis (MSA) was performed by means of the overall defect rate (run of a sample set that was representative of common defect types for the manufacturing line), intermediary and final product dimensions, time keeping of process steps, combined (wood, glue, kraft paper, and mineral oil) waste measurements, and noise level measurements to ensure the repeatability, reproducibility, and accuracy of collected data throughout the study. Then, inputs from the VSM module created in Step 3 and those from the WERAR module were fed into economic (FPM), environmental (EPM), and social (SPM) performance modules (also known as the engine of SBT) to calculate true sustainability performance. In addition to the simplified formulas given in Table 2, the eight formulas below were used to calculate the total cost of manufacturing operations per batch, transportation cost per batch, value-added-material cost per batch, total-value-added and non-value-added cost per batch (adapted and expanded from Vinodh et al., 2016) [21], energy consumption rate per process (adapted and expanded from the U.S. Department of Energy, 1997) [22], negative CO2 emission of final products [23], and rolling throughput yield (RTY) [24]. All the information presented in the three ladders of the VSM module was adjusted based on the historical defect rate (DR) to reflect the realized sustainability performance of the facility, rather than the observed one.
where i = process number from 1–n; j = materials that are part of BOM from a–d for MC and VAMC and from a–b for SC; x = material suppliers from 1–s; ki = number of workers in process i; γj = number of batches material j is sufficient for; αj = percentage of initial input amount of material j that is turned into value-added product; 𝜔ji = assigned scrap generation weight for material j in process i; hi = inventory holding cost for process i; TCbatch = total cost of manufacturing one batch of final product; TRCbatch = total transportation cost per batch; TRCj = transportation cost for material j; SCbatch = shipping cost per batch for product j; VACbatch = total value-added cost per batch; NVACbatch = total non-value-added cost per batch; ECRi = energy consumption rate per process; CSPbatch = carbon sequestration potential per batch; MCbatch = material cost per batch for product j; CTi = cycle time for process i; MTi = machine time for operation i; VATi = value-added-time for process i; NVATi = non-value-added time for process i; Cl = time unit adjusted wage of labor; Ce = cost of electricity per kWh; Dx = distance in miles to supplier x; MPGv = fuel consumption rate of vehicle; Favg = fuel price average per gallon; TT = total travel time to and from supplier x; WIP = work-in-progress inventory for process i; EPI = end-item inventories for i = n + 1; Dproduct = average material density for one unit of final product; CCproduct = carbon content of one unit of final product; ELTproduct = expected lifetime of the final product; Vbatch = total volume of one batch of final product; RTY = rolling throughput yield; VLi = material volume-out for process i; VBi = material volume-in for process i.
Indices created by these modules for 18 KPIs were averaged to populate the TSI score for the company’s pre-improvement performance. The last action of Step 4 was to identify the strengths and weaknesses of the manufacturing system. Of 18 KPIs, those with scores lower than seven were marked as weaknesses and were primary issues to be tackled, while KPIs with a score of nine or higher were recorded as the strengths of the system and documented within the corresponding section of the TSI module. In Step 5, root cause analysis was conducted on identified weaknesses to open the door for improvement opportunities. Fishbone diagrams, 5-WHYs and failure mode effect analysis (FMEA) were used to populate potential root-causes, while correlation/regression analysis was used to screen and derive conclusions on actual root-causes. Significant independent variables (critical Xs) were also identified in this step to construct f(x). Improvement ideas were discussed and documented through deliberate brainstorming sessions with the help of the impact/effort matrix. Consecutively, the most feasible improvement ideas were deployed in the pilot study areas (isolated process steps) and data from post-improvement batches gathered to create the three-ladder future state map and populate results in other modules. The control mechanism was implemented along with the deployment of improvement ideas to ensure standardization of new work principles. In the last step (Step 6), the True Sustainability (TS) performance of pre- and post-improvement states was compared, and differences were documented. In this step, new strengths and weaknesses of the system were also identified and shown in the TSI module. A logical discussion of achieved improvements and lagging categories was conducted in this step.
5. Results and Discussion
5.1. Results of Steps 1 and 2
To identify key stakeholders, their expectations, and critical specifications from internal and external customers, voice of the customer (VOC) surveys and stakeholder analysis were conducted following the creation of a SIPOC as part of the define phase of the DMAIC methodology. Results of SIPOC are shown in Appendix D, and a summary of stakeholder analysis and VOC surveys is given in Table 3. Based on the outcomes of these efforts, a mission statement given below was structured to align the business strategy with stakeholder and customer expectations. Problem and goal statements were formulated following the creation of the three-ladder current state map in Step 3.
Mission statement: Manufacturing operations of the hardwood cutting boards should ensure the following: (1) operations should be able to generate a meaningful level of profit to ensure economic sustainability; (2) the utmost level of product safety for final consumers and work-area safety for employees of the facility, respectively; (3) manufacturing practices should be responsible and aim at doing more with less and avoiding any harm to the environment and all living creatures to the extent of the capabilities and feasible solutions.
To define accurately the scope of the assessment and the functional unit, SIPOC created in Step 1 and the supply chain structure of the target organization illustrated in Figure 3 were used. The scope of the study was defined as a facility level true sustainability assessment, while the depth of the assessment was set to the bronze frontier maturity level as stated in Materials and Methods sections. A functional unit definition was made to ensure compatibility within the production system of the organization and across quantitative analysis of the LCA, six-sigma and lean methodologies. This ensured effective and meaningful execution and reporting of all assessments and comparisons across various modules of SBT and stages of implementation Therefore, for the target facility and manufacturing system, the functional unit was determined to be “one batch of final products: six cutting boards”.
5.2. Results of Steps 3 and 4
Outcomes of MSA could be observed in Figure 4A,B. For overall defect detection, the attribute agreement analysis yielded >90% agreement of appraisers and each appraiser against the standard (true value = defective/non-defective). All appraisers’ assessments agreed with each other and with a known standard at the level of 83.33%, which is higher than our acceptable benchmark level of 80%. In all Gage R&R (Repeatability and Reproducibility) ANOVA analysis, data collectors’ contribution to the variation in measurements were statistically insignificant at the 95% confidence level. The majority of study variation in all categories was determined to be a part-to-part variation; specifically, 98.58% for product dimension measurements, 98.12% for noise level measurements, 99.27% for collective waste amount measurements, and 99.27% for time studies. No reproducibility and repeatability issues were detected for any critical data collection categories. These outcomes validated that data collected through process observations and fed into the SBT modules were accurate and reliable.
Following validation of the measurement system for critical data categories, as can be observed in Figure 5, true sustainability capabilities, strengths, and weaknesses of the system were documented through all six modules of SBT. Further capabilities of the target manufacturing system have also been identified through defect rate and yield capability analysis (see Figure 6A,B) and backed up with Pareto analysis of major defect types, and the distribution of manufacturing expenses across various cost factors, as well as the plot of the cycle time for each process are given in Figure 7A–C.
The target manufacturing system had a TSI score of 6.69, which is below the weakness threshold of 7.00. When evaluated from the macro TBL perspective, the economic performance module (FPM) had an FPI score of 6.72, whereas environmental performance was the most vulnerable sustainability aspect of the facility with an ESI score of 5.91. The SPM yielded an SSI score of 7.43. One should remember that EPM and SPM index scores were combined products of values assigned to each KPI within the category and penalty points deducted based on WERAR records. Identified issues and/or incidents in the categories of noise (N), exposure to hazardous materials (H) and ergonomics (ER) had an impact on the SSI score. The compiled outcome of initial Gemba walks is also summarized in Table 4. Two noise level-related and three wood dust exposure incidents were recorded during interviews with the workers and the supervisor. These incidents doubled and tripled the impact of assigned penalty coefficients on performance scores. Furthermore, one ergonomics issue that caused excessive motion and transportation waste was also detected by the auditor during Gemba walks and audits.
A schematic drawing of the facility layout supporting Gemba walks’ observations, and illustrated wasteful motion and transportation activities across the facility are given in Appendix E. Closer investigation of SBT modules (Figure 5) disclosed seven specific weaknesses: three economic, three environmental, and one social, that needed urgent attention to ensure progression towards true sustainability. Economic weaknesses of the facility were the value-added time ratio (VATR), value-added cost ratio (VACR), and net profit margin (NPM). Environmental weaknesses included net green area impact (NGAI), net CO2 emission impact (NCEI), and net energy footprint (NEF). Gender bias ratio was the only social sustainability weakness detected by SBT performance modules within the scope of the bronze frontier maturity level. Many of these weaknesses were also directly or indirectly elevated by a poor rolling throughput yield value of 19.34% and very high overall defect rate of 26.81% (Figure 5). This yield lags significantly behind the average expected yield of around 64% for an operation involving similar rough-mill activities [45]. In the first three processes, 71.22% of initial raw material was lost during value-added conversion of wood raw material. Such an inefficient material conversion had an impact on NVAC, NVAT, and NEF through increased material and labor cost and excess processing. As given in Figure 6B, negative Cpk (short-term realized capability) and Ppk (long-term realized capability) values of −0.95 and −1.14 indicated that the system was not capable of meeting the upper specification limit (USL) of 1% and would continue to fail to meet customer expectations in 99.97% of future scenarios. Wood is not the only raw material that contributed to the poor RTY performance. PVA glue and mineral oil amounts going into the product and amounts being wasted were uncontrolled. Close investigation of Process 4 and Process 9 revealed that, on the average, 99.2 g of PVA glue and 50.60 g of mineral oil were being used per batch. However, usage of these materials as value-adding inputs was limited to 69.55 and 25.60 g, respectively. This meant that approximately 30% of glue and 50% of mineral oil was wasted and created an undesired negative environmental impact once disposed of. It is not surprising, then, that this facility was suffering from weak NVAT and NVAC performance with a defect rate (DR) of 26.81%. As interpreted from capability analysis, a Process Z score of 0.62 and 268,145 defects per million opportunities (DPMO) were indicators of a poor defect rate and were far from the internal customer (management)-defined specification of 1% (revisit Table 3). Based on a relaxed 80/20 rule [46], major defect types of the system, covering 95% of the total defective production, were CNC defects (27%), laser engraving issues (20.6%), wrong species order/arrangement (19.5%), lumber defect and dimension problems (19%), and issues associated with machinery (8.5%). Samples representing a cocktail of major defect types encountered are given in Appendix G.
In Process 4, a very high non-value-added waiting time of 1440 min was detected. This process element was necessary for safe machining of glued-up panels and recommended by the glue manufacturer. Although this element of Process 4 was a lights-out process that did not add onto labor, material, or energy costs, such a waiting period significantly damaged the VAT ratio and created a bottleneck process in the system, which also increased work-in-progress (WIP) inventory levels and lead time (28.48 h/batch), as can be observed in the VSM module. Other time-related issues of the system were high machine times in Processes 2, 7, and 8 with values of 20.07, 11.05, and 88 min, respectively. Higher energy consumption rates of the same processes in comparison to those of others were supportive in nature of excessive machine time arguments. Twenty-two-point-one-six kilowatt hours out of 30.19 kWh of the total energy footprint of the manufacturing system were created by these three processes. This electricity consumption created indirect increased fossil fuel dependency, since according to the U.S. Energy Information Administration (EIA), more than 95% of the state’s electricity generation is fossil fuel dependent [47].
As highlighted in the three-ladders of the VSM module, the majority of the total emission footprint was caused by transportation of raw materials with a value of 10.11 kgCO2 equi. followed by Process 1 (6.38 kgCO2 equi.), Process 7 (4.20 kgCO2 equi.), and Process 2 (2.30 kgCO2 equi.) activities. CO2 emission due to transportation was due to burning of fossil fuels, while emission footprints of Processes 1, 2, and 7 were due to the amount of electricity used and solid wastes generated during manufacturing activities. Raw LCA results for the pre-improvement state are given in Appendix H. Total solid waste generation (TSWG) of the manufacturing operations netted 16.77 kg of solid waste. Scrap wood dust or wood pieces were identified to be responsible for 99.23% of TSWG impact. Process 2, where jointing and planing operations were carried out, had the highest solid waste amount with a value of 7.70 kg, which was followed by Process 1 (5.81 kg). Although wood is a biodegradable material, that should not be an excuse for inefficient use of natural resources in the era of resource scarcity [48].
Moreover, when the costs of operations were analyzed, the cost of manufacturing one batch of final products was around $141.93, as given in Figure 7B. Considering a batch of final products could generate $120.00 in revenue, this manufacturing activity was not capable of generating any profit for the company. Loss was either being offset by profits made through other manufacturing activities occurring in the same facility or being absorbed by the management. More drastically, this scenario occurred only in the case of defect-free production. Based on historical data, the defect rate was 21.86%. When the cost of manufacturing one batch of products was adjusted for the defect rate, final total cost reached $179.98. Loss per batch drifted in the range of $21.93 and $59.98. Labor cost ($109.20) accounted for the largest portion of the total cost, and material cost followed with a cost of $29.02, as given in Figure 7B. Based on these observations, it is obvious that every second of NVAT and every cent of NVAC had a significant role in poor profitability performance (33.33% loss).
Among all identified sustainability issues and inefficiencies of the system, the presence of a totally non-value-added step, Process 6, was worth a closer investigation as highlighted via the three-ladder current state map in the VSM module. It had 0-min VAT and $0.00 VAC, while it contributed to NVAT and NVAC with 1.79 min and $2.14, respectively. These four values were clear indications of why this step should not be part of the manufacturing process. From the perspectives of both lean and sustainability methodologies, a totally non-value-added activity is considered a step that needs to be eliminated.
As can be seen from our analysis, all sustainability problems of the facility were interdependent and collectively contributed to by the overall poor true sustainability performance of the system. Based on detailed documentation and calculations, a problem and goal statement were developed prior to proceeding with root-cause analysis.
Problem statement: Based on the analysis of historical data covering manufacturing operations from 2016–2018, it was found that the facility had been performing poorly in terms of profitability and had been under the adverse influence of damaging value-added time and cost factors that yielded index scores of 1.00, 5.00, and 4.62 on a 10-point scale. Moreover, when evaluated for environmental performance, it was documented that the target facility had never acted to neutralize the green area impact of the establishment, which resulted in the lowest index score for this category. Other environmental sustainability problems were net energy footprint and net CO2 emission impact with index scores of 1.00 and 3.61. Finally, within the context of the social sustainability pillar, the male to female employee ratio of participants in manufacturing activities failed to achieve a balance and was only good enough to yield an index score of 3.08.
Goal statement: Each of the identified weaknesses should be addressed through a scientific improvement approach to bring it to an acceptable level. An initial target for each of the problematic areas will be a 7.00 index score threshold, which ensures an acceptable performance in all three triple bottom line pillars.
To identify potential root-causes of identified sustainability issues, exhaustive brainstorming sessions have been held and Fishbone diagrams, 5-WHYs, and failure mode effect analysis were carried out. Detailed documentation of the outcome brainstorming sessions, Fishbone diagrams, 5-WHYs, FMEA analysis, and FMEA scales were used to assign scores and can be viewed in the Supplementary Materials. The list of identified potential root-causes and problems impacted by those root-causes is given in Table 5. Following the above-mentioned analysis, SBT-FIT focused on establishing f(x) for identified sustainability issues. The team was able to identify root-cause(s) of several sustainability issues, such as gender bias ratio, lack of renewable energy use, net green area impact, motion and transportation waste, noise and dust exposure of workers, and raw material storage area issues, which were deemed to necessitate further investigation. As for the poor gender bias ratio, four female and 13 male employees worked in this manufacturing line over the three-year assessment period. As stated in the Case Study section, the manufacturing line involves two workers. The required manpower of the line is staffed with workers who volunteers for this assignment on a first-come-first-serve principle. Apparently, the unbalanced structure of the annual worker pool accompanied by male workers’ willingness to step up for the open spots more often than their female counterparts resulted in such a gender bias ratio. Since the management did not keep track of this ratio, the problem went unnoticed until deployment of the SBT framework. Lack of renewable energy use and energy usage avoidance efforts could be explained by the lack of infrastructure, infeasibility of large-scale investments, and lack of motivation due to absence of mandatory and voluntary regulations. Lack of engagement with sustainability initiatives was also among the identified root-causes. Moreover, excessive motion and transportation waste within the facility were due to business structure changes over time. At the time of the initial layout configuration, the product under investigation was not part of the product mix manufactured within this facility, and therefore, it was not considered when initial layout decisions were made. Slightly different root-causes were present for the noise and dust exposure issues. During initial and routine Gemba walks, visual posts defining safety guidelines were apparent and satisfactory. However, based on interviews with workers and the supervisor, lack of health and safety awareness of workers and optional use of certain personal protective equipment (PPE), namely ear plugs, earmuffs, and dust masks, in contrast to use of eye protection (which was mandatory), were primary reasons for the above-stated WERAR issues. Furthermore, root-causes of lack of organization in the wood raw material storage area were the easiest to identify. Unloading of arriving material had been carried out by untrained workers who had no knowledge of proper sorting, stacking, and storing practices. No standard operating principles (SOPs) were in place to follow and standardize the jobs performed. The lack of SOPs in this area resulted in wrong species being picked for production (contributing to the overall defect rate of 26.81%), excess picking time (8.57 min), and trip-and-fall hazards on the floor. These were not the only issues present in this area, as the lack of SOPs also led to dimensions and quality inadequacy of wood raw material released into the production system. Various and uncontrolled length, thickness, width, and quality specs of released material contributed to increased non-value-added labor (the largest cost factor), material costs (second largest cost factor), low RTY (19.34%), high cycle times in Processes 1 (18.50 min) and 2 (22.09 min), and dimension defects (19.50% of the sum). Ineffective and inefficient use of wood raw material due to improper material input specs also contributed to very high transportation CO2 emissions per batch (10.11 kgCO2 equi.).
On the other hand, sustainability issues such as high machine time and low yield at certain stations, high overall defect rate, high waste generation in Processes 1 and 2, and high energy consumption and CO2 emissions required further investigation. For potential root-causes of these sustainability issues, seven hypotheses were developed and tested. Sample sizes have been determined based on minimum 80% detection power (1-β) for desired resolution levels (Δ) at the 95% confidence level. To present the outcomes of the experiments methodically, they are presented in association with Processes 1–10. Therefore, the first experiment was constructed to test the impact of the presence of cup and crook defects in lumber on the combined processing time of the first three steps. In other words, the time to obtain sticks (from the beginning of Process 1 to the end of Process 3) versus the severity of lumber defects was tested. Lumber was sorted into sub-groups based on three severity levels, namely minor cup and crook, average cup and crook, and no defect. Lumber with severe cup and crook was never released into the manufacturing system. The sample size for all subgroups was 20. The Tukey method was employed to identify any differences between subgroups.
The results of this test can be seen in Figure 8. Lumber condition is a significant variable with a p-value of <0.0001 at the 95% confidence level. This hypothesis test was able to capture 82.21% of the variation in the dependent variable, an acceptable level for the purposes of this study. Based on the Tukey outcome, no statistically-significant difference was identified between lumber with no defect and lumber with minor cup and crook. Therefore, SBT-FIT concluded that rather than blocking release of lumber with cup and crook defects, conditional acceptance of such lumber would be feasible.
Many of the dimension-related defects were created in Process 2; yet, they go unnoticed until the end of the manufacturing line. These defects indirectly contribute to many sustainability issues, including but not limited to NVAT, NVAC, and NEF. A screening analysis was conducted to assess the impact of cutting tool sharpness, feed speed, and knife marks on defects due to wood splits and knife marks. As can be observed in Figure 9, knife condition, feed speed, and the interaction term of knife condition and feeding speed were significant with p-values of <0.001 at the 95% confidence level, while knot presence in the lumber was not a statistically-significant variable for dimension-related defects occurring in Process 2 with a p-value of 0.722 at the same confidence level. Other interaction terms were also insignificant. Therefore, knife condition and feed speed were kept as critical variables for this dependent variable, while knot presence was excluded from further consideration.
Another set of hypothesis tests was conducted to determine the significance of operator and glue applicator tip variables on usage, waste, and application times. Usage and waste amounts were of concern since they had an influence on the material cost and environmental impact factors, while application time increased labor cost, which was the largest cost factor in the total manufacturing expenses. Each independent variable had two levels (Operator 1 and Operator 2, Tip 1 and Tip 2), and each sub-group had 22 samples (n = 44). As can be seen in Figure 10, at the 95% confidence level, operator type was insignificant for application time, waste, and usage with p-values of 0.739, 0.739, and 0.090, respectively. Tip type was significant with p-values <0.0001. The interaction term of the operator and applicator tip was also not significant at α = 0.05. Hypothesis tests were able to capture 87.32%, 90.67%, and 74.26% of the variation in the response variables of application time, waste amount, and usage amount, respectively, which was satisfactory for the purposes of the study.
Another experiment had to be conducted for the operations occurring in Process 4, since faulty lay-out/arrangement of hardwood sticks prior to glue application was the third most common defect type detected (see Figure 7A). Within an experiment setting (n = 243), the Chi-square test for association was conducted on the response variable of faulty sticks layout to test the significance of wood ID expertise, ambient differences due to different light colors, and time allowed to arrange sticks, as shown in Figure 11. Each independent variable had three levels. For the wood ID expertise variable, recruit level wood ID skills, moderate wood ID skills, and expert level wood ID skills were compared with 3000 K (warm), 4500 K (neutral), and 6000 K (cool) ambient light sources. Time allowed to arrange sticks was set to 30, 45, and 60 s. At the 95% confidence level, wood ID skills and time allowed were significant variables for the response variable with p-values <0.0001, whereas light color was not statistically significant with a p-value of 0.754. As can be observed in the same figure, time pressure had an impact on the decision making process of even the most competent subjects when time allowed was below 45 s. Therefore, this finding was taken into consideration while improvement ideas were developed and deployed to optimize the manufacturing system, as discussed later in this section.
Among identified problems for Process 7 sustainability issues, suction loss was of a big concern. The persistency of this problem forced the workers to process the parts one by one, which was totally against the design purpose of CNC machines. Such an issue ended up with increased machine time at a work station that involved four machines (compressor, dust collector, vacuum pump, and CNC itself) with the highest energy consumption rates (see Table 1). As a function of increased machine time (11.05 min) and increased energy consumption (13.31 kWh), excessive costs have occurred for this process. Increased energy reliance meant more CO2 emissions (4.20 kgCO2 equi.), and longer machining time meant prolonged exposure to 93.30 dB of noise. Issues with vacuum part hold-down caused CNC machining defects due to inaccurate part alignment accompanied by edge split defects. Therefore, to identify critical variables for these occurrences, an experiment based on two statistical analyses was conducted as given in Figure 12. On one side, Poisson regression was run on a sample size of 180 parts to test the significance of three pre-identified independent variables, namely hole frequency, hole size, and area covered on the CNC table, on the dependent variable, suction loss-caused defects. Number of holes and their size control the amount of suction with which the part is held to the table. Area covered relates to vacuum leaked in a portion of the table that is not used for this operation, resulting in a loss of holding power. At the 95% confidence level, hole size was significant with a p-value of <0.001, while hole frequency and area covered on the CNC table were not significant and had p-values of 0.110 and 0.065. However, since interaction terms of hole frequency and hole size, hole frequency, and area covered on the CNC table and hole size and area covered on the CNC table were significant with p-values of 0.010, 0.014, and <0.001, all main factors were kept in the model. This model was able to capture 72.50% of variation associated with the response variable. Moreover, through Mood’s median test, for differences among median values of edge defect counts for three different levels of suspected root-causes of the problem, round-over bit RPMs (150, 250, and 350) were assessed as documented in Figure 12. At the 95% confidence level, round-over bit RPM was detected to be a statistically-significant factor for edge defects in Process 7 with a p-value of <0.001.
The last experiment for determining critical variables for identified sustainability issues was targeted towards Process 8. In this step, displacement of parts during engraving caused engraving defects, increased the severity of the overall defect rate, and had an adverse influence on sustainability performance. Moreover, failure to address this problem in the long run always resulted in extremely high machine time (88 min) since engraving speed had to be kept at around 150 mm/s. Relatively high setup time (9.27 min) accompanied by a high overall defect rate (26.81%), an NVAT of 36.54 min, and energy consumption of 3.64 kWh/batch were inevitable and not surprising. Costs (labor and energy mainly) incurred as a function of activities occurring in Process 8 were significantly damaging to the profitability of the facility (33.33% loss). Therefore, a full factorial regression was created to screen potential root-causes of issues related to displacement and alignment of parts on the laser engraving table, as given in Figure 13. Operator familiarity with the process, machine location, engraving speed, and use of extra part securing pre-cautions were independent variables tested. Each factor had two levels; recruit level familiarity versus average level familiarity, Locations A and B, 100-mm/s and 500-mm/s engraving speeds, and use of adhesive tape (on/off), respectively. At the 95% confidence level, Operator familiarity, engraving speed, and extra securing of boards were significant factors with p-values of 0.0001, 0.0092, and <0.0001, respectively. At the same confidence level, machine location was insignificant with a p-value of 0.7947. Interaction terms of all two-way and three-way interaction terms were insignificant, except one, operator familiarity and extra securing of boards, which had a p-value of 0.0288 at the α = 0.05. Based on factorial regression results presented in Figure 13, it can be concluded that laser engraving operations could significantly benefit from an error-proof alignment guide that minimizes (if not eliminates) human error, secures the board in place throughout the process, and enables the operator to set engraving speed to the highest possible level.
Either through critical and analytical methods, or via statistical techniques, all critical Xs for identified macro- and micro-sustainability issues within the context of the bronze frontier of the SBT framework have been screened, and f(x) structures have been constructed as discussed in the above parts of the study. In the next sub-section, new operating tolerances are established, and improvement ideas are generated, deployed, and/or proposed based on those new operating tolerances. The final capability of the target facility after implementing the proposed improvements is documented through the three-ladder future state map and other modules of SBT in the next two subsections.
5.3. Results of Step 5
This step was where the improve and control phases of the DMAIC methodology were carried out within the study. Improvement ideas were populated and evaluated before turning them into management and/or engineering decisions. The first step in this decision-making process was to establish operating tolerances for identified problems. This process involved both management-driven policy decisions and data-driven new production parameters. Operating tolerances for critical variables screened through statistical methods were established by using Response Optimizer of Minitab.
New tolerances were determined based on either internally-specified or pre-identified industry benchmarks. New policy decisions by management involved net green area impact (NGAI) and gender bias ratio (GBR) neutralization, reduction of net energy footprint by at least 25% as a starting point through usage avoidance or production optimization, reduction of defect rate (DR) by 90%, increasing rolling throughput yield to an acceptable level that approximates (if not matches) the pre-identified acceptable benchmark of 50%, achieving at least a 10.69% profit level, which is the industry average for Q4 of 2018 [49], reducing CO2 emissions by at least 50% based on the 50/90 rule of six-sigma, minimizing identified motion and transportation wastes within the facility, eliminating WERAR category penalty points that drastically affect true sustainability performance, reducing by 50% non-renewable wastes to increase public image, and reducing NVAT and NVAC by at least 90% and 50%, respectively.
To set the right direction for engineering decisions that will lead to satisfaction of the new operating tolerances stated above, Response Optimizer of Minitab was employed for some elements of Processes 2, 4, 7, and 8. To set new operating parameters for Process 2, the target for total knife marks per batch was set to “0”, and optimal settings of sharp and low parameters were obtained for critical variables of knife condition and feed speed, as given in Figure 14, respectively.
In order to eliminate suction loss and improve part hold-down at the CNC station, response optimization results were obtained as given in Figure 15. To minimize defects in this step, at least 75% of the unused portion of the CNC vacuum part hold-down table should be covered with a non-porous panel to eliminate leakage and increase suction under the in-use portion of the table. A screening regression analysis (Figure 12) showed that the hole size and interaction term of hole frequency and hole size were significant factors. In order to minimize the number of defect parts due to loss of suction, the hold-down fixture needs to be redesigned with vacuum conducting holes of a diameter of 0.5 inch or more, and there should be three holes under each part.
To produce a defect-free part at the laser engraving station (Process 8), the part has to be accurately and securely positioned in the work area. A lack of an error-proof and easy to use positioning and alignment setup fixture was identified as a root-cause of high setup and machining times, energy consumption, and defect rate. At a current engraving speed of 150 mm/s, the vibration of the engraver head causes a misalignment of at least 0.1 cm from the beginning to the end of this processing operation. An ultimate objective of this step is to expedite the production by increasing the engraving speed to the machine’s maximum of 500 mm/s. Response optimizer (Figure 16) predicted that at this speed, the misalignment will increase to an unacceptable 0.716 cm with the current part attachment method, the masking tape. Therefore, a new method to attach parts to the table accurately and securely at higher speed needs to be developed.
In addition to extra securing (attachment) of boards to the table and engraving speed, a screening regression analysis (Figure 13) showed that operator familiarity was also a significant factor in improving the precision and repeatability of part placement on the engraving table.
In the gluing, clamping, and curing operation (Process 4), there were two major root-causes contributing to identified sustainability issues: (1) faulty species layout before panel glue-up and (2) glue usage and waste amount. In order to produce an acceptable product, with nine parts, each of the different species have to be selected and laid up in the correct sequence. An optimal amount of glue has to be applied to each part prior to assembly and clamping. Too little glue will result in a weak joint, and too much glue is wasteful. Based on new operating tolerances, the production system has to be improved.
Therefore, response optimization was run in Minitab 18 two more times to obtain the optimal settings for minimization of faulty species layout and the amount of glue used and wasted, as given in Figure 17 and Figure 18. For faulty layout of species, Response Optimizer was allowed to alter wood ID expertise level up to moderate expertise, since during actual manufacturing practices, the only employee with the highest-level of wood ID expertise was the supervisor. To achieve a target of zero faulty species layout per batch, Response Optimizer generated the optimal settings for the time allowed to perform the work of 60 s and required a minimum of moderate expertise in wood ID skill. The impact of time pressure on the operator should be considered during production line optimization. Even with these optimal settings, response fit confidence intervals were 0.1693 and 0.3469. Therefore, standard operating procedures had to be improved to better approximate the target of zero defects.
Hypothesis testing (Figure 10) showed that applicator tip type was a significant factor to control glue usage, waste, and application time. Therefore, in this step, four new applicator tip types, namely brush, centering, roller, and wide mouth, were introduced to the system, and corresponding data were collected to run the Response Optimizer. Observed minimum levels of 39 g for glue usage, 3.28 g for waste, and 59 s for application time were defined as targets for the optimizer, as shown in Figure 18. Based on the solution calculated by the Response Optimizer, the brush-type applicator tip outperformed all other options including the traditional method. Response Optimizer calculated a time fit value of ~171 s, which was slightly higher than the current average of 160 s for the tip type (traditional) in use. Therefore, a change of tip type would contribute to better sustainability performance through decreased environmental impact and reduced economic burdens due to material inefficiencies.
Based on the Response Optimizer outcomes, improvement ideas were generated for all identified root-causes of major sustainability issues. Potential improvement ideas were prioritized by placing them onto an impact/effort matrix (Figure 19) to assess feasibility prior to proceeding to the proposition and implementation phases. Improvement ideas with the potential of generating quick and effective wins have been implemented as a primary step. As a secondary step, major projects from the matrix were either implemented or proposed. Implementation of major projects was followed by implementation of fill-ins to further expand the extent of true sustainability improvement efforts. On the other hand, use of more fuel-efficient trucks for material transportation (the only thankless task) was not implemented since it failed to justify feasibility given the size of operations and cost of the proposed idea. Although material transportation had an adverse influence on net CO2 impact, the emissions occurred during transportation were a collective product of distance travelled, weight hauled, material usage efficiency in the facility, and the overall defect rate. Therefore, it was decided that the impact of fuel efficiency was outweighed by the effort (cost) of the improvement idea. Implemented and/or proposed improvement ideas involved both within- and outside-the-walls actions, namely creation of a green area to neutralize net green area impact (NGAI), generating negative impact in terms of net energy footprint (NEF) through alteration of the waste disposal method, optimization of the material input system including wood raw material procurement and material release to production, deployment of 5S, development of new SOPs for the wood raw material storage area, updating safety policies to include mandatory use of two-layer ear protection and dust masks for processes with unsafe noise and dust levels, altering process flow to maximize yield and minimize processing time in the presence of minor cup and crook defects in the lumber, implementing preventive maintenance for the jointer and sander, designing of a new facility layout to cut transportation and motion waste, switching to a brush-type glue applicator for better environmental performance, expanding quality inspection to all stations through implementation of a defect detection (poka-yoke) system, purchasing a Radio Frequency (RF) glue curing device to eliminate the major source of NVAT through innovation-driven improvement, engineering the design of part placement fixtures for CNC and laser engraving operations, optimizing of machining parameters for the planer, CNC, and laser engraver, and elimination of plastic packaging.
NGAI, if positive, can generally be neutralized through generating a negative impact to neutralize the net impact. Companies can generate a negative impact through creating a green area within the same region. In our case, the State Department of Natural Resources and Natural Resources Foundation backing the State Tree Project [50] could be contracted to achieve this objective. A green area that equals the square footage of the manufacturing facility (3394 ft2 = 0.078 acre) would be created. The initiative plants local hardwood trees in three different regions of the state for $10/sapling. Based on the narrowest tree spacing recommendation (4 ft by 4 ft) found in the literature [51,52], 2723 trees/acre are required; 0.078 × 2723 ≈ 213 saplings must be planted., and the cost of this improvement is 213 × $10 = $2130.00.
Gender bias ratio was another sustainability issue alleviated with a temporary solution since a permanent fix to this problem requires long-term actions. To balance the gender ratio of the manufacturing line in the short term, the combined gender pool was separated into two worker pools by gender. When a production spot became available, the volunteer to fill the spot was first sought from the pre-assigned pool. At the end, job assignments were still done through a first-come-first-serve-based volunteering system. However, it reduced the gender bias, and each gender equally benefitted from available work hour gains as shown in Figure 20. The management was also advised to implement a new hiring policy that will balance the overall gender ratio in the long run.
Another improvement action was carried out to eliminate safety issues identified via the WERAR module, namely exposure to high noise (above 80 dB; see Figure 5) in Processes 1–8, excluding 4, and exposure to dust in Process 5. The safety policy was updated to include mandatory wearing of hearing protection devices (HPDs) and dust masks during operations at those stations. Although the highest measured average noise level never exceeded 94.3 dB, a two-layer ear protection was implemented through the use of Stanley Low Pressure Foam Earplugs (RST63008) and Stanley Leightning L2F Premium Folding Earmuffs (RST63007), as shown in Figure 21A,B. The earplugs and earmuffs had noise reduction ratings (NRR) of 32 and 27, respectively. Noise attenuation values for these PPEs were calculated according to NIOSH guidelines [14] and were determined to be nine and 13.25. A combined 22.25 dB of noise attenuation was sufficient to bring the exposure below the accepted safety threshold of 80 dB at all associated work stations. As shown in Figure 21C, industrial dust masks were also mandated in Process 5 to minimize wood dust exposure. No extra cost was incurred due to these safety policy upgrades, since all the equipment was already available in the facility.
The new wood raw material input system altered the quality and dimension specifications for procurement of future inventory of raw material. Since hardwood cutting boards were not the only product manufactured within this facility, considering the opportunity cost associated with the use of materials for other purposes was a critical factor. As given in Figure 22, pre-improvement specs were vulnerable to excessive waste and WIP due to uncontrolled thickness, width, length, and quality of input raw material. Raw material comes in as random-width, random-length, multiple thickness, and containing all natural defects commonly occurring in hardwood lumber. Product specifications call for parts of specific width, length, and thickness, free from defects such as knots, bark, splits, holes, etc. To produce such parts from raw material, a certain amount of waste is generated during facing, planing, ripping, and crosscutting operations. The volume of parts divided by the volume of lumber needed to make these parts is called yield and is expressed in %.
A low rolling throughput yield of 19.34 in the pre-improvement state of the system was due to the misalignment between material input specs and production requirements. The first change in raw material input specs was made by setting a one-inch thickness restriction. The second change in raw material input specs was a lumber width range between 4.35 and 10 inches. The third change was use of raw material of a minimum of 31.625 inches (19.625 inches of required +12 inches of minimum usable length for other purposes) in length as anything shorter is unusable for any purpose. These new specs significantly helped with reduced wood scrap, processing time, energy efficiency, CO2 emissions, as well as with reduction in some cost factors such as material cost, inventory holding cost, labor cost, and energy cost.
Furthermore, excessive processing time and faulty dimensions of obtained sticks due to the presence of cup and crook in lumber were eliminated by re-routing the process flow. In the new flow, the sticks (with width = 1.45 inches) were cut from lumber before jointing and planing operations, as given in Figure 23. Based on screening analysis conducted in previous sections (Figure 8), no significant difference was detected between lumber with no cup and crook and that with minor cup and crook in terms of processing time. Therefore, slightly cupped and crooked lumber was still kept in the rotation within the picking and release specs unless the defect-free portion of lumber does not meet the product requirements. Severely cupped and crooked lumber was no longer allowed in the system since uneven jointing and planing occurred perpendicular to board width and length, which was the root-cause of faulty stick dimensions. Overall, the new material input system was designed to maximize yield and minimize waste and excess processing even in the presence of cup and crook defects during Process 1 and Process 2. The new process flow extended machining time at the band saw (part of Process 1) station by around 2 min. However, it saved more than 3.5 min at the jointing and approximately 1.5 at the planing stations.
To minimize knife marks that were occurring due to dull knives and excessive feeding speed (Figure 9), SOP at the planer station was updated, and the feed speed parameter was set to “slow (25 ft/min)”. Moreover, both planer and jointer knives are now checked and replaced or sharpened if deemed necessary. To prevent re-occurrence of the dull knives issue, weekly preventive care actions were implemented.
Moreover, both high materials picking time (avg. 8.57 min) in Process 1 and increased occurrence of cup and crook defects were predicted to be associated with non-optimal sorting, stacking, and storage conditions and with a lack of the first-in-first-out principle, respectively. Therefore, upon checking the appropriateness of conditioning parameters against the desired parameters, a complementary 5S study of the newly-implemented raw material input system has been conducted, and new SOPs were developed to ensure optimal sorting, stacking, storing, and picking practices. The pre- and Post-improvement condition of this storage area can be viewed in Figure 24. As can be observed, a KANBAN system featuring a KANBAN Post was implemented within the 5S deployment to the signal inventory level to avoid wood raw material shortages. At the end, as the collective function of these efforts, the system benefitted from deployed improvement ideas, as discussed in the next subsection.
To further enhance the sustainability performance, a new facility lay-out featuring a cell manufacturing design, minimizing transportation and motion wastes, has been proposed based on the contingency of the manufacturing system and in compliance with the requirements of other products manufactured in the facility. As given in Appendix F, the proposed new layout was able to cut the combined transportation and motion distance from 281.5 ft. down to 119.25 ft. The new layout design was able eliminate spider-web-like unnecessary movements. This 58% decrease in the transportation and motion distance was in parallel with the philosophy of “doing more with less” [53].
Furthermore, a major improvement was achieved in Process 4. To eliminate misidentification and resulting faulty layout of parts from nine different species, time allowed to arrange parts was set to 60 s and a secondary procedure of second operator functional assessment (SOFA) was implemented. During SOFA, a supervisor stepped into the process and confirmed the species layout in a 30-s time frame. These time frames were based on the response optimizer outcomes (revisit Figure 17) and screening test results (revisit Figure 11), respectively. Moreover, the traditional glue application technique was replaced with a brush-type applicator (cost = $20.00) based on statistical evidence provided in the previous subsections (Figure 18). This upgrade resulted in a new average glue usage and waste amounts of 43.39 and 3.99 g, respectively. The new values were 57% and 87% less than those observed with the traditional method. Previous glue waste was the most damaging non-biodegradable solid waste incurred in the system. Last but not least, the largest NVAT component, glue curing time (24 h), was turned into a value-added-step through a proposed investment (~$8000.00) in a radio frequency glue curing device. The unit can generate up to 600 Watts of output, only weighs around 1 kg to provide mobility, and has an energy consumption rate of 0.8 kWh at full power. RF Electro-Bond 600 reduced glue curing time by 99.66%. The 6.28-min/batch curing time was calculated through Equation (9) [54]. In addition to glue curing time, parts needed a 2-h wait time prior to subsequent machining to avoid the risk of hollow joints. In the original process, the 2 h ran concurrently with the 24-h curing time. In the new process with 6.28 min of curing time, parts need to wait an additional 2 h prior to machining. It is debatable whether to consider this time value-added or non-value-added. We chose to consider these 2 h a non-value-added time. The reduction of 24-h production delay enabled delivery of final products within the same day, which resulted in increased flexibility and less reliance on safety stock. Therefore, safety stock levels of final products have been reduced from two batches (half week of demand) to one batch (quarter week of demand).
where T = thickness of sticks in inches; L = length of sticks in inches; n = number of glue lines; PG = output power of the RF generator in kW.
Improvement efforts were also focused on CNC station. Issues such as high energy consumption, CO2 emission impact, suction power loss, cutting speed-inflicted defects such as torn fibers, and ineffective use of the CNC machine were addressed. To tackle those issues, a new part positioning and alignment fixture was designed based on findings presented in Figure 12 and Figure 15. The new fixture and its features can be seen in Figure 25. Reduction of human-error and elimination of the old Process 6 were the primary considerations in designing the new fixture. Improvement efforts in the CNC cutting process required re-numbering consequent processes, because Process 6 (the only totally non-value-added step (Figure 5) of the pre-improvement state) was eliminated in its entirety. This step was necessary due to the ineffective vacuum part hold-down method, limiting production pace to one piece at a time. Therefore, from this point on, we mention both new and old process numbers when referring to subsequent processes. The new positioning and alignment fixture ensured precise placement of boards and had a one-inch hole size, achieving direct access to the actual suction source, as can be observed in Figure 25. Following placement of the new fixture on the origin point of the CNC table, more than 75% of the unused portion of the CNC table was covered with non-porous material. Production parameters were kept unchanged for the first cutting tool. The rotational speed of the second cutting tool was reduced from 350 RPM to 170 RPM based on the results obtained in the screening step (revisit Figure 12). These two interventions significantly reduced the observed defect rate in the post-improvement scenario. The cutting time was reduced from 11.05 min to 5.00 min, while only four CNC machining-related defects out of 180 post-improvement products were reported. Considering a 27.80% initial CNC processing defect rate, the new rate of 2.22% was a significant improvement. During 30 post-improvement batches, the new guide never encountered part hold-down problems.
The laser engraving process, Process 7 (original Process 8), was also identified as needing improvement. It suffered from long setup and machining times, as well as excess energy consumption and CO2 emissions. When the technology was the control variable (no machine replacement considerations), the root cause of these problems was identified to be the slow engraving speed. Increasing speed alone, however, would result in excessive vibration and shifting of parts during the engraving process. Therefore, a new positioning and alignment fixture that would ease the part placement and would also secure the part to the machine during engraving operation had to be developed first. After two trial and error iterations, a satisfactory fixture that was easy to use, required less setup time (2.25 min), and ensured precise and secure placement of parts was developed and is shown in Figure 26. As a result, the engraving speed was increased from 150 mm/s to 500 mm/s, decreasing total engraving time by about 70%. After 30 post-improvement batches were processed, and a 0.00% defect rate was recorded. The cost of improvement of this process was around $22.00. Such a cost factor is quite insignificant when the contribution of this step to labor cost per batch is considered.
Next, to stop defective parts from progressing in the system, the existing quality inspection was expanded by incorporating rapid inspection elements at the end of each process. A go-no go gauge, a sample for minimum acceptable quality at each production process, and written specs sheets for accuracy were integrated within each process. Integrated quality efforts ensured elimination of rework, which resulted in increased material waste, energy consumption, CO2 emissions, cost factors, and non-value-added time. All these improvement efforts were galvanized with a new wood waste disposal method to reduce net energy footprint and gain further leverage in terms of negative CO2 emissions. The initial wood waste disposal method of landfilling was changed to the use of waste for co-generating heat. The wood waste generated in the form of wood dust, chips, and pieces was collected and sent to a residential building. Post-improvement LCA mapping accounted for the new disposal method. The residential building was 1.7 m away from the manufacturing facility and featured a central boiler wood furnace with a 170,000 Btu/h heat output capacity. The improved manufacturing system had an average of 9.85 lb (4.47 kg) of wood waste generation. One pound of mixed hardwood with 8% moisture content could be conservatively estimated, all inefficiencies considered and deducted, to have an average 6000 Btu heat generation potential [55]. Approximately 50% of household heating systems in the U.S. use natural gas, while 34% rely on electricity [56]. In an EPA-approved wood burner with an efficiency rate of 72%, a net of 42,552 Btu could be generated. One kilowatt hour of electricity is equivalent to 3400 Btu, and one cubic foot of natural gas is equivalent to around 1000 Btu [57]. Therefore, burning wood waste of the target facility could avoid consuming 12.51 kWh of electricity or 42.55 ft3 of natural gas. The associated annual cost savings based on 120 batches would be $105.68 or $39.83 based on the preferred alternative energy source at the current rates of $0.07/kwh and $0.0078/ft3 in the region, respectively. Moreover, LCA analysis accounting for the new disposal system yielded a negative CO2 emission value of 0.483 kg CO2 equi.
Finally, as fill-in improvement efforts, plastic packaging material was dropped and replaced with recycled kraft paper to enhance the public image of the organization and to increase the percentage of recycled and renewable material used for production. This also reduced the complexity of the bill-of-material from five materials to four materials and ensured increased leanness. A spray nozzle head was installed onto the bottle of mineral oil to achieve more controlled application. Based on data collected on a sample size of 50 cutting boards, both usage and waste amounts were tested against the initial known averages of 50.60 g and 25.00 g, respectively. With resolution levels (Δ) of 5.00 g and 1.00 g, post-improvement means were significantly less than pre-improvement averages at the 95% confidence level with p-values ≤ 0.001 and 1 − β = 100% power for both tests. Therefore, spray nozzle improvement was also kept in the system, and the cost of this improvement was $5.00. As a final remark of Step 5’s results, use of biodegradable materials (scrap wood material) in the design of new tools, guides, and supportive equipment where possible is worth exploring in the future.
5.4. Results of Step 6
Based on the findings of the first four steps of the Results section and the implemented and/or proposed improvement efforts discussed in Step 5, the three-ladder future state map was constructed and the engine of SBT was re-run to obtain post-improvement true sustainability performance of the target facility as given in Figure 27. The post-improvement assessment of the facility within the scope of the bronze frontier of SBT framework drew a strikingly different picture than the initial state. The TSI score was 9.06, while the FPI, EPI, and SPI scores were 8.41, 9.31, and 9.45, respectively. None of the pillars were system weakness anymore at the end of post-improvement assessment. TSI score increased 2.37 base points, whereas economic, environmental, and social performance scores increased by 1.69, 3.40, and 2.02 base points. None of the pre-improvement strengths and acceptably performing KPIs dropped below the strength or acceptability threshold of 9.00 and 7.00, respectively. This shows that deployed or proposed improvement ideas created no significant stress on economic, environmental, and social capabilities of the facility. Several pre-improvement system weaknesses turned into new strengths, and there is some room for improvement in few others. For instance, the VAC ratio increased from 4.62 to 5.82, but it is still below the acceptability threshold of 7.00. Moreover, the net profit margin score jumped from 1.00 to 4.62, yet still remained as a weakness. However, the achieved profit margin quadrupled the preset operating tolerance of 10.69% and netted around 46.23%. On the other hand, the new VATR ratio of 32.17% granted an index score of 10.00. In the pre-improvement state, the environmental performance module was where the worst performance scores were recorded. However, post-improvement scores were quite promising. Three previous weaknesses, namely net green area impact, net CO2 emission impact and net energy footprint yielded significantly different results with 10.00, 8.04, and 8.34 new index scores. One turned into a system strength, while the other two came significantly closer to the strength threshold of 9.00. With the help of the new wood waste disposal method, net energy footprint spiked to its new performance score, and decreased net CO2 emissions were a result of the collective function of decreased energy consumption, waste reduction, and re-allocation. Appendix H shows the raw LCA results of the post-improvement state. Within the scope of the social performance module, only observed system weakness of the pre-improvement state was eliminated and turned into a strength with a temporary solution and a pending the long-term recruiting and hiring policy proposal. Contribution to society ratio decreased by 1.39 base points due to the total cost of improvement efforts ($9751.20). However, it remained at an acceptable level with an index score of 7.23.
More close-up investigation of the post-improvement state provided us with interesting insights into the new state of the target facility. For enhanced visualization, Pareto charts of major defect types and new cost factors, as well as the plot of the process cycle and machine times can be seen in Figure 28A–C. The largest cost factor, labor cost, decreased from $109.20/batch to $62.59/batch. Material cost per batch was also decreased by $11.94. These 42.68% and 41.14% reduction values were key to turning around financial loss and generating profit for the facility. Transportation and energy cost had lesser impact in both the pre- and post-improvement states when compared to the other two cost factors, but they also decreased by 32.00% and 39.77%, respectively, as can be seen in Figure 28A. To better document the final process capability, a binomial final defect rate capability analysis was run on 30 post-improvement batches, and a Process Z score of 1.83 was obtained. The 95% confidence intervals for the new defect rate of 3.33% were 1.23 and 7.11. A sigma quality level of two is an indicator of room for improvement in this category. In the post-improvement state, only six boards out of 180 were defective. This included four CNC, one knife mark, and one raw material-related lumber defect, as shown in Figure 28B. Cycle times for Processes 2, 4, 6 (original 7), and 7 (original 8) dropped down from 22.09, 1455.58, 16.14, and 98.21 min to 13.83, 137.18, 9.82, and 30.68 min, respectively. Time reduction in Process 2 was mainly due to new material input specs for wood material, 5S deployment in the storage area, and new process flow to maximize yield and efficiency. Process 4 achieved a 90.58% cycle time reduction as a function of RF glue curing improvement, whereas Processes 6 and 7 owed their new time efficiency to the machine and setup time reductions. As can be seen in Figure 28C, cycle times were shortened across the facility as a function of minimized travel and motion waste with the new layout proposition. At the end, both VAT and NVAT were reduced by 47.92% and 89.30%, respectively. No yield analysis was required since the new state of the system was quite robust following the implementation of new wood material input procedures for procurement, material picking from storage, and release to the production line. As shown in Figure 27, total lead time decreased to 4.09 h from 28.48 h. The overall defect rate went down to 3.33% while rolling throughput yield increased to 41.46%. Even though, the new defect rate still fell short of the initial voice of the internal customer (management), 1%, and established the new operating tolerance of a 90% reduction from the pre-improvement state. It approximated the target value with a reduction rate of 87.58%. A similar pattern was observed for VAC and NVAC with reduction percentages of 43.03 and 64.77. Excessive energy consumption of the CNC processing, laser engraving, jointing, and planing operations were addressed through either better equipment utilization or proper material input. Increased material usage efficiency paid back strongly and reduced transportation-related CO2 emission impact by 49.26%. Total CO2 emission impact also decreased by 55.16% from the pre-improvement state of 27.34 kg CO2. Total solid waste generation was 4.69 kg, which was 72.03% less than that of the pre-improvement state. On the other hand, net water footprint did not change and had the same impact of 2.38 gallon as in the pre-improvement state.
Furthermore, the drastic impact of WERAR penalty coefficients on environmental and social sustainability performance was removed by effective precautions implemented for the noise and exposure to hazardous materials risk categories. In the post-improvement state, all dB(A) levels were calculated to be below 80 dB, and no wood dust-related complaints were voiced by workers during production of 30 post-improvement batches. Consequently, post-improvement SBT modules and other capability analysis showed that the target facility had improved significantly when compared to the conditions of the pre-improvement state. One should remember that sustainability is not a destination, but a never-ending journey, as is the case with lean transformation studies. Therefore, this cycle should be repeated until true sustainability is reached. Such repetition will also ensure maintenance and sustainability of gains obtained in previous cycles by constantly keeping an eye on all operational activities. The facility gained significant capability to operate with less input to generate the same amount of throughput with minimal drastic impacts on economic prosperity, environmental protection, and social equity purposes.
6. Limitations of the Study
This study validated the SBT framework at the facility level within the context of an SME. Even a small-scale deployment of the SBT framework took around six months, excluding pre-improvement data collection efforts. Therefore, within the context of large corporations or supply chains, this may be intensive in terms of required monetary and non-monetary resources. The target facility had a limited and controllable amount of complexity and was able to accommodate lengthy scientific experiments. In a different industrial setting with increased complexity of products and services, the work schedule and varying cooperation of workforce could hinder accurate data collection and effective deployment of the SBT framework. Successful deployment of the SBT framework requires complete understanding of the underlying methodology, namely lean, sustainability, six-sigma, and LCA, which can be expensive and time consuming to develop. LCA outputs are subject to data availability in the Ecoinvent 3.4 database and can generate subjective results. Finally, the impact of the SBT framework deployment on other supply chain members has not been assessed and needs to be explored before drawing certain conclusions about the wide-spread impact of its full deployment.
7. Conclusions and Future Research Directions
The SBT framework succeeded in delivering empirical proof that synergies between the lean philosophy, triple bottom line sustainability, six-sigma quality control, and the LCA methodology outperformed the divergences among them and could be used to measure true sustainability. This study also provided a validation of the SBT framework as a tool that can be employed to increase economic, environmental, and social performance in facilities, organizations, and supply chains across diverse industries. This study also documented that wood processing industries benefit in terms of sustainability measurements by using wood, the only feasible construction material that is entirely renewable, recyclable, and biodegradable. We were able to show that even the smallest steps towards true sustainability result in considerable gains across all three pillars. Therefore, investments made in sustainability are never wasted when a methodical approach like the SBT framework is followed.
The validity and reliability of the SBT framework was backed by empirical evidence from a case study in the value-added wood products’ industry. Such a method was considered to be a proper methodology for validation of similar frameworks as highlighted by Ben Ruben et al. (2017) [58]. The success of this study on the proper validation of the SBT framework could be deemed satisfactory since Dubey and Gunesakaran (2015) [59] and Duarte and Cruz Machado (2017) [60] validated their agile manufacturing system and integrated green-lean frameworks through documentation of case study-based empirical evidence. As documented in the Results section, if the contingency of the target industry and organization is well understood, the SBT framework could effectively yield reliable results in terms of sustainability performance improvements. The proposed framework could help industry members with the elimination of chronic economic, environmental, and social sustainability issues if properly deployed.
Future research opportunities for using the SBT framework are numerous. Deployment of the framework onto the company’s supply chain partners would be a good starting point. Additional assessment and improvement of the company and its facilities at the silver and gold frontier maturity levels would result in further incremental gains. Differences between co-deployment and consecutive deployment of the SBT framework onto members of a supply chain, assessment and comparison of gains through successful deployment of the SBT framework within different sectors, and comparisons of short-term and long-term gain curves for organizations and supply chain level operations are future topics of interest. Finally, improvement and integration of the SBT framework user interface to ease data collection, computation, and presentation would increase its user friendliness.
Supplementary Materials
The following are available online at https://www.mdpi.com/2071-1050/11/8/2361/s1, Figure S1: Fishbone diagrams, Figure S2, Flagged failure modes, Figure S3, 5 Whys.
Author Contributions
Both C.T. and R.G. contributed to the design of the research and to the writing of final version of the manuscript. C.T. gathered data, performed the qualitative and quantitative analysis, drafted the manuscript and designed the figures and tables. R.G. supervised the entire work and proofread the drafted manuscript.
Funding
This research received no external funding.
Conflicts of Interest
The authors declare no conflict of interest.
Appendix A
Figure A1.
Suppliers of raw materials and cost associated with transportation and shipping activities.
Figure A1.
Suppliers of raw materials and cost associated with transportation and shipping activities.

Appendix B
Figure A2.
Material prices and labor cost.

Appendix C
Figure A3.
Probability/Risk matrix and control levels for the WERAR Module.

Appendix D
Figure A4.
SIPOC for cutting board manufacturing operations.

Appendix E
Figure A5.
Facility layout of the pre-improvement state.

Appendix F
Figure A6.
Facility layout for the post-improvement state.

Appendix G
Figure A7.
Photos of major defect types observed.

Appendix H
Figure A8.
Raw LCA results for the pre- and post-improvement states.

References
- Walker, L.L.; Wintzeus, R. Why, and how, companies create sustainability programs and appoint chief sustainability officers. Korn Ferry Inst. 2008, 1–8. Available online: https://www.leanbusinessireland.ie/includes/documents/Why_How_Companies_Create_Sustainability_Programs.pdf (accessed on 19 April 2019).
- WCED Our Common Future: Report of the World Commission on Environment and Development. Med. Confl. Surviv. 1987, 4, 300.
- Vimal, K.E.K.; Vinodh, S.; Gurumurthy, A. Modelling and analysis of sustainable manufacturing system using a digraph-based approach. Int. J. Sustain. Eng. 2017, 7038, 1–15. [Google Scholar]
- Murray, J.G. Effects of a green purchasing strategy: The case of Belfast City Council. Supply Chain Manag. Int. J. 2000, 5, 37–44. [Google Scholar] [CrossRef]
- Apple Inc. Environmental Responsibility Report 2018 Progress Report, Covering Fiscal Year 2017; Apple: Cupertino, CA, USA, 2018; Available online: https://www.apple.com/environment/pdf/Apple_Environmental_Responsibility_Report_2018.pdf (accessed on 8 August 2019).
- Oxford Economics. Google Data Centers: Economic Impact and Community Benefit; Oxford Economics: Oxford, UK, 2018. [Google Scholar]
- Noe, R.A.; Hollenbeck, J.R.; Gerhart, B.; Wright, P.M. Human Resource Management: Gaining a Competitive Advantage; McGraw-Hill Education: New York, NY, USA, 2017. [Google Scholar]
- Tasdemir, C.; Gazo, R. A Systematic Literature Review for Better Understanding of Lean Driven Sustainability. Sustainability 2018, 10, 2544. [Google Scholar] [CrossRef]
- Tasdemir, C.; Gazo, R.; Quesada-Pineda, H. Sustainability Benchmarking Tool (SBT)—Theoretical and Conceptual Model Proposition of a Composite Framework. Environ. Dev. Sustain. 2019. (forthcoming). [Google Scholar]
- Meyers, E.M. The Oxford Encyclopedia of Archaeology in the Near East; Oxford University Press: Oxford, UK, 1997; Volume 4. [Google Scholar]
- Pirraglia, A.; Saloni, D.; van Dyk, H. Status of lean manufacturing implementation on secondary wood industries including residential, cabinet, millwork, and panel markets. BioResources 2009, 4, 1341–1358. [Google Scholar]
- Forest Products Laboratory—USDA. Wood Handbook: Wood as an Engineering Material; USDA General Technical Report; Forest Products Laboratory—USDA: Madison, WI, USA, 2010; p. 508. [CrossRef]
- Profft, I.; Mund, M.; Weber, G.E.; Weller, E.; Schulze, E.D. Forest management and carbon sequestration in wood products. Eur. J. For. Res. 2009, 128, 399–413. [Google Scholar] [CrossRef] [Green Version]
- NIOSH. Occupational Noise Exposure Criteria for a Recommended Standard; NIOSH: Washington, DC, USA, 1998; pp. 98–126.
- European Commission. User Guide to the SME Definition; Publication Office of the European Union: Luxembourg, 2015. [Google Scholar]
- USITC. Small and Medium-Sized Enterprises: Overview of Participation in US Exports; USITC: Washington, DC, USA, 2010.
- Wernet, G.; Bauer, C.; Steubing, B.; Reinhard, J.; Moreno-Ruiz, E.; Weidema, B. The ecoinvent database version 3 (part I): overview and methodology. Int. J. Life Cycle Assess. 2016, 21, 1218–1230. [Google Scholar] [CrossRef]
- Mutel, C. Brightway: An open source framework for life cycle assessment. J. Open Source Softw. 2017, 12, 2. [Google Scholar] [CrossRef]
- Bare, J.C. TRACI: The tool for the reduction and assessment of chemical and other environmental impacts. J. Ind. Ecol. 2002, 6, 49–78. [Google Scholar] [CrossRef]
- Bare, J. TRACI 2.0: The tool for the reduction and assessment of chemical and other environmental impacts 2.0. Clean Technol. Environ. Policy 2011, 13, 687–696. [Google Scholar] [CrossRef]
- Vinodh, S.; Ben Ruben, R.; Asokan, P. Life cycle assessment integrated value stream mapping framework to ensure sustainable manufacturing: A case study. Clean Technol. Environ. Policy 2016, 18, 279–295. [Google Scholar] [CrossRef]
- US Department of Energy. Determining Electric Motor Load and Efficiency; US Department of Energy: Washington, DC, USA, 1997.
- Van Der Lugt, P. Carbon Storage Utilising Timber Products. Available online: https://www.accoya.com/wp-content/uploads/2013/09/Carbon-Storage-using-Timber-Products.pdf (accessed on 19 April 2019).
- Graves, S. Six Sigma Rolled Throughput Yield. Qual. Eng. 2002, 14, 257–266. [Google Scholar] [CrossRef]
- Ng, R.; Low, J.S.C.; Song, B. Integrating and implementing Lean and Green practices based on proposition of Carbon-Value Efficiency metric. J. Clean. Prod. 2015, 95, 242–255. [Google Scholar] [CrossRef]
- Shannon, P. The Value-Added Ratio; ASQ: Millwaukee, WI, USA, 1997; pp. 94–97. [Google Scholar]
- Myerson, P. Lean Supply Chain and Logistics Management, 1st ed.; McGraw Hill: New York, NY, USA, 2012; ISBN 978-0071766265. [Google Scholar]
- Magoon, L.M. Dictionary of Financial Formulas and Ratios; Global Professional Publishing: London, UK, 2008. [Google Scholar]
- Peterson-Drake, P. Financial Ratio Formulas. Available online: http://educ.jmu.edu/~drakepp/principles/module2/fin_formulas.pdf (accessed on 9 September 2018).
- OECD. OECD Sustainable Manufacturing Toolkit—Seven Steps to Environmental Excellence—Start Up Guide; OECD: Paris, France, 2011. [Google Scholar]
- GRI. 304-2/3 GRI-304-Biodiversity; Global Reporting Initiative: Amsterdam, The Netherlands, 2016. [Google Scholar]
- GRI. 305 GRI 305: Emissions; Global Reporting Initiative: Amsterdam, The Netherlands, 2016. [Google Scholar]
- US EPA. Lean and Water Toolkit; US EPA: Washington, DC, USA, 2011; Volume 108.
- GRI 303. GRI 303: Water; Global Reporting Initiative: Amsterdam, The Netherlands, 2018. [Google Scholar]
- Kim, D.B.; Leong, S.; Chen, C.-S. An Overview of Sustainability Indicators and Metrics for Discrete Part Manufacturing. In Proceedings of the ASME 2012 International Design Engineering Technical Conferences and Computers and Information in Engineering Conference, Chicago, IL, USA, 12–15 August 2012; Volume 2, pp. 1173–1181. [Google Scholar]
- Faulkner, W.; Badurdeen, F. Sustainable Value Stream Mapping (Sus-VSM): Methodology to visualize and assess manufacturing sustainability performance. J. Clean. Prod. 2014, 85, 8–18. [Google Scholar] [CrossRef]
- GRI 302-1. GRI-302-Energy; Global Reporting Initiative: Amsterdam, The Netherlands, 2016. [Google Scholar]
- GRI 306. GRI 306: Effluents and Waste; Global Reporting Initiative: Amsterdam, The Netherlands, 2016. [Google Scholar]
- Helleno, A.L.; de Moraes, A.J.I.; Simon, A.T.; Helleno, A.L. Integrating sustainability indicators and Lean Manufacturing to assess manufacturing processes: Application case studies in Brazilian industry. J. Clean. Prod. 2017, 153, 405–416. [Google Scholar] [CrossRef]
- AlJaberi, O.A.; Hussain, M.; Drake, P.R. A framework for measuring sustainability in healthcare systems. Int. J. Healthc. Manag. 2017, 1–10. [Google Scholar] [CrossRef]
- GRI 413-1. GRI-413—Local Communities; Global Reporting Initiative: Amsterdam, The Netherlands, 2016. [Google Scholar]
- Ocampo, L.; Vergara, V.G.; Impas, C.; Tordillo, J.A.; Pastoril, J. Identifying Critical Indicators In Sustainable Manufacturing Using Analytic Hierarchy Process (AHP). Manuf. Ind. Eng. 2015, 14, 1–8. [Google Scholar] [CrossRef]
- GRI 403-2. GRI 403: Occupational Health and Safety; Global Reporting Initiative: Amsterdam, The Netherlands, 2016. [Google Scholar]
- GRI 405. GRI-405:Diversity-and-Equal-Opportunity-2016; Global Reporting Initiative: Amsterdam, The Netherlands, 2016. [Google Scholar]
- Wiedenbeck, J. Factors that Impact Rough Mill Yield and Value; USDA: Washington, DC, USA, 2001.
- Tague, N.R. The Quality Toolbox, 2nd ed.; ASQ Quality Press: Milwaukee, WI, USA, 2005. [Google Scholar]
- U.S. EIA. Indiana State Energy Profile. Available online: https://www.eia.gov/state/print.php?sid=IN (accessed on 10 September 2018).
- Bell, J.E.; Autry, C.W.; Mollenkopf, D.A.; Thornton, L.M. A natural resource scarcity typology: Theoretical foundations and strategic implications for supply chain management. J. Bus. Logist. 2012, 33, 158–166. [Google Scholar] [CrossRef]
- CSIMarket Forestry and Wood Products Market Profitability. Available online: https://csimarket.com/Industry/industry_Profitability_Ratios.php?ind=105andhist=1 (accessed on 3 February 2019).
- INRF. IDNR Indiana Tree Project. Available online: https://www.indianatreeproject.com/ (accessed on 15 January 2019).
- Jackson, D.; Lunt, R. Forest Landowners Guide to Internet Resources. Available online: http://www.forestenterprise.org/resources/Forestry/Forest%20Landowners%20Guide%20to%20Internet%20Resources.pdf (accessed on 19 April 2019).
- Wisconsin DNR Forestry Nursery. Creating a Forest: A Step-by-Step Guide to Planting and Maintaining Trees; University of Wisconsin–Extension: Madison, WI, USA, 2008. [Google Scholar]
- Simons, D.; Mason, R. Lean and green: ‘Doing more with less’. ECR J. 2003, 3, 84–91. [Google Scholar]
- Franklin International. Calculations for Wood Gluing; Franklin International: Columbus, OH, USA, 2017. [Google Scholar]
- Stelzer, H. Wood Fuel for Heating. 2017; Available online: https://extensiondata.missouri.edu/pub/pdf/agguides/forestry/g05450.pdf?_ga=2.203752339.2024102973.1554826086-689176406.1554826086 (accessed on 19 January 2019).
- U.S. Departament of Energy. 2011 Buildings Energy Data Book; Office of Energy Efficiency & Renewable Energy: Washington, DC, USA, 2012; pp. 1–81.
- Kays, J. Heating with Wood. North Am. Rev. 2010, 266, 26–28. [Google Scholar]
- Ben Ruben, R.; Vinodh, S.; Asokan, P. Implementation of Lean Six Sigma framework with environmental considerations in an Indian automotive component manufacturing firm: A case study. Prod. Plan. Control 2017, 28, 1193–1211. [Google Scholar] [CrossRef]
- Dubey, R.; Gunasekaran, A. Agile manufacturing: Framework and its empirical validation. Int. J. Adv. Manuf. Technol. 2015, 76, 2147–2157. [Google Scholar] [CrossRef]
- Duarte, S.; Cruz Machado, V. Green and lean implementation: An assessment in the automotive industry. Int. J. Lean Six Sigma 2017, 8, 65–88. [Google Scholar] [CrossRef]
Figure 1.
Bill of materials (BOM) for hardwood cutting boards.

Figure 2.
Pre-improvement process flow for cutting board manufacturing.

Figure 3.
Simplified supply chain structure of the target organization.

Figure 4.
(A) Measurement system analysis for overall defective production and product dimension measurements; (B) measurement system analysis (MSAs) for noise dB recordings, waste amount, and time studies.
Figure 4.
(A) Measurement system analysis for overall defective production and product dimension measurements; (B) measurement system analysis (MSAs) for noise dB recordings, waste amount, and time studies.


Figure 5.
SBT interface for the current state with identified strengths and weaknesses of the system. TSI, true sustainability index.
Figure 5.
SBT interface for the current state with identified strengths and weaknesses of the system. TSI, true sustainability index.

Figure 6.
Capability analysis for defect rate (A) and yield performance (B).

Figure 7.
Pareto charts of defects (A), distribution of expenses per batch across cost factors (B), and plot of cycle time and machine time per process for the pre-improvement state (C).
Figure 7.
Pareto charts of defects (A), distribution of expenses per batch across cost factors (B), and plot of cycle time and machine time per process for the pre-improvement state (C).

Figure 8.
Hypothesis test results for the impact of cup and crook presence in lumber on processing time to obtainment of sticks.
Figure 8.
Hypothesis test results for the impact of cup and crook presence in lumber on processing time to obtainment of sticks.

Figure 9.
Screening experiment for knife marks and wood split issues.

Figure 10.
Hypothesis test results for the impact of the operator and glue applicator tip on glue usage, waste, and application time.
Figure 10.
Hypothesis test results for the impact of the operator and glue applicator tip on glue usage, waste, and application time.

Figure 11.
Chi-square test for association on faulty sticks layout.

Figure 12.
Results of Poisson regression for suction loss-caused issues and Mood’s median test for edge defects.
Figure 12.
Results of Poisson regression for suction loss-caused issues and Mood’s median test for edge defects.

Figure 13.
Results of regression analysis on displacement- and alignment-caused issues in Process 8.
Figure 13.
Results of regression analysis on displacement- and alignment-caused issues in Process 8.

Figure 14.
Response Optimizer results for count of knife marks.

Figure 15.
Response Optimizer results for the count of CNC defects.

Figure 16.
Response Optimizer results for displacement due to laser head-induced excess vibration.

Figure 17.
Response Optimizer results for faulty species layout.

Figure 18.
Response Optimizer results for glue usage, waste, and application time.

Figure 19.
Impact/effort matrix for the generated improvement ideas.

Figure 20.
Illustration of the new task distribution policy to achieve a balanced gender bias ratio for the manufacturing line.
Figure 20.
Illustration of the new task distribution policy to achieve a balanced gender bias ratio for the manufacturing line.

Figure 21.
Enforced hearing protection devices (HPDs) (A,B) and dust mask (C) to address worker health and safety issues. NRR, noise reduction rating.
Figure 21.
Enforced hearing protection devices (HPDs) (A,B) and dust mask (C) to address worker health and safety issues. NRR, noise reduction rating.

Figure 22.
New material input system for procurement, picking, and release activities.

Figure 23.
Post-improvement process map illustrating the new process flow.

Figure 24.
Before and after 5S state of conditioned storage room and close-up photo of KANBAN post.

Figure 25.
New alignment guide to be used during CNC processing of cutting boards.

Figure 26.
The new board placement guide and blocks for securing the base.

Figure 27.
Post-improvement SBT interface with identified weaknesses and strengths of the system.

Figure 28.
Pareto charts for cost factors (A) and defect types (B) and plot of cycle time and machine time per process (C).
Figure 28.
Pareto charts for cost factors (A) and defect types (B) and plot of cycle time and machine time per process (C).


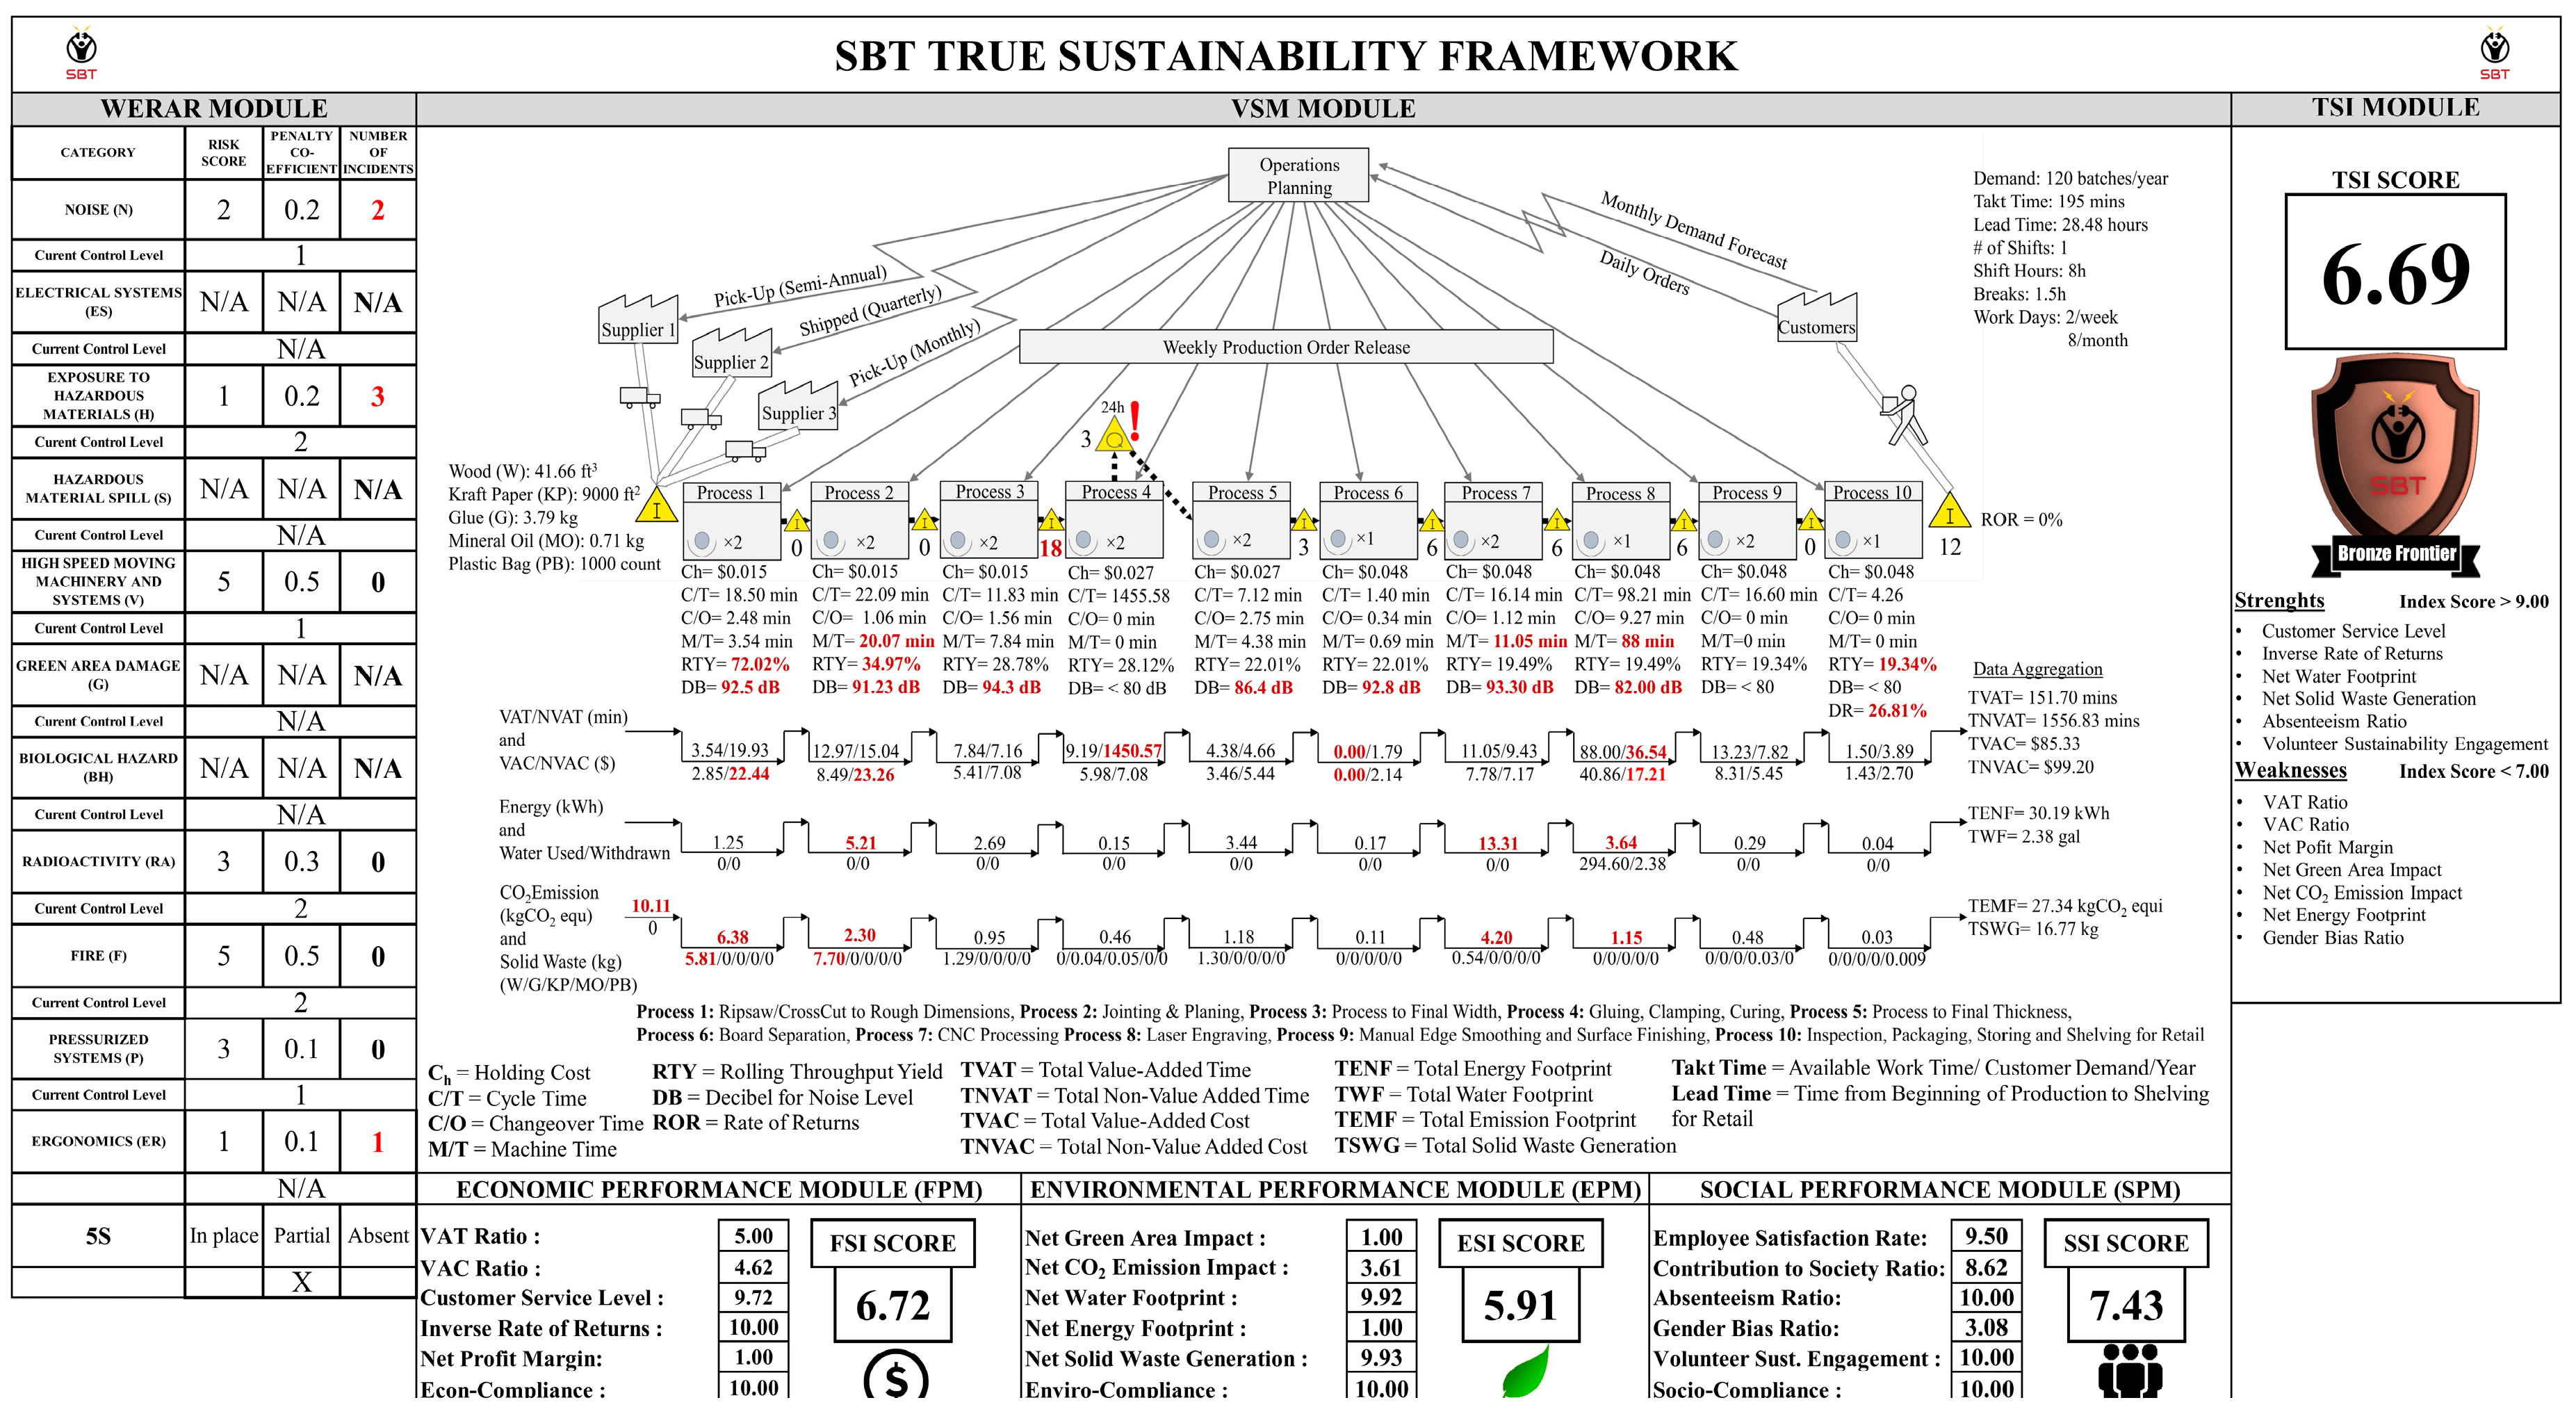
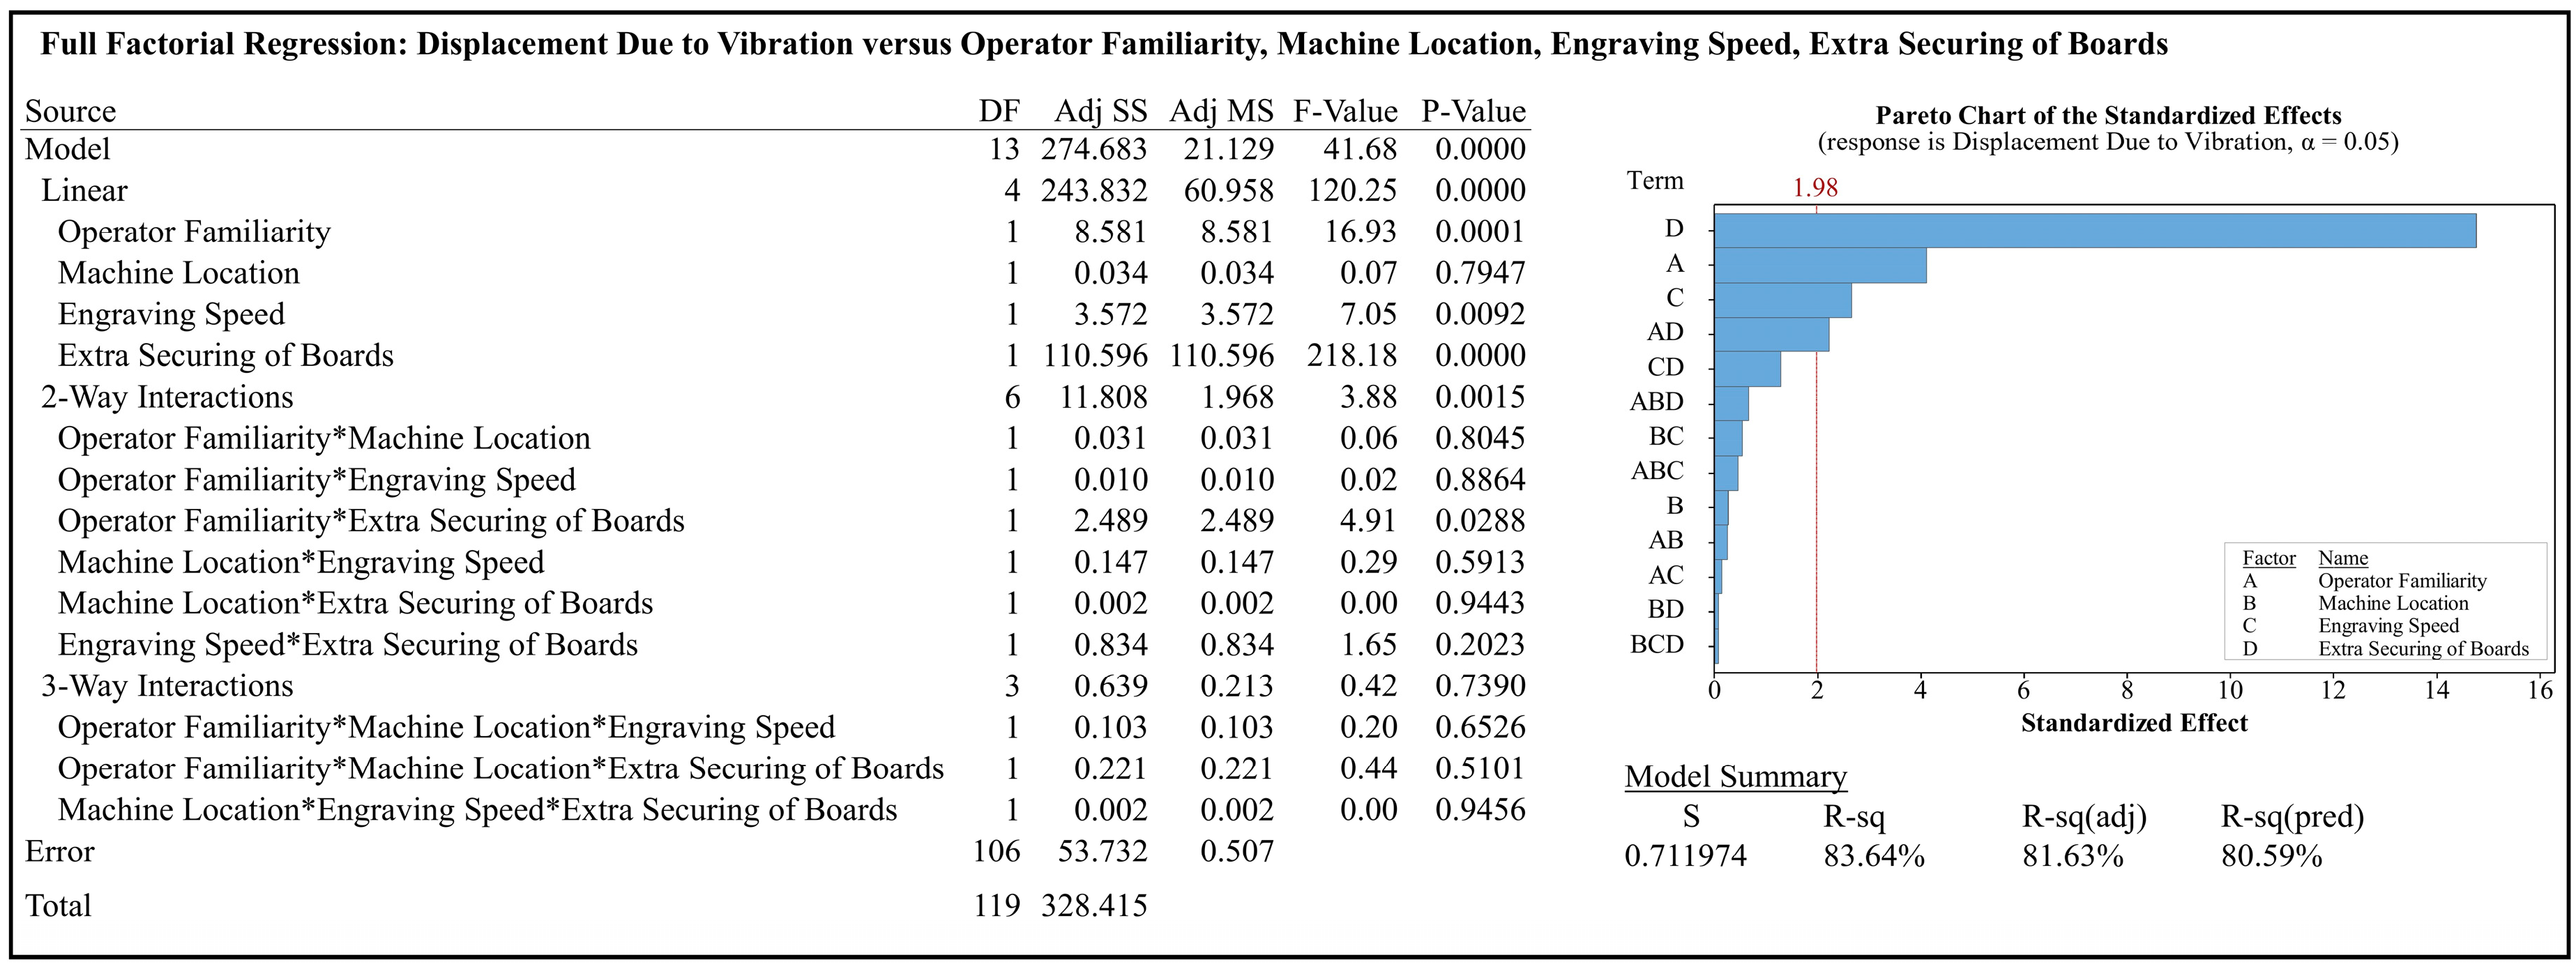
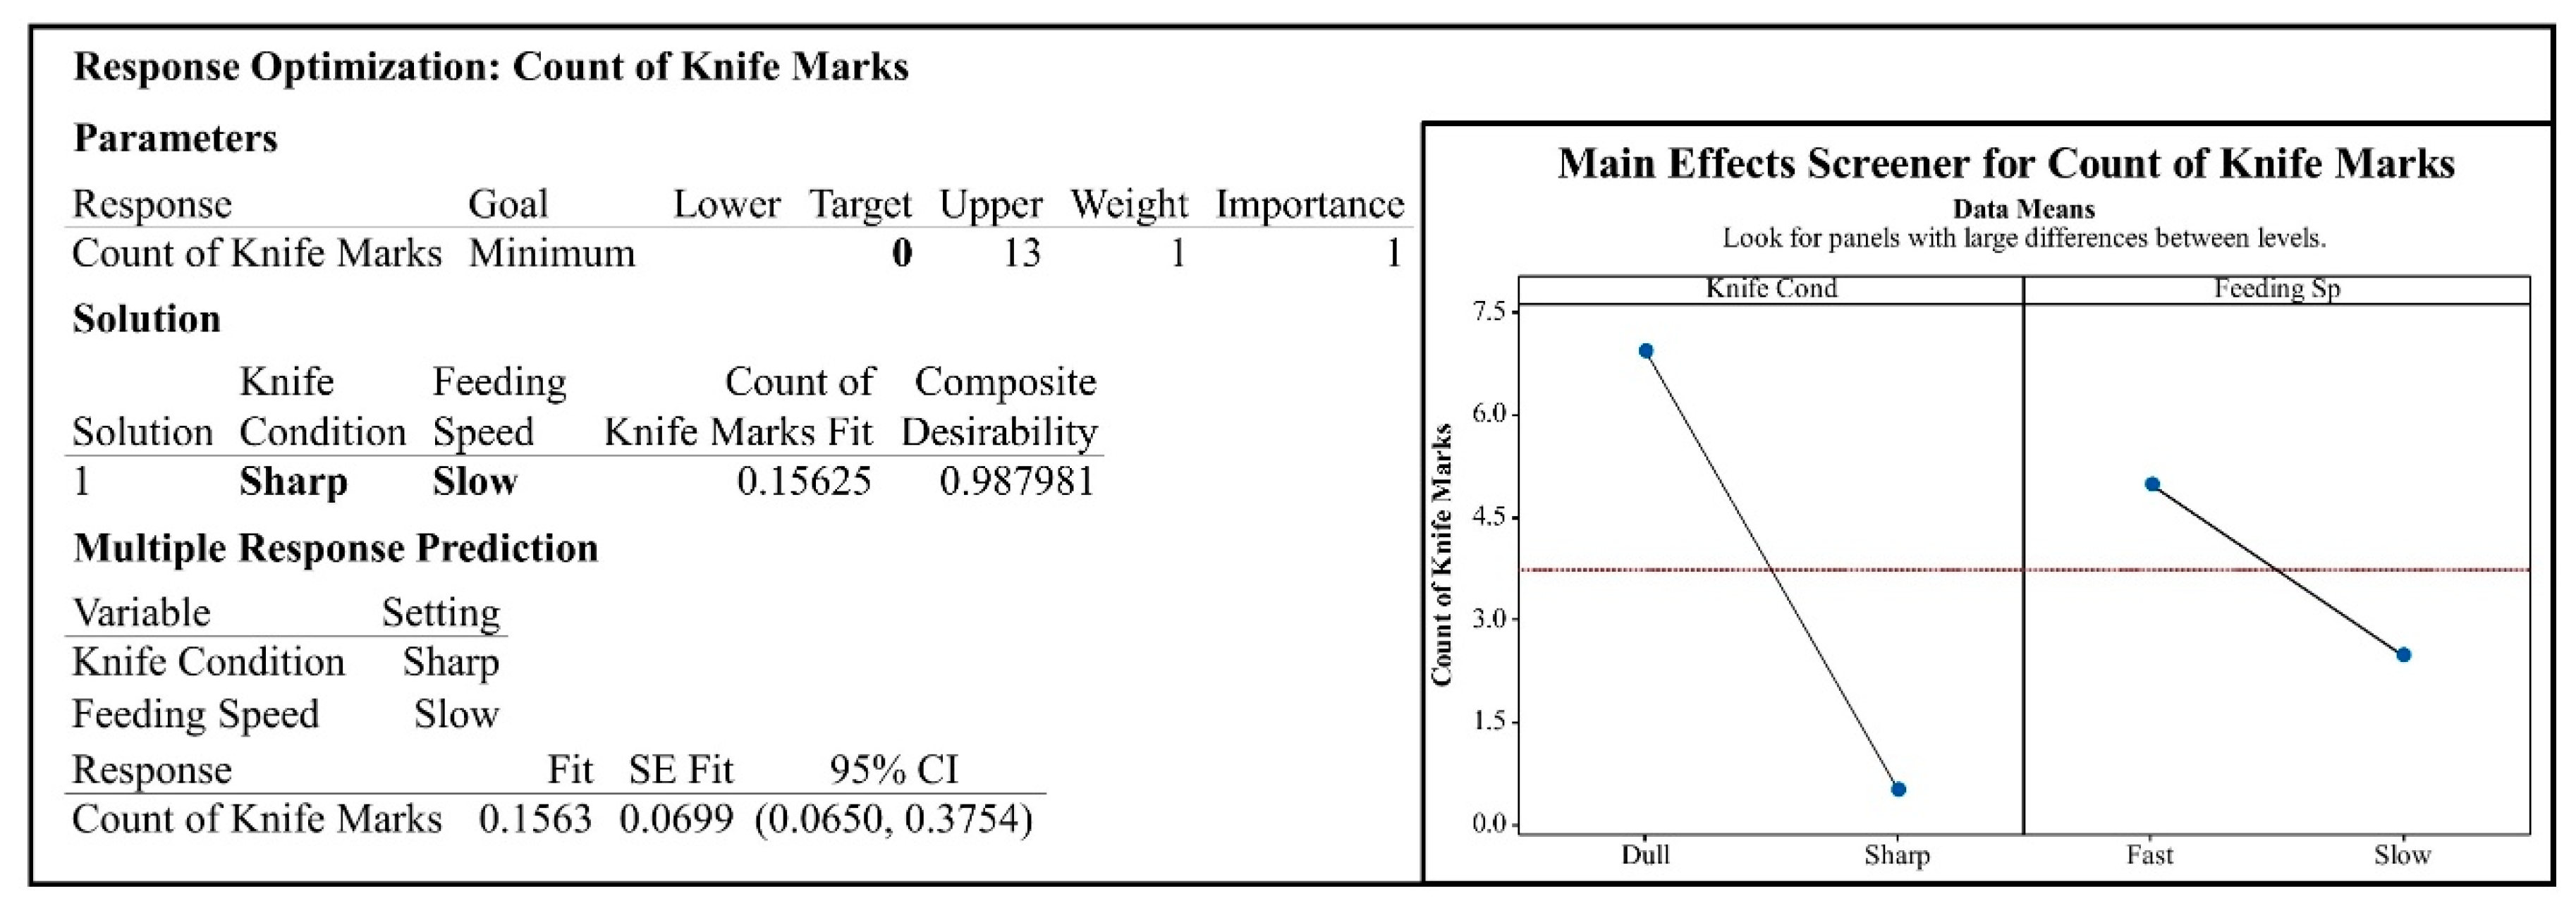
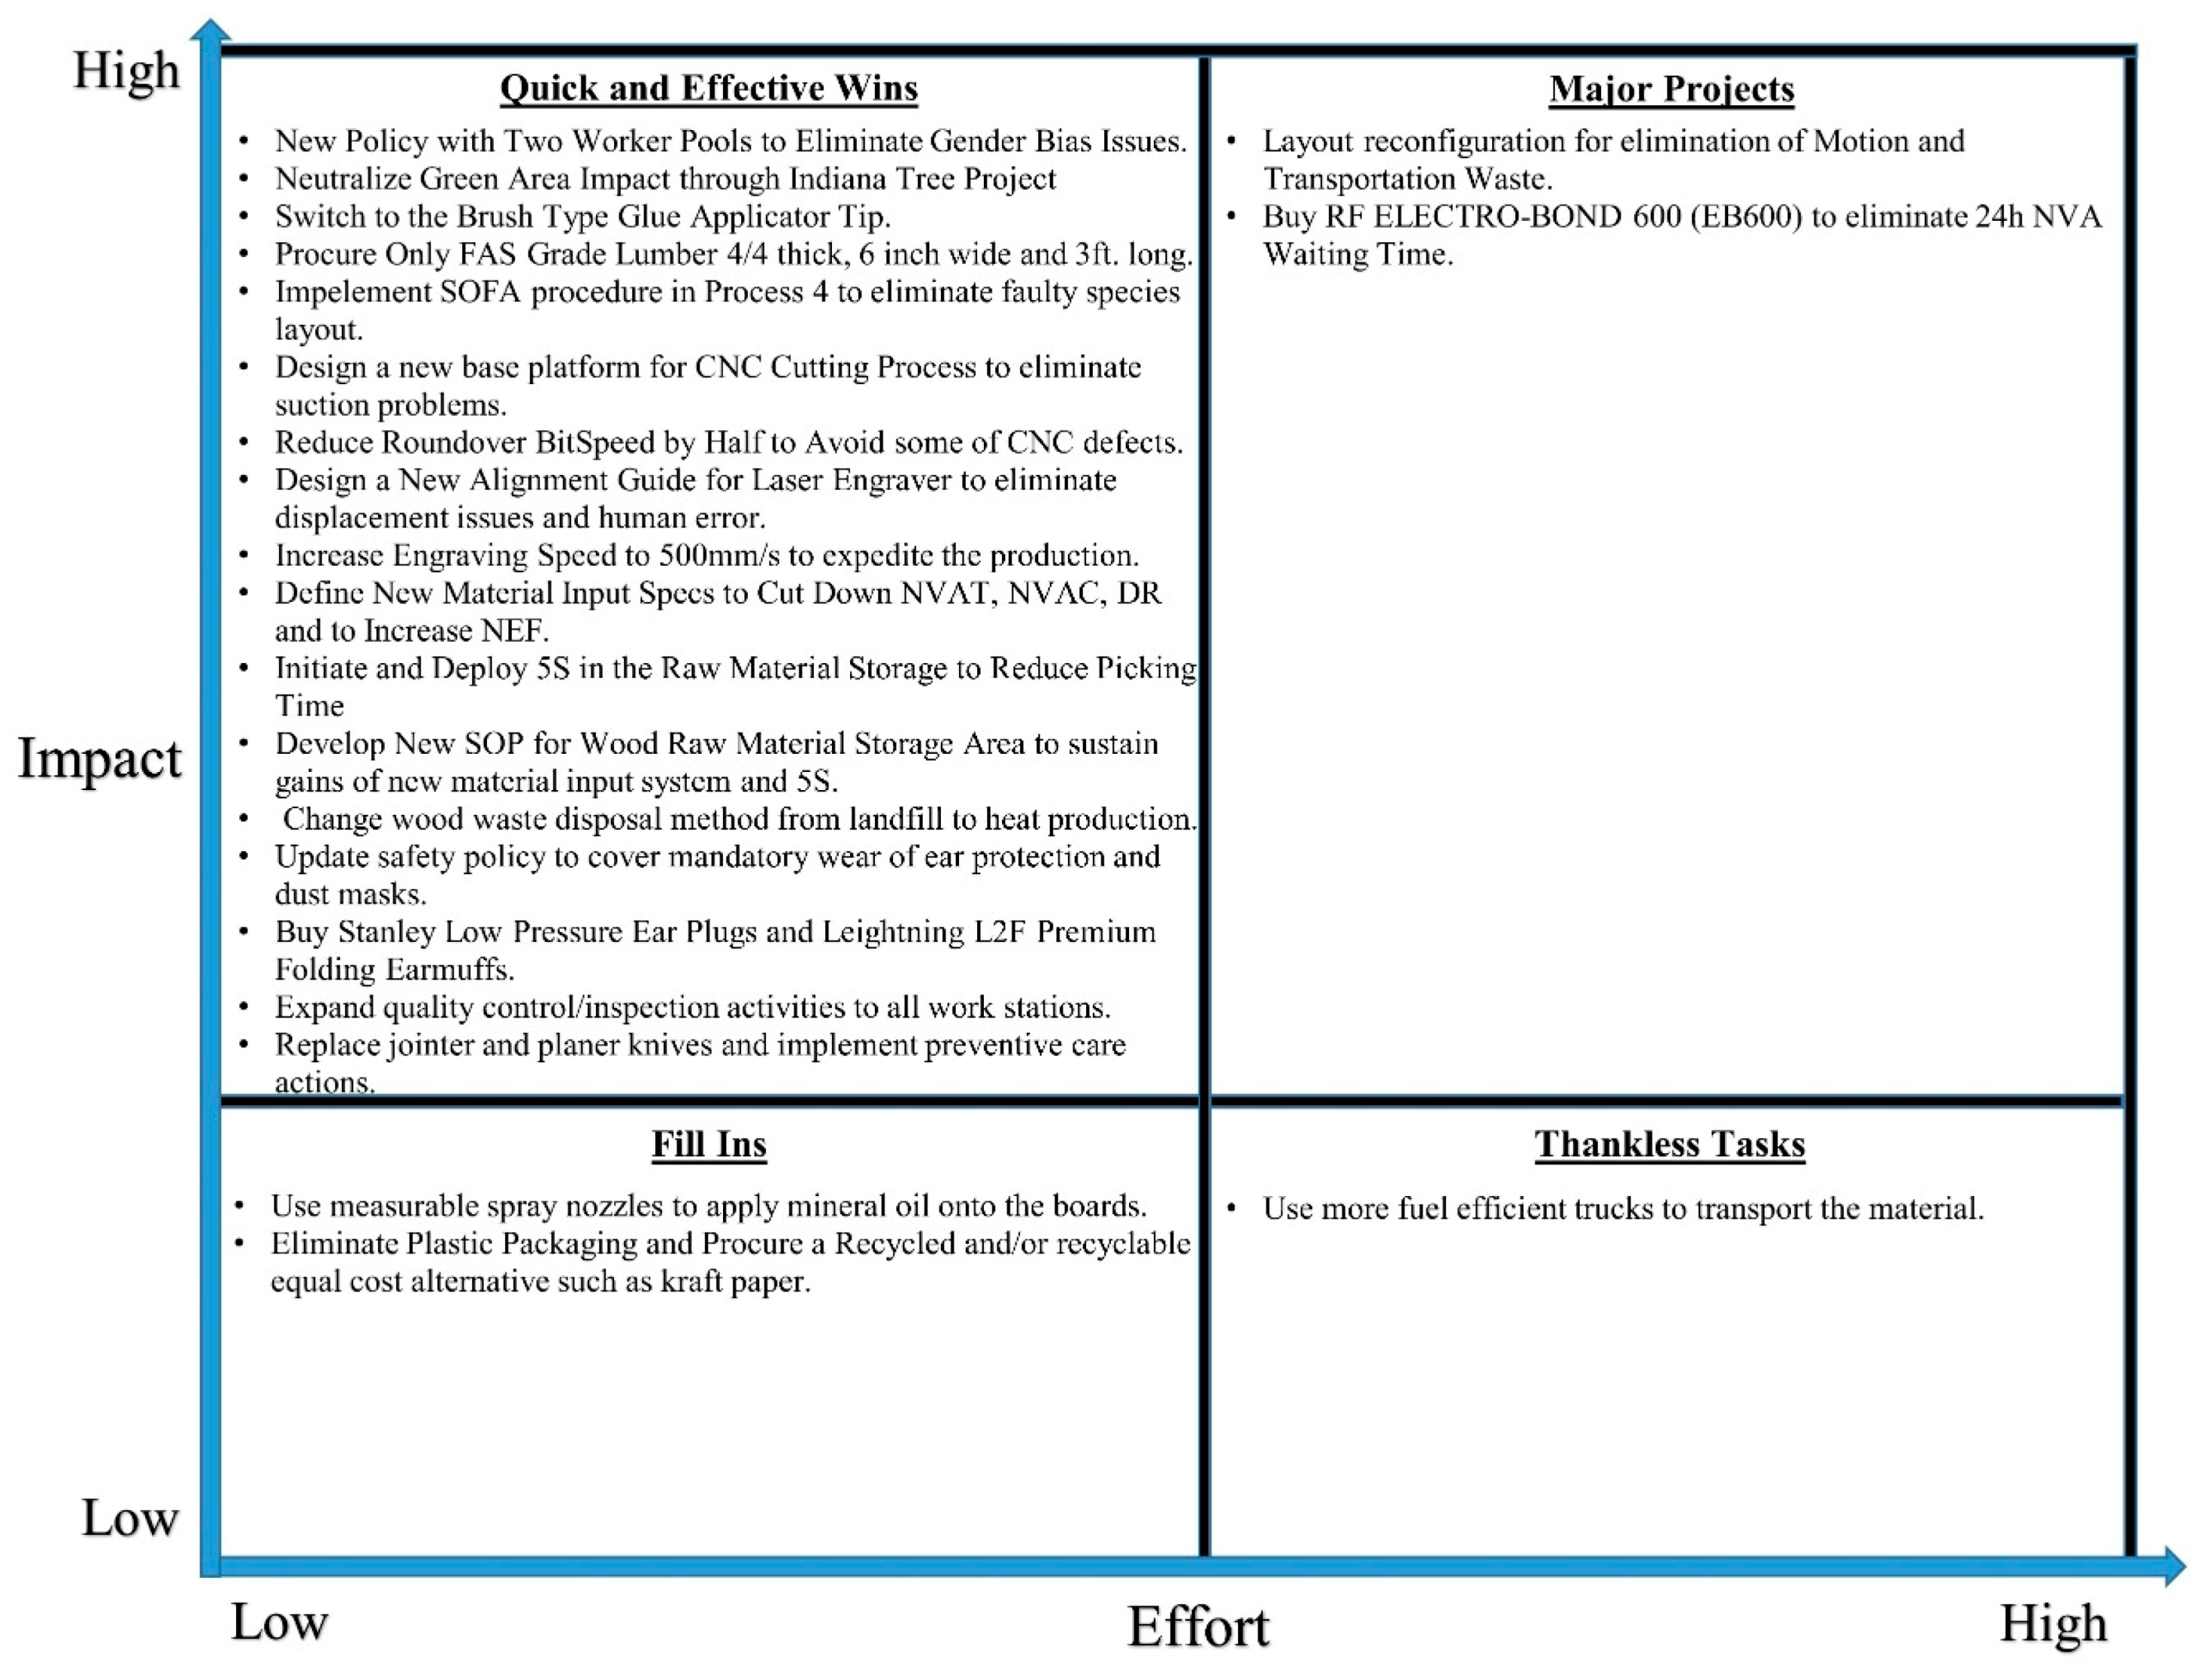
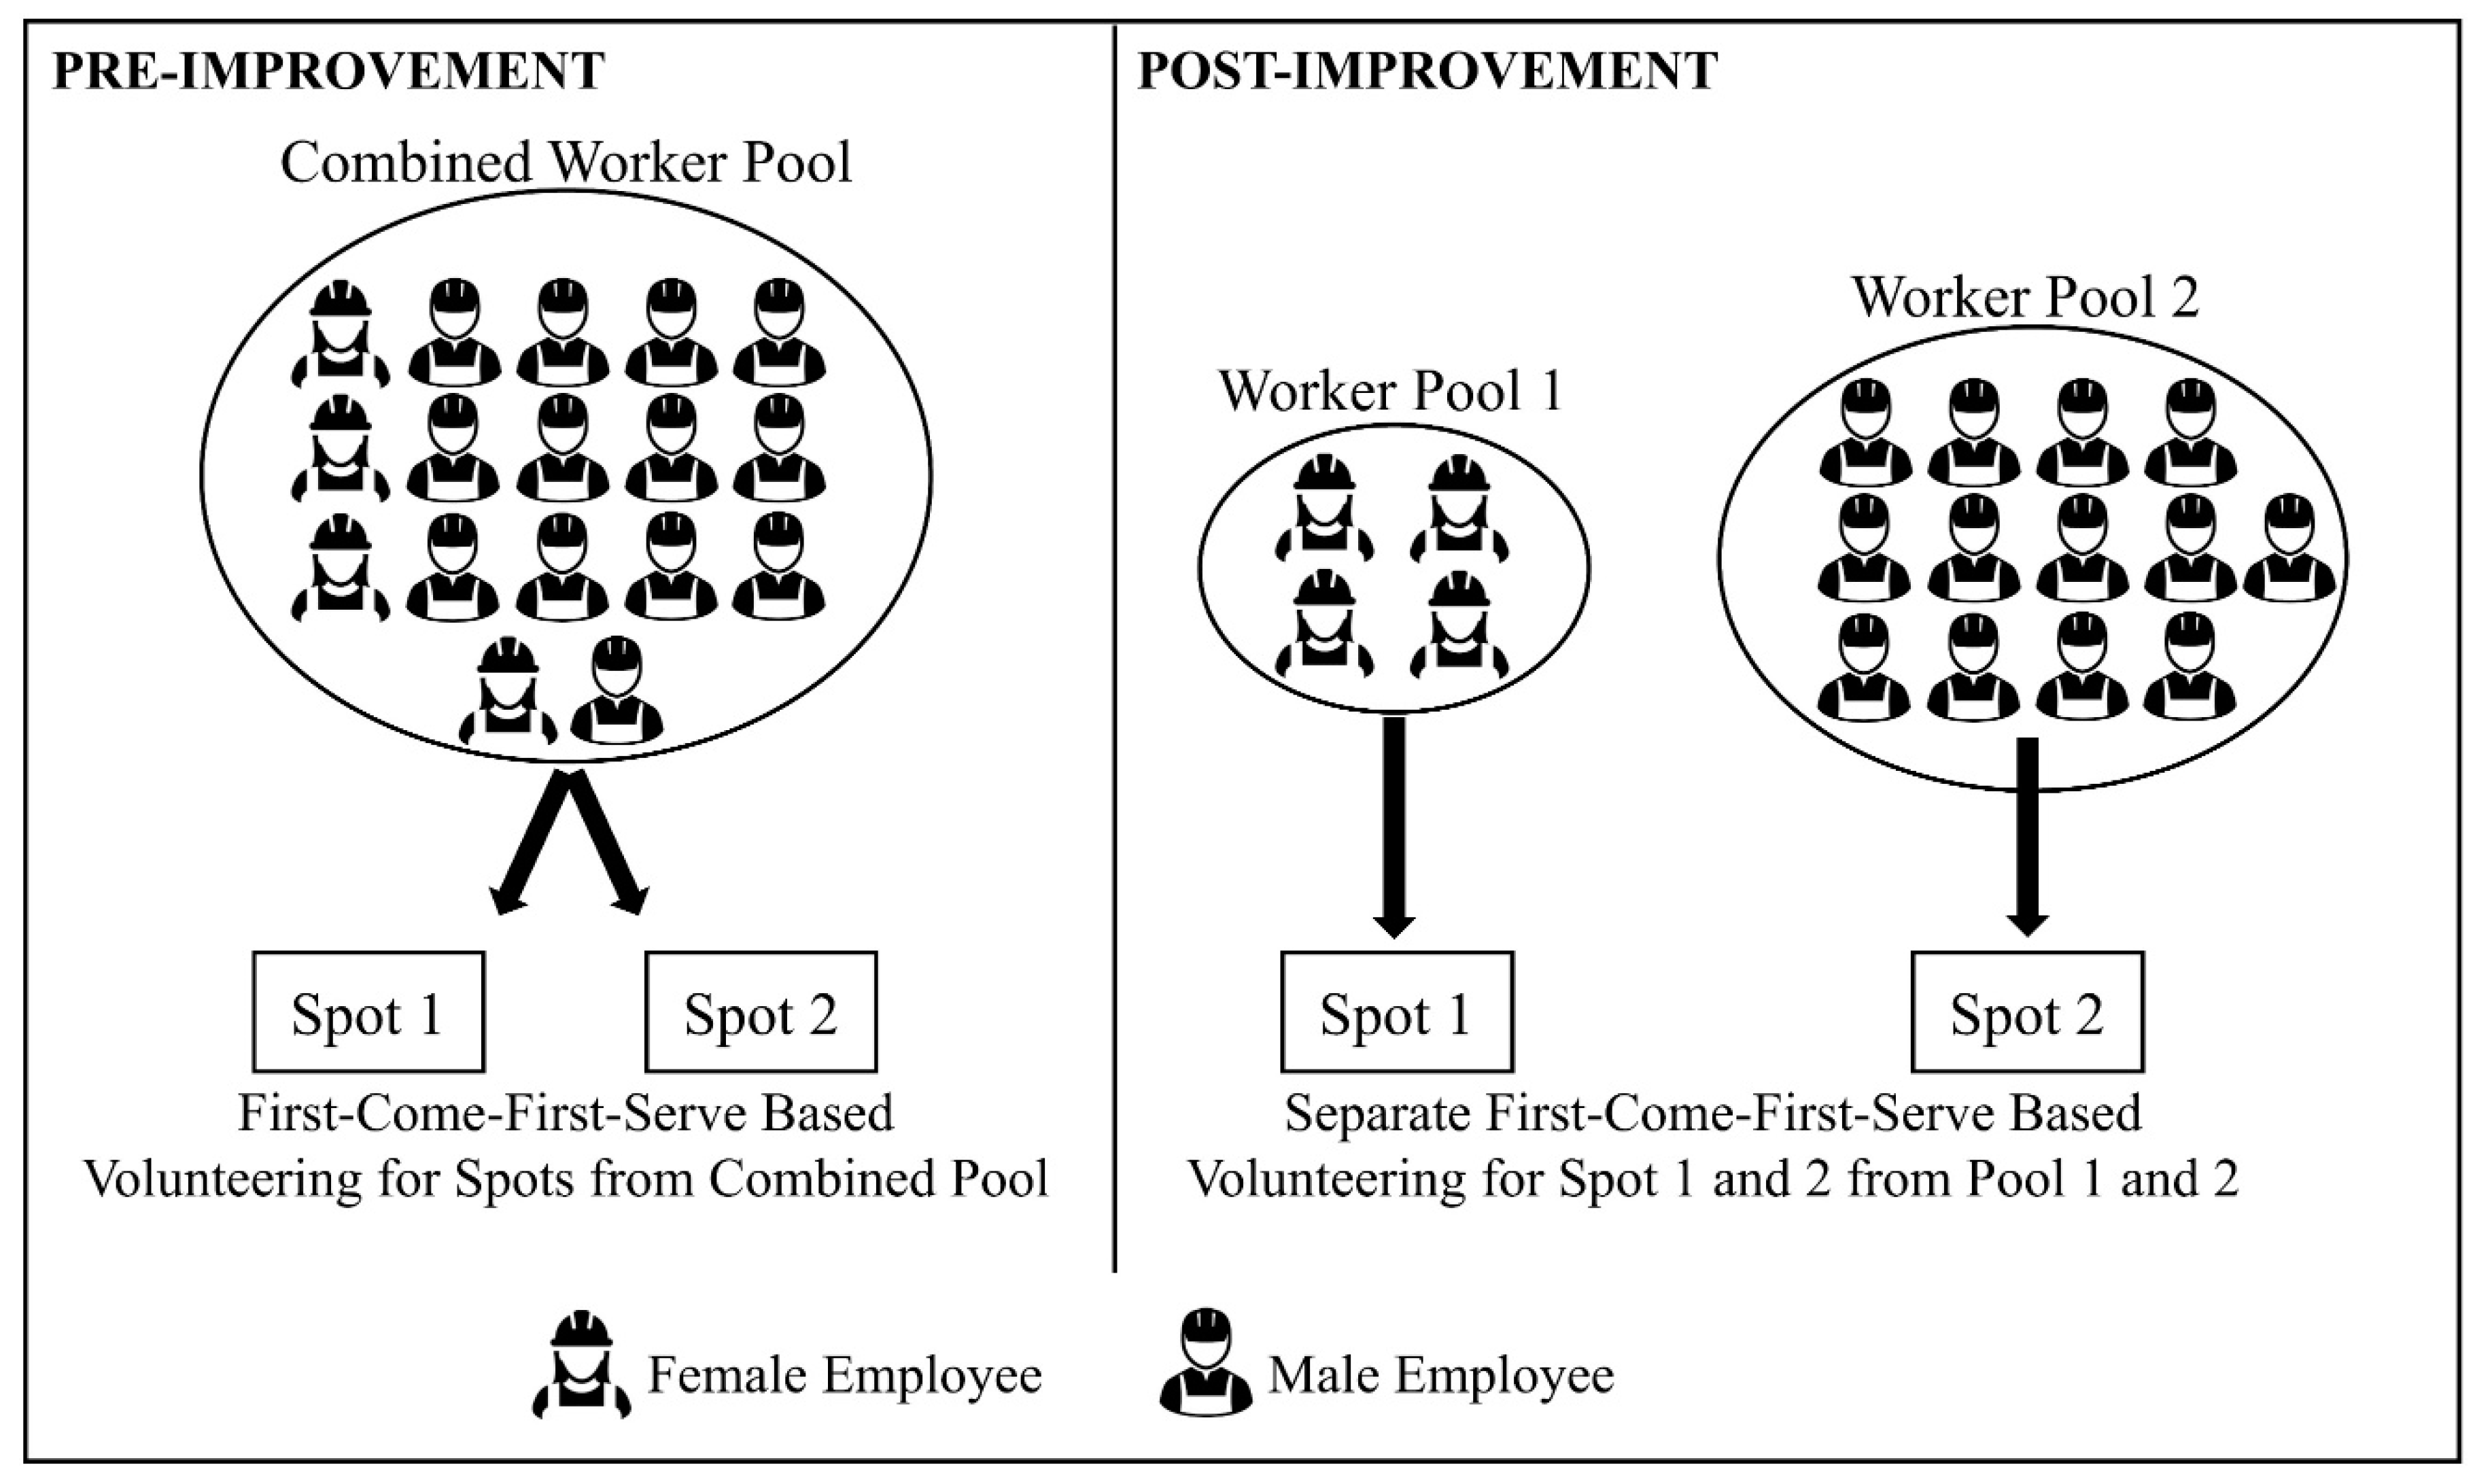
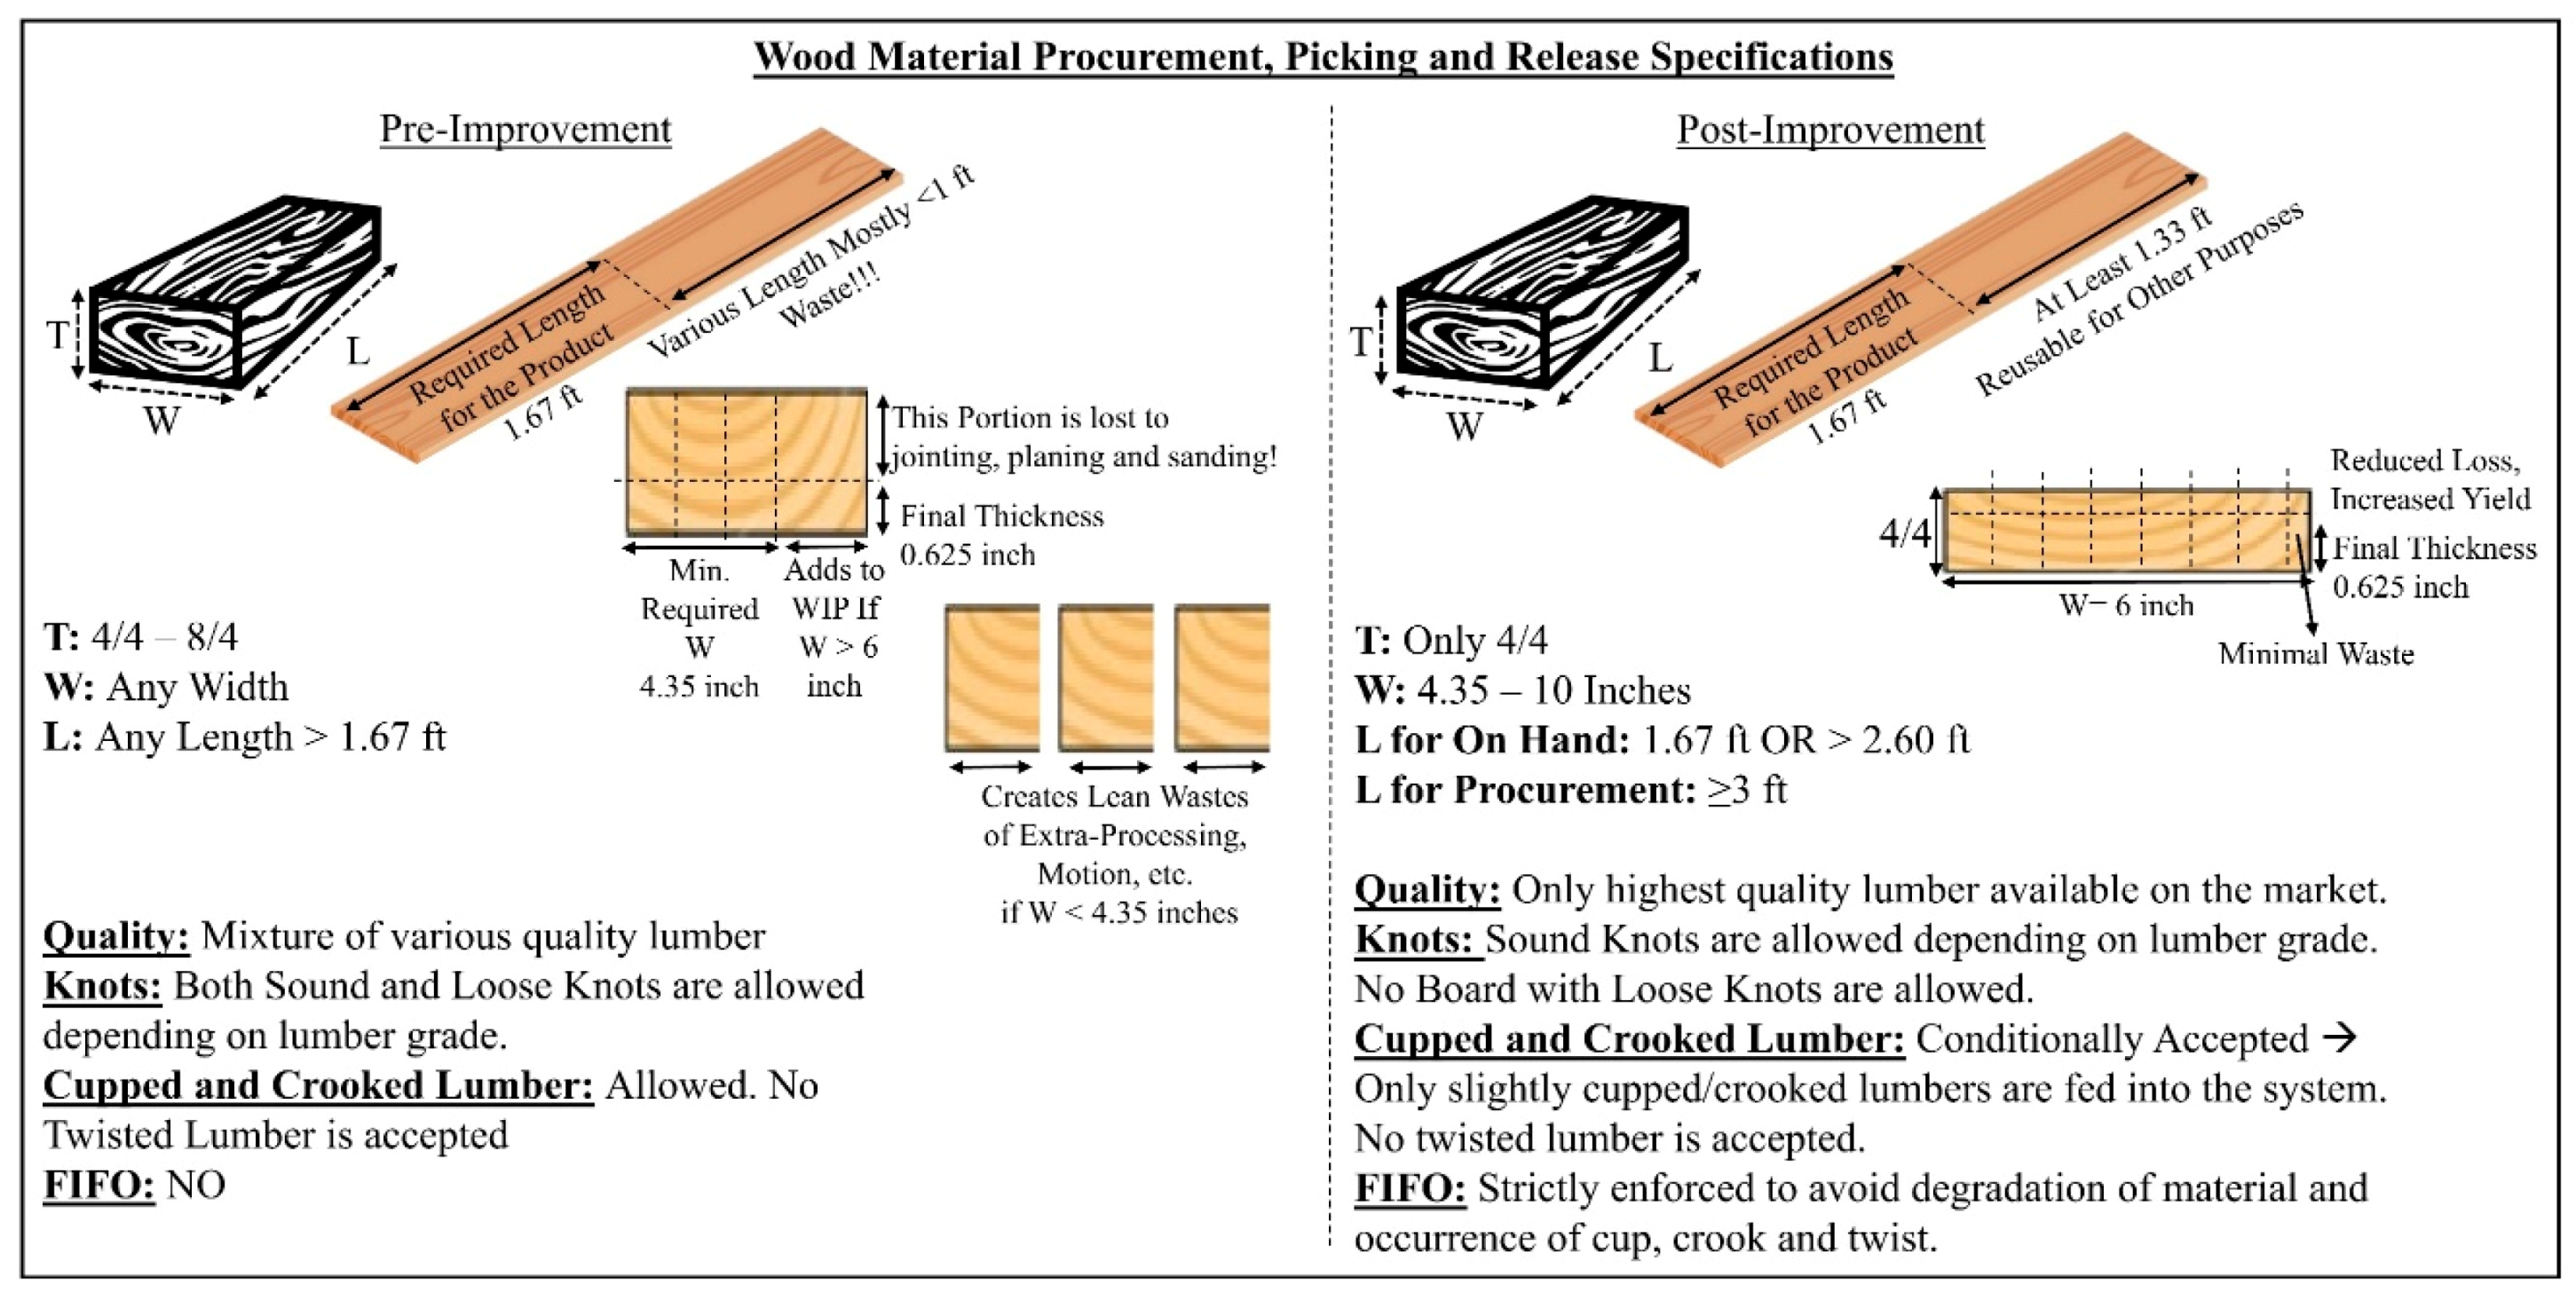
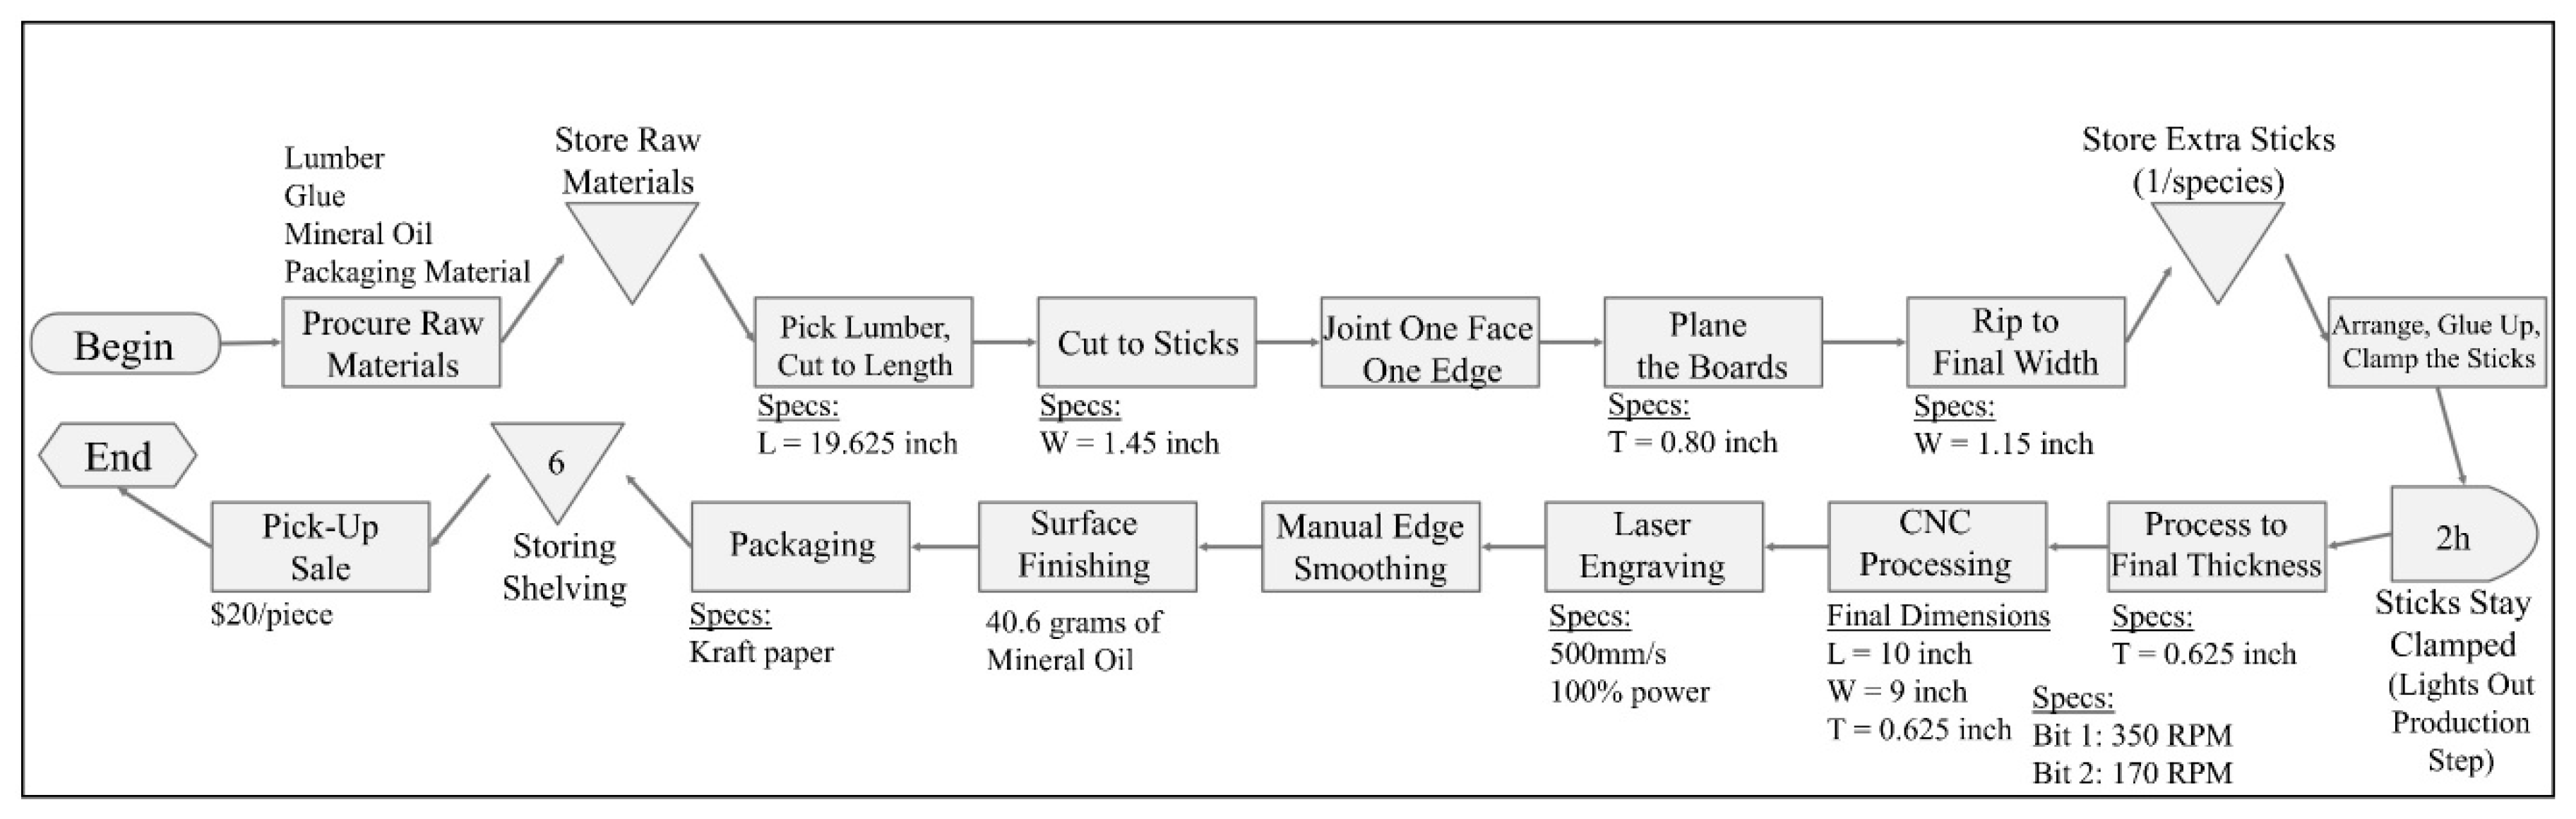
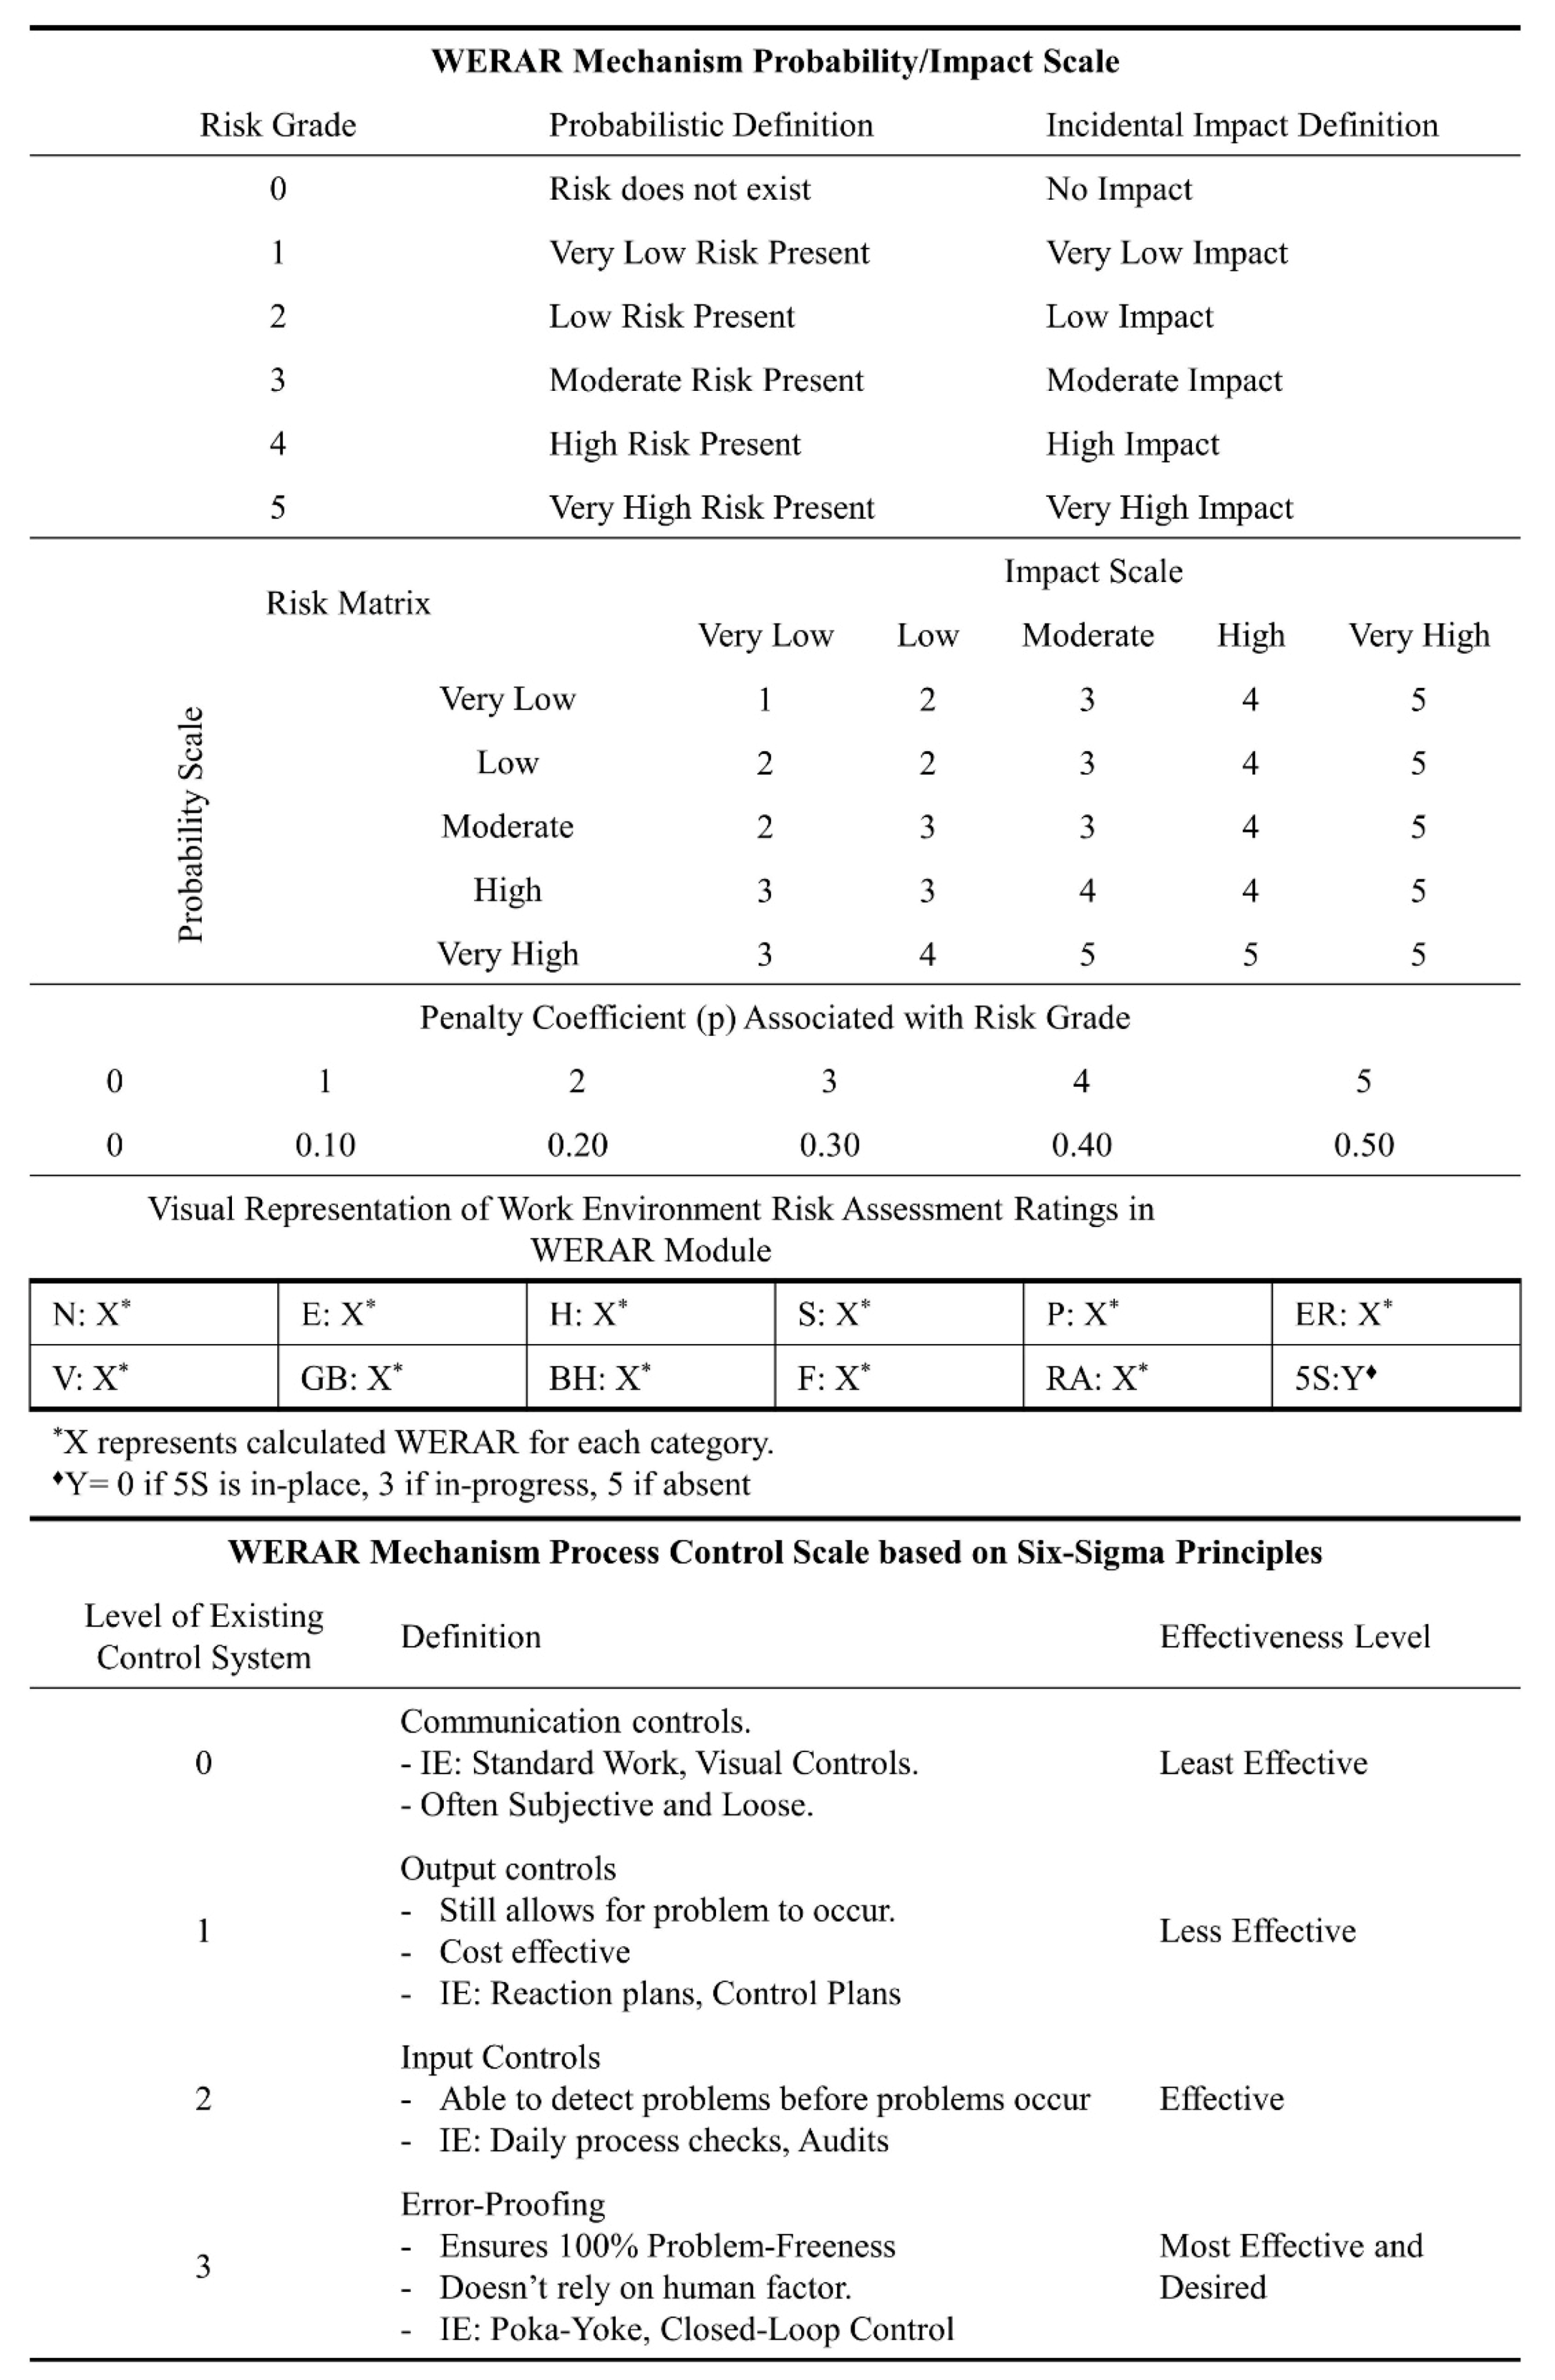
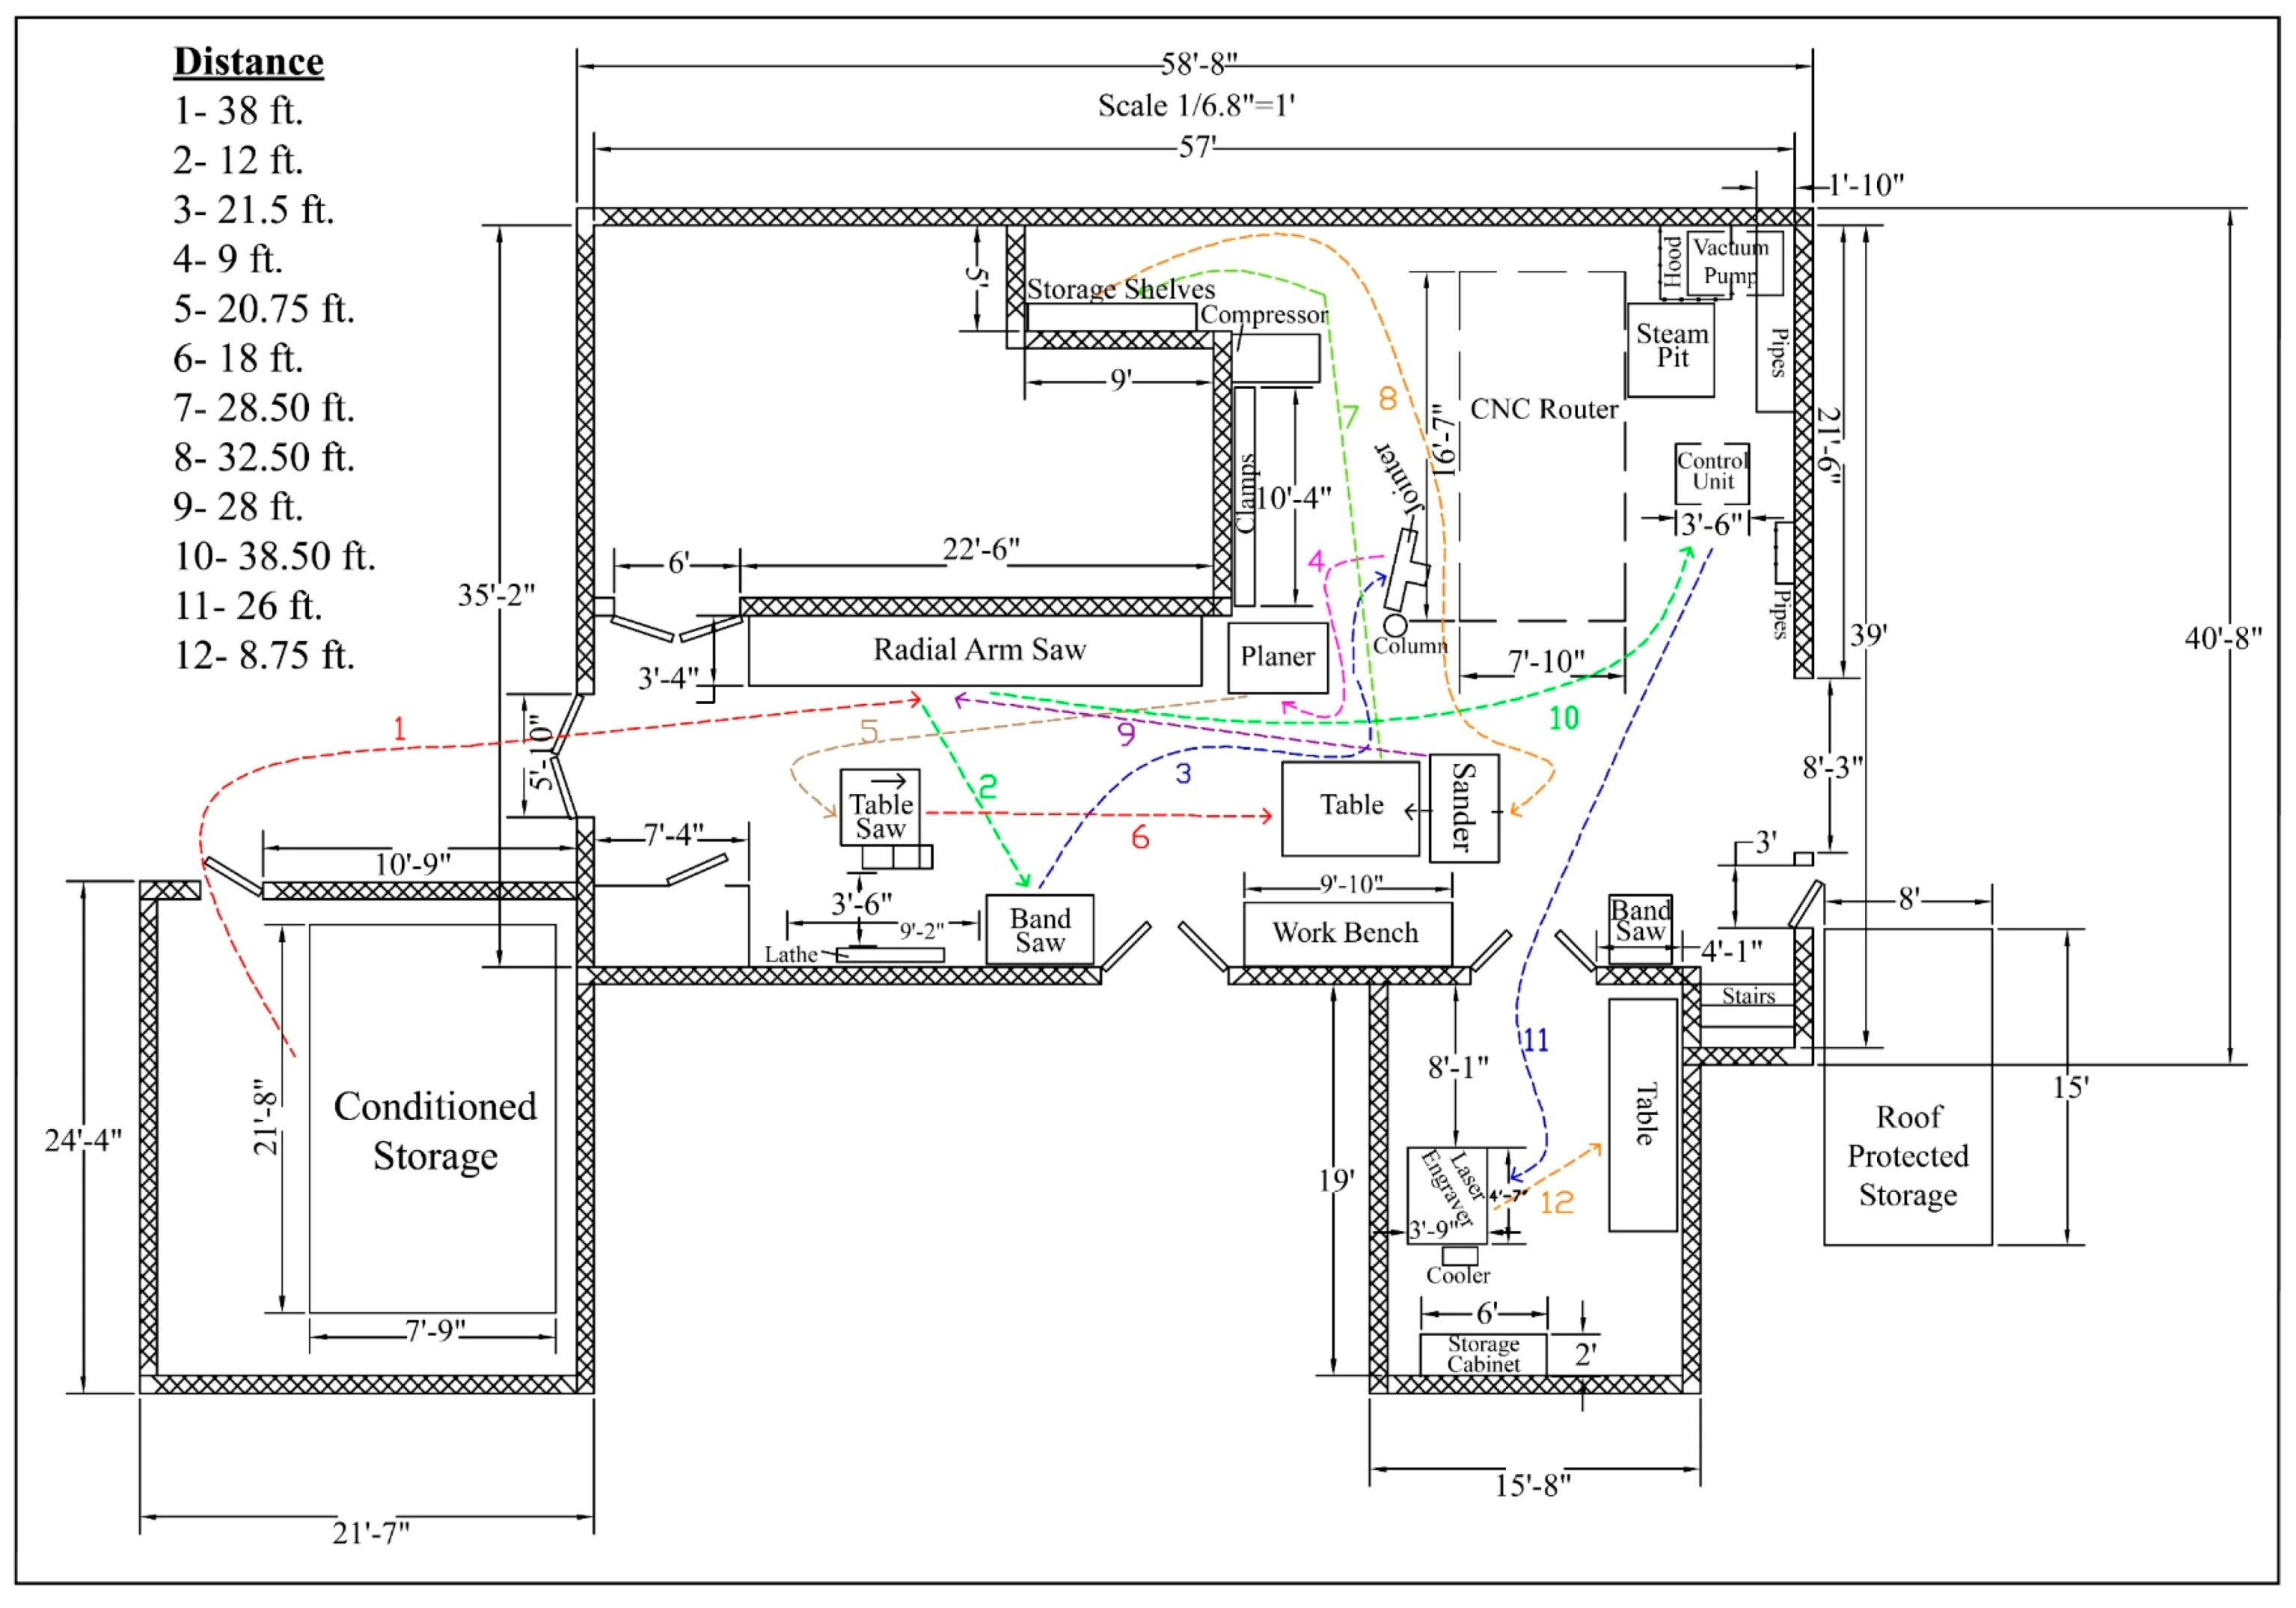
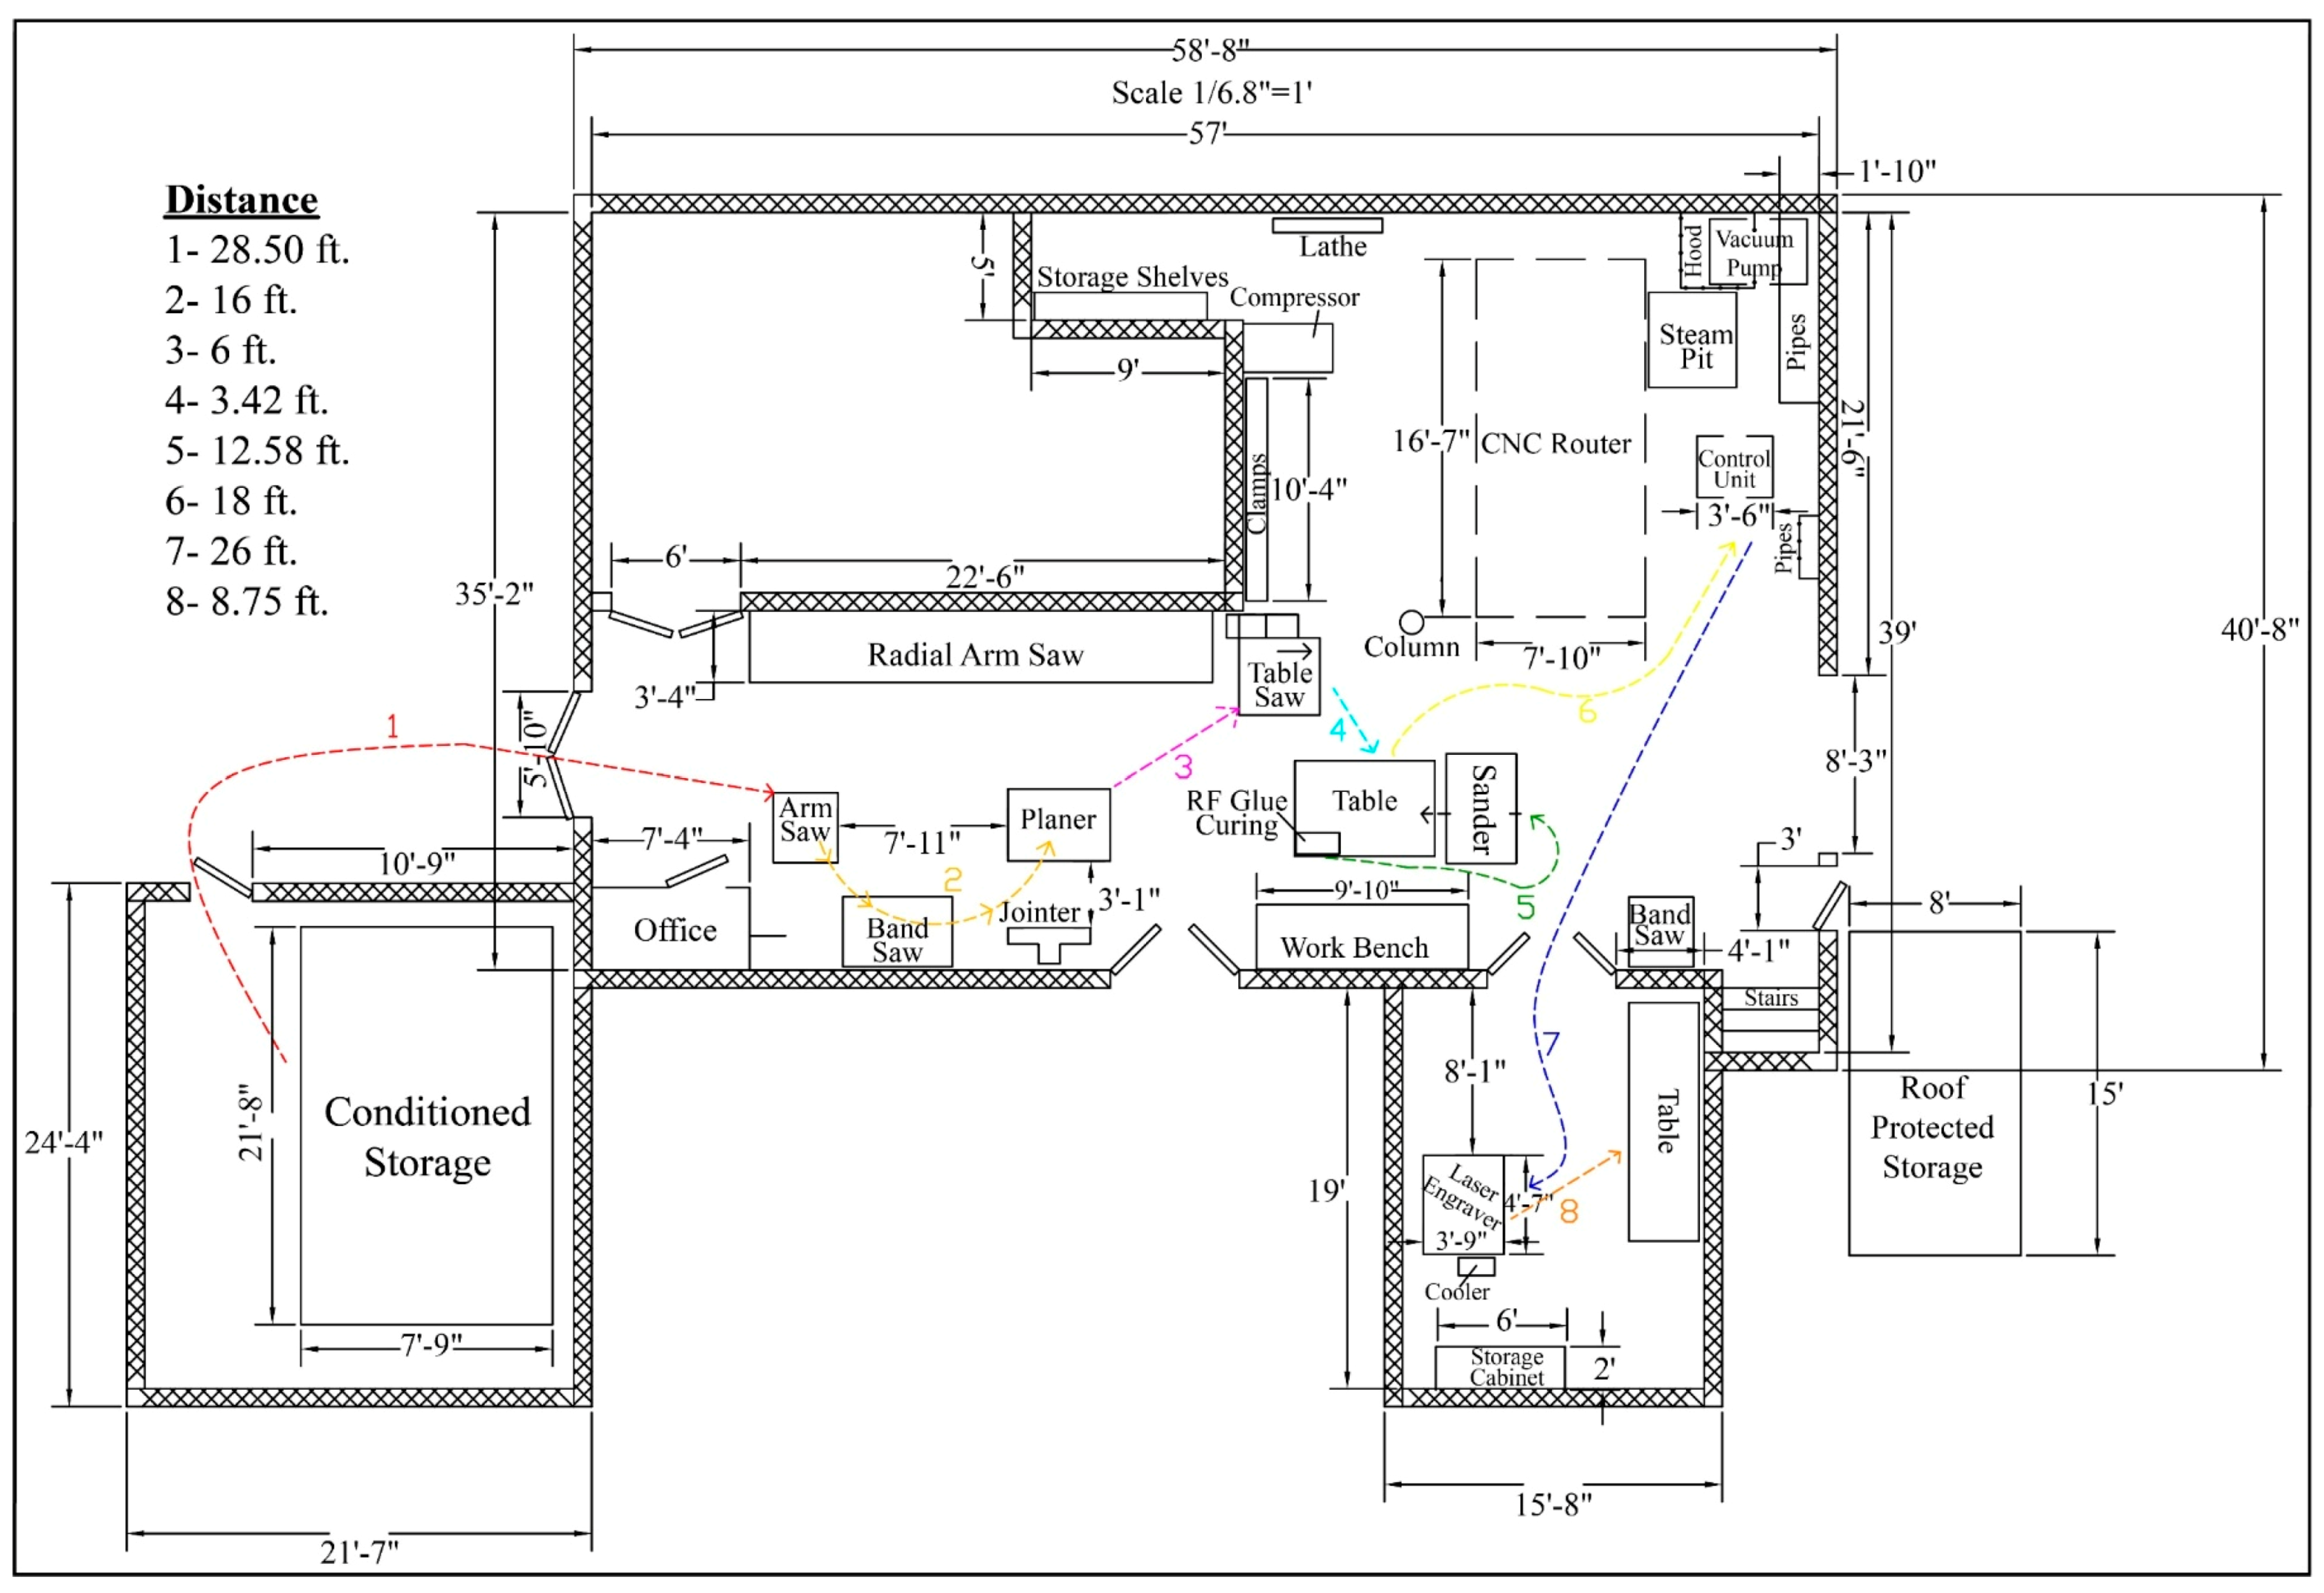
Table 1.
Machinery and equipment used for the production of cutting boards.
| Machine | Model | RMS | Phase | HP | Voltage | Amp | PF | Wattage | kWh | Pre-Improvement Time in Operation (h) | Post-Improvement Time in Operation (h) |
|---|---|---|---|---|---|---|---|---|---|---|---|
| DeWalt Radial Arm Saw | 1.732 | 3 | 3 | 220 | 8.00 | 0.75 | 2286 | 2.29 | 0.05 | 0.04 | |
| Delta Vertical Band Saw | Model20 | 1.732 | 3 | 3 | 230 | 10.50 | 0.75 | 3137 | 3.14 | 0.02 | 0.05 |
| Oliver Machinery Table Saw | − | 1.732 | 3 | 5 | 220 | 13.00 | 0.75 | 3715 | 3.72 | 0.13 | 0.08 |
| TimeSavers WideBelt Sander | 1300 | 1.732 | 3 | 1 | 230 | 48.40 | 0.88 | 16,967 | 16.97 | 0.07 | 0.07 |
| Rockwell Planer | 22600 | 1.732 | 3 | 7.5 | 230 | 24.30 | 0.75 | 7260 | 7.26 | 0.10 | 0.08 |
| Powermatic Jointer | PJ882HH | 1.732 | 3 | 2 | 230 | 9.00 | 0.78 | 2797 | 2.80 | 0.13 | 0.06 |
| Thermwood CNC | CS45510 | 1.732 | 3 | 18 | 460 | 40.00 | 0.75 | 23,902 | 23.90 | 0.18 | 0.08 |
| Boss Laser Engraver (Idle&Moving) | LS2436 | − | − | − | − | − | − | 116 | 0.12 | 0.00 | 0.00 |
| Boss Laser Engraver (In Operation) | LS2436 | − | − | − | − | − | − | 570 | 0.57 | 1.47 | 0.45 |
| Industrial Chiller ψ | CW3000 | − | − | − | − | − | − | 65 | 0.07 | 1.47 | 0.45 |
| Water Pump ψ | − | − | − | − | − | − | − | 148 | 0.15 | 1.47 | 0.45 |
| Exhaust (Start-Up) ψ | − | − | − | − | − | − | − | 1800 | 1.80 | 0.00 | 0.00 |
| Exhaust (Idle & Running) ψ | − | − | − | − | − | − | − | 667 | 0.67 | 1.47 | 0.45 |
| Becker Vacuum Pump * | 649093 | 1.732 | 3 | − | 266 | 36.50 | 0.74 | 12,444 | 12.44 | 0.18 | 0.08 |
| DustKOP Dust Collector ⸹ | − | 1.732 | 3 | 15 | 230 | 36.70 | 0.82 | 11,915 | 11.92 | 0.69 | 0.46 |
| Ingersoll Rand Air Compressor ♦ | R7.5I | 1.732 | − | − | − | − | − | − | 7.50 | 0.27 | 0.17 |
| RF Electro-Bond 600 ⸙ | RF-EB600T | − | − | − | 230 | 4.09 | 0.85 | 800.00 | 0.80 | − | 0.08 |
| Office (Computer + Lighting) | − | − | − | − | − | − | − | − | 0.20 | 3.47 | 1.93 |
* Runs only with CNC. ♦ Runs with CNC and TimeSavers Sander. ⸹ Runs with All Machinery excluding Laser Engraver and RF Electro-Bond 600. ψ Runs only with Laser Engraver only. ⸙ Only part of post-improvement scenario. Note: Average cost of industry electricity in the region was $0.07/kWh based on U.S. Energy Information Administration. Obtained from: https://www.eia.gov/electricity/monthly/epm_table_grapher.php?t=epmt_5_6_a.
Table 2.
KPI pool for the bronze frontier of the sustainability benchmarking tool (SBT) framework. VAC, value-added cost.
Table 2.
KPI pool for the bronze frontier of the sustainability benchmarking tool (SBT) framework. VAC, value-added cost.
| Economic Pillar KPIs | Simplified Formula | Adapted and/or Altered From: |
| VAT Ratio | Assign 1 if 0 ≤ VATR < 2.5; Assign 2.5 if 2.5 ≤ VATR < 5; Assign 5 if 5 ≤ VATR< 10; Assign 7 if 10 ≤ VATR < 15; Assign 8 if 15 ≤ VATR < 20; Assign 9 if 20 ≤ VATR < 25; Assign 10 if VATR ≥ 25 | [25,26] |
| VAC Ratio | [21] | |
| Customer Service Level (CSL) | [27] | |
| Inverse Rate of Returns | [28] | |
| Net Profit Margin | Assign 1 if NPM < 0 | [29] |
| Econ-Compliance | Assign 10 if There is no Noncompliant Incidents and Sanctions | N/A |
| Environmental Pillar KPIs | Simplified Formula | References |
| Net Green Area Impact | Assign 10 if Right Hand Side of numerator > Left Hand Side; Assign 1 if NGAI = 0 | [30,31] |
| Net CO2 Emission Impact | Assign 10 if Right Hand Side of numerator > Left Hand Side; Assign 1 if NEI = 0 | [32] |
| Net Water Footprint | Do not subtract from 1 and Assign (|NWF| × 10) if Right Hand Side of numerator > Left Hand Side; Assign 1 if NWF = 0 | [33,34,35] |
| Net Energy Footprint | Assign 10 if Right Hand Side of numerator > Left Hand Side; Assign 1 if NEF = 0 | [36,37] |
| Net Solid Waste Generation | Do not subtract from 1 and Assign (|NSWGF| × 10) if Right Hand Side of numerator > Left Hand Side; Assign 1 if NSWGF = 0 | [38] |
| Enviro-Compliance | Assign 10 if There is no Noncompliant Incidents and Sanctions | N/A |
| Social Pillar KPIs | Simplified Formula | Adapted and/or Altered From: |
| Employee Satisfaction Rate | (See [9]) | [39,40] |
| Contribution to Society | Assign 10 if CTS > 10 | [41,42] |
| Absenteeism Ratio | [43] | |
| Gender Bias Ratio | If Number of Female Employees > Male Employees, Swap Numerator with Denominator. | [44] |
| Volunteer Sustainability Engagement Ratio | Assign 1 if the organization/facility/SCM is involved with “0” initiatives. | N/A |
| Socio-Compliance | Assign 10 if There is no Noncompliant Incidents and Sanctions | N/A |
Table 3.
Summary of stakeholder analysis and voice of the customer (VOC) surveys.

Table 4.
Summary of Gemba walk reports. WERAR, work environment risk assessment rating.
| Identified Risk | WERAR Category | Current Control Level |
|---|---|---|
| Noise level for majority of work stations is above the 80-dB safety threshold. Some workers complained about suffering from tinnitus after work hours. | Noise (N) | 0 |
| Facility lay-out is vulnerable to transportation and motion wastes. | Ergonomics (ER) | 0 |
| Engraving station has Level 4 laser radiation risk. However, a proper SOP and pre-cautions are in place. | Radiation (RA) | 2 |
| CNC machine moves at high velocity. Safety guidelines must be strictly followed. Visual controls and warning signs in place. | High-Speed Moving Machinery and Systems (V) | 1 |
| Sanding operation creates more fine dust than other stations. Historical incidents (cold-like symptoms after prolonged presence at Process 5) were reported. Masks may be necessary. | Exposure to Hazardous Materials (H) | 0 |
| Sander, CNC, and laser engraver have a slight risk of catching fire. However, a proper SOP and preventive actions are in place. No historical incidents. | Fire (F) | 1 |
| Fair implementation of 5S is already in place throughout the manufacturing stations. However, the wood raw material storage area is in a critical condition. This results in very high material picking time and release of the wrong material, as well as trip-and-fall hazards. | 5S | N/A |
Table 5.
Potential root-causes for identified sustainability problems.
| Potential Root Cause | Performance Metric Adversely Impacted by Root Cause | Potential Next Step Towards Solution |
|---|---|---|
| Lack of Motivation to Invest in Renewable Energy or to Avoid Usage | NEF | Management Decision + Production Optimization + Brainstorm for impact Elimination |
| Lack of Motivation and Initiatives to Neutralize Green Area Impact | NGAI | Management Decision for Impact Neutralization |
| Volunteer Worker Pool Has Only A Few Female Employees | GBR | Management Decision for New Policy |
| Non-Optimal and Low-Quality Raw Material Input (Quality and Dimension) | NVAT, NVAC, RTY, NEF, Defect Rate | Management Decision for New Procurement Strategy |
| Lack of Organization and SOPs in Wood Raw Material Storage Area | NVAT, NVAC, NEF, Defect Rate, RTY | Management Decision for Deployment of 5S |
| Lack of FIFO in Raw Material Storage Inappropriate Storage Organization | Degradation of Lumber → RTY → NVAC | New SOP for Raw Material Storage Area |
| PVA Glue Dries Slow (Process 4) → Technology Limitation | NVAT | Propose New Investment Idea for Innovation |
| Too Much Motion and Transportation Waste Throughout the Facility Due to Inappropriate Layout Configuration | NVAT, NVAC | Propose New Layout Design for Reconfiguration |
| Ear Protection and Dust Masks is NOT Mandatory Noise → Processes 1–3 and 5–8 → Lack of Workers’ Awareness Dust Exposure → Process 5 → Dust Collector was OFF, Dust Collection Valves of Other Machines were Open, Lack of Workers’ Safety Awareness | WERAR → Noise | Implement New Safety Procedures |
| Energy Consumed in Processes 2, 7 and 8 due to Excess Machine Time Process 2 → Inappropriate Material Input Process 7 → CNC is used to cut one piece at a time due to suction problems = Waste Process 8 → Laser Speed cannot be increased due to displacement issues. | Net CO2 Emission, NEF | Production Optimization |
| Ineffective Use of CNC Creates a Totally NVA Process (Process 6) One-piece flow at Process 7 creates the necessity for Process 6 | NVAT, NVAC, NEF, Net CO2 Emission | Innovation for Elimination |
| Material Alignment Issues in Process 7 and 8 Process 7 → Suction problems Process 8 → Displacement due lack of error-proof guides | NVAT, NVAC, NEF, Defect Rate | Develop New Error-Proof Guides for the Processes |
| Solid Waste Amount due to Inappropriate Material Input in Processes 1, 2 and 3 | Net CO2 Emission | Develop New Material Input Specs |
| Lack of Poka-Yoke | Defect Rate, NVAT, NVAC | Integrate Process Based Poka-Yoke |
| Uncontrolled Amount of Glue and Mineral Oil Usage (Applicator Tip and Operator Impact) | NVAC, RTY | Hypothesis Testing + DOE for Innovation |
| Loose Knots in Lumber (Incautious Worker) | Defect Rate → Out of Spec Based on VOC | New SOP for Material Picking from Storage |
| Cupped, Crooked and Twisted Boards cause Faulty Dimensions in Process 2 (Insufficient SOP → Fails to Explain How to Treat Defective Lumber) | Defect Rate → Faulty Dimensions | Hypothesis Testing + DOE for New Material Input Specs |
| Dull Knives, Feeding Speed and Sound Knot Existence | Defect Rate → Boards or Stripes Crack + Faulty Dimensions | Hypothesis Testing + DOE for Management Decision |
| Rushed Production, Wood ID Expertise, Improper Lighting of Work Area | Defect Rate → Color Arrangement | Hypothesis Testing + DOE for Optimization |
| Displacement Caused by Engraving Speed, Machine Location, Improper Securing of Boards | Defect Rate → Faulty Engraving | Hypothesis Testing + DOE for Innovation |
| Alignment Board Hole Size, Alignment Board Hole Frequency and Area Covered on CNC Table, RPM of Roundover Bit | Suction Problems + Defect Rate → CNC Defects | Hypothesis Testing + DOE for Innovation |
© 2019 by the authors. Licensee MDPI, Basel, Switzerland. This article is an open access article distributed under the terms and conditions of the Creative Commons Attribution (CC BY) license (http://creativecommons.org/licenses/by/4.0/).
Share and Cite
MDPI and ACS Style
Tasdemir, C.; Gazo, R. Validation of Sustainability Benchmarking Tool in the Context of Value-Added Wood Products Manufacturing Activities. Sustainability 2019, 11, 2361. https://doi.org/10.3390/su11082361
AMA Style
Tasdemir C, Gazo R. Validation of Sustainability Benchmarking Tool in the Context of Value-Added Wood Products Manufacturing Activities. Sustainability. 2019; 11(8):2361. https://doi.org/10.3390/su11082361
Chicago/Turabian StyleTasdemir, Cagatay, and Rado Gazo. 2019. "Validation of Sustainability Benchmarking Tool in the Context of Value-Added Wood Products Manufacturing Activities" Sustainability 11, no. 8: 2361. https://doi.org/10.3390/su11082361
Note that from the first issue of 2016, this journal uses article numbers instead of page numbers. See further details here.