Chinese Financial Market Investors Attitudes toward Corporate Social Responsibility: Evidence from Mergers and Acquisitions


1
Faculty of Economics and Management, East China Normal University, Shanghai 200062, China
2
Shanghai M&A Financial Research Institute ECNU, Shanghai 200062, China
3
Central China Development Research Institute, Henan University, Kaifeng 475001, China
*
Author to whom correspondence should be addressed.
Sustainability 2019, 11(9), 2615; https://doi.org/10.3390/su11092615
Submission received: 9 April 2019
/
Revised: 25 April 2019
/
Accepted: 1 May 2019
/
Published: 7 May 2019
(This article belongs to the Special Issue Sustainability in Asian Emerging Markets)
Abstract
:As China’s economic development has shifted from quantitative growth to qualitative improvement, stakeholders have enforced stricter corporate social responsibility (CSR) requirements for listed companies. However, few studies have focused on companies and CSR in such developing economies. We used the CSR scoring system from Hexun Finance’s website to group Chinese listed companies according to their CSR scores. By comparing the effects of merger and acquisition (M&A) announcements on different CSR scores, we found that, first, the average abnormal return (AAR) response time of the low-CSR acquirers group was eight trading days, much longer than that of the medium-CSR (three trading days) and the high-CSR group (four trading days). Second, from five trading days before, and 15 trading days after the announcement date, the cumulative AAR (CAAR) of the acquirers in the low-CSR group was 0.270, much higher than those in medium- and high-CSR groups. Third, after considering the CSR scores for the two years prior to the M&A and controlling for other factors affecting the M&A, the CSR performance of the above-mentioned M&As was still negatively correlated with the M&A announcement effect. This point to the need for further studying CSR and M&A announcement effects for Chinese companies.
1. Introduction
Since the late 1990s, with the rapid development of its economy, China’s securities market has become one of the most important worldwide. As of the end of 2017, 3534 companies were listed as A-shares. In short, these listed companies represent the development level of the Chinese economy. As China’s economic development shifts from quantitative growth to qualitative improvement, the government and society showed increasingly higher requirements for corporate social responsibility (CSR) from the listed companies. The revision of the Labor Contract Law in 2007, the two amendments to the Consumer Rights Protection Act in 2009 and 2013, the 2014 Overhaul of the Environmental Protection Law, and the revision of the Company Law in 2018 mean that Chinese listed companies must constantly improve their performance and enhance efficiency, while also meeting the CSR requirements of employees, consumers, environment, and shareholders.
According to the literature, a company’s social responsibility creation significantly increases its value as in the following cases. (1) Good CSR, such as shareholder responsibilities, reduces the company’s internal financing costs, thereby reducing any financing constraints the company may face. (2) CSR in the form of caring for employees, safety training, and improving employee income can also increase the enthusiasm of employees, while improving their skills ultimately, enhancing production efficiency. (3) CSR, such as product quality improvement, after-sales service improvement, and improved reciprocity awareness among suppliers, customers, and consumers, will improve the relationships between suppliers, customers, and consumers, and also reduce transaction costs. The ubiquitous cost of market friction will reduce a company’s daily operating expenses. (4) Good CSR, such as applying an environmental management system and environmental governance with the aim of achieving environmental responsibility, will significantly reduce environmental litigation and fines that the company may face, so that the company can meet the ever-increasing environmental protection standards. (5) Public welfare donations will improve a company’s external image and enhance its reputation while reducing the advertising costs for the company’s products. Income tax payment, as an aspect of social responsibility, will improve the relationship between the company and government as well as the company’s external operating environment.
In addition to the advantages above, good corporate managers responsible for CSR are considered honest managers, and the company’s financial reports will thus be considered more authentic [1] and transparent. This increases the level of trust between a company’s external investors and the managers, reduces information asymmetry inside and outside the company [2,3], and facilitates obtaining the favor of institutional investors and financial analysts [4]. For external financing, companies with good CSR tend to obtain bank loans with lower costs and longer maturities, the cost of loans being 7–18 basis points lower than for companies with poor CSR [5]. In the bond market, it is also easier for companies with good CSR to obtain higher company ratings, which reduces the cost of bond issuance [6].
For mergers and acquisitions (M&A), CSR makes a company more likely to be selected for an M&A [7], making it easier to obtain a higher M&A premium for the target company [8]. This is because CSR reporting allows investors to have a clear understanding of the company’s current situation and future development [4,9]. Regarding CSR and M&A premiums, Gomes and Marsat [8] found that a company’s environmental performance could increase the M&A premium for cross-border and domestic M&A, whereas the company’s social performance only enhances the M&A premium for cross-border M&A, and not for domestic M&A.
However, scholars have studied the CSR activities of western companies and paid less attention to those of companies in developing and emerging economies. Similar to developed countries, Chinese listed companies are facing increasingly serious environmental and social challenges, and the impacts of the related risks on financial institutions and investors are thus increasing. Financial institutions and investors no longer focus on financial statement analysis, but are increasingly concerned about the company’s practices and performance in terms of sustainable development because these indicators can be used for risk management and improvement in company performance. As such, this paper discusses whether investors are concerned about the acquirers’ CSR performance and the valuing of subsequent M&A in the Chinese securities market.
After investigation, we found that the average abnormal return (AAR) response time of the low-CSR acquirers group was eight trading days, much longer than that of the middle-CSR acquirers group that had an AAR response time of three trading days, and the high-CSR acquirers group, with an AAR of four trading days. Furthermore, from five trading days before and 15 trading days after the announcement date, the cumulative AAR of the acquirers in the low-CSR group was 0.270, which is much higher than those in the middle- and high-CSR groups. Moreover, after considering the CSR scores for the two years prior to the M&A and controlling for other factors, the CSR performance of the studied M&As was still negatively correlated with the M&A announcement effect.
2. Literature Review
2.1. Effects of CSR on Corporate Governance
Enterprises have paid considerable attention to CSR to improve their corporate image, enhance stakeholder interaction, maximize shareholder value, and strengthen investor confidence. Therefore, CSR has received increase attention in academic studies; however, whether and how CSR affects financial markets is still contradictory. Renneboog et al. [10] critically reviewed the literature on socially responsible investments (SRI), pursuing both the financial goals and social objectives of SRI. Specifically, they used CSR as a comprehensive indicator of good corporate governance (CG) to protect the interests of all shareholders and stakeholders including both environmental and social relationships [11]. This literature stream provides two perspectives on CSR: stakeholder and shareholder theories.
Existing studies have mainly focused on the impact of CSR on firm performance [12,13,14,15,16,17,18,19,20], shareholder value [21,22,23,24,25,26,27], the financing costs [5,6,28,29], firm risk [30,31], corporate cash holdings [32], capital efficiency [33,34], firm innovation [35], and information asymmetry [36].
From the perspective of firm performance, Bhardwaj et al. [20] investigated when and why investing in CSR could affect a firm’s profitability, and found complex results about the impact of CSR, but did not reach general consolidated conclusions. Wang and Sarkis [19] employed a CSR indicator from the Bloomberg environmental, social, and governance database and corporate financial performance (CFP) data from the COMPUSTAT database to test the relationship between CSR and CFP. They showed that good CSR governance greatly improved CFP, providing an explanation of the mediation effects of actual CSR outcomes on the relationship between CSR and financial return. Price and Sun [18] and Blasi et al. [12] studied the link between CSR and firm performance using the CSR indicator from the Kinder, Lydenberg, and Domini Research & Analytics, Inc. (KLD) STATS database. The former study [18] explored the combined impact of “doing good” (CSR) and “doing bad” (corporate social irresponsibility (CSI)), and found CSI actions had a longer, more profound influence than CSR activities, and firms with higher CSR and CSI initiatives contrastingly performed worse than those engaging in little CSR/CSI. The latter study [12] investigated how seven macrocategories of CSR influenced a firm’s economic performance. Generally, their findings suggested that CSR increases a firm’s stock returns and lowers financial risks, depending on where the firm invests its CSR budget.
When analyzing M&A cases during the 2008–2009 financial crisis, Lins et al. [17] suggested that investing in CSR could build a good trust relationship between firms and their shareholders and stakeholders; this type of relationship benefits corporations when markets suffer a negative shock. Esteban-Sanchez et al. [14] found that banks with better employee relationships and CG tended to have better CFP, as investors valued the relationship with the community during the financial crisis. However, CFP is not notably affected by product responsibility. Cho et al. [13] showed that a partially positive relationship exists between CSR performance, profitability, and firm value, which is in line some previous research in that a positive relationship between CSR and the financial performance of Korean firms exists by using the Korea Economic Justice Institute (KEJI) index before 2011.
Kao et al. [15] studied the relationship between CSR and firm performance of Chinese companies. They found that investors’ reactions to CSR were related to company ownership. When the company was a state-owned enterprise (SOE), because of agency costs, the market was neutral, whereas it was positive for non-SOEs. Additionally, Chinese firms value the long-term benefits of CSR on performance over time. Li et al. [16] found that both environmental and social CSR projects significantly improved enterprise performance by analyzing 34,000 CSR cases of 839 companies from 2006 to 2016 in China.
From the perspective of shareholder value, measured as cumulative abnormal returns (CAR), Becchetti et al. [21] demonstrated that CSR plays a significantly negative role in CAR after exit announcements from the Domini 400 Social index, even excluding the impacts of financial distress shocks and stock market seasonality. By using the KLD dataset and event study, Krüger [26] found that CAR responded strongly and negatively to negative CSR news, especially regarding communities and the environment, due to the substantial cost associated with CSI. By contrast, investors responded weakly and negatively to positive CSR news indicating a poor relationship between firms and stakeholders. Chung et al. [23] empirically examined the relationship between the KEJI and firm value on the Korea Exchange from 2005 to 2015, revealing a strongly positive relation between CSR and firm value.
Despite the effects of CSR on shareholder value, Chen and Gavious [22] used the Maala Ranking of Corporate Social Responsibility reports in Israel to examine the value implications of CSR policies for different types of shareholders. They showed that the marginal investor trading shares on the exchange valued CSR positively, whereas a firm’s CSR did not significantly affect M&A and long-term institutional investors since they did not think that CSR offered any real profit potential for the firm. Nguyen et al. [27] employed the KLD dataset and showed that CSR activities could create shareholder value as long as managers were properly monitored by long-term investors, not through higher cash flow but rather, through lower cash flow risk. Based on the Thomson Reuters ASSET4 ESG database, Dyck et al. [24] revealed that institutional ownership plays an important role in environmental and social (E&S) performance, which brings financial benefits to companies through E&S improvements.
Some scholars examined the role of CSR in equity financing costs. For instance, Richardson and Welker [28] revealed that, in Canada, a firm’s cost of equity capital is negatively affected by the quantity and quality of financial disclosure. Surprisingly, social disclosure was found to be positively related to the cost of equity capital. For debt financing costs, Goss and Roberts [5] studied the relationship between CSR and bank debt for 3996 loans of U.S. firms, and showed that less socially responsible firms paid higher interest rates than more responsible firms. Ye and Zhang [29] found that firms with extremely low or high CSR were subject to a higher debt financing cost in China. Specifically, improving CSR cut debt financing costs when CSR investment was below the optimal level; however, this relationship was the opposite when CSR investment exceeded the optimal level. Ge and Liu [6] suggested that better CSR performance reduced the cost of issuing bonds and that both CSR strengths and weaknesses were a concern to bondholders.
Aside from the aforementioned viewpoints, other results have been reported regarding the different roles of CSR. From a risk perspective, Becchetti et al. [30] examined the association between CSR and stakeholder risk, showing that “CSR reduces flexibility in responding to productive shocks via the reduction of stakeholder well-being, thereby producing the combined effect of making earnings less predictable and reducing exposure to risk of conflicts with stakeholders.” Hao et al. [31] found a significantly negative association between CSR and stock price crash risk, and suggested that Chinese companies could reduce operating risk, especially that of a stock price crash, by enhancing CSR performance through the use of internal controls.
From a capital efficiency perspective, Bhandari and Javakhadze [33] found that CSR distorted investment sensitivity to Tobin’s Q, and determined that this effect of CSR was moderated by the assumed level of agency conflict and stakeholder engagement as well as financial slack. Gangi et al. [34] empirically analyzed how a firm’s intellectual capital (IC) efficiency was affected by the interactions between CSR and CG using a large sample of public firms in 51 countries from 2010 to 2015. They indicated that the firm efficiency was influenced by CSR and CG by managing IC, which contributed to the causal effect of CSR on value-added IC measures and the positive impact of CG on both CSR engagement and IC efficiency.
Alternatively, Cheung [32] claimed that CSR firms with higher social capital with stakeholders were expected to reduce their cash holdings. Cho et al. [36] found that both positive and negative CSR performance reduced information asymmetry, while Martinez-Conesa et al. [35] supported that CSR was an important driver for companies to be more innovative, efficient, and effective.
2.2. Effects of CSR on M&A Activities
Although many scholars have drawn conclusions about the impact of CSR on CG, few related studies about CSR within the framework of M&A transactions have been published. As such, the relationship between CSR and M&A is still contradictory. For instance, Bekier et al. [37] illustrated that CSR could impact shareholder wealth through M&A. Aktas et al. [38] investigated how the SRI of targets affected the CAR of global M&A using Innovest Value Assessment (IVA) ratings as a measure of firms’ ability to manage social and environmental risks. Their empirical results support that the stronger the target’s CSR, the higher the CAR for the acquirer; that is, merging with a socially responsible target could also significantly improve the acquirer’s CSR performance. Using the KLD database, Deng et al. [39] argued that merging or acquiring firms with strong CSR achieved a higher CAR and largely enhanced post-merger long-term operating performance. For companies with better CSR, M&A were more successful and the transactions were completed quickly.
Based on 1986 M&A deals in 23 emerging markets, Yen and André [11] conducted a series of studies about market reactions, measured using CAR. They found that the cost–benefit concerns of investors were a main determinant of whether CSR affected market reactions to M&As. The better the CSR mergers, the easier the cross-border M&A, although market reaction on such deals directly depends on CSR cost concerns rather than indirectly on CSR interest in deal efficiency. They illustrated that, although a better governance quality of the target’s nation than that of the acquirer’s nation was not attractive to market investors, it generated a significantly better long-term operating performance.
Other scholars have explored the impact of CSR on M&A decisions using ASSET4 as a measure of CSR. For instance, Gomes [7] examined the impact of CSR on M&A target choices, showing that target firms had, on average, higher CSR scores than similar nontarget firms, which indicates a direct positive association between a firm’s CSR and its propensity as an M&A target. Gomes and Marsat [8] found that if the target company’s CSR level was high, obtaining an M&A premium was easier. In CSR, the company’s environmental performance can enhance M&A premiums for both cross-border and domestic M&A, whereas the company’s social performance can only enhance M&A premium for cross-border M&A. Their results further illustrated that assessing the target’s CSR may minimize information asymmetry and target’s specific risk in M&A transactions. Using arbitrage spreads following initial acquisition announcements as a measure of deal uncertainty, Arouri et al. [40] found a significant negative relationship between the acquirer’s CSR and M&A completion uncertainty, even for individual CSR dimensions (i.e., environmental, social, and governance). Their findings imply that CSR is an important determinant of the perceived risk for M&A.
Qiao et al. [41] examined the effects of geographical regions and related party transactions on CSR and long-term M&A performance interactions in China. They found that the acquirer’s CSR performance significantly positively affected long-term M&A performance. Relationships between CSR and long-term M&A performance also varied depending on their geographical regions: CSR significantly improved the long-term M&A performance of firms located in the eastern region, but not in other regions. Compared with nonrelated party M&A, related party M&A deals demonstrated a more positive and significant association between CSR performance and long-term M&A performance. Therefore, their results suggested that firms could act socially responsibly to generate economic benefit.
The studies above produced some remarkable results, but their findings suffer from limitations. For example, Aktas et al. [38], using a small sample of 129 M&A deals in a cross-country study, detected the impact of the target’s CSR on the acquirer’s abnormal market returns, but did not investigate the relationship between market reactions and the acquirer’s CSR performance. Deng et al. [39] did not incorporate the effect of governance mechanisms on the association between CSR and M&A performance, only providing evidence for U.S. deals with single-market characteristics. Yen and André’s [11] study main limitation is the lack of ownership information for multiple companies, which impeded the testing of typical agency problems in emerging markets. Due to the large gaps in market development, regulations, and CSR awareness, the conclusions of Qiao et al. [41] were drawn for China’s listed firms, which might not be applicable to all M&As in China or in developed countries.
Consequently, the major contributions of this paper are fourfold. First, we conducted an analysis on a Chinese sample of M&A transactions as China is the world’s largest and fastest growing transition economy. Unlike developed countries such as the U.S. and Europe, its M&A market is emerging and transforming. Therefore, it is necessary to study China’s context. Second, in terms of CSR, we used data from the social responsibility evaluation system of the Hexun Financial Network. To the best of our knowledge, the Hexun Financial Network is currently the first social responsibility evaluation system in China with objective and open listed company data. The indicator system is systematic, comprehensive, fair, and objective, and provides data for studying the social responsibility of Chinese listed companies. Third, unlike the literature, we compared and analyzed CSR performance before and after M&A from the perspective of investors in terms of absolute yield and market reaction time. These analyses target the China securities market. Investors on the market find value from formulating arbitrage strategies based on the performance of listed companies’ CSR. Finally, the conclusions of this paper provide a certain marginal contribution to study the effectiveness of China’s securities market: the CSR of the acquirer and the announcement day effect of the merger showed opposite results, which means that investors in the Chinese securities market may evaluate the company CSR differently than in western countries. The different interpretations of these evaluations may thus further stimulate research on the effectiveness of the Chinese securities market.
3. Data and Methods
3.1. Corporate Social Responsibility Data
We used web crawler technology to download the social responsibility reports of the listed companies from the Hexun Finance website. In 2013, Hexun Finance established a set of shareholder responsibility, employee responsibility, suppliers, customers, and consumers based on data disclosed in the social responsibility reports of listed companies in China. Five items of equity, environmental, and social responsibility were introduced to evaluate each enterprise. The compiled data covered almost 3000 listed companies in China from 2010 to 2017.
Table 1 presents a list of social responsibility evaluation systems for listed companies in China. Hexun Finance’s evaluation system includes a three-level indicator system, which covers the company’s shareholders, suppliers, and customers; the environment; and society. Within these broad subjects, a secondary indicator system is created, which subdivides the third-level indicators. In the three-level indicator system, there are company-level indicators. By summing the company-level indicators, the company’s social responsibility value is calculated for each Chinese listed company every year. Through this scoring system, the listed companies are assigned an annual social responsibility report score. The higher the score, the better the listed company’s overall performance in the above-mentioned five dimensions.
After obtaining the social responsibility performance scores of Chinese listed companies, the sample companies’ social responsibility total scores were ranked from high-to-low for each year and divided into five groups. The first group has high CSR, the third, medium CSR, and the fifth, low CSR. After obtaining group information, the t − 1 year CSR group information was matched with the t year merger and reorganization sample to determine if the listed company’s social responsibility performance in the previous year would affect its M&A announcement day.
3.2. Sample Description
We extracted the M&A sample from the China Stock Market & Accounting Research (CSMAR) database. The data analysis period was from 1 January 2010 to 31 December 2017. We imposed the following sample selection criteria:
- The acquirer was a listed firm, and the M&A transaction had been completed.
- The acquirer had a total equity share after the merger exceeding 50%.
- A sample of stock prices and financial indicators was available in the CSMAR database for the acquirer. Therefore, we could calculate the AAR, cumulative AAR(CAAR), and other control variables.
Table 2 shows the number of Chinese listed companies analyzed in this paper as well as the calculation of each company’s social responsibility indicators (e.g., shareholder, employee, supplier, customer, and consumer, environmental, and social responsibility) and total scores, as well as the annual distribution of the mean, minimum, and maximum values. On average, Chinese listed companies performed better in 2015 in terms of shareholder responsibility, employee responsibility, supplier customer and consumer relationships, environmental responsibility, and social responsibility.
According to Table 2, the sample of M&A events was divided into three categories based on the CSR score: low, medium, and high CSR. The sample annual distribution of the three types of M&A events is shown in Table 3. In the M&A events examined, the vast majority of the samples had high CSR levels, followed by medium CSR levels, whereas the number of samples with low CSR was relatively low.
3.3. Econometric Methods
For empirical analysis, we used the effect of the listed company’s M&A announcement day to conduct research, including the event window selection, estimation window selection, and estimation of the model settings. The details are as follows.
3.3.1. Setting Estimation Windows
Considering the duration of the event window and daily frequency characteristics of the stock price return data, the estimated window was defined as the first 70 trading days and first 10 trading days before the first announcement date. Therefore, the estimation window for this article was (−70, −10).
3.3.2. Setting Event Windows
We took the date of the first disclosure of the major assets M&A and restructuring of the listed company as the announcement date. As the market needed time to absorb and digest the news, the third week (15 trading days) after the announcement day was used as the end point of the event window. Considering the early reaction of market investors to the news, the first week (five trading days) before the announcement day was used as the starting point of the event window. Therefore, the event window here was (−5, 15).
3.3.3. Calculating Abnormal Returns
For simplicity, we used the market model to estimate the parameters of the normal rate of return model, and further used this parameter to estimate the normal rate of return during the event window. Consequently, the abnormal return estimate () of the sample company i can be further calculated as
After calculating the abnormal return estimate during the event window, according to the CSR score grouping the result of one year prior to the M&A announcement date, the AAR of the three types of sample companies was calculated (, j = 1, 2, 3):
Based on Equation (2), the CAAR of returns of the sample company was calculated as
where j = 1, 2, and 3 represent low CSR, medium CSR, and high CSR samples, respectively; and N1, N2, and N3 represent the number of low CSR, medium CSR, and high CSR observations, respectively.
4. Results and Discussion
Table 4 shows the distribution of the number of companies with positive CAR for acquirers at different CSR levels (). On the day of the announcement (t = 0) 80.14% of the sample had a positive income in the high CSR group, which was significantly higher than the 74.23% and 74.68% of the medium CSR and low CSR groups, respectively. In the 15 days after the announcement date, the CAR of the event tended to be balanced and gradually adjusted back to the mean. At this time, the proportion of positive income observations in the group with high CSR scores was 71.63%, which was still significantly higher than the 68.04% and 67.09% of the medium and the low CSR groups, respectively. This shows that the stock returns in the secondary market have a relationship with the CSR scores of listed companies undergoing M&A. Listed companies with high CSR scores are more valued by market investors. Next, we analyzed the duration of, and increase in, the stock returns of listed companies in the secondary market caused by M&A for the three CSR groups.
Figure 1 and Table 5 show the AAR and CAAR changes and the corresponding statistical test for the acquisition of low CSR companies. The companies in the low CSR group had a mean return value significantly higher than 0 at the 5% confidence level on the previous trading day (t = −1), and the significant average continued until six trading days after the announcement day (t = 6). For the 15 trading days after the announcement, the CAAR of the merger was 0.270.
This figure shows that investors invest in low CSR acquirers, after the M&A, the AAR and CAAR that investors can obtain from the five trading days before the announcement date to the next 15 trading days after.
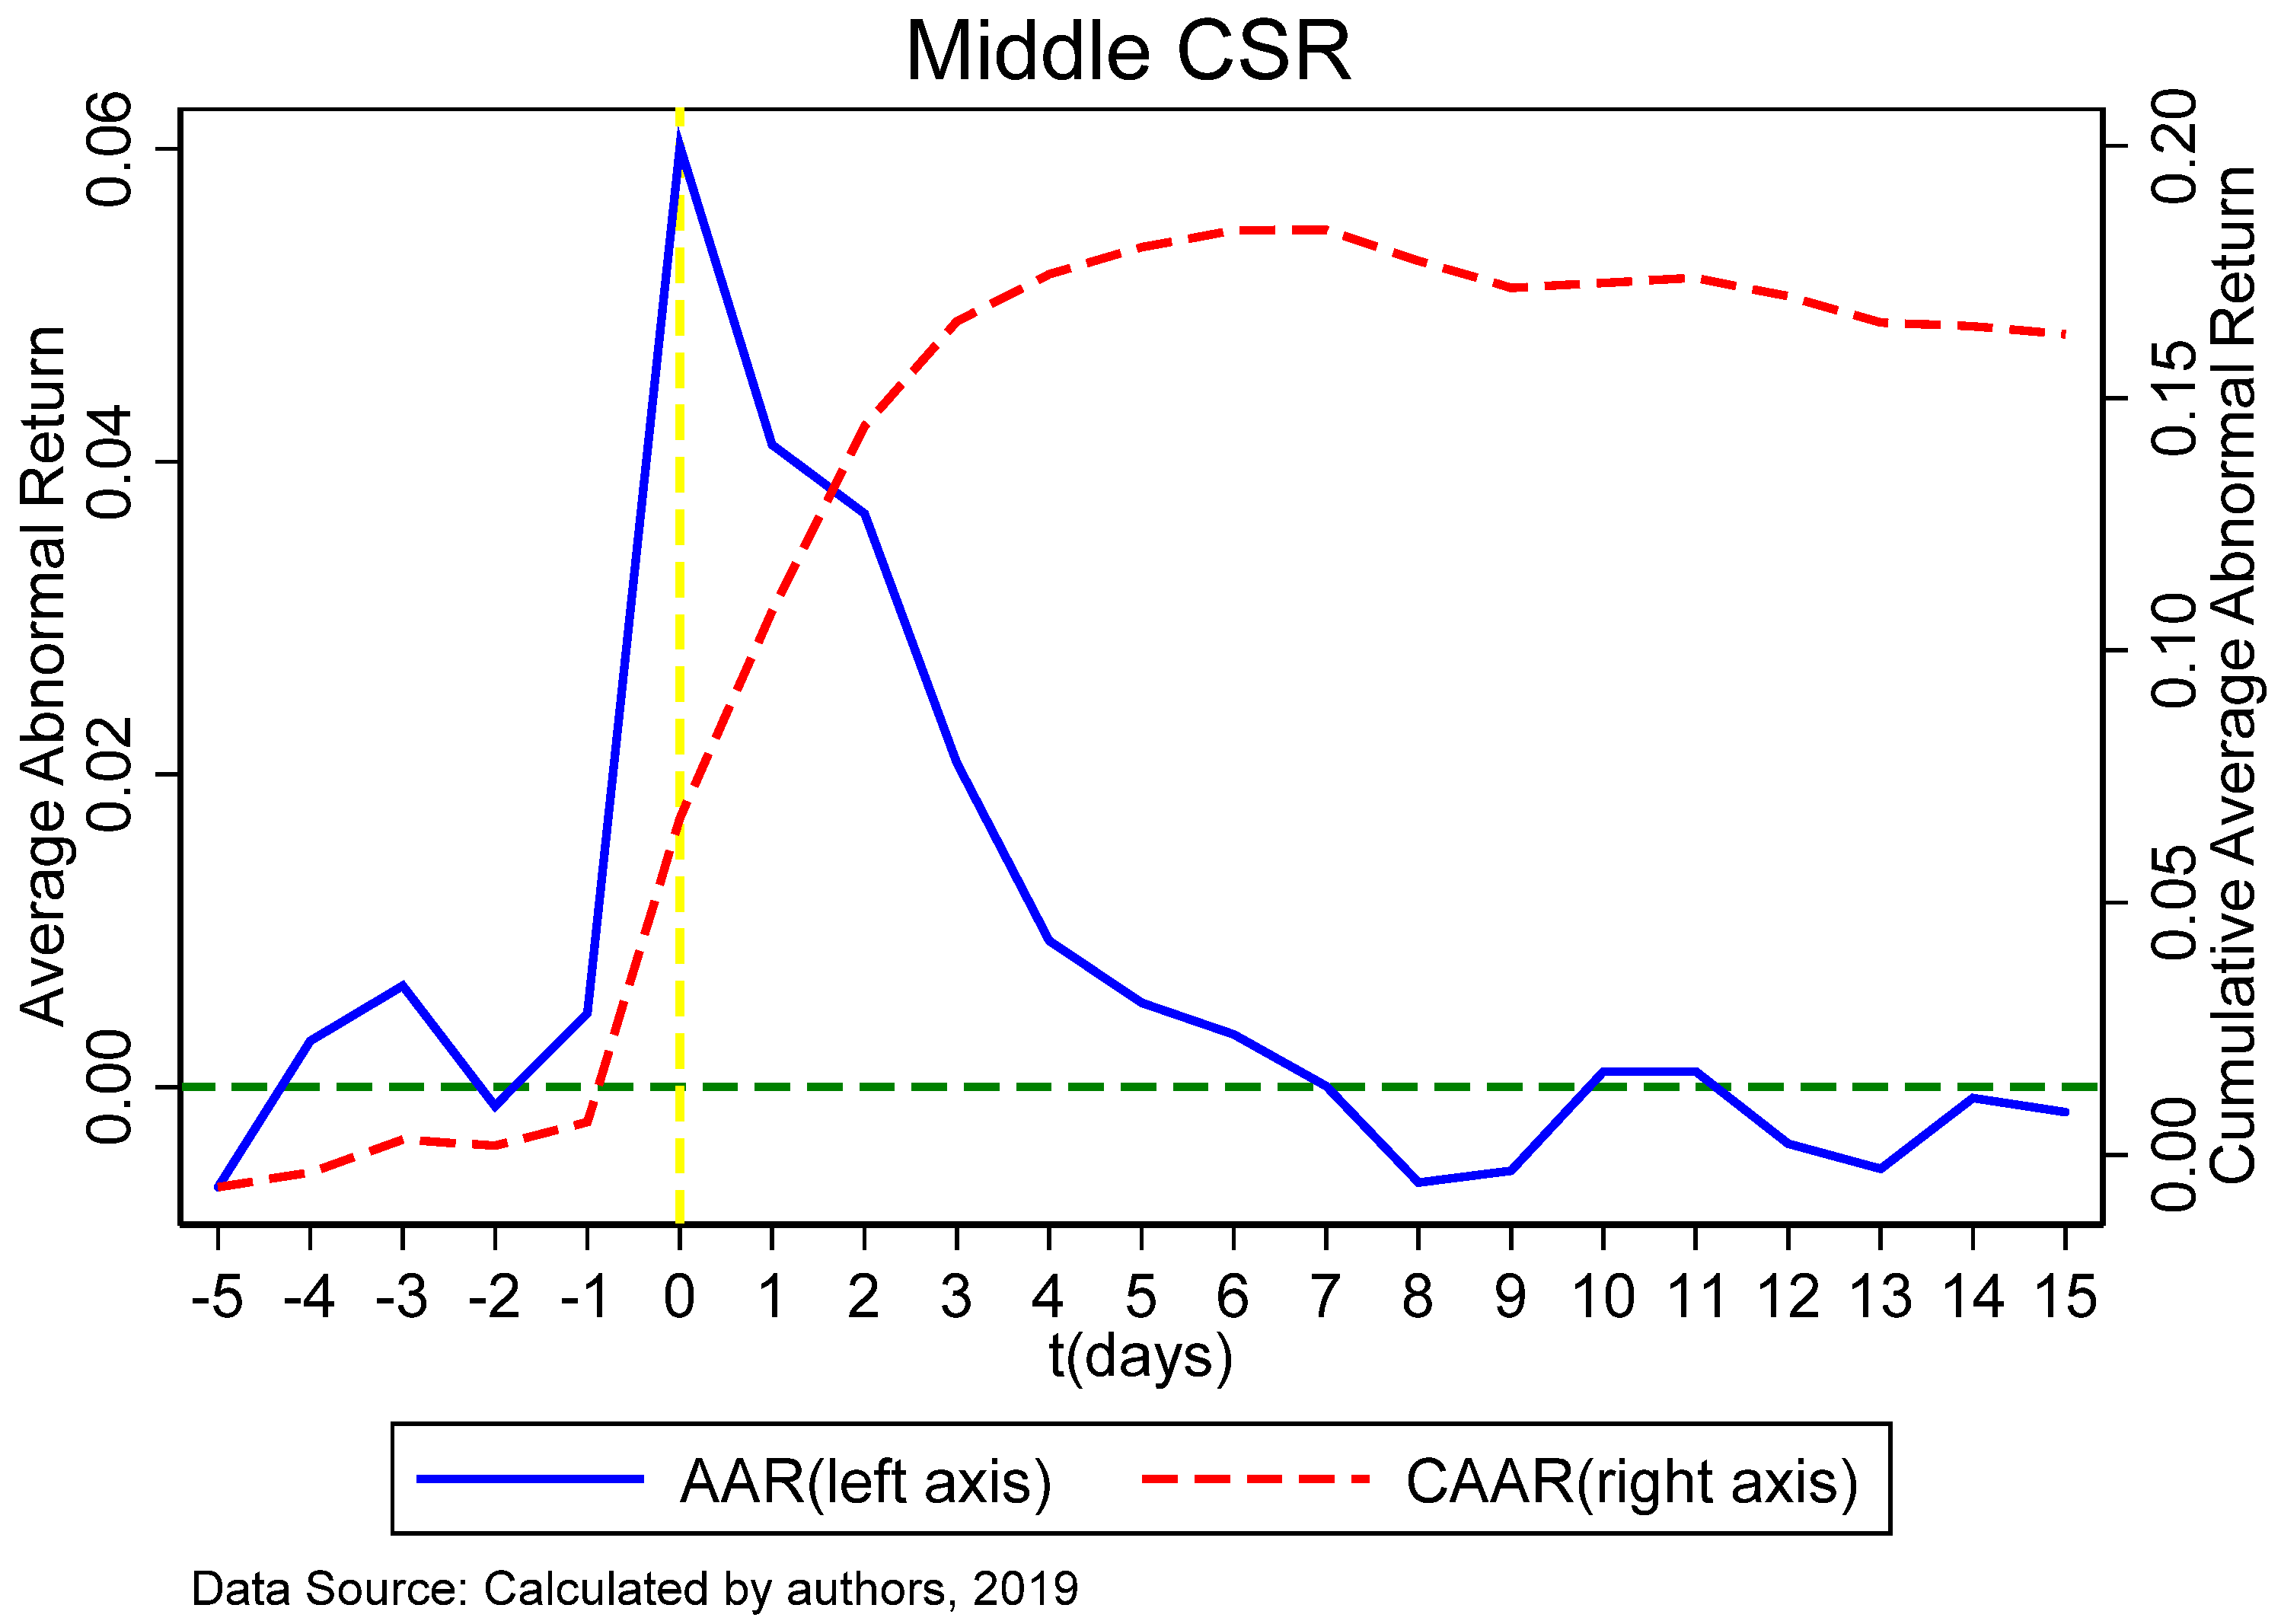
Figure 2 and Table 6 show the AAR and CAAR for the mid-CSR group. From the perspective of the AAR, on the day of the announcement day (t = 0), there was a significant nonzero excess return at the 5% confidence level, which lasted for three trading days after the announcement date (t = 3). For the 15 trading days after the announcement, the CAAR of the merger was 0.163.
This figure shows that investors invest in medium CSR acquirers, after the M&A announcement for the AAR and CAAR that investors can obtain from the five trading days before the merger announcement date to the next 15 trading days.
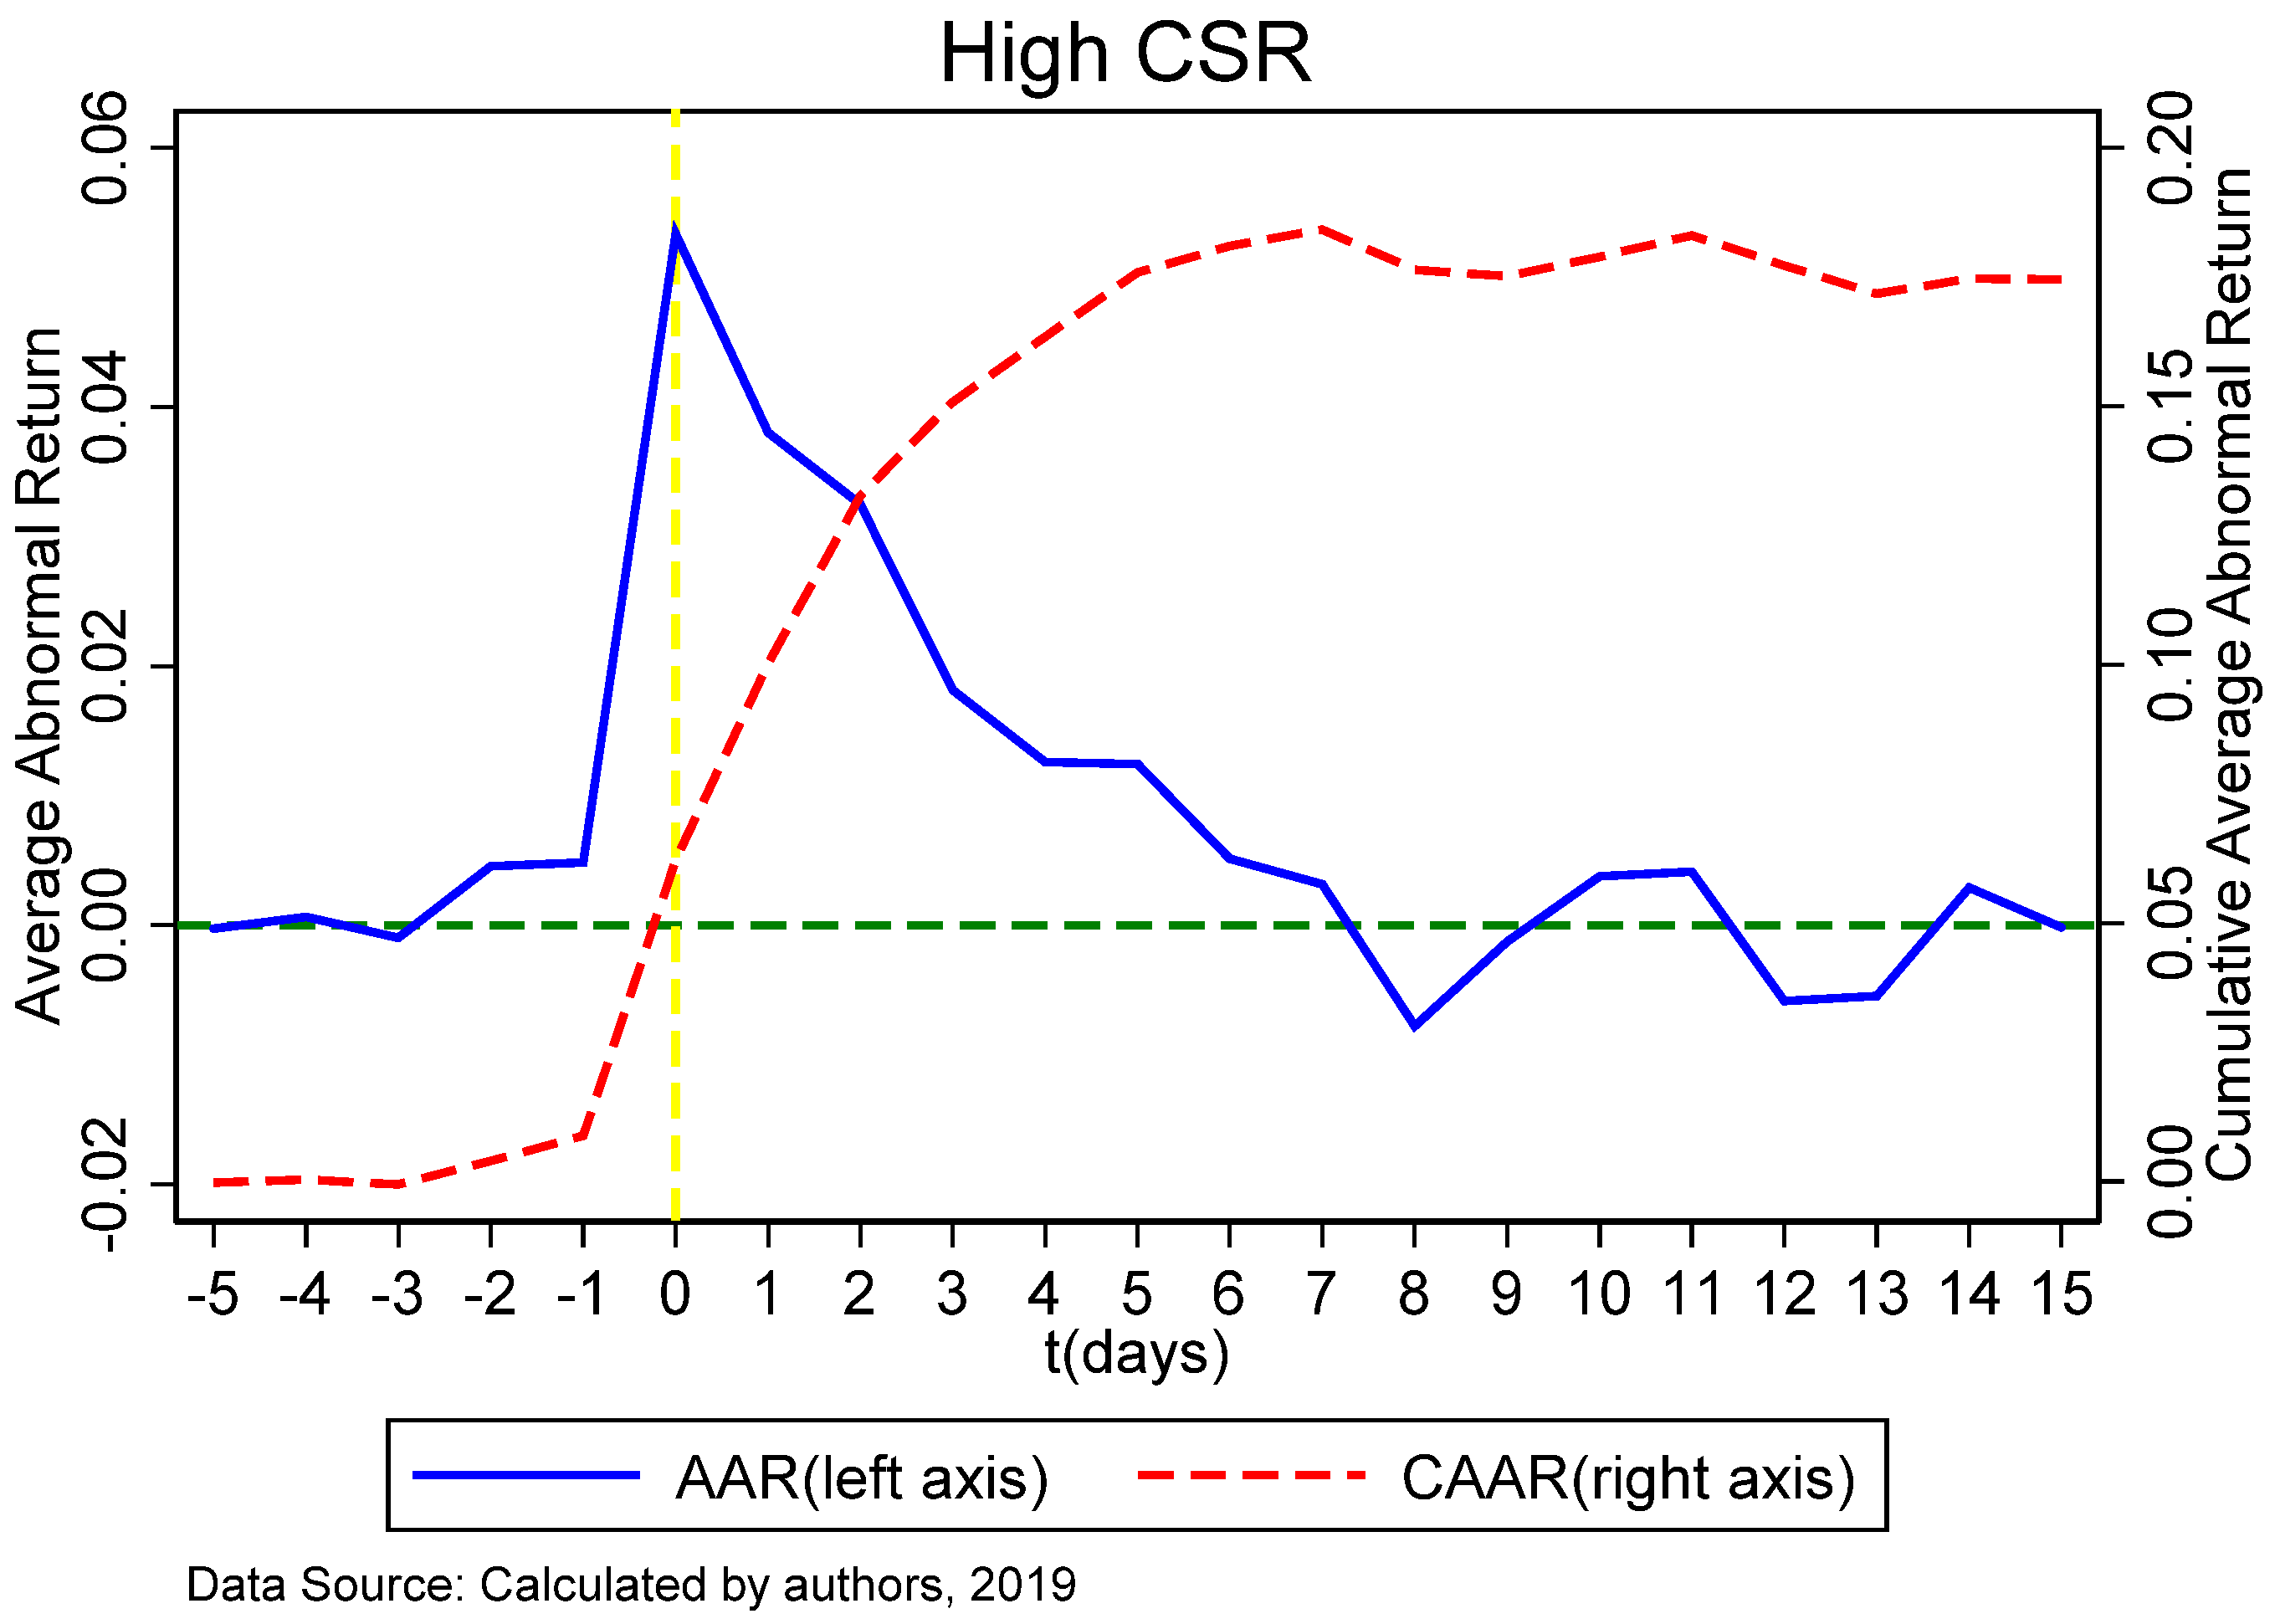
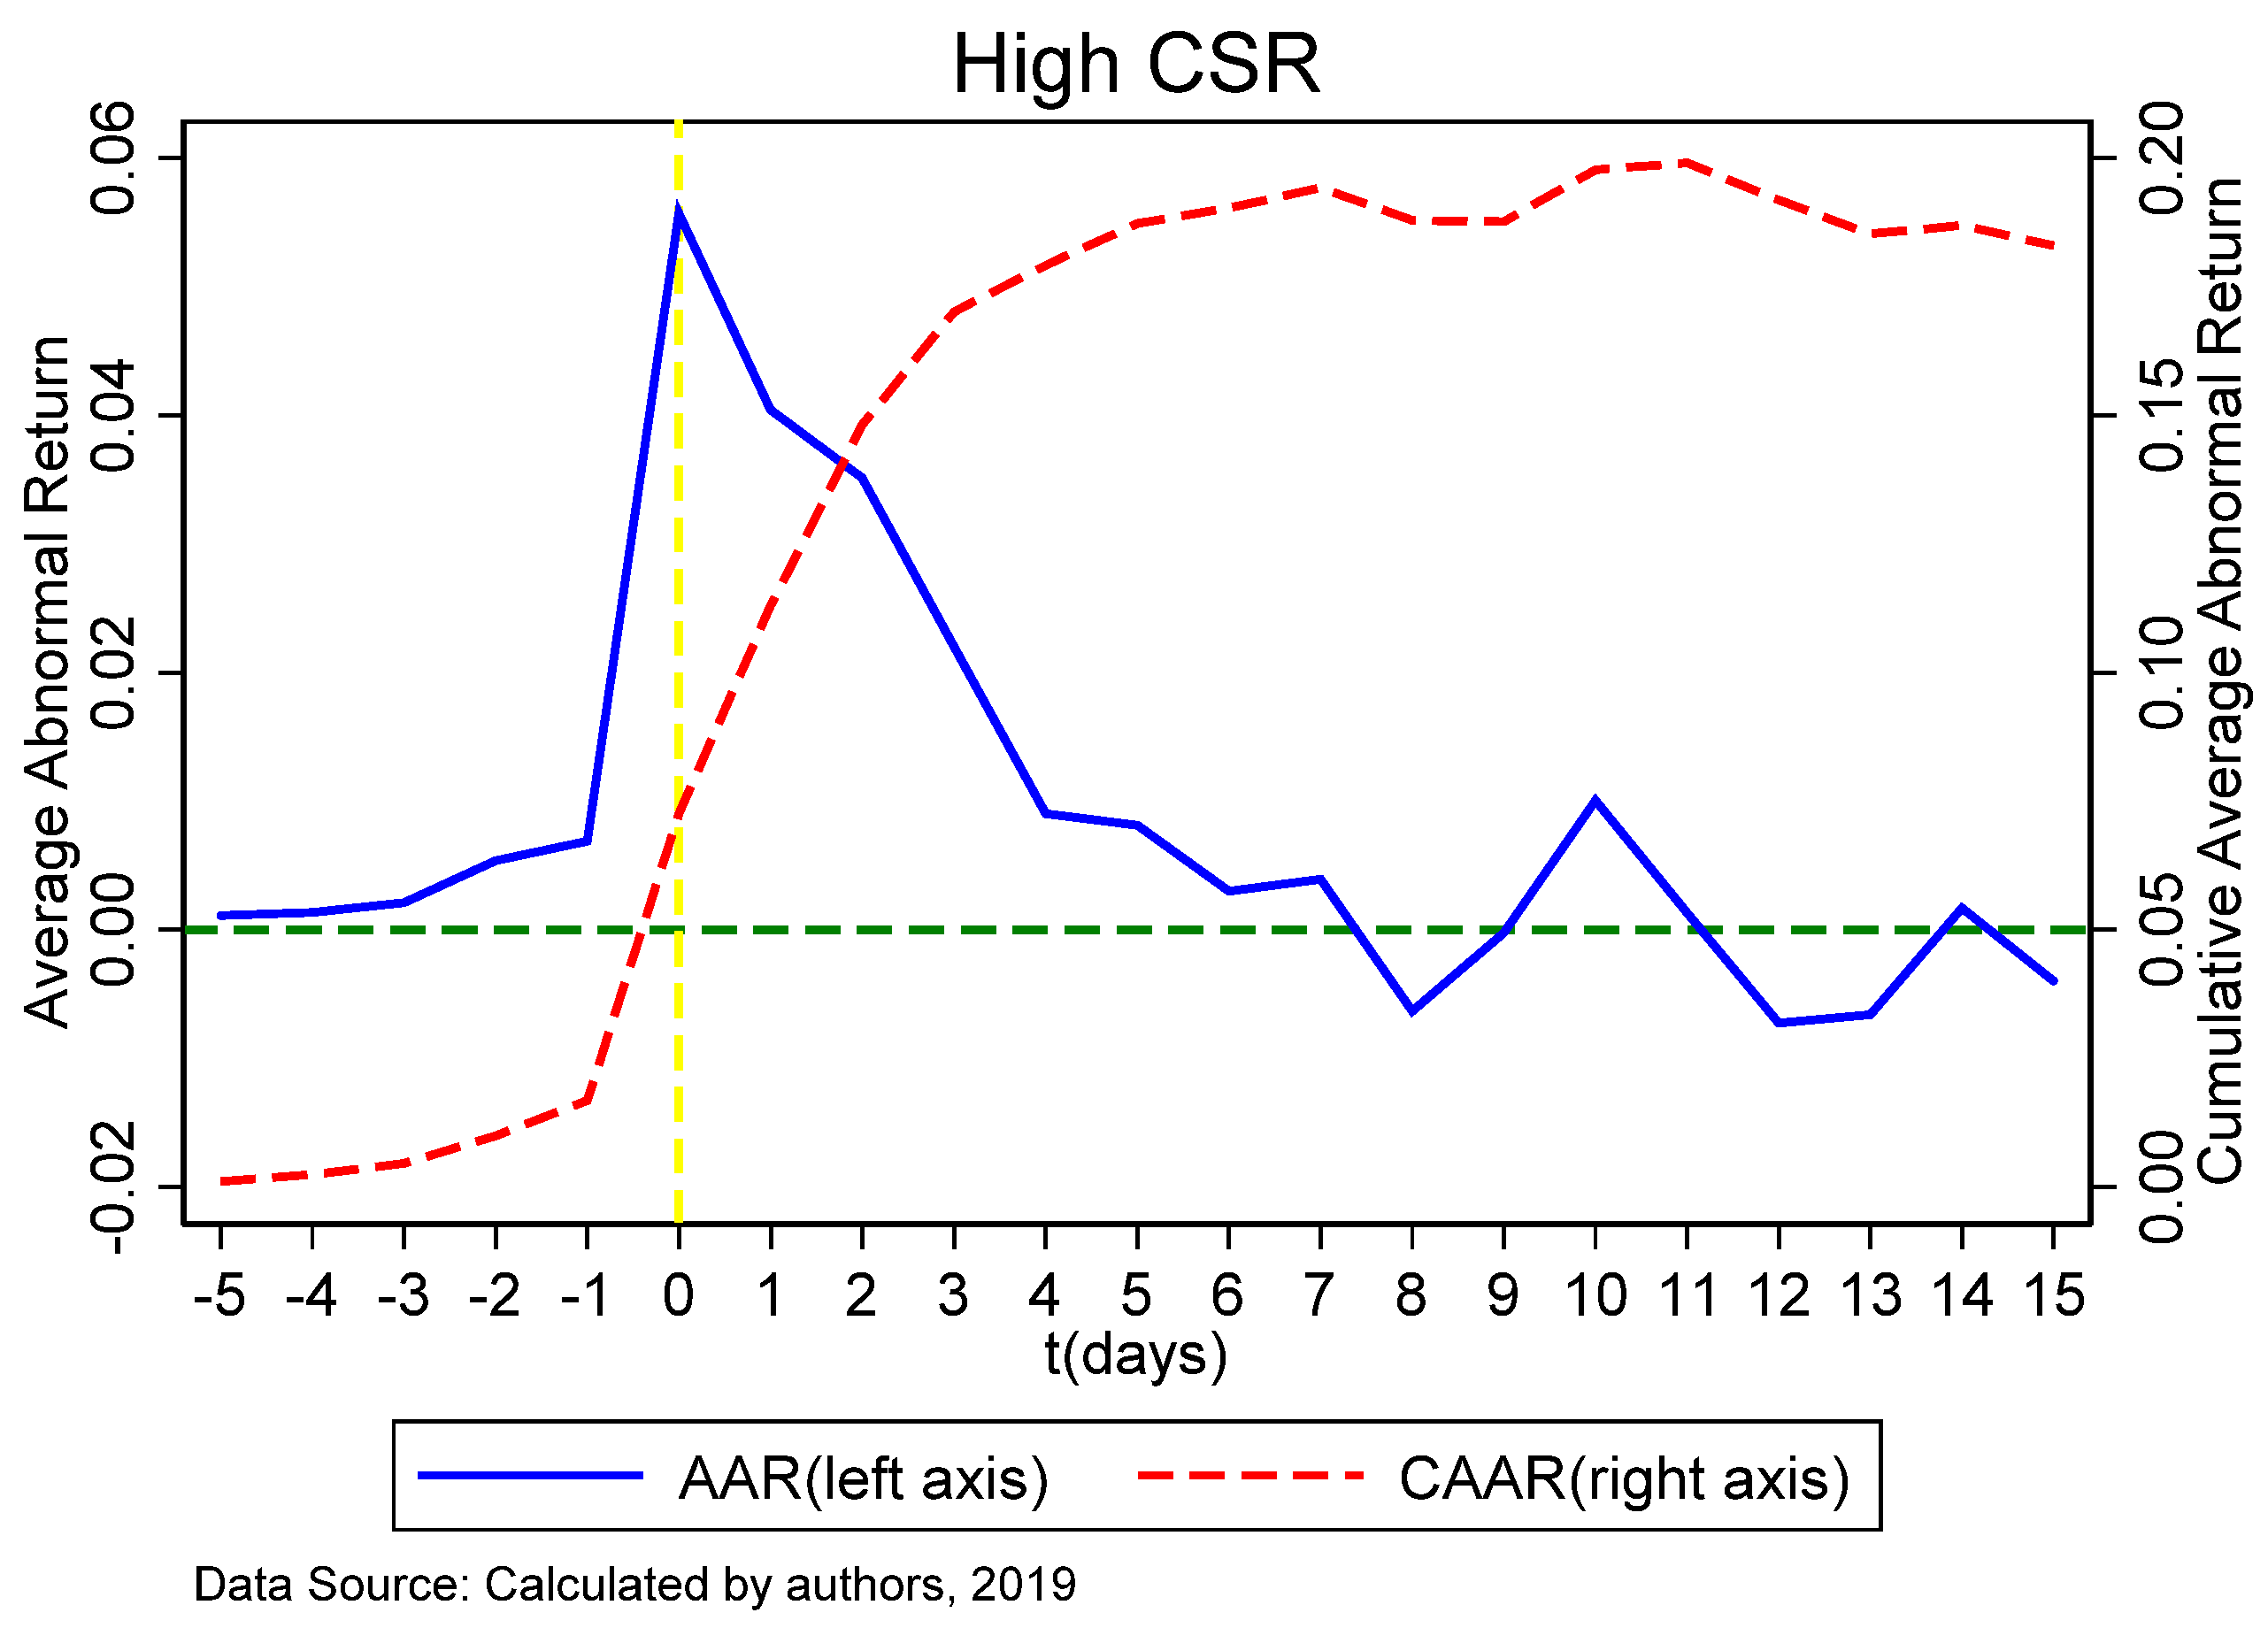
Figure 3 and Table 7 show the AAR and CAAR for the high CSR group. From the perspective of AAR, on the announcement day (t = 0), there was a significant nonzero excess return at the 5% confidence level, which lasted for two trading days after the announcement date (t = 2). For the 15 trading days after the announcement, the CAAR of the merger was 0.174.
By comparing the high, medium, and low CSR groups, the AAR and CAAR showed that (1) for Chinese listed companies, the AAR of the low-CSR group companies was one trading day before (t = −1) and six trading days after the announcement date (t = 6), and the reaction time was longer than for the other two groups. (2) For the five trading days before the announcement date (t = −5) and the 15 trading days (t = 15) after the announcement date, the CAAR of the acquirers in the low CSR group was 0.270, which was much higher than for the other two groups. These conclusions indicate that, given the announcement effect, market investors were more likely to value a company’s M&A with low CSR performance in the previous year. This result may be related to the lack of effectiveness in the Chinese securities market, which means investors pay more attention to short-term speculation, and are less concerned about CSR and long-term performance growth.
5. Robustness Test
5.1. Grouped by CSR Average Score Two Years before the Announcement Date
We provided empirical analysis results for a company’s CSR scores in the year before the M&A announcement date. However, for market investors, some investors may be concerned about the CSR scores in the year or even the previous two years before the M&A announcement. Under the premise of avoiding a reduction in sample size, we also obtained the empirical results of the CSR groups two years before the merger announcement date, as shown in Figure 4, Figure 5 and Figure 6 and Table 8, Table 9 and Table 10. The results were consistent with the empirical results of the CSR scores one year prior to the M&A announcement date. This shows that our key conclusions were not affected by the CSR grouping rules.
5.2. Controlling for Other Factors Affecting the Acquirer’s CAR
Table 11 provides other factors that may affect the acquirer’s CAR. These mainly include the size of the company and cash abundance and affect the occurrence of a company’s M&A, as well as the value judgment on the investors of the CSR of the acquirer. From the table, CSR was significantly negative in all models, indicating that the higher the acquirer’s CSR score in the previous year, the lower the announcement day effect of its merger is. This result confirms the results of the empirical analysis.
6. Conclusions
Based on the literature, we used the CSR scoring system from Hexun Finance to group Chinese listed companies according to their CSR scores. By comparing the high-, medium-, and low- CSR groups, as well as AAR and CAAR of the companies in the three M&A groups, we found that Chinese market investors are generally more likely to value acquirers with lower CSR performance in the previous year, whereas the acquirers with better CSR performance are hardly accepted. Empirical research on the CSR responses of the acquirers of Chinese companies to market investors is challenging.
First, it is difficult to obtain complete Chinese companies’ CSR data. Although the official websites of the Shanghai Stock Exchange and Shenzhen Stock Exchange have CSR reports, these data are scattered, not having been formatted. At the same time, the data lack a complete indicator system. Although RKS Company provides formatted data, we can download data only for 2009 to 2011. The smaller samples may affect the statistical robustness of the results. To address this challenge, we selected CSR evaluation data from Hexun Finance website because they have a relatively complete evaluation system and cover all CSR aspects. We trawled the CSR data of 3564 listed companies from 2010 to 2017 from the Hexun Financial website. Compared with existing Chinese studies, ours is a relatively large dataset.
Second, most of the CSR literature only calculates the correlation between CSR and AR or CAR of the acquirer from the large sample statistics. The existing studies rarely study the actual rate of return of investors after investing in good or bad CSR companies from the perspective of securities market investors and do not dynamically describe the reaction time and intensity of market investors at the M&A announcement day. To address this challenge, we used a different research method: without significantly reducing the number of observations, we sorted and grouped the samples from high to low according to the CSR score of the previous year. To eliminate the interference of external random factors as much as possible, we calculated AAR and CAAR of investors on a daily basis and conducted a statistical significance test. We also used figures to dynamically present the actual and cumulative returns of investors investing in different CSR performance groups on each trading day, thus clarifying whether investors in China’s securities market are more concerned about the CSR performance of the acquirer.
Our findings may be due to the development stage of the Chinese economy. In past decades, governments, regulators, companies, and market investors all focused on the short-term profits of enterprises, thus neglecting long-term sustainability, such as CSR. Although the UN Sustainable Stock Exchange Initiative was established in 2009, China did not join this organization until September 2017. Therefore, regulators, corporates, and market investors in the Chinese financial market have formed their financial consciousness of sustainable development until that time. As the second biggest economy and third largest securities market, the Chinese financial market can draw several policy implications from our study as follows. First, governments can amend the Corporation Act to specify companies’ environmental and social responsibilities in terms of sustainable development goals. Second, security regulators can encourage and guide market investors to invest in companies with long-term CSR performance. Third, exchanges can force listed companies to disclose relevant information about sustainable development and enhance the quantity and quality of their CSR information. Fourth, exchanges can also educate listed companies and market investors and provide trainings to improve their knowledge. Finally, the structure of investors in the Chinese financial market needs to be improved and the proportion of institutional investors increased. From the perspective of the risk preference of investors, individual investors always care more about short-term profits rather than long-term investment value. In other words, they focus on immediate benefits from M&A, but not on long-term value promotion such as from CSR performance. Overall, the suggestions above will improve the relationship between the sustainable development of listed companies and the valuations of market investors.
Due to the limited sample size, we used grouping and summing to calculate the average CSR scores of the previous year and previous two years and the announcement day effect of the acquirer. As detailed company data were insufficient, such as CSR expenses, the positive media effect from investing in CSR, increase in production efficiency, and reduction in production safety accidents and potential CSR lawsuits, we did not further test the effect of the channel of CSR transmission on the acquirer’s announcement. Due to the lack of global listed company data, we also did not test the effect of CSR on the acquirer announcement date in the securities markets of different countries. If more detailed data can be obtained in the future, several potential transmission mechanisms can be tested. If global sample M&A data could be collected, the maturity of the country’s capital market (e.g., number, types, and sizes of institutional investors) could be considered to further study the maturity of different capital markets. Under these circumstances, as a company’s social responsibility aspect reacts to market investors, more detailed conclusions could be obtained.
Author Contributions
M.L. wrote the article. F.Z. performed the formal analysis. M.Z. analyzed the data.
Funding
This research was funded by the National Natural Science Foundation of China (grant no. 71603085), the China Postdoctoral Science Foundation (grant no. 2016M600292; and 2017T100280), Fundamental Research Funds for the Central Universities (2017ECNU-YYJ026), and the Shanghai M&A Financial Research Institute Science Foundation.
Conflicts of Interest
The authors declare no conflict of interest.
References
- Kim, Y.; Park, M.S.; Wier, B. Is Earnings Quality Associated with Corporate Social Responsibility? Account. Rev. 2012, 87, 761–796. [Google Scholar] [CrossRef]
- Diamond, D.W.; Verrecchia, R.E. Disclosure, Liquidity, and the Cost of Capital. J. Financ. 1991, 46, 1325–1359. [Google Scholar] [CrossRef] [Green Version]
- Lambert, R.; Leuz, C.; Verrecchia, R.E. Accounting Information, Disclosure, and the Cost of Capital. J. Account. Res. 2007, 45, 385–420. [Google Scholar] [CrossRef] [Green Version]
- Dhaliwal, D.S.; Li, O.Z.; Tsang, A.; Yang, Y.G. Voluntary Nonfinancial Disclosure and the Cost of Equity Capital: The Initiation of Corporate Social Responsibility Reporting. Account. Rev. 2011, 86, 59–100. [Google Scholar] [CrossRef]
- Goss, A.; Roberts, G.S. The impact of corporate social responsibility on the cost of bank loans. J. Bank. Financ. 2011, 35, 1794–1810. [Google Scholar] [CrossRef]
- Ge, W.; Liu, M. Corporate social responsibility and the cost of corporate bonds. J. Account. Public Policy 2015, 34, 597–624. [Google Scholar] [CrossRef]
- Gomes, M. Does CSR influence M&A target choices? Financ. Res. Lett. 2018. [Google Scholar] [CrossRef]
- Gomes, M.; Marsat, S. Does CSR impact premiums in M&A transactions? Financ. Res. Lett. 2018, 26, 71–80. [Google Scholar]
- Al-Tuwaijri, S.A.; Christensen, T.E.; Hughes, K.E. The Relations among Environmental Disclosure, Environmental Performance, and Economic Performance: A Simultaneous Equations Approach. Account. Organ. Soc. 2004, 29, 447–471. [Google Scholar] [CrossRef]
- Renneboog, L.; Ter Horst, J.; Zhang, C. Socially responsible investments: Institutional aspects, performance, and investor behavior. J. Bank. Financ. 2008, 32, 1723–1742. [Google Scholar] [CrossRef]
- Yen, T.Y.; Paul André, P. Market reaction to the effect of corporate social responsibility on mergers and acquisitions: Evidence on emerging markets. Q. Rev. Econ. Financ. 2019, 71, 114–131. [Google Scholar] [CrossRef]
- Blasi, S.; Caporin, M.; Fontini, F. A multidimensional analysis of the relationship between corporate social responsibility and firms’ economic performance. Ecol. Econ. 2018, 147, 218–229. [Google Scholar] [CrossRef]
- Cho, S.J.; Chung, C.Y.; Young, J. Study on the relationship between CSR and financial performance. Sustainability 2019, 11, 343. [Google Scholar] [CrossRef]
- Esteban-Sanchez, P.; Cuesta-Gonzalez, M.; Paredes-Gazquez, J.D. Corporate social performance and its relation with corporate financial performance: International evidence in the banking industry. J. Clean. Prod. 2017, 162, 1102–1110. [Google Scholar] [CrossRef]
- Kao, E.H.; Yeh, C.C.; Wang, L.H.; Fung, H.G. The relationship between CSR and performance: Evidence in China. Pac.-Basin Financ. J. 2018, 51, 155–170. [Google Scholar] [CrossRef]
- Li, K.; Khalili, N.R.; Cheng, W. Corporate social responsibility practices in China: Trends, context, and impact on company performance. Sustainability 2019, 11, 354. [Google Scholar] [CrossRef]
- Lins, K.V.; Servaes, H.; Tamayo, A. Social capital, trust, and firm performance: The value of corporate social responsibility during the financial crisis. J. Financ. 2017, 4, 1785–1824. [Google Scholar] [CrossRef]
- Price, J.M.; Sun, W. Doing good and doing bad: The impact of corporate social responsibility and irresponsibility on firm performance. J. Bus. Res. 2017, 80, 82–97. [Google Scholar] [CrossRef]
- Wang, Z.; Sarkis, J. Corporate social responsibility governance, outcomes, and financial performance. J. Clean. Prod. 2017, 162, 1607–1616. [Google Scholar] [CrossRef]
- Bhardwaj, P.; Chatterjee, P.; Demir, K.D.; Turut, O. When and how is corporate social responsibility profitable? J. Bus. Res. 2018, 84, 206–219. [Google Scholar] [CrossRef]
- Becchetti, L.; Ciciretti, R.; Hasan, I.; Kobeissi, N. Corporate social responsibility and shareholder’s value. J. Bus. Res. 2012, 65, 1628–1635. [Google Scholar] [CrossRef]
- Chen, E.; Gavious, I. Does CSR have different value implications for different shareholders? Financ. Res. Lett. 2015, 14, 29–35. [Google Scholar] [CrossRef]
- Chung, C.Y.; Jung, S.; Young, J. Do CSR activities increase firm value? Evidence from the Korean market. Sustainability 2018, 10, 3164. [Google Scholar] [CrossRef]
- Dyck, I.J.A.; Lins, K.V.; Roth, L.; Wagner, H.F. Do institutional investors drive corporate social responsibility? International evidence. J. Financ. Econ. 2019, 131, 693–714. [Google Scholar] [CrossRef]
- Fatemi, A.; Fooladi, I.; Tehranian, H. Valuation effects of corporate social responsibility. J. Bank. Financ. 2015, 59, 182–192. [Google Scholar] [CrossRef]
- Krüger, P. Corporate goodness and shareholder wealth. J. Financ. Econ. 2015, 115, 304–329. [Google Scholar] [CrossRef]
- Nguyen, P.A.; Kecskes, A.; Mansi, S. Does corporate social responsibility create shareholder value? The importance of long-term investors. J. Bank. Financ. 2017. [Google Scholar] [CrossRef]
- Richardson, A.J.; Welker, M. Social disclosure, financial disclosure and the cost of equity capital. Account. Organ. Soc. 2001, 26, 597–616. [Google Scholar] [CrossRef]
- Ye, K.; Zhang, R. Do lenders value corporate social responsibility? Evidence from China. J. Bus. Ethics 2011, 104, 197–206. [Google Scholar] [CrossRef]
- Becchetti, L.; Ciciretti, R.; Hasan, I. Corporate social responsibility, stakeholder risk, and idiosyncratic volatility. J. Corp. Financ. 2013, 35, 297–309. [Google Scholar] [CrossRef]
- Hao, D.Y.; Qi, G.Y.; Wang, J. Corporate social responsibility, internal controls, and stock price crash risk: The Chinese stock market. Sustainability 2018, 10, 1675. [Google Scholar] [CrossRef]
- Cheung, A. Corporate social responsibility and corporate cash holdings. J. Corp. Financ. 2016, 37, 412–430. [Google Scholar] [CrossRef]
- Bhandari, A.; Javakhadze, D. Corporate social responsibility and capital allocation efficiency. J. Corp. Financ. 2017, 43, 354–377. [Google Scholar] [CrossRef]
- Gangi, F.; Salerno, D.; Meles, A.; Daniele, L.M. Do corporate social responsibility and corporate governance influence intellectual capital efficiency? Sustainability 2019, 11, 1899. [Google Scholar] [CrossRef]
- Martinez-Conesa, I.; Soto-Acosta, P.; Manzano, M.P. Corporate social responsibility and its effect on innovation and firm performance: An empirical research in SMEs. J. Clean. Prod. 2017, 142, 2374–2383. [Google Scholar] [CrossRef]
- Cho, S.Y.; Lee, C.; Pfeiffer, R.J. Corporate social responsibility performance and information asymmetry. J. Account. Public Policy 2013, 32, 71–83. [Google Scholar] [CrossRef]
- Bekier, M.M.; Bogardus, A.J.; Oldham, T. Why mergers fail. In The McKinsey Quarterly; McKinsey Quarterly & Company: Seattle, WA, USA, 2001. [Google Scholar]
- Aktas, N.; Bodt, E.D.; Cousin, J.G. Do financial markets care about SRI? Evidence from mergers and acquisitions. J. Bank. Financ. 2011, 35, 1753–1761. [Google Scholar] [CrossRef]
- Deng, X.; Kang, J.-K.; Low, B.S. Corporate social responsibility and stakeholder value maximization: Evidence from mergers. J. Financ. Econ. 2013, 110, 87–109. [Google Scholar] [CrossRef]
- Arouri, M.; Gomes, M.; Pukthuanthong, K. Corporate social responsibility and M&A uncertainty. J. Corp. Financ. 2019, 56, 176–198. [Google Scholar]
- Qiao, M.Z.; Xu, S.W.; Wu, G.D. Corporate social responsibility and the long-term performance of mergers and acquisitions: Do regions and related-party transactions matter? Sustainability 2018, 10, 2276. [Google Scholar] [CrossRef]
Figure 1.
The average abnormal return (AAR) and cumulative average abnormal return (CAAR) of the low CSR group.
Figure 1.
The average abnormal return (AAR) and cumulative average abnormal return (CAAR) of the low CSR group.

Figure 2.
The AAR and CAAR of the medium CSR group.

Figure 3.
AAR and CAAR of the high-CSR group.

Figure 4.
AAR and CAAR of the CSR score groups two years before M&A for the low-CSR.

Figure 5.
AAR and CAAR of the CSR score grouping two years before M&A for the medium-CSR group.

Figure 6.
AAR and CAAR of the CSR score grouping two years before M&A for the high-CSR group.


Table 1.
Hexun Finance’s listed three-level evaluation system for company social responsibility. The indicator system comes from the Hexun Finance website. The weight of each indicator in the corporate social responsibility (CSR) scoring system is show within parentheses.
Table 1.
Hexun Finance’s listed three-level evaluation system for company social responsibility. The indicator system comes from the Hexun Finance website. The weight of each indicator in the corporate social responsibility (CSR) scoring system is show within parentheses.
| First-Level | Second Level | Third Level |
|---|---|---|
| Shareholder responsibility (30%) | Earnings (10%) | Return on equity (2%), return on assets (2%), chief return on assets (2%), earnings per share (2%) |
| Return on cost and expense (1%), undistributed profit per share (1%) | ||
| Debt paying (3%) | Debt ratio (1%) | |
| Quick ratio (0.5%), current ratio (0.5%) | ||
| cash ratio (0.5%), equity ratio (0.5%) | ||
| Returns (8%) | Dividend yield ratio (3%), dividend share (3%) | |
| Dividend financing ratio (2%) | ||
| Information disclosure (5%) | Number of penalties imposed by the exchange on companies and related responsible persons (5%) | |
| Innovation (4%) | Number of technical innovation projects (2%) | |
| Expenditure on product development (1%), concept of technical innovation (1%) | ||
| Employee responsibility (15%) | Performance (5%) | Per capita income of employees (4%) |
| Staff training (1%) | ||
| Safety (5%) | Safety training (3%) | |
| Safety check (2%) | ||
| Caring for employees (5%) | Consoling employees (2%), consolation money (2%) | |
| Consolation consciousness (1%) | ||
| Supplier customer and customer responsibility (15%) | Product quality (7%) | Quality management system certificate (4%) |
| Quality management awareness (3%) | ||
| After-sales service (3%) | Customer satisfaction survey (3%) | |
| Integrity and reciprocity (5%) | Fair competition among suppliers (3%) | |
| Anti-commercial bribery training (2%) | ||
| Environmental responsibility (20%) | Environmental governance (20%) | Amount of environmental protection input (5%) |
| Number of pollutant discharge types (5%) | ||
| Number of energy saving types (5%) | ||
| Environmental management system certification (3%) | ||
| Environmental awareness (2%) | ||
| Social responsibility (20%) | Contributed value (20%) | Income tax as a percentage of total profit (10%) |
| Amount of public welfare donation (10%) |
Table 2.
CSR scores of listed companies in China.
| Year | 2010 | 2011 | 2012 | 2013 | 2014 | 2015 | 2016 | 2017 | ||
|---|---|---|---|---|---|---|---|---|---|---|
| Sub-indicators of CSR | Shareholder responsibility | Mean | 13.44 | 3.18 | 2.54 | 2.71 | 5.27 | 27.13 | 13.44 | 3.18 |
| Min | −9.91 | −0.02 | 0.00 | 0.00 | −15.00 | −8.69 | −9.91 | −0.02 | ||
| Max | 20.47 | 15.00 | 20.00 | 30.00 | 30.00 | 85.77 | 20.47 | 15.00 | ||
| Employee responsibility | Mean | 14.11 | 3.23 | 2.74 | 2.86 | 5.37 | 28.31 | 14.11 | 3.23 | |
| Min | −11.27 | −0.09 | 0.00 | 0.00 | −15.00 | −10.78 | −11.27 | −0.09 | ||
| Max | 27.28 | 15.00 | 20.00 | 30.00 | 29.00 | 85.92 | 27.28 | 15.00 | ||
| Supplier customer and consumer responsibility | Mean | 14.64 | 3.49 | 2.95 | 3.29 | 5.00 | 29.36 | 14.64 | 3.49 | |
| Min | −11.69 | −0.17 | 0.00 | 0.00 | −15.00 | −14.81 | −11.69 | −0.17 | ||
| Max | 28.01 | 15.00 | 20.00 | 30.00 | 30.00 | 89.12 | 28.01 | 15.00 | ||
| Environmental responsibility | Mean | 14.40 | 3.05 | 2.93 | 2.85 | 5.31 | 28.55 | 14.40 | 3.05 | |
| Min | −10.28 | 0.00 | 0.00 | 0.00 | −15.00 | −12.74 | −10.28 | 0.00 | ||
| Max | 28.19 | 15.00 | 20.00 | 30.00 | 30.00 | 90.87 | 28.19 | 15.00 | ||
| Social responsibility | Mean | 13.61 | 1.84 | 0.62 | 0.59 | 4.54 | 21.20 | 13.61 | 1.84 | |
| Min | −13.12 | 0.00 | 0.00 | 0.00 | −15.00 | −15.11 | −13.12 | 0.00 | ||
| Max | 27.84 | 15.00 | 20.00 | 30.00 | 29.03 | 88.09 | 27.84 | 15.00 | ||
| CSR | Mean | 13.54 | 2.24 | 1.14 | 1.14 | 4.56 | 22.62 | 13.54 | 2.24 | |
| Min | −12.67 | 0.00 | 0.00 | 0.00 | −15.00 | −17.09 | −12.67 | 0.00 | ||
| Max | 27.35 | 15.00 | 20.00 | 30.00 | 29.27 | 90.00 | 27.35 | 15.00 | ||
| Number of listed companies | 2390 | 2660 | 2846 | 3140 | 3506 | 3541 | 3539 | 3534 | ||
This table presents the number of listed companies and scores of each of the classified indicators crawled from the Hexun Finance website.
Table 3.
Sample of M&A with available CSR data. Since we grouped companies according to the CSR score of the previous year, the sample of M&As is up to 2017 as 2018 data would not be complete until the fall of 2019. Therefore, the data on the CSR group only need to cover up to 2016. This table presents the annual distribution of the differences in CSR scores in our study. Our sample contained 317 M&A events during 2010–2016.
| Year | CSR Score | ||||||
|---|---|---|---|---|---|---|---|
| High CSR | Medium CSR | Low CSR | Total | ||||
| Number of Deals | Proportion (%) | Number of Deals | Proportion (%) | Number of Deals | Proportion (%) | Number of Deals | |
| 2010 | 16 | 57.14 | 5 | 17.86 | 7 | 25.00 | 28 |
| 2011 | 13 | 38.24 | 13 | 38.24 | 8 | 23.53 | 34 |
| 2012 | 32 | 47.76 | 18 | 26.87 | 17 | 25.37 | 67 |
| 2013 | 59 | 49.58 | 38 | 31.93 | 22 | 18.49 | 119 |
| 2014 | 18 | 32.73 | 18 | 32.73 | 19 | 34.55 | 55 |
| 2015 | 2 | 18.18 | 5 | 45.45 | 4 | 36.36 | 11 |
| 2016 | 1 | 33.33 | 0 | 0.00 | 2 | 66.67 | 3 |
| Total | 141 | 44.48 | 97 | 30.60 | 79 | 24.92 | 317 |
Table 4.
Number and proportion of companies with positive CAR with different CSR scores.
| t (days) | High CSR | Medium CSR | Low CSR | |||
|---|---|---|---|---|---|---|
| Number | Prop. (%) | Number | Prop. (%) | Number | Prop. (%) | |
| −5 | 65 | 46.10 | 43 | 44.33 | 34 | 43.04 |
| −4 | 68 | 48.23 | 46 | 47.42 | 43 | 54.43 |
| −3 | 71 | 50.35 | 53 | 54.64 | 41 | 51.90 |
| −2 | 78 | 55.32 | 47 | 48.45 | 41 | 51.90 |
| −1 | 84 | 59.57 | 57 | 58.76 | 49 | 62.03 |
| 0 | 113 | 80.14 | 72 | 74.23 | 59 | 74.68 |
| 1 | 124 | 87.94 | 75 | 77.32 | 61 | 77.22 |
| 2 | 116 | 82.27 | 75 | 77.32 | 63 | 79.75 |
| 3 | 112 | 79.43 | 75 | 77.32 | 59 | 74.68 |
| 4 | 110 | 78.01 | 72 | 74.23 | 59 | 74.68 |
| 5 | 107 | 75.89 | 70 | 72.16 | 57 | 72.15 |
| 6 | 107 | 75.89 | 67 | 69.07 | 54 | 68.35 |
| 7 | 107 | 75.89 | 68 | 70.10 | 53 | 67.09 |
| 8 | 107 | 75.89 | 67 | 69.07 | 54 | 68.35 |
| 9 | 105 | 74.47 | 66 | 68.04 | 51 | 64.56 |
| 10 | 106 | 75.18 | 65 | 67.01 | 53 | 67.09 |
| 11 | 105 | 74.47 | 67 | 69.07 | 50 | 63.29 |
| 12 | 101 | 71.63 | 64 | 65.98 | 51 | 64.56 |
| 13 | 102 | 72.34 | 64 | 65.98 | 51 | 64.56 |
| 14 | 100 | 70.92 | 63 | 64.95 | 51 | 64.56 |
| 15 | 101 | 71.63 | 66 | 68.04 | 53 | 67.09 |
For example, in the third row of High CSR, t = −5, Number = 65 and Prop. (%) = 46.10, indicating that there are 65 observations with CAR > 0 in the high CSR group on the fifth trading day before the announcement date. The ratio of the high CSR group to the total sample is 46.10%.
Table 5.
Z-statistic test results of the AAR and the CAAR for the low CSR group.
| t (days) | AAR | CAAR | ||
|---|---|---|---|---|
| Value | p-Value | Value | p-Value | |
| −5 | 0.001 | 0.676 | 0.001 | 0.676 |
| −4 | −0.001 | 0.679 | 0.000 | 0.985 |
| −3 | 0.003 | 0.123 | 0.003 | 0.416 |
| −2 | 0.006 | 0.006 | 0.009 | 0.052 |
| −1 | 0.009 | 0.001 | 0.019 | 0.001 |
| 0 | 0.065 | 0.000 | 0.084 | 0.000 |
| 1 | 0.048 | 0.000 | 0.132 | 0.000 |
| 2 | 0.037 | 0.000 | 0.169 | 0.000 |
| 3 | 0.031 | 0.000 | 0.200 | 0.000 |
| 4 | 0.017 | 0.000 | 0.217 | 0.000 |
| 5 | 0.020 | 0.000 | 0.237 | 0.000 |
| 6 | 0.015 | 0.001 | 0.252 | 0.000 |
| 7 | 0.002 | 0.587 | 0.254 | 0.000 |
| 8 | 0.010 | 0.008 | 0.265 | 0.000 |
| 9 | 0.005 | 0.116 | 0.270 | 0.000 |
| 10 | 0.005 | 0.106 | 0.275 | 0.000 |
| 11 | 0.004 | 0.321 | 0.279 | 0.000 |
| 12 | −0.006 | 0.052 | 0.273 | 0.000 |
| 13 | −0.005 | 0.066 | 0.269 | 0.000 |
| 14 | −0.000 | 0.969 | 0.268 | 0.000 |
| 15 | 0.002 | 0.557 | 0.270 | 0.000 |
For example, in the fourth row of the table, t = −4, value = −0.001 and p-value = 0.679 for AAR, value = 0.000 and p-value = 0.985 for CAAR, indicating that, for the low CSR group, the AAR of the investor on the 4th trading day before the announcement date is −0.001, and the p-value corresponding to the yield is 0.679, the CAAR of the investor is 0.000, and the p value corresponding to the rate of return is 0.985.
Table 6.
Z-statistic test results of AAR and CAAR for the medium-CSR group.
| t (days) | AAR | CAAR | ||
|---|---|---|---|---|
| Value | p-Value | Value | p-Value | |
| −5 | −0.006 | 0.021 | −0.006 | 0.021 |
| −4 | 0.003 | 0.312 | −0.003 | 0.414 |
| −3 | 0.006 | 0.021 | 0.003 | 0.521 |
| −2 | −0.001 | 0.685 | 0.002 | 0.719 |
| −1 | 0.005 | 0.185 | 0.007 | 0.278 |
| 0 | 0.060 | 0.000 | 0.067 | 0.000 |
| 1 | 0.041 | 0.000 | 0.108 | 0.000 |
| 2 | 0.037 | 0.000 | 0.144 | 0.000 |
| 3 | 0.021 | 0.000 | 0.165 | 0.000 |
| 4 | 0.009 | 0.091 | 0.175 | 0.000 |
| 5 | 0.005 | 0.312 | 0.180 | 0.000 |
| 6 | 0.003 | 0.464 | 0.183 | 0.000 |
| 7 | 0.000 | 0.989 | 0.183 | 0.000 |
| 8 | −0.006 | 0.133 | 0.177 | 0.000 |
| 9 | −0.005 | 0.136 | 0.172 | 0.000 |
| 10 | 0.001 | 0.793 | 0.173 | 0.000 |
| 11 | 0.001 | 0.778 | 0.174 | 0.000 |
| 12 | −0.004 | 0.358 | 0.170 | 0.000 |
| 13 | −0.005 | 0.201 | 0.165 | 0.000 |
| 14 | −0.001 | 0.833 | 0.164 | 0.000 |
| 15 | −0.002 | 0.515 | 0.163 | 0.000 |
Table 7.
Z-statistic test results of AAR and CAAR for the high-CSR group.
| t (days) | AAR | CAAR | ||
|---|---|---|---|---|
| Value | p-Value | Value | p-Value | |
| −5 | −0.000 | 0.939 | −0.000 | 0.939 |
| −4 | 0.001 | 0.841 | 0.000 | 0.930 |
| −3 | −0.001 | 0.751 | −0.001 | 0.922 |
| −2 | 0.005 | 0.183 | 0.004 | 0.541 |
| −1 | 0.005 | 0.180 | 0.009 | 0.293 |
| 0 | 0.053 | 0.000 | 0.062 | 0.000 |
| 1 | 0.038 | 0.000 | 0.100 | 0.000 |
| 2 | 0.032 | 0.000 | 0.133 | 0.000 |
| 3 | 0.018 | 0.007 | 0.151 | 0.000 |
| 4 | 0.013 | 0.041 | 0.163 | 0.000 |
| 5 | 0.012 | 0.022 | 0.176 | 0.000 |
| 6 | 0.005 | 0.326 | 0.181 | 0.000 |
| 7 | 0.003 | 0.494 | 0.184 | 0.000 |
| 8 | −0.008 | 0.122 | 0.176 | 0.000 |
| 9 | −0.001 | 0.750 | 0.175 | 0.000 |
| 10 | 0.004 | 0.409 | 0.179 | 0.000 |
| 11 | 0.004 | 0.279 | 0.183 | 0.000 |
| 12 | −0.006 | 0.144 | 0.177 | 0.000 |
| 13 | −0.005 | 0.119 | 0.172 | 0.000 |
| 14 | 0.003 | 0.457 | 0.175 | 0.000 |
| 15 | −0.000 | 0.965 | 0.174 | 0.000 |
Table 8.
Z-statistic test results of the low-CSR group’s AAR and CAAR of the CSR score grouping two years before the M&A.
Table 8.
Z-statistic test results of the low-CSR group’s AAR and CAAR of the CSR score grouping two years before the M&A.
| t (days) | AAR | CAAR | ||
|---|---|---|---|---|
| Value | p-Value | Value | p-Value | |
| −5 | −0.001 | 0.631 | −0.001 | 0.631 |
| −4 | 0.000 | 0.892 | −0.001 | 0.828 |
| −3 | 0.004 | 0.117 | 0.003 | 0.519 |
| −2 | 0.006 | 0.066 | 0.010 | 0.154 |
| −1 | 0.009 | 0.011 | 0.019 | 0.021 |
| 0 | 0.063 | 0.000 | 0.082 | 0.000 |
| 1 | 0.053 | 0.000 | 0.136 | 0.000 |
| 2 | 0.039 | 0.000 | 0.175 | 0.000 |
| 3 | 0.032 | 0.000 | 0.207 | 0.000 |
| 4 | 0.016 | 0.019 | 0.223 | 0.000 |
| 5 | 0.023 | 0.000 | 0.246 | 0.000 |
| 6 | 0.015 | 0.015 | 0.261 | 0.000 |
| 7 | 0.004 | 0.531 | 0.265 | 0.000 |
| 8 | 0.014 | 0.011 | 0.279 | 0.000 |
| 9 | 0.011 | 0.024 | 0.290 | 0.000 |
| 10 | 0.005 | 0.260 | 0.295 | 0.000 |
| 11 | 0.010 | 0.071 | 0.305 | 0.000 |
| 12 | −0.007 | 0.098 | 0.298 | 0.000 |
| 13 | −0.004 | 0.167 | 0.294 | 0.000 |
| 14 | −0.002 | 0.545 | 0.292 | 0.000 |
| 15 | 0.004 | 0.383 | 0.295 | 0.000 |
Table 9.
Z-statistic test results of the medium CSR group’s AAR and CAAR of the CSR score grouping two years before the M&A.
Table 9.
Z-statistic test results of the medium CSR group’s AAR and CAAR of the CSR score grouping two years before the M&A.
| t (days) | AAR | CAAR | ||
|---|---|---|---|---|
| Value | p-Value | Value | p-Value | |
| −5 | −0.001 | 0.639 | −0.001 | 0.639 |
| −4 | 0.001 | 0.709 | −0.000 | 0.914 |
| −3 | 0.005 | 0.089 | 0.004 | 0.418 |
| −2 | −0.002 | 0.499 | 0.002 | 0.652 |
| −1 | 0.003 | 0.341 | 0.006 | 0.365 |
| 0 | 0.058 | 0.000 | 0.064 | 0.000 |
| 1 | 0.044 | 0.000 | 0.108 | 0.000 |
| 2 | 0.039 | 0.000 | 0.147 | 0.000 |
| 3 | 0.022 | 0.000 | 0.169 | 0.000 |
| 4 | 0.009 | 0.089 | 0.178 | 0.000 |
| 5 | 0.007 | 0.135 | 0.185 | 0.000 |
| 6 | 0.007 | 0.123 | 0.193 | 0.000 |
| 7 | 0.006 | 0.133 | 0.199 | 0.000 |
| 8 | −0.004 | 0.421 | 0.195 | 0.000 |
| 9 | −0.004 | 0.255 | 0.191 | 0.000 |
| 10 | 0.000 | 0.949 | 0.191 | 0.000 |
| 11 | 0.003 | 0.331 | 0.194 | 0.000 |
| 12 | 0.001 | 0.754 | 0.195 | 0.000 |
| 13 | −0.005 | 0.260 | 0.191 | 0.000 |
| 14 | 0.001 | 0.703 | 0.192 | 0.000 |
| 15 | 0.001 | 0.687 | 0.193 | 0.000 |
Table 10.
Z-statistic test results of the high-CSR group’s AAR and CAAR of the CSR score grouping two years before the M&A.
Table 10.
Z-statistic test results of the high-CSR group’s AAR and CAAR of the CSR score grouping two years before the M&A.
| t (days) | AAR | CAAR | ||
|---|---|---|---|---|
| Value | p-Value | Value | p-Value | |
| −5 | 0.001 | 0.740 | 0.001 | 0.740 |
| −4 | 0.001 | 0.671 | 0.002 | 0.563 |
| −3 | 0.002 | 0.535 | 0.005 | 0.413 |
| −2 | 0.005 | 0.223 | 0.010 | 0.179 |
| −1 | 0.007 | 0.094 | 0.017 | 0.053 |
| 0 | 0.056 | 0.000 | 0.073 | 0.000 |
| 1 | 0.040 | 0.000 | 0.113 | 0.000 |
| 2 | 0.035 | 0.000 | 0.148 | 0.000 |
| 3 | 0.022 | 0.005 | 0.170 | 0.000 |
| 4 | 0.009 | 0.192 | 0.179 | 0.000 |
| 5 | 0.008 | 0.185 | 0.187 | 0.000 |
| 6 | 0.003 | 0.579 | 0.190 | 0.000 |
| 7 | 0.004 | 0.443 | 0.194 | 0.000 |
| 8 | −0.006 | 0.208 | 0.188 | 0.000 |
| 9 | −0.000 | 0.957 | 0.188 | 0.000 |
| 10 | 0.010 | 0.055 | 0.198 | 0.000 |
| 11 | 0.001 | 0.744 | 0.199 | 0.000 |
| 12 | −0.007 | 0.124 | 0.192 | 0.000 |
| 13 | −0.007 | 0.043 | 0.185 | 0.000 |
| 14 | 0.002 | 0.663 | 0.187 | 0.000 |
| 15 | −0.004 | 0.382 | 0.183 | 0.000 |
Table 11.
Impact of the acquirer’s CSR on CAR. CSR represents the company’s CSR score in the previous year; LNTA: the natural logarithm of total assets; Current Ratio: the current assets divided by current liabilities; Quick Ratio: current assets minus inventories divided by current liabilities; Cash Ratio: cash divided by current liabilities; Liability Ratio: total liabilities divided by total assets; Friendly: a dummy variable of whether the merger is a malicious acquisition and equals 1 for a friendly acquisition and 0 for a malicious acquisition; Vertical: a dummy variable of a vertical acquisition, equal to 1 for a vertical acquisition, and 0 equal to a horizontal acquisition. t-values based on standard errors adjusted for firm clustering are reported in parentheses. *, ** and *** denote significance at the 10%, 5%, and 1% levels, respectively.
| Variables | (1) | (2) | (3) | (4) | (5) | (6) |
| CAR [−5, 5] | CAR [−3, 3] | CAR [−2, 2] | CAR [−1, 1] | CAR [−3, 1] | CAR [−2, 1] | |
| CSR | −0.000 ** | −0.000 ** | −0.000 ** | −0.000 ** | −0.000 ** | −0.000 ** |
| (−2.36) | (−2.10) | (−2.36) | (−2.22) | (−2.28) | (−2.28) | |
| LNTA | −0.008 * | −0.006 * | −0.004 | −0.004 ** | −0.002 * | −0.002 * |
| (−1.79) | (−1.89) | (−1.38) | (−2.03) | (−1.76) | (−1.76) | |
| Current Ratio | −0.002 | −0.002 | −0.001 | 0.002 | −0.001 | −0.001 |
| (−0.31) | (−0.32) | (−0.26) | (0.39) | (−0.29) | (−0.29) | |
| Quick Ratio | −0.002 | −0.001 | −0.001 | −0.003 | 0.001 | 0.001 |
| (−0.28) | (−0.12) | (−0.10) | (−0.64) | (0.24) | (0.24) | |
| Cash Ratio | 0.008 ** | 0.005 * | 0.003 | 0.001 | −0.000 | −0.000 |
| (2.28) | (1.69) | (1.50) | (0.82) | (−0.10) | (−0.10) | |
| Liability Ratio | −0.013 | −0.014 | −0.017 | −0.007 | −0.001 | −0.001 |
| (−0.51) | (−0.74) | (−1.12) | (−0.59) | (−0.21) | (−0.21) | |
| Friendly | 0.046 *** | 0.042 *** | 0.033 *** | 0.027 *** | 0.016 *** | 0.016 *** |
| (3.04) | (3.90) | (3.75) | (3.59) | (3.31) | (3.31) | |
| Vertical | 0.026 *** | 0.021 *** | 0.016 *** | 0.008 ** | 0.003 | 0.003 |
| (3.81) | (3.71) | (3.53) | (2.35) | (1.31) | (1.31) | |
| Constant | −0.027 | −0.021 | −0.014 | −0.009 | −0.004 | −0.004 |
| (−1.35) | (−1.39) | (−1.08) | (−0.86) | (−0.62) | (−0.62) | |
| Year Dummies | Yes | Yes | Yes | Yes | Yes | Yes |
| Obs. | 2737 | 2737 | 2737 | 2737 | 2737 | 2737 |
| Adjusted R2 | 0.0756 | 0.0830 | 0.0850 | 0.0904 | 0.0862 | 0.0862 |
© 2019 by the authors. Licensee MDPI, Basel, Switzerland. This article is an open access article distributed under the terms and conditions of the Creative Commons Attribution (CC BY) license (http://creativecommons.org/licenses/by/4.0/).
Share and Cite
MDPI and ACS Style
Zhang, F.; Li, M.; Zhang, M. Chinese Financial Market Investors Attitudes toward Corporate Social Responsibility: Evidence from Mergers and Acquisitions. Sustainability 2019, 11, 2615. https://doi.org/10.3390/su11092615
AMA Style
Zhang F, Li M, Zhang M. Chinese Financial Market Investors Attitudes toward Corporate Social Responsibility: Evidence from Mergers and Acquisitions. Sustainability. 2019; 11(9):2615. https://doi.org/10.3390/su11092615
Chicago/Turabian StyleZhang, Fang, Minghui Li, and Meilan Zhang. 2019. "Chinese Financial Market Investors Attitudes toward Corporate Social Responsibility: Evidence from Mergers and Acquisitions" Sustainability 11, no. 9: 2615. https://doi.org/10.3390/su11092615
Note that from the first issue of 2016, this journal uses article numbers instead of page numbers. See further details here.