Article

Does Climate Change or Human Activity Lead to the Degradation in the Grassland Ecosystem in a Mountain-Basin System in an Arid Region of China?

1
State Key Laboratory of Desert and Oasis Ecology, Xinjiang Institute of Ecology and Geography, Chinese Academy of Sciences (CAS), Urumqi 830011, China
2
University of Chinese Academy of Sciences, Beijing 100049, China
3
College of Resources and Environment Science, Xinjiang University, Urumqi 830046, China
4
State Key Laboratory of Simulation and Regulation of Water Cycle in River Basin, Department of Water Resources, China Institute of Water Resources and Hydropower Research, Beijing 100038, China
5
College of Geomatics, Shandong University of Science and Technology, Qingdao 266590, China
*
Authors to whom correspondence should be addressed.
These authors contributed equally to this study and share first authorship.
Sustainability 2019, 11(9), 2618; https://doi.org/10.3390/su11092618
Submission received: 4 April 2019 / Revised: 23 April 2019 / Accepted: 25 April 2019 / Published: 7 May 2019

Abstract

:
In mountain-basin systems in the arid region, grasslands are sensitive to the impacts of climate change and human activities. In this study, we aimed to resolve two key scientific issues: (1) distinguish and explain the laws of grassland ecosystem deterioration in a mountain-basin system and identify the key factors related; and (2) evaluate whether damaged grasslands ecosystem have the potential for natural revegetation. Hence, by combining spatial analysis with statistical methods, we studied the trends of the deterioration of the grassland ecosystem and its spatial characteristics in Kulusitai, a mountain-basin system in the arid region of Northwest China. According to our results, vegetation coverage and productivity exhibited significant decreasing trends, while the temperature vegetation drought index (TVDI) exhibited a significant increasing trend. Drainage of groundwater, because of increase in irrigation for the expanded irrigated area around Kulusitai, and climate warming were the critical triggers that leaded to the soil drought. Soil drought and overgrazing, resulting from the impact of human activities, were the main factors responsible for the deterioration of the grassland ecosystems. However, limiting the number of livestock to a reasonable scale and reducing the irrigated area may help to increase the soil moisture, thus promoting the germination of soil seed banks and facilitating the normal growth of grassland vegetation. Furthermore, based on analysis of the phenology of the grassland vegetation, the reasonable period for harvesting and storage is from July 29 to August 5. The results of this study provide a scientific basis and practical guide for restoring mountain-basin grassland systems in arid regions.

1. Introduction

As one of the most widely distributed vegetation types on the Earth [1], grasslands play a significant role in wind-breaking and sand-fixing, water conservation, maintaining biodiversity, and forage production [2,3]. However, considerable research revealed that nearly half of the world’s grasslands have degraded to varying degrees [4,5], making it one of main threats to ecological security. Grassland degradation in arid and semi-arid regions is even becoming worse [6]. In arid regions of Central Asia, grassland vegetation is usually distributed in the mountain-basin system, a kind of landform composed of an alternating distribution of mountains and basins [7,8]. Restoring the degraded grassland ecosystem in the mountain-basin system is usually the general focus of ecological conservations in the arid region [9].
Grassland ecosystems are highly sensitive to climate change and disturbance of human activities [10,11,12]. Understanding various issues related to grassland deterioration is crucial for its restoration [12,13,14]. Climate change, such as global warming and altered precipitation patterns, and human activities, such as reclamation of grassland and overgrazing, are generally accepted to be the underlying drivers associated with grassland degradation [5,15,16,17,18,19]. In mountain-basin systems of the arid regions, water is the primary restricting factor for vegetation dynamics [20,21], less precipitation and climate warming can readily cause soil droughts, thereby resulting in deterioration of the grassland vegetation system due to water deficit [11]. What’s more, increasing human-induced disturbances may convey a large proportion of water resources from mountainous area to oases for economic and social development; the ecological water supply may decrease rapidly, thus exacerbates the ecological imbalance [22,23]. Therefore, it is necessary to find solutions that might address the problems caused by climate change and human activities in order to provide scientific guidance to facilitate the recovery of fragile ecosystems.
Various methods such as enclosure, moderate grazing, and sowing grass seeds have been used to recover grassland ecosystems in arid regions [24,25,26]. However, the natural resilience of ecosystems should be estimated before applying recovery measures. The natural soil seed bank plays important role for the regeneration and maintaining the integrity of the plant community [27,28,29]. In regions with grassland degradation, effective activation of the soil seed bank can help to recover the vegetation naturally and reduce the cost of ecological restoration.
Many studies [30,31,32] have applied either remote sensing or mathematical statistics to obtain information about the area, coverage, and productivity of the grassland in the hopes of revealing the laws of grassland degradation in arid regions. Against the background of global warming, phenology of vegetation in many parts of the word has altered [33,34]. As the grazing should be adapted to grassland phenology, mismatch between the grazing and changes of grassland phenology could be one of the key factors for grassland degradation [35,36]. Yet, seldom were the changes of phenology considered in the restoring of the degraded grassland ecosystem.
The Kulusitai grassland is located at the northwest border of China, where it not only constitutes a natural barrier in maintaining ecological security, but also provides an important production base for animal husbandry [37]. Due to the influence of climate change, expansion of cultivated land, overgrazing, and other possible factors, the area of grassland is shrinking, and the productivity and livestock capacity of the natural grassland has declined rapidly [38]. Some parts of the grassland have become sand or desert already.
Therefore, in this study, we selected the Kulusitai grassland as a representative of the mountain-basin system in the arid region of Central Asia. And based on data obtained from remote sensing, meteorology, field investigation and socioeconomic analyses, the degradation process of the grassland was investigated by combining methods of spatial analysis and statistical analysis. We aim to determine the potential for natural revegetation during the recovery of the grassland and propose specific measures that might facilitate ecological restoration for the damaged grassland ecosystem.

2. Materials and Methods

2.1. Study Area Description

The Kulusitai grassland (46°09′–46°44′ N, 82°31′–83°45′ E) is located in the hinterland of Tacheng basin at the altitude of 400–600 m, and the total area of the basin is 19.60 × 10⁴ ha (Figure 1). The south, north, and east of this region are surrounded by mountains. Water from melting glaciers and rainfall from mountain regions usually converge at the center of Tacheng basin via runoff, thus providing abundant water resources for vegetation growth. The Kulusitai grassland has a temperate continental arid climate. The average annual air temperature is about 6.5 °C, and the maximum air temperature is about 41 °C in the summer, the minimum is about −45 °C during the winter [38]. Precipitation occurs mainly in the spring and autumn. The average annual precipitation is 260–280 mm and the average annual evaporation is 1608 mm [38].
The Kulusitai grassland mainly has zonal temperate desert soil. The grassland comprises three types: temperate meadow grassland, temperate desert steppe, and temperate desert, which take up about 78.5%, 12.8%, and 8.7% of the whole area, respectively. The main types of vegetation are as follows: Hordeum bogdanii, Phleum pretense, Festuca ovina, Elymus nutens, Calamagrostis spp. Achnatherum splendens, Kochia prostrate, Ceratoides latens, and Seriphidium kaschgaricum. Abundant wild animals inhabit the grassland, including nine that are protected at the first national level as key animals in China, e.g., Otis tarda, Tetrax tetrax, and Ciconia nigra.

2.2. Data Sources

The remote sensing data used in this study comprised of time series images of Normalized Difference Vegetation Index (NDVI) from MODIS MOD113Q1 data sets, which were released by the NASA EOS data center (https://ladsweb.modaps.eosdis.nasa.gov). The temporal resolutions for the NDVI images were 16 days, and the spatial resolutions were 250 m × 250 m. The MVC (Maximum Value Composite) method [39] was applied to the NDVI time series images to obtain yearly NDVI images.
Socio-economic statistical data from 1985 to 2015 as well as annual temperature, precipitation, and evaporation data from 1957 to 2015 were acquired from the local bureau of statistics of Tacheng region. Forty-eight monitoring sites provided measurement data regarding the productivity of vegetation. Soil seed bank data were obtained from 20 sampling sites in degraded grassland vegetation areas. The groundwater levels data came from six monitoring wells between 2009 and 2015.

2.3. Methods

Based on the remote sensing images, the changes in the area of different vegetation coverage grades in Kulusitai were analyzed. Methods such as combining the normalized difference vegetation index (NDVI) with grassland biomass measurements to establish a biomass model, spatial analysis, and the Mann-Kendall trend test were used to determine the changing characteristics in grassland coverage, productivity, and phenology in the research area. Using the correlation coefficient, we analyzed the relationship between the TVD and vegetation productivity. The ecological resilience of the grassland was assessed based on experimental tests of the soil seed bank.

2.3.1. Vegetation Coverage Calculation

The NDVI can reflect various types of vegetation coverage information, such as the vegetation chlorophyll content, leaf area, leaf biomass, and net primary productivity [40,41]. The theoretical range of the NDVI is about −1.0 to 1.0. In growing seasons, the NDVI value exceeding 0.1 indicates the presence of vegetation, and a larger value denotes higher vegetation coverage. A value below 0.1 indicates that the ground surface lacks vegetation cover. The amount of vegetation coverage and NDVI have a significant linear correlation. When using remote sensing data to monitor vegetation coverage, the correlation between vegetation coverage and NDVI is employed to assess the regional vegetation coverage, as follows:
V c = NDVI NDVI S NDVI V NDVI S
where VC is the vegetation coverage, NDVIS is the smallest value of NDVI on bare land in the study area, and NDVIV is the higher value of NDVI or a pure vegetation pixel. MODIS was used as the data source to obtain the NDVI values.

2.3.2. Vegetation Productivity Calculation

In the study area, we set up 48 grassland sample plots. From July to August in 2016, all of the sample plots were orientated in the same direction and samples were taken. The area of each sample plot was about 50 × 50 m and 10 quadrats measuring about 1 × 1 m were set randomly in every sample plot. The aboveground biomass of herbs was then clipped and measured. The fresh weight was determined to the nearest 0.5 g. Based on the NDVI data for vegetation, the relationship between the NDVI of herbs and the biomass was fitted, and the fitted biomass model was used to assess the regional productivity:
y = 6074.4 x 1.17 ,   R 2 = 0.81 ,   P < 0.001
where y is the fresh weight of vegetation per unit area (kg/ha) and x is the NDVI.

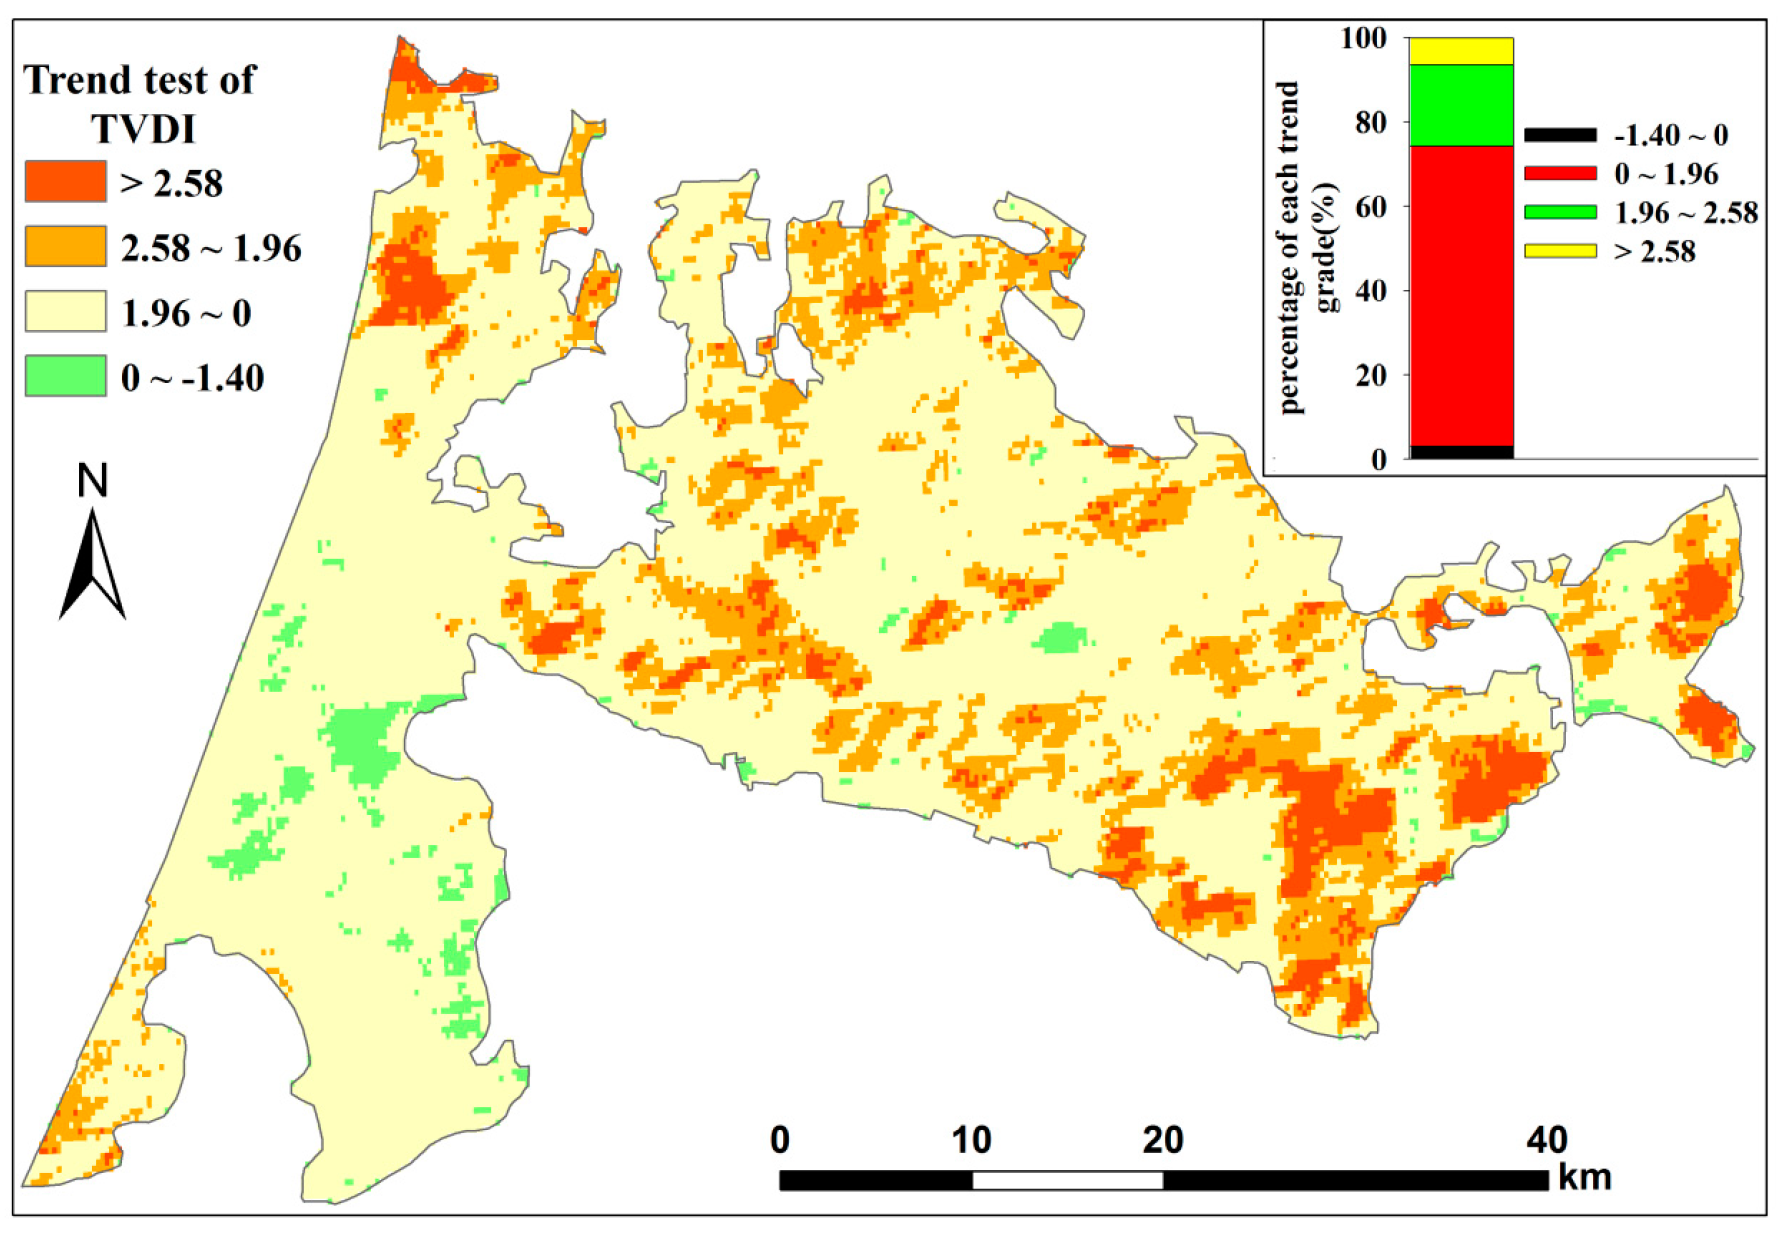
2.3.3. Temperature Vegetation Drought Index (TVDI) Calculation

The formula for calculating the TVDI is as follows [42,43]:
TVDI = ( T S T Smin ) / ( T Smax T Smin )
The TVDI value ranges from 0–1. If the TVDI value is 0, the soil moisture is near the field moisture capacity, whereas the soil moisture is near the wilting point if the value of TDVI is 1. TS is the surface temperature of an arbitrary pixel. TSmin is the lowest temperature of any NDVI relative to NDVI-TS. TSmax is the highest temperature of a specific NDVI relative to the NDVI-TS dry edge. NDVI was obtained using MODIS data. The fitting formula is as follows:
T Smin = a 1 + b 1 NDVI
T Smax = a 2 + b 2 NDVI
where a 1 and b 1 are coefficients of the fitting equation for the wet edge; a 2 and b 2 are coefficients of the fitting equation for the dry edge.

2.3.4. Phenology Index Calculation

In order to reflect the characteristic variations in phenology under natural conditions, we selected a study area with less human influence. We used the TIMESAT package to extract phenology information of the length of the growth season (LOG) from 2000 to 2015, as well as the date of the peak value in biomass of growth season (DOP). The TIMESAT package was developed by Jönsson and Eklundh [44] for reconstructing vegetation index time series and this package can extract the vegetation growth parameters. Based on the IDL8.5 program development platform, we calculated the mean values of LOG and DOP for grassland vegetation in Kulusitai.

2.3.5. Difference Calculation

In order to weaken the effects of random fluctuations in vegetation growth of a single year on the analyzing of the changes in vegetation coverage and productivity, we took 3 years as a period and selected the periods of 2000–2002, 2006–2008 and 2013–2015 from the whole time interval of 2000–2015. The vegetation coverage and productivity for each of the tree periods were averaged to represent the vegetation growth in the start, middle, and end of the time series. The changes in vegetation coverage and productivity during 2000–2008 (refers to the difference between 2000–2002 and 2006–2008), 2006–2015 (refers to the difference between 2006–2008 and 2013–2015) and 2000–2015 (refers to the difference between 2000–2002 and 2013–2015) were calculated separately.

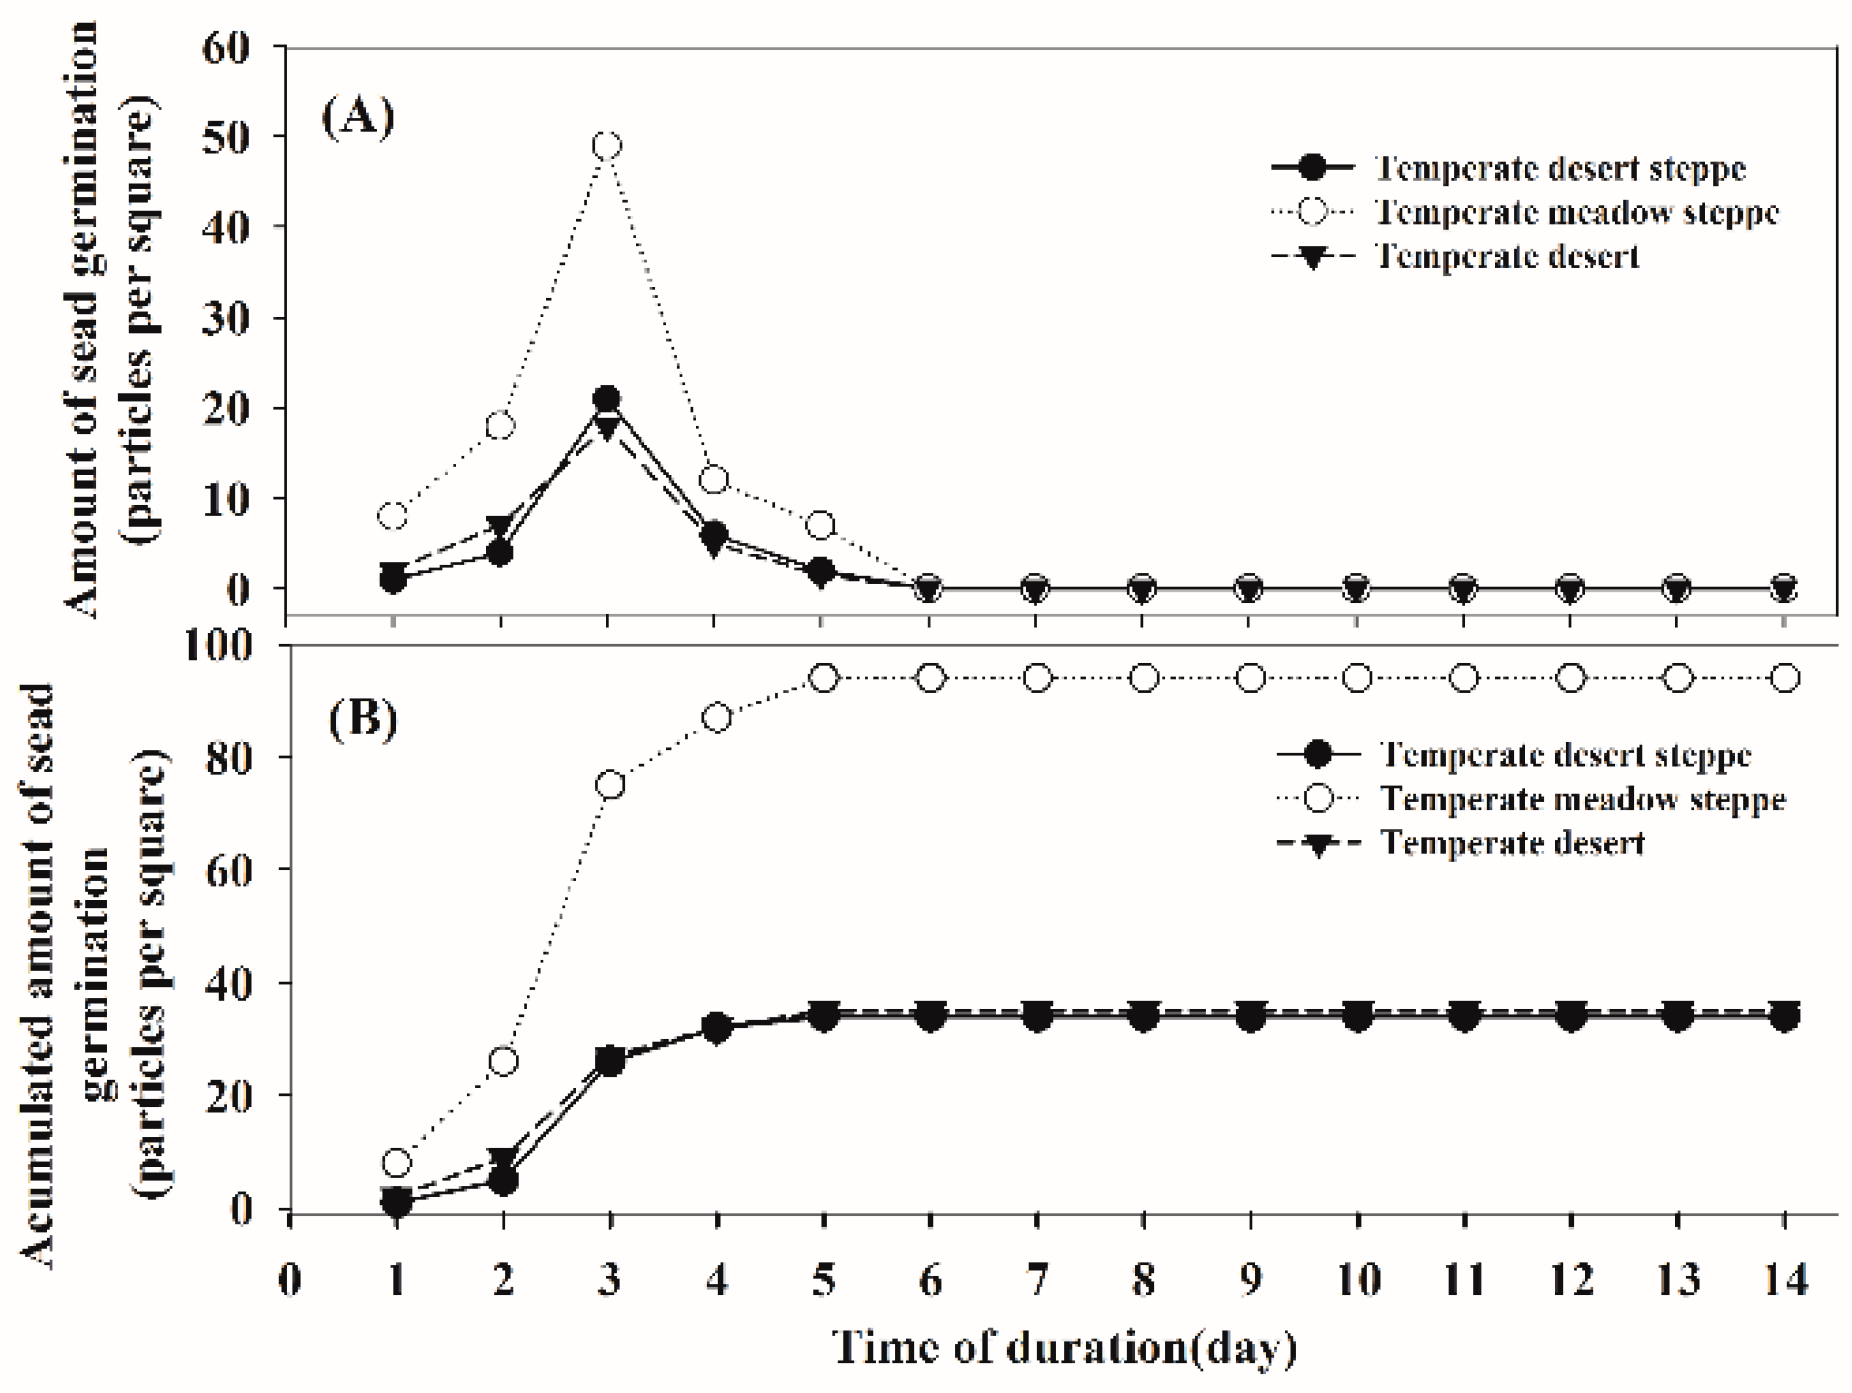
2.3.6. Germination Experiments Using Soil Seed Banks

In order to assess the resilience of grassland vegetation, soil samples were taken from 20 areas with degraded vegetation in 2016 July. The seed burial depth is usually shallow so the sampling depth was 5 cm. The area of each sampling plot was about 10 m × 10 m. Three subplots measuring 20 cm × 20 cm were selected in every sampling plot. The germination experiment was performed in a laboratory. First, soil samples from the same plot were mixed well. Second, the mixed soil was spread evenly in a box (10 cm × 10 cm × 7 cm) for germination. In order to ensure sufficient nutrition for seedlings, gravel was added at a thickness of 3 cm. The mixed and sieved soil was spread in the box at a depth of 2 cm. All of the sample boxes received ample light and the soil moisture was in the range of 25–30% [45]. The soil was mixed five times. If seedlings did not appear within two weeks, the experiment was ended. Finally, the numbers of seedlings were calculated kin each box.

2.3.7. Analysis of Trends

The Mann–Kendall trend test was used to detect increasing or decreasing trends in time sequences [46,47]. When we applied the Mann–Kendall method to analyze trends in the NDVI, we used the NDVI values for a specific time sequence as a group of independently distributed samples in order to analyze the feasibility of calculating the NDVI reduction index based on Zc, as follows:
Z c = { S 1 Var ( S ) s > 0 0 s = 0 S + 1 Var ( S ) s < 0 ,
S = i = 1 n 1 k = i + 1 n sign ( NDVI k NDVI i ) ,
Var ( s ) = n ( n 1 ) ( 2 n + 5 ) 18
sign ( NDVI k NDVI i ) = { 1 NDVI k NDVI i > 0 0 NDVI k NDVI i = 0 1 NDVI k NDVI i < 0 ,
where NDVIk and NDVIi are sets of time series data (n denotes the length of the data set and the sign denotes the signal function). The sequence length increases when Zc is positive and vice versa. If |Zc| is greater than 1.96 (Z0.05 = 1.96), the changing trend in the sequence is significant at the 0.05 level, and if |Zc| > 2.58 (Z0.01 = 2.58), the changing trend is highly significant at the 0.01 level.

3. Results

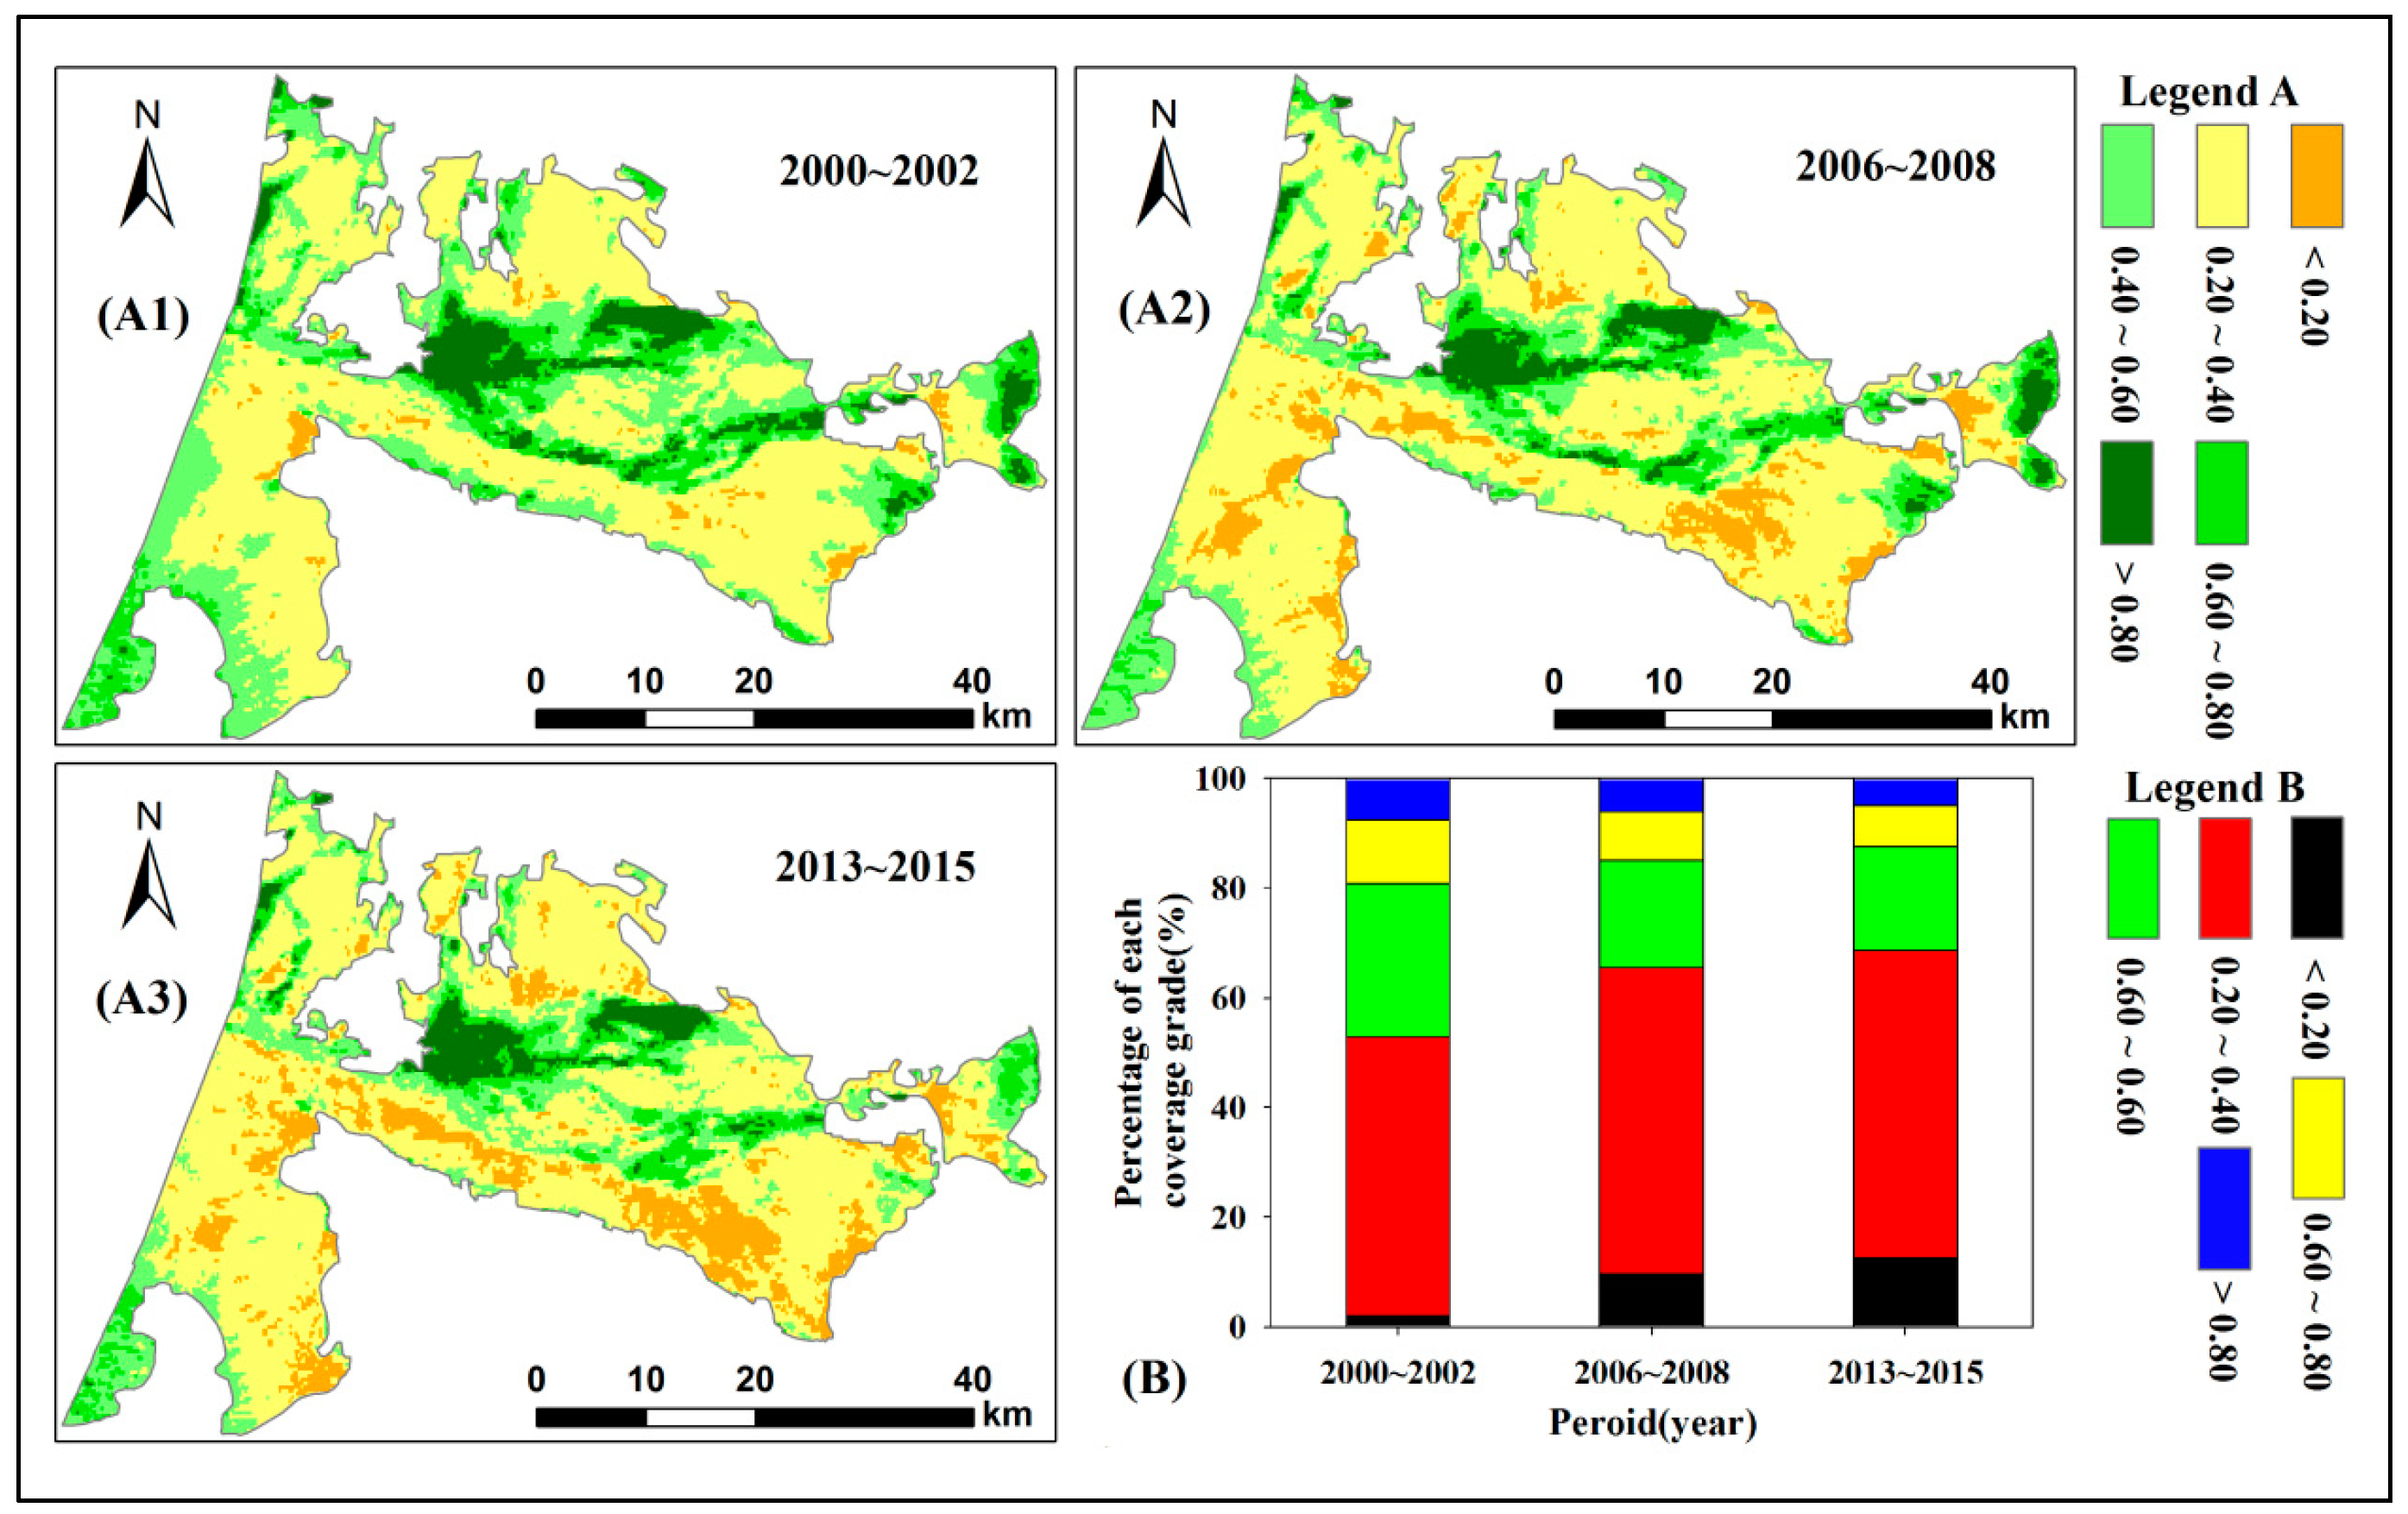
3.1. Area Changes of Different Coverage Grades in Kulusitai Grassland

As shown in Figure 2, the area percent of grassland with coverage <0.20 and 0.20–0.40 increased by 10.66% and 5.00% in 2000–2015, respectively; while that of 0.40–0.60, 0.60–0.80, and >0.80 decreased by 8.78%, 4.13%, and 2.75%, respectively. During 2006–2015, the change in the percent of the 0.20–0.40 coverage grade was the smallest and it increased by only 0.09%, and the 0.40–0.60 coverage grade decreased by only 0.55%. The percent of grassland with coverage <0.20 increased by 3.07%. The percent of the 0.60–0.80 and >0.80 coverage grades decreased by 1.40% and 1.21%, respectively. These results show that high coverage grassland (coverage > 0.40) changed into low coverage grassland (coverage < 0.40) and that the grassland tended to degrade.
According to Table 1, there were 0.26 × 10⁴ ha and 0.40 × 10⁴ ha grassland with coverage >0.80 transferred into coverage of 0.40–0.60 and 0.60–0.80, accounting for 17.22% and 26.49% of the grassland with coverage >0.80, respectively, while the total area transferred into coverage >0.80 was only 0.16 × 10⁴ ha. There was also 1.16 × 10⁴ ha grassland with coverage of 0.60–0.80 transferred into coverage of 0.40–0.60, accounting for 51.56% of its total area in 2000–2002, and the total area transferred into coverage of 0.60–0.80 was only 0.74 × 10⁴ ha. The increases in the areas of grassland with coverage <0.20 and 0.20–0.40 were mainly from coverage of 0.20–0.40 and 0.40–0.60, and the areas were 2.13 × 10⁴ ha and 3.05 × 10⁴ ha, accounting for 85.89% and 27.78% of the total area with coverage <0.20 and 0.20–0.40 in 2013–2015.Thus, according to the transition among the different coverage grades, the grassland in Kulusitai tended to degrade during 2000 to 2015.

3.2. Changes in Vegetation Coverage in the Kulusitai Grassland

As shown in Figure 3, the changes in vegetation coverage were divided into five grades: >0.10, 0–0.10, −0.10–0, −0.20–−0.10, and <−0.20 (the range is positive for increases and negative for reductions). According to Figure 3A,B, the reductions in the area of grassland vegetation accounted for 87.19% of the total area in 2000–2008, among which the coverage variation <−0.10 accounted for 19.87%. In 2006–2015, the negative values for the coverage variation accounted for 59.98%. In 2000–2015, the decrease in the area of coverage in Kulusitai accounted for 91.09% of the total area. The area with change <−0.10 comprised 31.65% of the total area, which was distributed in the southwest and southeast of the grassland region. However, there was only 8.91% increasing trend in vegetation coverage in the middle of the desert steppe.
Based on the yearly time series data of vegetation coverage in 2000–2015 and the Mann-Kendall trend test, the map of the test statistic of Zc was generated. The test statistics were divided into six classes (Zc < −2.58: decreasing significantly and extremely; −2.58 < Zc < −1.96: significant decrease; −1.96 < Zc < 0: non-significant decrease; 0 < Zc < 1.96: non-significant increase; 1.96 < Zc < 2.58: increasing significantly; 2.58 < Zc: increasing significantly and extremely) to discriminate the spatial variation characteristics in grassland vegetation coverage (Figure 4).
As shown in Figure 4, the proportion of grassland vegetation coverage (−1.96 < Zc < 0) that decreased non-significantly was 66.02% of the total area. The grassland vegetation coverage that decreased significantly (−2.58 < Zc < −1.96) comprised 15.46%. The proportion of vegetation coverage that increased non-significantly accounted for 9.40% of the total area, which was distributed mainly in the middle part of the steppe. In general, the test statistic (Zc) for the spatial average vegetation coverage was −2.02, which indicated a significant decreasing trend.

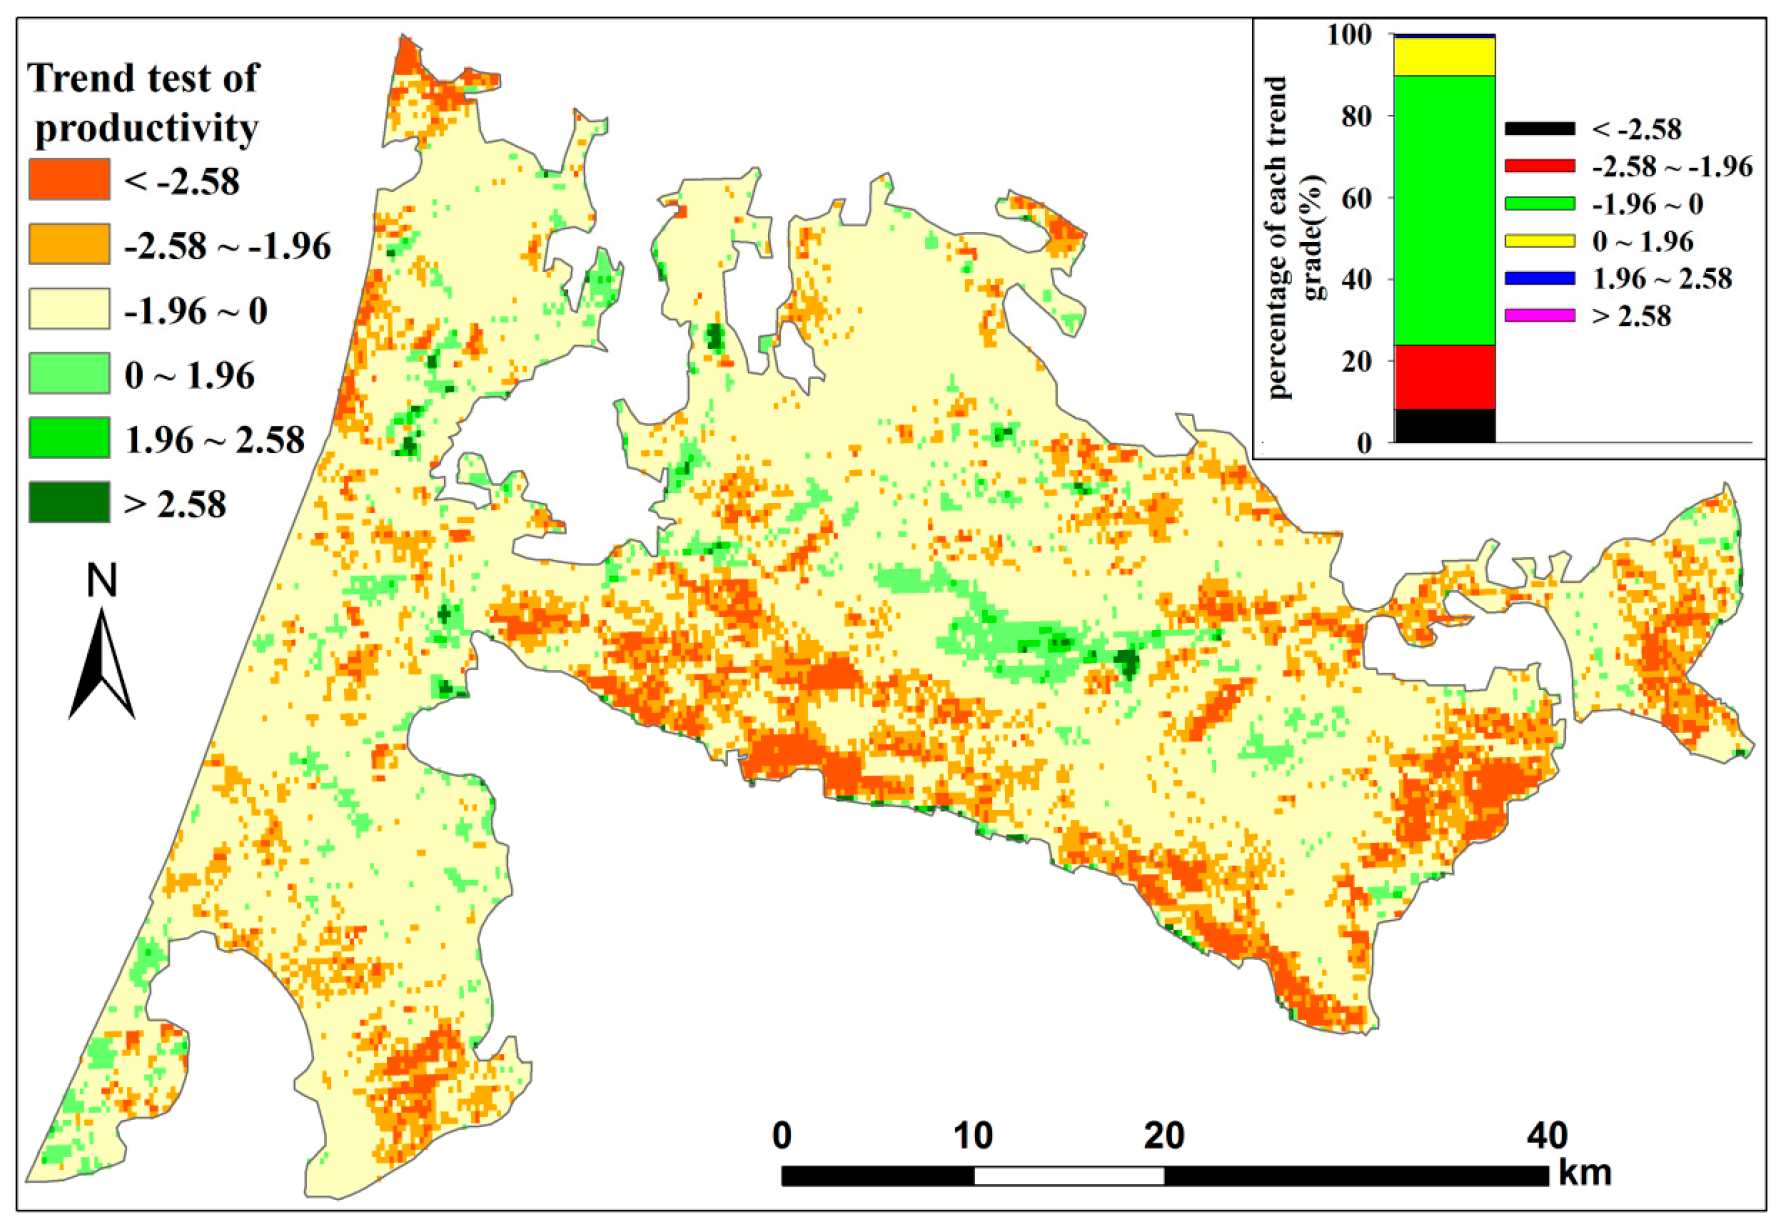
3.3. Productivity Changes in the Kulusitai Grassland

In Figure 5, the variations in vegetation productivity of the grasslands were divided into five grades: >500 kg/ha, 0–500 kg/ha, −500–0 kg/ha, −500–−1000 kg/ha, and <−1000 kg/ha. According to Figure 5A,B, the areas with decreased productivity comprised 87.44% and 69.45% of the overall area in 2000–2008 and 2006–2015, respectively. The vegetation productivity range between −500 to 0 kg/ha was most common, and the proportions were 71.02% and 61.59% in 2000–2008 and 2006–2015, respectively. Between 2000 and 2015, the proportion of grassland areas with decreasing vegetation productivity was 82.77%, and the proportion of vegetation productivity <−500 kg/ha was 24.77%, which was distributed mainly in wetland and high coverage grassland (Figure 1 and Figure 5(A3)). In addition, moderate growth in vegetation productivity was observed in the middle regions of the grassland.
According to the trend test of vegetation productivity in the Kulusitai grassland from 2000 to 2015 (Figure 6), 89.70% of the area had decreases in productivity and 23.81% of the area had a significant decreasing trend (Zc < −1.96). The grassland vegetation productivity increased non-significantly in 9.38% of the overall area (0 < Zc < 1.96). The test statistic (Zc) for the spatially averaged vegetation productivity was −2.09, which shows that there was a significant decreasing trend at 0.05 level.

3.4. Changes in Phenology in the Kulusitai Grassland

In Table 2, LOG is the length of growing season, representing the period of grassland vegetation growth from green-up to litter. DOP is the date in a year for a plant to reach its peak in biomass. The test statistic for LOG was 0.68, which indicates that the increase in LOG was not significant at the 0.05 level. During 2000–2015, the average LOG was 205.6 days. The minimum value of LOG, maximum value, and range were 180, 227.8, and 47.8 days, respectively, thus the difference was large. In 2011–2015, the mean LOG was 1.5 days more compared with the mean value in 2000–2015, and the range decreased by five days. The variation coefficients for DOP in 2000–2015 and 2011–2015 were 2.8 and 1.2, respectively, which were less than the percentage of 56.8 and 84.0 for LOG, and their ranges were 19.5 and 6.8 days, with good stability. The test statistic for DOP was 2.75 (Zc > Z0.05 = 1.96), meaning that DOP exhibited a significantly increasing trend. For the overall period, the mean DOP was the 207.5th day of a year (July 27), where the minimum and maximum values occurred on July 17 (the 197.2th day) and August 5 (the 216.7th day). In the last five years, the minimum and maximum DOP occurred on July 27 (the 209.9th day) and August 5 (the 216.7th day), respectively. Therefore, the reasonable time for grass cutting and storage is after July 27 and the optimum period is from July 29 to August 5.

4. Discussion

4.1. Reasons for Ecological Degradation of the Kulusitai Grassland

4.1.1. Influence of Soil Water on Ecological Degradation

In arid regions, the survival of herbs is largely dependent on soil water content [48]. Soil water is supplied mainly by precipitation, surface runoff, and groundwater in a mountain-basin system. If there is a shallow groundwater table, plant roots can absorb water and utilize it directly. If the groundwater table is deep, the groundwater is obtained by plant transpiration via capillary action. The low rainfall in arid regions means that groundwater is the main source of soil water, which is derived from surface runoff in mountainous regions. To determine the relationship between soil water and grassland vegetation in Kulusitai, we calculated the spatial-temporal characteristics of the drought index of TVDI (Figure 7). According to Figure 7, the proportion of the area where the drought index increased was 96.87% and 71.06% of the increasing was non-significant (0 < Zc < 1.96). The areas with a significant increase (Zc > 1.96) were located on the edges of the northwest and southeast in Kulusitai grassland. Moreover, the proportion of the area where the drought index tended to decrease was 3.13%, which was mainly due to irrigation of grassland and cultivated land. The test statistic for TVDI was 2.21 (Zc > Z0.05), which indicates that TVDI increased distinctly in the Kulusitai grassland and soil aridification exhibited an increasing trend.
Based on Figure 6 and Figure 7, we determined the relationship between the TVDI and vegetation productivity using Pearson’s correlation coefficient. According to Figure 8, there was a significant correlation between the aridity index and vegetation productivity, which indicates that the aridity index was negatively correlated to the vegetation productivity. In Figure 8, the area with a negative correlation comprised 81.43% of the overall area of the Kulusitai grassland and the correlation coefficient in most of this area (56.54%) varied between −0.25 and 0. The area with a positive correlation showed that vegetation productivity increased with the drought index. This is mainly because enclosures have been implemented in the last five years ago as measures to alleviate the impacts of grazing and clipping. Thus, the vegetation productivity increased despite the increase in soil drought.

4.1.2. Influence of Climate Change and Human Activities on Ecological Degradation

Climate change mainly affects the grassland vegetation ecosystem by changing the soil water content in Kulusitai. According to Table 3, in the study period, the precipitation increased at an annual rate of 0.16 mm and the temperature increased significantly by 0.06 °C every year. However, due to the difference between precipitation and temperature, evaporation increased at 4.21 mm per year. Therefore, increased evaporation is a key factor that is responsible for the soil drought situation in the Kulusitai grassland.
Expanding in irrigated areas increases the water consumption due to irrigation and decreases the amount of groundwater. Consequently, expanding in irrigated area is another factor that has affected grassland degradation in Kulusitai. During 1983–2015, the irrigated area around the Kulusitai increased by 18.6 × 10⁴ ha (Figure 9A). Based on the irrigation quota set by the local agricultural bureau, the yearly water consumption is 4347.8 m3 per hectare for the irrigated area, meaning 8.1 × 10⁸ m3 water that should have been supplied to the ecology was taken away by the expansion of irrigated area, yearly. During 2010–2015, the irrigated area increased by 6.6 × 10⁴ ha, thus the new water requirement is 2.9 × 10⁸ m3. Therefore, expansion of the irrigated area is the main cause for soil drought in the grassland region.
In addition, excessive grazing was also a crucial factor responsible for ecological degradation in Kulusitai. During 1983–2015, the amount of livestock increased by 45.6% and reached 44.4 × 10⁴ capita, as shown in Figure 9B. The number is 237.4% more than the theoretical livestock capacity (according to the local animal husbandry bureau, the theoretical livestock capacity is 16.3 × 10⁴ capita in 2014). Therefore, the quantity of livestock needs to be reduced in this region. In addition, the phenology of grassland vegetation is changing due to climate change (Table 2), so the pattern of grassland use should be adjusted according to the changes in phenology to improve grassland productivity and protect plant reproduction and development.

4.2. Potential for Ecological Restoration in the Kulusitai Grassland

Expansions of the irrigated area and climate warming have increased the groundwater depth rapidly (Figure 10) and aggravated the soil drought situation. During 2009–2014, the groundwater depth increased by 3.8–47.2% (Figure 10A). In 2014, the groundwater depth was 5.6–58.6 m (Figure 10B), which makes it difficult for vegetation to take up groundwater. In the future, after determining and enforcing a reasonable livestock capacity and irrigation area, it will be important to decrease the groundwater depth and enhance the soil water content by replenishing ecological water. According to the results of this study, there is a strong relationship between soil drought and the grassland biomass. Based on the study in a similar region, enhancing the soil water content can increase the grassland biomass in an effective irrigation manner [49]. However, it is still unclear whether increasing the soil water content is helpful for improving seed germination and ecological restoration.
In the seed germination experiments, we tested seeds from temperate desert steppe, temperate meadow grassland, and temperate desert vegetation. The number of germinated seeds reached the maximum on the third day (Figure 11A). Within the area of 1 m2, an average of 92 seeds germinated from temperate meadow grassland, where 48 seeds germinated on the third day. The cumulative seed germination rate was 78.8%. About 34 temperate desert steppe seeds and 35 temperate desert vegetation seeds germinated, where 21 and 18 seeds germinated on the third day, respectively, with overall germination rates of 73.5% and 80.0% (Figure 11B). Thus, the presence of appropriate soil moisture content could activate the seed banks effectively in 3–5 days. The results of this experiment indicate that Kulusitai grassland has the potential for ecological restoration. The temperate desert and temperate desert steppe regions had fewer seeds, so building enclosures and enhancing the soil moisture content would be helpful ecological restoration methods.

4.3. Measures for Ecological Restoration in the Kulusitai Grassland

According to this study, the main causes of degradation in the Kulusitai grassland are overgrazing and soil drought. The key factors responsible for soil drought are expansion of the irrigated area and increasing evaporation, where the former is more important. Hence, any measures implemented to facilitate ecological restoration should consider these factors. The first step is determining a reasonable livestock capacity by building enclosures or using rotational grazing systems according to the severity of the degradation, which can ensure the natural restoration of grassland ecosystems. Second, the grazing, clipping, and storage of grass must match with phenological changes to improve grassland productivity. More importantly, irrigated area around the Kulusitai grassland should be contained to a rational scale according to the water resource-carrying capacity to ensure more water can be allocated to the grassland, thereby improving the groundwater depth and contributing to seed germination and growth, and then realizing the gradual restoration of vegetation in the degraded area.

5. Conclusions

In order to understand the main factors responsible for ecological degradation in arid regions in mountain-basin systems, we selected the Kulusitai grassland as a study area to analyze the grassland degradation process as well as its possible causes and the potential for ecological restoration.
Both the vegetation coverage and productivity exhibited decreasing trends in the Kulusitai grassland, indicating a continuous degrading process. And the process was characterized by degradation in high coverage grassland.
Based on analyzing of the changes in phenology, the optimum period for grass clipping and storage is from July 29 to August 5 in Kulusitai grassland. Utilization model of the grassland in a similar mountain-basin system should be adjusted to match the phenology of the grassland vegetation to achieve maximum grass yield as well as guarantee the sustainability of the grassland ecosystem.
Human activities of overgrazing and soil drought caused by drainage of ecological water for irrigation of the expanded farmland were the main factors responsible for the ecological degradation in Kulusitai. Reducing the irrigated area and retaining more water to supply grassland can alleviate the soil drought. By ensuring a reasonable livestock capacity and optimal irrigated area, the enhanced water content in the soil can help to increase the seed germination rate and improve the grassland productivity. Therefore, it is vital to figure out effective measures to stimulate soil seed germination to facilitate ecological restoration in this mountain-basin system.

Author Contributions

Conceptualization and methodology, J.Y. and G.Z.; writing—original draft preparation, J.Y.; supervision and data analysis, H.L. and X.D.; project administration and funding, H.X.; data processing, B.G.

Funding

This work was supported by the National Natural Science Foundation of China (31360101) and the Youth Innovation Promotion Association Project (CAS).

Conflicts of Interest

The authors declare that there is no conflict of interests regarding the publication of this paper.

References

  1. Houghton, R.A. The Worldwide Extent of Land-use Change: In the last few centuries, and particularly in the last several decades, effects of land-use change have become global. BioScience 1994, 44, 305–313. [Google Scholar] [CrossRef]
  2. Chase, J.M.; Leibold, M.A.; Downing, A.L.; Shurin, J.B. The effects of productivity, herbivory, and plant species turnover in grassland food webs. Ecology 2000, 81, 2485–2497. [Google Scholar] [CrossRef]
  3. Gross, K.L.; Mittelbach, G.G.; Reynolds, H.L. Grassland invasibility and diversity: Responses to nutrients, seed input, and disturbance. Ecology 2005, 86, 476–486. [Google Scholar] [CrossRef]
  4. Schönbach, P.; Wan, H.; Gierus, M.; Bai, Y.F.; Müller, K.; Lin, L.J.; Susenbeth, A.; Taube, F. Grassland responses to grazing: Effects of grazing intensity and management system in an Inner Mongolian steppe ecosystem. Plant Soil 2011, 340, 103–115. [Google Scholar] [CrossRef]
  5. Gang, C.C.; Zhou, W.; Chen, Y.Z.; Wang, Z.Q.; Sun, Z.G.; Li, J.L.; Qi, J.G.; Odeh, I. Quantitative assessment of the contributions of climate change and human activities on global grassland degradation. Environ. Earth Sci. 2014, 72, 4273–4282. [Google Scholar] [CrossRef]
  6. Veron, S.R.; Paruelo, J.M.; Oesterheld, M. Assessing desertification. J. Arid Environ. 2006, 66, 751–763. [Google Scholar] [CrossRef]
  7. Zhang, X.S. Ecological restoration and sustainable agricultural paradigm of Mountain-Oasis-Ecotone- Desert system in the north of the Tianshan Mountains. Acta Bot. Sin. 2001, 43, 1294–1299. [Google Scholar]
  8. Zhang, L.; Nan, Z.; Xu, Y.; Li, S. Hydrological impacts of land use change and climate variability in the headwater region of the Heihe river basin, northwest china. PLoS ONE 2016, 11, 0158394. [Google Scholar] [CrossRef]
  9. Bi, X.; Li, B.; Fu, Q.; Fan, Y.; Ma, L.X.; Yang, Z.H.; Nan, B.; Dai, X.H.; Zhang, X.S. Effects of grazing exclusion on the grassland ecosystems of mountain meadows and temperate typical steppe in a mountain-basin system in Central Asia’s arid regions, China. Sci. Total Environ. 2018, 630, 254–263. [Google Scholar] [CrossRef]
  10. Yu, Y.; Liu, J.; Wang, H.; Liu, M. Assess the potential of solar irrigation systems for sustaining pasture lands in arid regions—A case study in northwestern china. Appl. Energy 2011, 88, 3176–3182. [Google Scholar] [CrossRef]
  11. Gao, Q.Z.; Li, Y.; Xu, H.M.; Wan, Y.F.; Jiangcun, W.Z. Adaptation strategies of climate variability impacts on alpine grassland ecosystems in Tibetan plateau. Mitig. Adapt. Strateg. Glob. Chang. 2014, 19, 199–209. [Google Scholar] [CrossRef]
  12. Zhou, W.; Gang, C.C.; Zhou, L.; Chen, Y.Z.; Li, J.L.; Ju, W.M.; Odeh, L. Dynamic of grassland vegetation degradation and its quantitative assessment in the northwest china. Acta Oecol. 2014, 55, 86–96. [Google Scholar] [CrossRef]
  13. Akiyama, T.; Kawamura, K. Grassland degradation in china: Methods of monitoring, management and restoration. Grassl. Sci. 2007, 53, 1–17. [Google Scholar] [CrossRef]
  14. Kamp, J.; Koshkin, M.A.; Bragina, T.M.; Katzner, T.E.; Milner-Gulland, E.J.; Schreiber, D.; Sheldon, R.; Shmalenko, A.; Smelansky, L.; Terraube, J.; et al. Persistent and novel threats to the biodiversity of Kazakhstan’s steppes and semi-deserts. Biodivers. Conserv. 2016, 25, 2521–2541. [Google Scholar] [CrossRef]
  15. Cingolani, A.M.; Renison, D.; Tecco, P.A.; Gurvich, D.E.; Cabido, M. Predicting cover types in a mountain range with long evolutionary grazing history: A GIS approach. J. Biogeogr. 2008, 35, 538–551. [Google Scholar] [CrossRef]
  16. Salhab, J.; Wang, J.L.; Anjum, S.A.; Chen, Y.X.; Com, M. Assessment of the grassland degradation in the southeastern part of the source region of the Yellow river from 1994 to 2001. J. Food. Agric. Environ. 2010, 8, 1367–1372. [Google Scholar]
  17. Gundel, P.E.; Irisarri, J.G.N.; Sorzoli, N.S.; Mosso, C.E.; García-Martínez, G.; Golluscio, R. Germination requirements of two sheep-preferred grasses (Hordeum comosum and Koeleria vurilochensis var. patagonica) from semiarid Patagonian steppes. J. Arid Environ. 2012, 78, 183–186. [Google Scholar] [CrossRef]
  18. Tian, F.; Schlütz, F.; Herzschuh, U.; Mischke, S. What drives the recent intensified vegetation degradation in Mongolia—Climate change or human activity? Holocene 2014, 24, 1206–1215. [Google Scholar] [CrossRef]
  19. Komac, B.; Pladevall, C.; Domènech, M.; Fanlo, R. Functional diversity and grazing intensity in sub-alpine and alpine grasslands in Andorra. Appl. Veg. Sci. 2015, 18, 75–85. [Google Scholar] [CrossRef]
  20. Ndehedehe, C.E.; Ferreira, V.G.; Agutu, N.O. Hydrological controls on surface vegetation dynamics over West and Central Africa. Ecol. Indic. 2019, 103, 494–508. [Google Scholar] [CrossRef]
  21. Jiang, L.L.; Jiapaer, G.; Bao, A.M.; Guo, H.; Ndayisaba, F. Vegetation dynamics and responses to climate change and human activities in Central Asia. Sci. Total Environ. 2017, 599–600, 967–980. [Google Scholar] [CrossRef]
  22. Qi, S.; Luo, F. Land-use change and its environmental impact in the Heihe river basin, arid Northwestern China. Environ. Geol. 2006, 50, 535–540. [Google Scholar] [CrossRef]
  23. Bai, Y.; Xu, H.L.; Ling, H.B. Eco-service value evaluation based on eco-economic functional regionalization in a typical basin of northwest arid area, china. Environ. Earth Sci. 2014, 71, 3715–3726. [Google Scholar] [CrossRef]
  24. Ann, V.; Stephenm, M.; Ye, L.; Eric, V.R. Chronosequence analysis of two enclosure management strategies in degraded rangeland of semi-arid Kenya. Agr. Ecosyst. Environ. 2009, 129, 332–339. [Google Scholar]
  25. Liang, Y.; Han, G.; Zhou, H.; Zhao, M.; Snyman, H.A.; Shan, D.; Havstad, K.A. Grazing intensity on vegetation dynamics of a typical steppe in northeast Inner Mongolia. Rangel. Ecol. Manag. 2009, 62, 328–336. [Google Scholar] [CrossRef]
  26. James, J.J.; Svejcar, T.J.; Rinella, M.J. Demographic processes limiting seedling recruitment in arid grassland restoration. J. Appl. Ecol. 2011, 48, 961–969. [Google Scholar] [CrossRef] [Green Version]
  27. Jacquemyn, H.; Mechelen, C.V.; Brys, R.; Honnay, O. Management effects on the vegetation and soil seed bank of calcareous grasslands: An 11-year experiment. Biol. Conserv. 2011, 144, 416–422. [Google Scholar] [CrossRef]
  28. Kalamees, R.; Püssa, K.; Zobel, K.; Zobel, M. Restoration potential of the persistent soil seed bank in successional calcareous (alvar) grasslands in Estonia. Appl. Veg. Sci. 2012, 15, 208–218. [Google Scholar] [CrossRef]
  29. Metsoja, J.A.; Neuenkamp, L.; Zobel, M. Seed bank and its restoration potential in Estonian flooded meadows. Appl. Veg. Sci. 2014, 17, 262–273. [Google Scholar] [CrossRef]
  30. Li, S.; Verburg, P.H.; Lv, S.; Wu, J.; Li, X. Spatial analysis of the driving factors of grassland degradation under conditions of climate change and intensive use in Inner Mongolia, China. Reg. Environ. Chang. 2012, 12, 461–474. [Google Scholar] [CrossRef]
  31. Yang, Q.; Qin, Z.H.; Li, W.J.; Xu, B. Temporal and spatial variations of vegetation cover in Hulunbuir grassland of Inner Mongolia, China. Arid. Land. Res. Manag. 2012, 26, 328–343. [Google Scholar] [CrossRef]
  32. Xu, D.; Guo, X. Some insights on grassland health assessment based on remote sensing. Sensors 2014, 15, 3070–3089. [Google Scholar] [CrossRef]
  33. Jeganathan, C.; Dash, J.; Atkinson, P.M. Remotely sensed trends in the phenology of northern high latitude terrestrial vegetation, controlling for land cover change and vegetation type. Remote Sens. Environ. 2014, 143, 154–170. [Google Scholar] [CrossRef]
  34. Jeong, S.J.; Ho, C.H.; Gim, H.J.; Brown, M.E. Phenology shifts at start vs. end of growing season in temperate vegetation over the Northern Hemisphere for the period 1982–2008. Glob. Chang. Biol. 2011, 17, 2385–2399. [Google Scholar] [CrossRef]
  35. Riley, J.D.; Craft, I.W.; Rimmer, D.L.; Smith, R.S. Restoration of magnesian limestone grassland: Optimizing the time for seed collection by vacuum harvesting. Restor. Ecol. 2004, 12, 311–317. [Google Scholar] [CrossRef]
  36. Cornelius, C.; Heinichen, J.; Drösler, M.; Menzel, A. Impacts of temperature and water table manipulation on grassland phenology. Appl. Veg. Sci. 2014, 17, 625–635. [Google Scholar] [CrossRef]
  37. Liang, W. The grassland resources and its utilzation in Kulusitai. Prataculturalence Sci. 1995, 12, 20–21. [Google Scholar]
  38. Liang, W. The ecosystem deterioration in grassland of Kulusitai and its preventive strategy. Grassl. China 2001, 23, 75–78. [Google Scholar]
  39. Holben, B.N. Characteristics of maximum-value composite images from temporal AVHRR data. Int. J. Remote Sens. 1986, 11, 1417–1434. [Google Scholar] [CrossRef]
  40. Lauver, C.L.; Whistler, J.L. A hierarchical classification of Landsat TM imagery to identify natural grassland areas and rare species habitat. Photogramm. Eng. Remote Sens. 1993, S.59, 627–634. [Google Scholar]
  41. Hunt, E.R.; Daughtry, C.; Eitel, J.; Long, D. Remote Sensing Leaf Chlorophyll Content Using a Visible Band Index. Agron. J. 2011, 103, 1090. [Google Scholar] [CrossRef]
  42. Sandholt, I.; Rasmussen, K.; Andersen, J. A simple interpretation of the surface temperature/vegetation index space for assessment of surface moisture status. Remote Sens. Environ. 2002, 79, 213–224. [Google Scholar] [CrossRef]
  43. Tagesson, T.; Horion, S.; Nieto, H.; Fornies, V.Z.; González, G.M.; Bulgin, C.E.; Ghent, D.; Fensholt, R. Disaggregation of SMOS soil moisture over West Africa using the Temperature and Vegetation Dryness Index based on SEVIRI land surface parameters. Remote Sens. Environ. 2018, 206, 424–441. [Google Scholar] [CrossRef]
  44. Jönsson, P.; Eklundh, L. Timesat-a program for analyzing time-series of satellite sensor data. Comput. Geosci. 2004, 30, 833–845. [Google Scholar] [CrossRef]
  45. Li, J.M. Characteristic of Soil Seed Bank and Seed Germination in Soil Seed Bank Requirement for Water Conditions in the Lower Reach of the Tarim River. Ph.D. Thesis, Chinese Academy of Sciences, Beijing, China, 2009. [Google Scholar]
  46. Kendall, M.G.; Gibbons, J.D. Rank Correlation Methods, 5nd ed.; Griffin: London, UK, 1990. [Google Scholar]
  47. Ling, H.; Xu, H.; Shi, W.; Zhang, Q. Regional climate change and its effects on the runoff of Manas River, Xinjiang, China. Environ. Earth Sci. 2011, 64, 2203–2213. [Google Scholar] [CrossRef]
  48. Verheijen, F.G.A.; Cammeraat, L.H. The association between three dominant shrub species and water repellent soils along a range of soil moisture contents in semi-arid Spain. Hydrol. Process. 2007, 21, 2310–2316. [Google Scholar] [CrossRef]
  49. Ye, M.; Xu, H.L.; Qiao, M.; Ren, M. Discussion on the rational water content for restoring semi-shrub artemisia in desert grassland. J. Arid. Land Resour. Environ. 2012, 26, 121–125. [Google Scholar]
Figure 1. Sketch map and sampling sites in Kulusitai grassland.
Sustainability 11 02618 g001
Figure 2. Vegetation coverage of different periods in Kulusitai grassland (A) distribution of grades in vegetation coverage, (B) area ratio of different coverage grades.
Sustainability 11 02618 g002
Figure 3. Changes in vegetation coverage of different periods in Kulusitai grassland (A) distribution of changing grades in vegetation coverage, (B) area ratio of different changing grades in vegetation coverage.
Sustainability 11 02618 g003
Figure 4. Variation trends of vegetation coverage in Kulusitai grassland from 2000 to 2015.
Sustainability 11 02618 g004
Figure 5. Spatial-temporal changes in vegetation productivity of different periods in Kulusitai grassland (A) distribution of changing grades in vegetation productivity, (B) area ratio of different changing grades in vegetation productivity.
Sustainability 11 02618 g005
Figure 6. Variation trends of vegetation productivity in Kulusitai grassland from 2000 to 2015.
Sustainability 11 02618 g006
Figure 7. Variation trends of the TVDI in Kulusitai grassland from 2000 to 2015.
Sustainability 11 02618 g007
Figure 8. Pearson’s correction coefficient between TVDI and vegetation productivity.
Sustainability 11 02618 g008
Figure 9. The area of irrigation (A) and the variation of the quantity of livestock (B).
Sustainability 11 02618 g009
Figure 10. Groundwater depth in Kulusitai grassland (A) and range (B).
Sustainability 11 02618 g010
Figure 11. The characteristics of seed bank germination in Kulusitai grassland (A) amount of seeds germinated in each day (B) cumulative amount of seeds germinated over time.
Sustainability 11 02618 g011
Table 1. The transition matrix of different coverage grades in Kulusitai grassland (×104 ha).
Coverage Grade<0.200.20–0.400.40–0.600.60–0.80>0.80Area in 2000–2002Transfer Out from 2000–2002
<0.200.300.090.000.000.000.390.09
0.20–0.402.137.540.310.020.0010.002.47
0.40–0.600.053.052.000.310.045.453.45
0.60–0.800.000.261.160.710.122.251.53
>0.800.000.040.260.400.811.510.71
Area in 2013–20152.4810.983.731.440.9719.60--
Transfer into 2013–20152.183.441.730.740.16--8.25
Table 2. Analysis of variation trend of phonology in Kulusitai grassland.
ItemMean ValueCoefficient of VariationMin to MaxZcH0
2000–20152011–20152000–20152011–20152000–20152011–2015
Length of growthseason (day)205.6207.16.67.6180–227.8183.7–226.50.68A
Date of the peak in biomass (day)207.5213.82.81.2197.2–216.7209.9–216.72.75R
Note: A—accept, R—reject.
Table 3. The trend of climate factors in Kulusitai grassland.
ItemPeriodMean ValueStandard DeviationRate of ChangeZcH0
Precipitation (mm)1957–2015270.1363.720.160.22A
Air temperature (°C)1957–20156.311.230.066.31R
Evaporation (mm)1957–20151688.98184.164.222.24R
Note:A-accept, R-reject.

