Assessing Changes in Ecosystem Services Provision in Coastal Waters
by
 , , and
Miguel Inácio
1,2,* ,
,
Gerald Schernewski
1,2 ,
,
Dimitra Alkisti Pliatsika
1,
Juliane Benz
1 and
René Friedland
1,3 1
Coastal and Marine Management Group, Leibniz Institute for Baltic Sea Research Warnemuende, 18119 Rostock, Germany
2
Marine Research Institute, Klaipeda University, 92307 Klaipeda, Lithuania
3
European Commission, Joint Research Centre, Institute for Environment and Sustainability, Via Enrico Fermi 2749, 21027 Ispra, Italy
*
Author to whom correspondence should be addressed.
Sustainability 2019, 11(9), 2632; https://doi.org/10.3390/su11092632
Submission received: 20 March 2019
/
Revised: 24 April 2019
/
Accepted: 30 April 2019
/
Published: 7 May 2019
(This article belongs to the Special Issue Understanding the Relationship between Biological Diversity, Ecosystem Functioning and Ecosystem Services in Aquatic Ecosystems)
Abstract
:Coastal ecosystems are important ecosystem services (ES) suppliers. The degradation of these ecosystems jeopardizes the quality of ES provision. The Biodiversity 2020 Strategy aims at maintaining and restoring ES, although clear guidelines are missing on how to define the state to which ES should be restored. In this respect, synergies between ES assessments and the Water Framework Directive (WFD) exist, but methodological approaches to connect both are lacking. The Marine Ecosystem Services Assessment Tool (MESAT) can overcome this problem. In this study, the tool is applied to semi-open and open coastal water bodies in the Southern Baltic Sea, the Greifswald Bay and Pomeranian Bay. The resulting changes in ES provision confirm the ability of MESAT to be applied in all WFD water body types and a multitude of environmental and anthropogenic gradients. Nevertheless, problems such as data scarcity, spatial extent and historical background of the case studies require adaptations in the assessment process. The spatial extent of all case studies allowed to cover a connected system with a strong environmental (salinity) gradient. Analyzing changes in ES provision in connected systems can help to better understand linkages between ES provision and environmental and anthropogenic stressors as well as trade-offs between ES across water bodies. This information can be further used to support the design of management plans. From the analysis of all MESAT case studies, major factors were identified for the tool to be transfered into a European context, as well as potential problems and solutions. Following the WFD is a strong advantage, which ensures the tool’s transferability to other areas.
Keywords:
Schlei; Pomeranian Bay; Szczecin Lagoon; Greifswald Bay; Baltic Sea; Curonian Lagoon; Warnow; indicators; CICES; biodiversity 20201. Introduction
Coastal ecosystems support human wellbeing through the supply of ecosystem services (ES), which are defined as tangible and intangible goods from nature’s processes and functions to humans [1]. As a concept, ES are used to show, from a holistic perspective, the interdependences between humans and nature [1,2]. Intrinsically linked with ecologic integrity, a sustainable provision of ES is often connected to a healthy and fully functioning ecosystem [1,3]. Nevertheless, an anthropogenically driven ecological deterioration of coastal ecosystems has degraded the capacity to provide ES in quantity and quality, contributing to the fragilization of socio-economic systems [4,5,6].
To halt the further loss of ES, the European Union (EU) established in 2011 the Biodiversity 2020 Strategy [7]. Target #2 recommends the member states to assess the state of their ES in order to identify the ones that need restoration. However, there are no clear guidelines to which state the ES should be restored. Assuming that a higher and sustainable provision of ES can, in general, be reached with healthy and fully functioning ecosystems, the only way to reach this goal is to improve the ecological conditions of coastal waters, which is the key focus of the EU Water Framework Directive (WFD). Therefore, any management should build upon strong mutual interests.
The WFD was adopted by the EU in 2000 [8] and is considered as the most ambitious and important policy regarding water management in Europe. It aims at restoring or maintaining a “good ecological status” (GES) of all surface waters (including inner and outer coastal waters). To help its implementation by the member states, the directive provided guidelines, e.g. how to classify the coastal waters spatially or how to derive the GES from reference conditions. Despite many efforts in its implementation, after almost two decades the objectives of the WFD are not fulfilled [9] and around 60% of all European surface water bodies fail to achieve GES [10]. One weakness was the poor linkage between the gained benefits for achieving the WFD objectives for human wellbeing and the lack of a holistic system view among the stakeholders responsible for WFD implementation [9]. Although WFD does not explicitly integrate the concept of ES, it acknowledges the social and economic domain of aquatic systems [11], as well as the benefits that would come along with improvements of ecological conditions [12]. Incorporating ES assessments could help to overcome these shortages, and advancing WFD to better achieve the newer recommendations of the Biodiversity 2020 Strategy to restore both ES and biodiversity [13,14].
Achieving the WFD goals would contribute to restoring the ecosystems’ capacity to supply ES while demonstrating the impacts of GES on the ES provision would highlight its benefits for the human wellbeing. Efforts to explore the connection between ES and the WFD have been made [9,13,15,16,17,18], but the lack of clear definitions, tools and approaches do not allow its practical application [19]. It is necessary to develop tailor-made ES approaches, which fit into the WFD context and provide results that directly support the directive’s implementation. This requires assessments of ES from a historical perspective serving as reference state less affected by anthropogenic pressures. Here a gap arises as the majority of studies focus on static assessments of the current state, especially in coastal and marine ecosystems [20,21,22]. Secondly, the spatial units of ES assessments must fit the WFD water body classification. Aiming at overcoming these gaps, the Marine Ecosystem Services Assessment Tool (MESAT) [23] was developed. It assesses changes in ES provision of the actual ecological conditions of a water body against GES. It utilizes the principles of the WFD to define a state referring to GES and it uses the water body typology as assessment units. While previous studies [23,24] applied the MESAT only to inner coastal water bodies, it is still necessary to test its suitability for outer and open coastal waters to demonstrate its transferability to all WFD water body types.
Hence, the objectives of this article are (1) to test the suitability of the MESAT to cover all inner and outer coastal water bodies defined by the WFD; (2) to test its usability along connected systems with different physical gradients and anthropogenic factors, emphasizing lessons learned from the assessments for connected systems; (3) to identify driving factors that influence its applicability in other regions.
2. Methodology and Study Areas
2.1. Methodology: The Marine Ecosystem Services Assessment Tool
The Marine Ecosystem Services Assessment Tool (MESAT), described in detail in Inácio et al. [23], assesses in a holistic way changes in ES provision between two different time periods (an initial and present status) and can be applied in a qualitative and semi-quantitative way. Based on the Common International Classification of Ecosystem Services (CICES) (version 4.3) [25], it includes 31 ES, assessed by 54 indicators, divided into three sections: provisioning, regulating and maintenance, and cultural services. The indicators are assessed for both time periods, and the difference between the indicator values is allocated into a numerical scale with logarithmic increase. The scale has 11 categories of change (CC): five positive (“1.1 to 1.3”, “1.3 to 1.7”, “1.7 to 2.5”, “2.5 to 4.1” and “>4.1”); five negative (“−1.1 to −1.3”, “−1.3 to −1.7”, “−1.7 to −2.5”, “−2.5 to −4.1” and “<−4.1”) (−1, −2, −3, −4, −5); and one (“−1.1 to 1.1”) representing the initial status. Each indicator value for the initial status is multiplied by the category borders to give the range of values defining each category of change. The user then checks where the value of the indicator for the present status fits within each class and assigns the corresponding CC. For representation purposes, the scale is simplified into: “1 to 5” representing an increase in ES provision; “−1 to −5” representing a decrease; and “0” representing no change. The MESAT uses different data sources such as empirical data (databases), reports and scientific literature, “other sources” (information from models, internet, etc.) and expert knowledge. Based on guidelines defined in MESAT [21], each indicator is given a reliability score from 1 (very high) to 4 (low). For example, for datasets, a reliability score 1 (very high) is given for an official database which is periodically maintained, whereas a score 4 (low reliability) is given for a database with unknown sources which is not maintained. The tool automatically generates graphical outputs for different CICES hierarchical levels. The ES used are shown in Table 1 and the description of the indicators can be found in Appendix A.
The application of MESAT to the new case studies was done in a semi-quantitative way, including empirical data and expert opinions. Based on previous assessments, the initial status represents a time around the 1960s, and the present state between 2010–2015.
Improvement of MESAT’s Aggregation Method
The tool includes an aggregation process adapted to the hierarchical organization of CICES. This allows for the provision of output at different aggregation levels to fit multiple stakeholders’ interests and needs. In the original version of MESAT, this aggregation is done by averaging the results from lower (classes of ES) to higher (section) hierarchical levels. However, one weakness identified in MESAT is that by using the average it gives the same weight for all components, meaning that one service which is represented by only one indicator has the same weight as a service represented by five [23]. Besides the average, and aiming at improving the aggregation process of MESAT, this study developed two new indices, (1) the weighted index based on the number of categories of change from the previous hierarchical level and (2) the weighted index including the reliability score of each indicator used. For all approaches, first, the average value within one group is computed (called cx).
Weighting the categories of changes by the numbers (nx) of the used indicators from the lower hierarchical level allows to regard that the groups at the lower level may consist of a different amount of input data and groups with more indicators should get a higher weight. The aggregated value on the next level (aggr_weighted_by_n) is then computed as follows (assuming that N groups are merged):
Including the reliability values (rx) instead of the numbers at the lower hierarchical level, allows for the consideration of the quality of the input data in the aggregation process. The reliability classification uses a low-class number (1) for high qualities, and vice versa a high class for low quality (4). These class numbers are used as weights but are inverted to calculate the aggregated value (aggr_weighted_by_r):
Introducing a weighting process in the aggregation would increase the robustness of the results since it better represents the hierarchical organization of CICES and includes a reliability component. To be further integrated into MESAT, the aggregation by number index (1) will be applied for assessments that only use expert knowledge (since no indicators are involved), and the aggregation by reliability index (2) will be used for semi- and quantitative assessments.
In this study, the MESAT will be applied in a semi-quantitative way following the aggregation by reliability index.
2.2. Study Areas
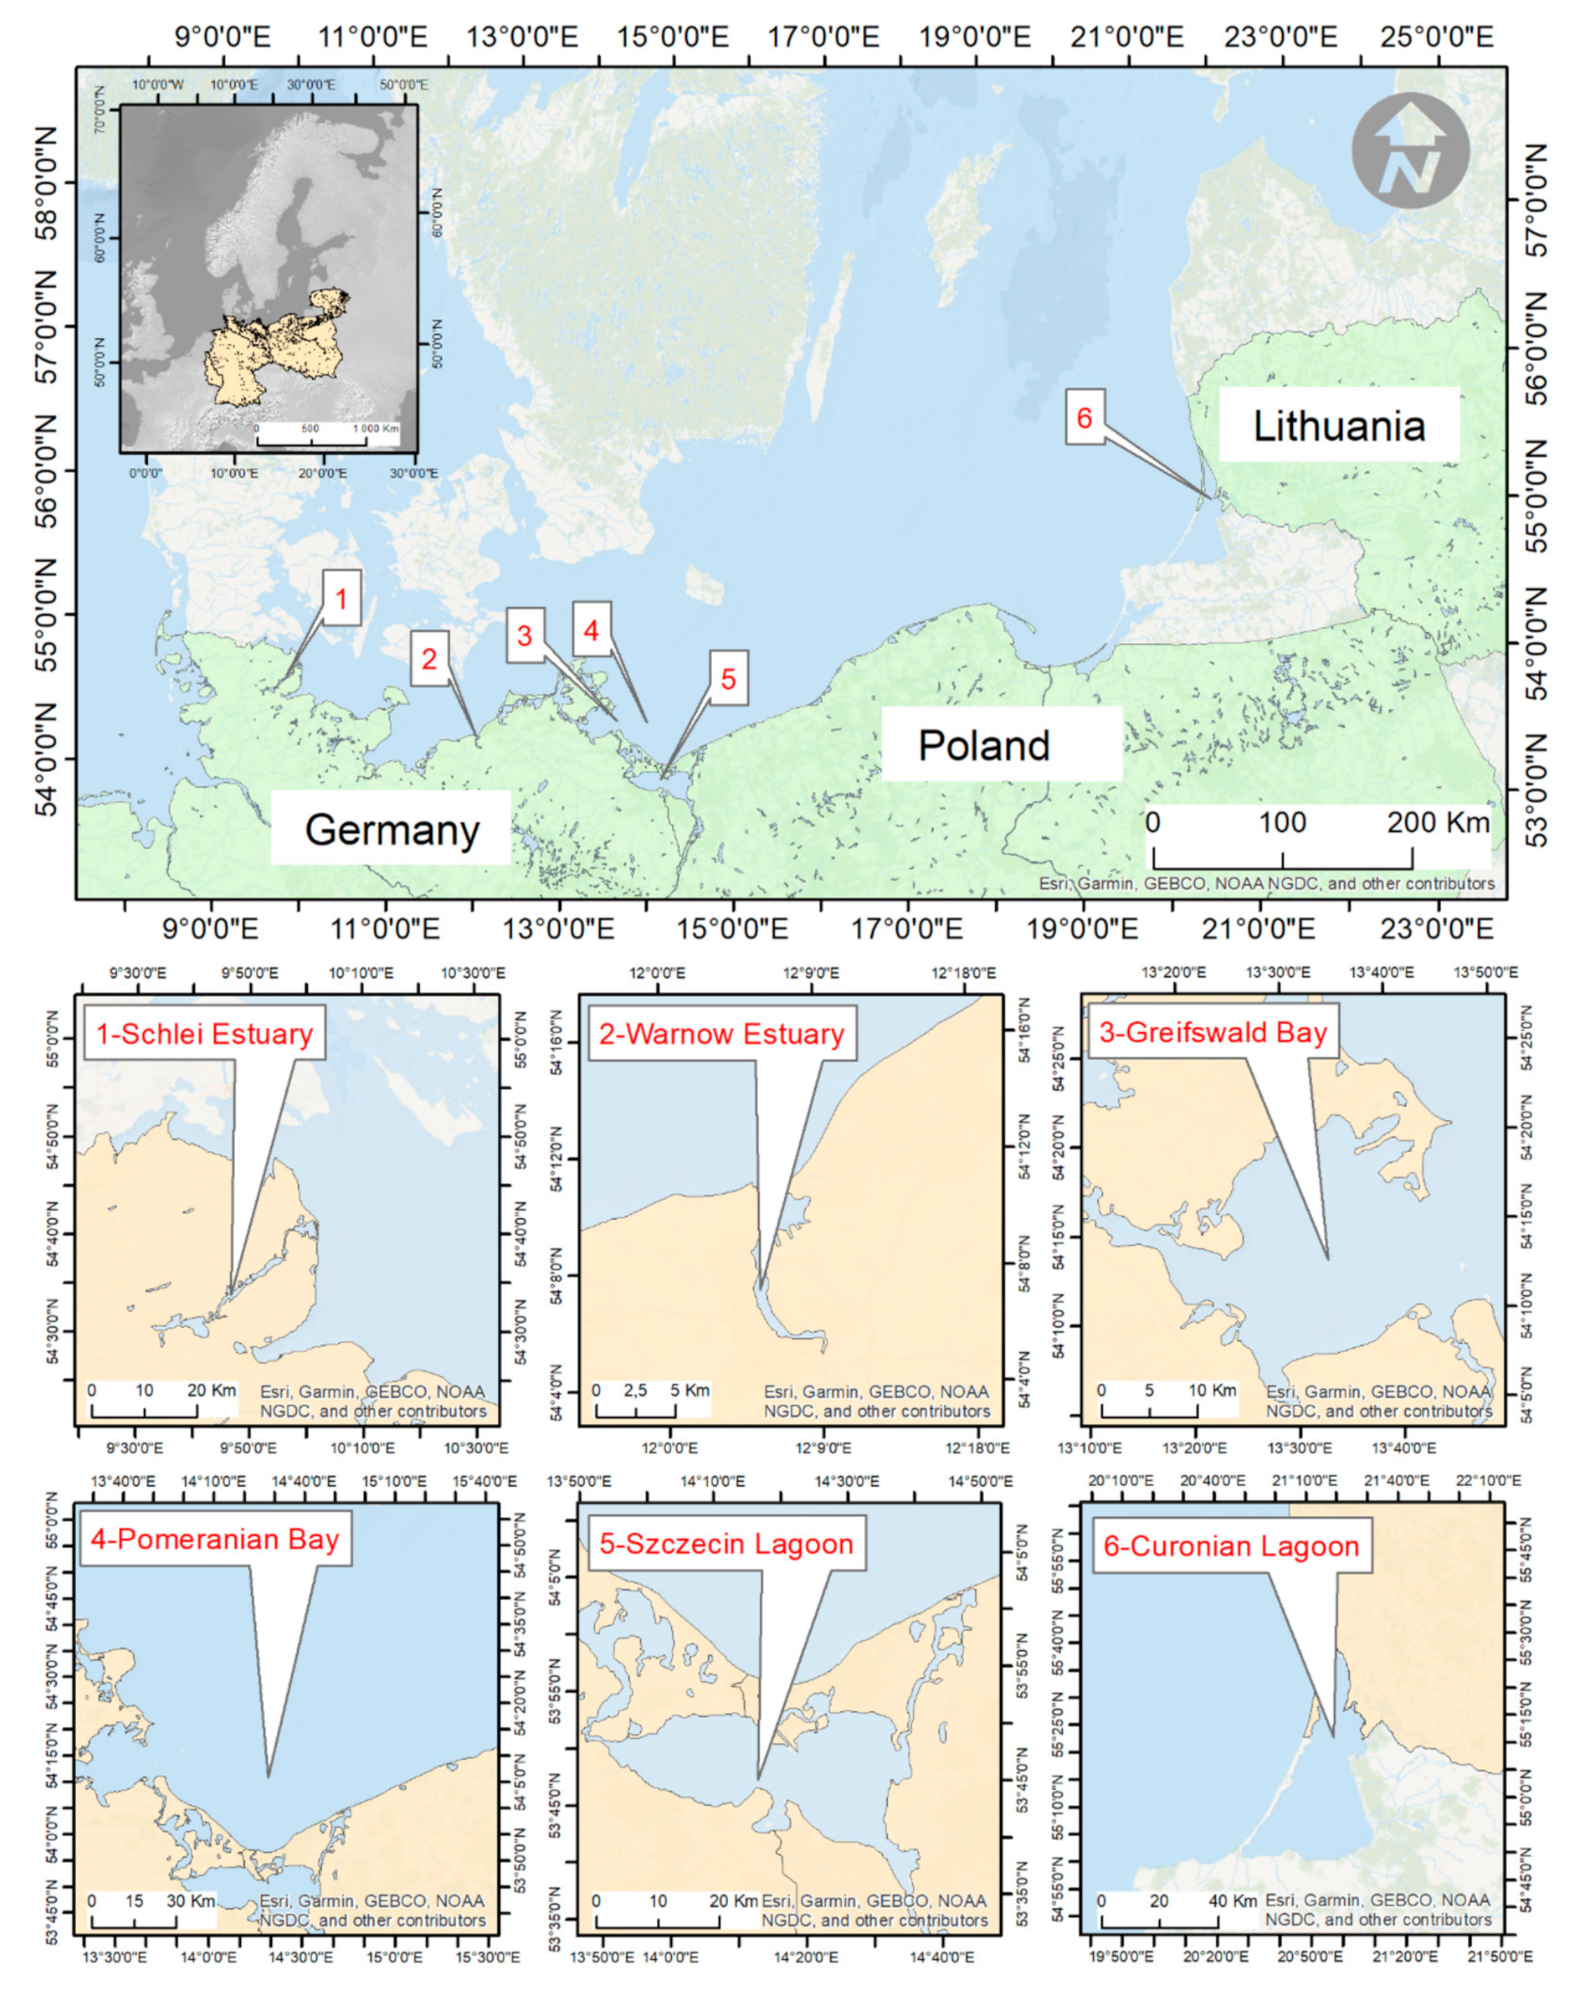
The MESAT uses the WFD water body classification as spatial units for its assessments. Based on physical and chemical parameters, coastal waters are separated into four water bodies types, B1 and B2 representing inner and B3 and B4 representing outer coastal water bodies [26]. Previous studies applied the MESAT only to lagoons and estuaries (inner coastal waters). Inácio et al. [23] applied the tool in a quantitative way to the Szczecin Lagoon (Germany/Poland) and in an expert-based way in the Curonian Lagoon (Lithuania). Schernewski et al. [24], further applied MESAT in a semi-quantitative way to two German estuaries, the Schlei and Warnow. However, in order to test the suitability of MESAT to cover all WFD water body types, it was necessary to test it on semi-open and open coastal waters. Here we introduce two new case studies (Greifswald Bay and Pomeranian Bay) to fill this gap and to cover all WFD body types, as well as a wide range of social, economic and environmental conditions. Experiences and lessons learned from all ES assessments will be used as a basis to discuss the transferability of MESAT to other systems and to help identify important environmental and anthropogenic factors influencing ES provision. Therefore, the results of the previous ES assessments will be included in this study. The full description of the study area of Schlei Estuary, Warnow Estuary, Szczecin Lagoon and Curonian Lagoon can be found in Inácio et al. [23] and Schernewski et al. [24], while the Greifswald Bay and Pomeranian Bay case studies will be described in this study. Figure 1 shows the location of the case studies.
Application to Semi-Open and Open Coastal Water Bodies
Located in the eastern German Baltic coast (Figure 1), the Greifswald Bay is a semi-open coastal water body, whereas the Pomeranian Bay represents open coastal waters. These two case studies are located within the same region as the previous studies, and more importantly, are part of a connected system which allows testing the suitability of MESAT to represent ES changes in gradient systems. This study comprises only the German part of the Pomeranian Bay. Information regarding the environmental and anthropogenic characteristics of the case studies are described in Table 2; Table 3 respectively.
3. Results
3.1. ES Assessment in the Greifswald Bay and Pomeranian Bay
3.1.1. Provisioning Services
The application of MESAT resulted in the assessment of only one out of ten provisioning services. The service considered was P2 (wild animals and their outputs). Figure 2 shows the results representing the hierarchal organization of CICES. In Greifswald Bay, only one ES was considered relevant with sufficient data to represent it. The service P2 was assessed by two indicators, “landings of fish” and “landings of key market species”, using data from the Herring Report [28] which was allocated to “Reports/Literature” and a reliability score of “1—very high”. In Pomeranian Bay, P2 was represented by the indicator “landings of fish” from “Reports/Literature” (1960s, reports from the Fisheries and Harbor Museum of Sassnitz) and “Database/Dataset” (2010s, derived from commercial fishery statistics data from The Baltic Marine Environment Protection Commission (HELCOM) (http://www.helcom.fi/action-areas/fisheries/commercial-fisheries) with a reliability score of “3—Moderate” (1960s) and “1—Very High” (2010s). The overall class of change differed, decreasing in Greifswald Bay and increasing in Pomeranian Bay. Detailed information is given in the Supplementary Materials Tables S1–S4.
3.1.2. Regulating and Maintenance Services
For this section, the application of MESAT resulted in the assessment of all 11 services for the Greifswald Bay and Pomeranian Bay. Figure 3 shows the results of the two case studies. The predominant data sources for the initial status in Greifswald Bay were “Other Data” and “Reports/Literature” with a “2—high” to “3—moderate” reliability score, while the ones for the present status were from “Reports/Literature” and “Other Data” with a “1—very high” to “2—high” reliability scores. The results showed a decrease in one service (RM3), an increase in two services (RM6 and RM10) and no change in eight. In the Pomeranian Bay, the predominant data sources for the initial status were “Other Data” and “Reports/Literature” with high (2) to very high (1) reliability score. Data sources for the present status were predominantly from “Other Data” and “Database/Datasets” with a very high (1) to high (2) reliability score. A decrease in provision was observed for three services (RM1, RM5 and RM7) and an increase for only one (RM6). Seven services remained unchanged. There was no overall change in service provision in both case studies. For this section, the data type “Other Data” relates more to data derived from modeling. Detailed information is given in the Supplementary Materials Tables S1–S4.
3.1.3. Cultural Services
In this section, all ten services were assessed for the Greifswald Bay, and only eight for the Pomeranian Bay (“C5. Entertainment” and “C8. Sacred and/or religious” were not assessed due to lack of data). In Greifswald Bay, the predominant data source used was “Other Data” with a “4—low” reliability score for the initial status and “4—low” and “2—high” for the present status. Out of ten services, nine showed an increase and only one (“C9. Existence”) remained unchanged. In the Pomeranian Bay, no predominant type of data source was used for the initial status. Data with “1—very high” and “2—high” reliability scores were mostly used. For the present status, the most predominant sources were “Database/Datasets” and “Other Sources” with “1—very high” to “3—moderate” reliability scores in Figure 4. All eight cultural services showed an increase with time. For this section the data type “Other Data” relates mostly to data found on websites. Detailed information is given in the Tables S1–S4.
3.2. Broader Analysis of All MESAT Case Studies
Combining the two newly assessed case studies with the two from Inácio et al. [23] (Szczecin and Curonian Lagoons) and the two from Schernewski et al. [24] (Schlei and Warnow estuaries), a total of six MESAT case studies are analyzed (Figure 1), covering coastal lagoons, estuaries, bays and open coastal waters. To compare them, it was necessary to re-apply the MESAT using the aggregation weighted by reliability for all semi-quantitative assessments. Since the Curonian Lagoon assessment was based on a qualitative expert valuation the aggregation by number was used instead. Table 4 compiles the six case studies showing the categories of change for ES class level.
The number of ES differed among the case studies. The assessments of Schlei, Greifswald Bay and Szczecin Lagoon considered 22 out of 31 ES. The assessments for the Pomeranian Bay, the Warnow estuary and the Curonian Lagoon considered 21, 25 and 29 ES respectively. Further, the number of used indicators differed even for the case studies with the same number of ES. 33 indicators were used for the Schlei and Pomeranian Bay assessments, 37 for Greifswald Bay and 39 for Szczecin Lagoon and Warnow estuary.
From the category of change (Table 4), it was not possible to identify any specificity among the case studies. However, it was possible to identify similarities and patterns. For example, in all case studies, there is in general a low number of provisioning ES which are considered as relevant, and most services assessed show a decrease in their provision. On the contrary, for the cultural section, almost all services are considered for all case studies and the pattern shows a high increase in services provision. The regulating and maintenance section was the most variable with no evident pattern, although some similarities and specificities were identified. For example, there were no or minor changes in the provision for the services RM4 (buffering and attenuation of mass flows), RM8 (decomposition and fixing processes), RM10 (global climate regulation by reduction of greenhouse gas concentrations) and RM11 (micro and regional climate regulation). Another example was the isolated increase of RM2 (dilution by the atmosphere, freshwater and marine ecosystems) for Warnow estuary in contrast to the no change for the other case studies.
3.3. ES Changes in Gradient (Connected) Systems
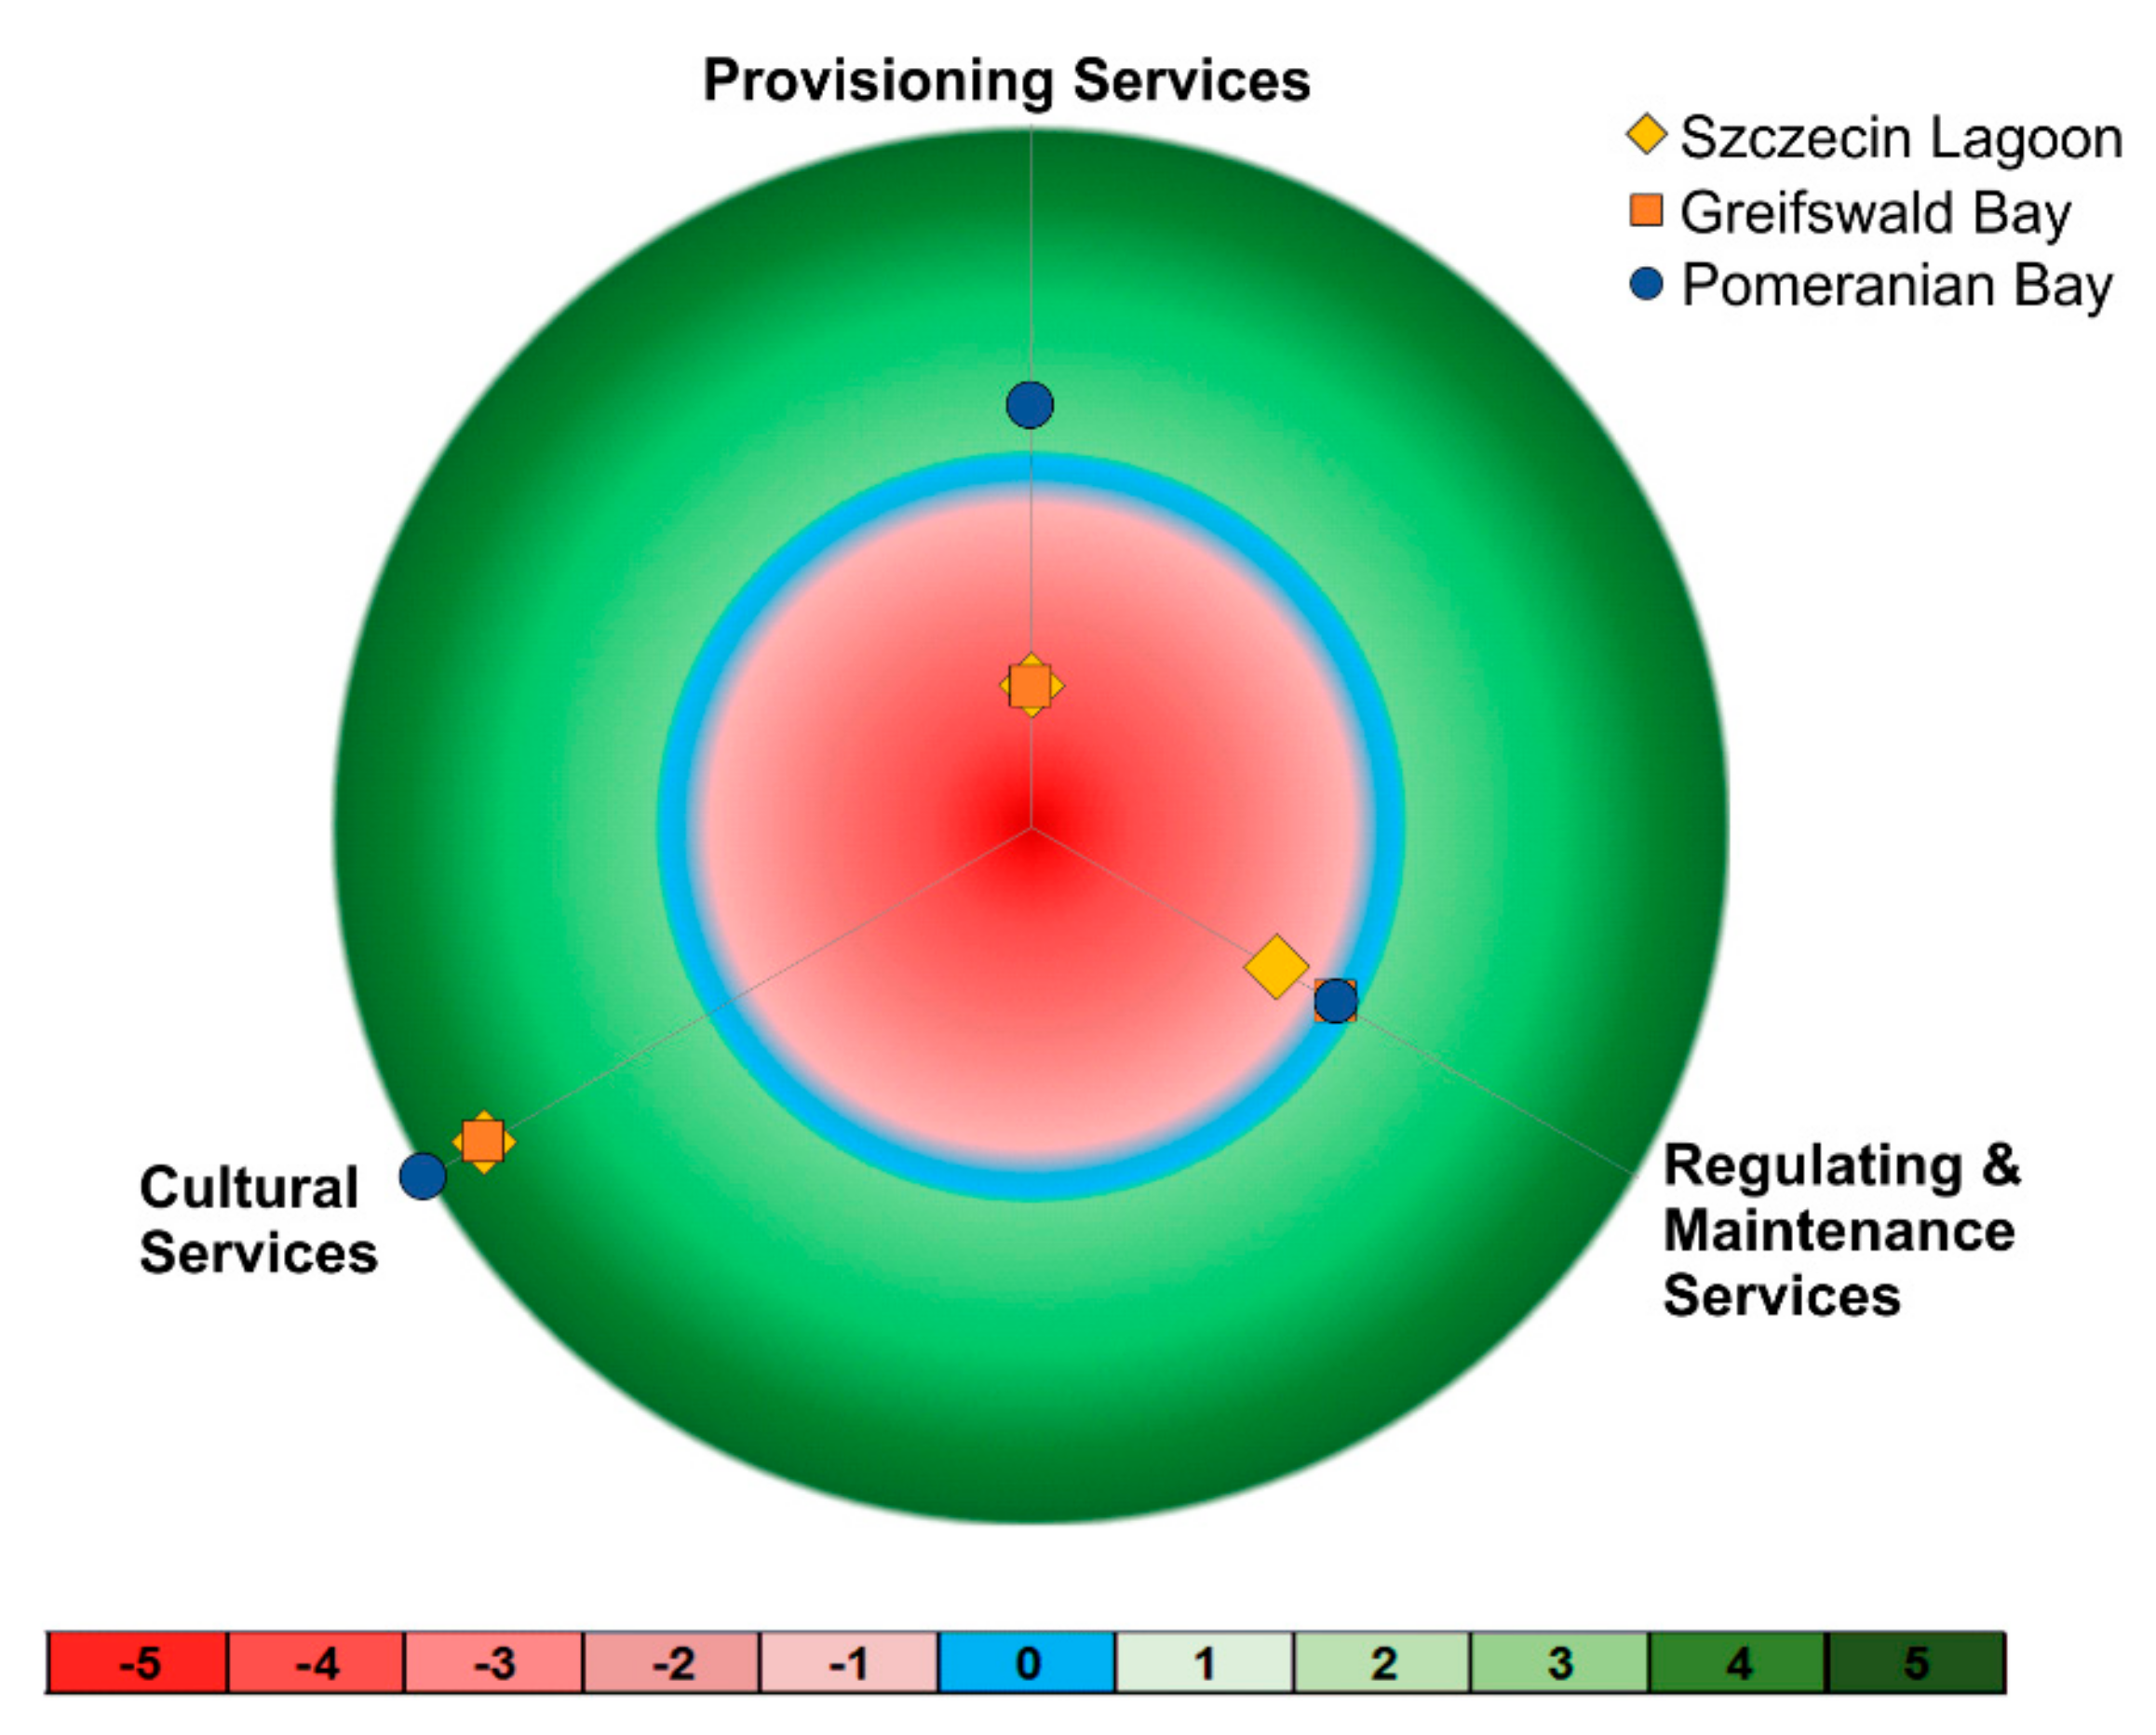
Three of the six case studies are connected among each other in a gradient-like coastal water complex system. The restricted coastal lagoon, Szczecin Lagoon, connects to Greifswald Bay which exchanges water masses with the open coastal water body Pomeranian Bay, in a gradient from a freshwater to a brackish and further a saltwater dominated system. Figure 5, a graphical output automatically generated by the MESAT, shows results aggregated to ES sections.
Provisioning services of Szczecin Lagoon and Greifswald Bay decreased (CC -3), while the provisioning services increased (CC 1) in the Pomeranian Bay. According to the case study characteristics, Szczecin Lagoon and Greifswald Bay, with lower salinities and higher water residence times, showed a decrease of provisioning ES compared to the Pomeranian Bay which has higher salinity and short water residence time. For regulating and maintenance services, the provision decreased (CC -1) for Szczecin Lagoon, which has a higher residence time compared to Greifswald Bay and Pomeranian Bay which were assessed with a no change (CC 0) of ES provision. For the cultural services section, all three case studies showed an increase in services provision, with the increase being more pronounced for the Pomeranian Bay. While Figure 5 shows the aggregated ES changes, it is necessary to understand the environmental and anthropogenic background of each case study to correctly attribute changes to a factor or gradient.
4. Discussion
4.1. Suitability of MESAT to Assess Semi-Open and Open Coastal Waters
In the process of MESAT application to the new case studies, some weakness and problems rose that required adaptations in the interpretation and validation of several services and indicators. In the time around the initial status, due to historical and political reasons, many indicators were “not existent” or only started to be measured later. For the present status, a considerable share of the existing data is not publicly accessible, therefore some services had to be assessed using the best available data which may not be the most representative. A needed adaptation relates to the size of the area assessed. Due to the extent of the Pomeranian Bay study area many gradients and local differences exist, making the validation of indicators a problem. For example, to assess the service RM4 (“buffering and attenuation of mass flows”) it was necessary to average indicators over the entire area. The values of the indicators “shoreline erosion rate” and “sediment accumulation rate” show local differences at two locations, the island of Ruegen and the island of Usedom [29,30]. Therefore, the category of change for these ES is a balance between these two local peculiarities which do not represent the whole area. The problem identified is similar to what was encountered in the assessment of the Schlei and Warnow, where gradients along the estuaries were averaged to represent services.
The weaknesses and problems encountered in these assessments are not location specific. In the previous studies the same problems with data scarcity, the spatial extent of indicators, and the use of expert knowledge occurred. Townsend et al. [31] identify these as common problems that hamper in general the practical application of the concept to marine systems.
Despite the weaknesses and adaptations required, the results obtained from the application of MESAT to the new case studies confirm its suitability to assess changes in ES provision for semi-open and open coastal water bodies. The results provided allow direct comparisons with previous assessments and contribute to improvement in knowledge on ES dynamics.
4.2. Applicability of MESAT Assess ES Changes in Gradient (Connected) Systems and Lessons Learned
The case studies of Szczecin Lagoon, Greifswald Bay and Pomeranian Bay are connected by water exchange and provided the opportunity to test the applicability of the tool to address ES changes in a connected system. The results, which showed different ES provision changes between the water bodies following environmental gradients, confirm its suitability to assess ES changes in connected systems. The case studies are independent water bodies in the WFD but are connected among each other by an exchange of water so changes in one system will affect the others. The results of Table 4 and Figure 5 will serve as a basis to discuss how the changes in ES between the case studies are related.
In terms of ecological conditions, all three case studies are now in a degraded situation, and according to the WFD in poor conditions [10]. This affects the ecological functions and processes and therefore the provision of its associated ES. While this degraded situation is visible through the overall decrease of regulating and maintenance services provision in the Szczecin Lagoon, this is not the case for the other two case studies where the provision remained unchanged over time. Nevertheless, the water bodies have suffered from similar environmental problems, mainly due to the increase of eutrophication status. In the Szczecin Lagoon, increasing nutrient inputs from the river Oder led to eutrophication of the lagoon [32], a decrease in water transparency [33,34,35] and a decrease of macrophyte coverage [36]. In the Greifswald Bay, Munkes [37] and Schiewer and Schernewski [38] reported a eutrophication status of the bay, related to the input of nutrients from the Szczecin Lagoon and other tributaries [39]. This then led to an increase of phytoplankton concentrations, an increase of turbidity (with a Secchi depth decrease) and a reduction of macrophyte coverage from 80% to 25% [37,38]. In the Pomeranian Bay continuous nutrient loads, discharged mainly from the Szczecin Lagoon and Greifswald Bay [40], have contributed to a eutrophic status of the bay, which also led to a decrease of macrophyte coverage [41]. Similar environmental problems have led to different provision changes, and this potentially connects with the environmental characteristics of the case studies. The Szczecin Lagoon has a restricted water exchange and a high residence time (55 days [27]), in contrast, the Greifswald Bay and Pomeranian Bay have a smaller residence time, a higher flush rate, and also smaller catchment area (Greifswald Bay) [27]. This clearly influences the provision of some ES. For example, in Szczecin Lagoon and Greifswald Bay, the decrease of RM3 (mass stabilization and control of erosion rates) is a consequence of the reduced sediment stabilization due to the loss of macrophyte coverage and reduced reed zone. In the Pomeranian Bay, due limited loss of macrophyte coverage, this service remained unchanged. The decrease of the sediment stabilization initiates an increase in turbidity which eventually has an impact on water transparency. This is reflected in the service RM6 (maintaining nursery populations and habitats). The accentuated decrease of Secchi depth in Szczecin Lagoon as a consequence of eutrophication, increased turbidity and high residence times, led to the overall decrease of service RM6. In Greifswald Bay, despite the decreased macrophyte coverage, the residence time is smaller and the flush rate higher which led only to a slight decrease of Secchi depth and the overall unchanged provision of RM6. In Pomeranian Bay, no change in Secchi depth occurred and RM6 was assessed with an increase. Another example is the service RM9 (chemical conditions of saltwater). In Szczecin Lagoon the decrease of this service, when compared to Greifswald Bay and Pomeranian bay, is associated with the decrease of salinity and changes in nutrient concentrations.
In the other sections, it is also possible to find differences among the case studies. In the Szczecin Lagoon and Greifswald Bay, the provisioning services decreased as a response to the reduction of fish landings in these two water bodies. In the Szczecin Lagoon the decrease of key market landings [42,43] led to an overall decrease of fisheries as a service and in the Greifswald Bay the fish landings diminished by half since the 1950s, accounting for the present status of 10.66 ton year−1 km2 [28]. Reasons are the loss of nursery areas due to a lower macrophyte coverage and possibly a linkage to historical events as Raillard [44] stated that in the 1940s the GDR aimed to increase fisheries by offering fishermen premium goods in exchange for fish catches. In the Pomeranian Bay, despite also a decrease of macrophyte coverage occurred, fish landings increased, from 2.46 (1960s) to 3.18 tons year −1 km2 (2010s) (numbers re-calculated from HELCOM). The reason could be connected with the location of a nearby important fishing ground called the “Oder Bank”. This is a protected area under multiple protection schemes like the Natura 2000 which can have a positive influence on fish stock.
This study, by analyzing the changes of ES provision against the anthropogenic and environmental backgrounds of the case studies, has helped to uncover and shed light on the spatial linkages and trade-offs between ES and across case studies. Understanding the ES dynamics and its trade-offs, especially across gradient systems, is important to better understand the impacts of policy implementation and decision making processes [5,20,45]. Townsend et al. [31] states that “for management, understanding the connections and contributions of spatially arrayed ecosystem components is absolutely critical”. The analysis of these case studies (together with the other from Table 4) shows, in opposition to what is raised in the introduction, that restoring the good ecological conditions of water bodies will not maximize and restore the provision of all ES sections. For example, the degraded ecological conditions over time in the three case studies were followed by an increased provision (and demand) of cultural services while regulating services and provisioning services decreased. The results of Grizzetti et al. [46] show that for most of the European water bodies, the ecological degraded status led to an increase of provisioning services. The same authors conclude that by understanding the relationships between ecological conditions and ES is of great relevance for understanding linkages between the restoration of ecosystem contributes to human wellbeing and how the exploration of ecosystems and their ES affects the ecological conditions aquatic ecosystems. This brings again the emphasis that trade-offs and relationships between ES in aquatic systems need to be better understood to improve management and policies as well as to achieve a more sustainable use of ES and contributing to an improved human wellbeing.
4.3. Major Factors Influencing the Transferability of MESAT
The main objective of MESAT is to ensure broad usability, being able to be applied in multiple coastal locations in the Baltic Sea and also that it could be transferred to other regions of Europe. The assessment of six case studies, which covered different environmental, social and economic characteristics, helped to identify four main factors of the tool to be applied to other systems, as well as potential problems.
The first and most important factor is the availability of a common spatial classification for water bodies, on which the assessments can be built. The use of the WFD water body classification covers this. Therefore, MESAT could be transferred to other European regions since the directive’s implementation resulted in the spatial definition of all member states’ surface waters. However, the case study assessments revealed that on some occasions the use of the WFD classification is also problematic. For example, according to the WFD, the Schlei can be divided into different water bodies, therefore, the tool should be applied for both. However, as pointed out by Schernewski et al. [24], the lack of spatial data for many indicators does not allow an individual ES assessment for all water bodies along the estuary. In this case, the assessment should be done for the whole water body at once. Another example is the cross-border nature of water bodies, especially when these are shared with non-EU countries like the case of the Curonian Lagoon. The solution was to only assess the EU “side”, as the access to usable data was mostly easier.
The second main factor is the capability to define the initial status. In MESAT the initial status corresponds to “good” or better ecological conditions of a water body, and it is defined by adding 50% of nutrient concentration from a reference period according to the WFD [8,39]. Since for all water bodies reference conditions are defined by the member states, and this is a publicly accepted and accessible information, it is in principle possible to define an initial status in other European regions as well. However, problems can occur when strictly following this approach. For example, for the German Baltic Sea, the initial status corresponds in general to the time period around the 1960s [39]. To define this time, and as the availability of nutrient concentration measurements for reference conditions are almost inexistent, it is necessary to use modelled data. Hence, it is important to understand if following this approach corresponds to good ecological conditions. In the case of Schlei and Warnow estuaries, the water bodies were already in a degraded ecologic condition in the 1960s due to anthropogenic impacts [24]. This means that it is necessary to analyze the historical situation of the water body in terms of anthropogenic impacts and re-adjust the initial status to correctly represent good ecologic conditions.
The third pre-condition is to check whether the used ES set in MESAT is broad enough to be applied in a European context. CICES is the classification used by EU in the Mapping and Assessment of Ecosystems and their Services Project (MAES) [47] and currently one of the most used ES classifications [48]. The classification has been applied to different systems around Europe, meaning that the classification is broad enough to be applied in a European context. However, it is necessary to make adaptations to the classification. In the early stages of the MESAT development, version 4.3 of CICES [25] was screened with the aim to kick out terrestrial related services and services which are not considered for most coastal regions. It excludes, for example, genetic materials and abiotic services, which are important in other regions. By following CICES, MESAT can, in fact, be used in other regions, but the assessment could lack representativity, as other important ES may not be included. The adaptation to the recent version of CICES [49] should, therefore, be considered to overcome this problem.
The fourth factor is the availability of quantitative or qualitative data to assess indicators for the initial and present status. With respect to the MESAT usability, this might be the most important aspect. The MESAT indicator set was created with the intention to be broad and not system specific, which would allow its transferability to all water body types. It joins indicators of the MAES [47] indicator list, which was developed to be applied in all European countries, and own developed indicators that are in general common to all coastal water bodies worldwide. Therefore, if the data is in general available the tool can be applied in a broader European context. However, this is almost never the case, as a lack of data records is a major constraint in many ES assessments [31]. Based on the lessons learned from the MESAT assessments, there are many constraints and reasons for the lack of data. In Greifswald Bay and Pomeranian Bay, there were almost no data records for the initial status available, due to the historical and political background. For example, in the 1960s the coastal strip was almost entirely closed to public restricting strongly the access to information on cultural services. In the Curonian Lagoon, the initial status corresponded to a completely different political regime and almost no data could be accessed. For cross-border water bodies like Szczecin Lagoon, data records, periodicity of measurement, accessibility of data and other factors can differ between countries making the assessment process difficult. The lack of spatially explicit data [31] for the Schlei and Warnow estuary hampered the applicability of MESAT to correctly represent changes in ES provision along the estuaries, as most indicators show a strong gradient. Nevertheless, despite all problems and constraints, these can be overcome by using expert knowledge whenever data is missing like it was done in all the case studies. An alternative is to base the assessment strictly on expert knowledge as it was done in many approaches due to its practicality [50,51], however, problems with subjectivity may arise [52,53]. Another important point in this context relates to the new aggregation process developed in this study. It is important that all the used data is given a correct reliability score, which can be done using the MESAT’s guidelines. Incorporating the reliability in the aggregation can have a significant impact on the results. For example, in Figure 4 the cultural services classes of Greifswald Bay had a higher category of change compared to the Pomeranian Bay. However, the aggregated category of change is higher in the Pomeranian Bay than in Greifswald Bay as a result or higher reliability scores of single ES classes.
5. Conclusions
This study provided an opportunity to test the MESAT for semi-open and open coastal water bodies, covering in this way all water body types defined in the WFD. Together with previous case studies, this study also allowed to address changes in ES in connected systems, contributing to the lack of studies addressing this topic. The experiences and lessons learned during the MESAT’s assessment allowed for the identification of the major factors for its transferability. These factors can also be seen as pre-conditions for the application of the tool and given its fulfilment one can conclude that the tool is possible to apply in a European context, mostly because it integrated publicly accepted and accessible information form the WFD. Nevertheless, the contribution of the overall view of changes in ES for all the case studies can also support policy and decision-making processes by: (1) enhancing ES knowledge in marine ecosystems, a gap identified by many authors [31,54,55]; (2) increasing the understanding of temporal dynamics of ES provision, contributing to an increase in the low number of available studies that consider historical changes of ES provision [56] and improving spatial and management plans [20,56,57,58] by assessing changes instead of providing a static picture [57]; (3) helping to prioritize which ES should be restored, and point decision-makers where to direct efforts; and (4) contribute to identifying spatial data gaps, helping decision-makers to recognize where more efforts need to be allocated in order to generate the necessary data to assess the missing indicators, and consequently ES.
At the beginning of this study, a clear synergy between WFD and Biodiversity 2020 Strategy was identified. Achieving the WFD’s targets would contribute to fulfilling the strategy’s goals in the restoration of ES, which would then show in a more comprehensive way the benefits of WFD for socio-economic development potentially contributing to a smoother implementation. However, synergies of fulfilling the WFD aims to go beyond the Biodiversity 2020 should be further explored. For example, achieving good ecological conditions would improve the ecological functions and processes in a water body, contributing to the restoration of degraded habitats. In Europe, the Habitats Directive [59] and Natura 2000 areas “aim to promote the maintenance of biodiversity, taking account of economic, social, cultural and regional requirements”. Therefore, by using the ES concept it can help to better highlight the socio-economic benefits of Natura 2000 areas if the habitats are restored to a better ecological status [60,61,62].
Supplementary Materials
The following are available online at https://www.mdpi.com/2071-1050/11/9/2632/s1, Table S1: Assessment of Greifswald Bay; Table S2: Assessment of Pomeranian Bay; Table S3: Indicators used in the Greifswald Bay ES assessment; S4: Indicators used in the Pomeranian Bay case studies.
Author Contributions
M.I. developed the article concept, took care of the analyses and did the article writing and reviewing supported by G.S., D.A.P. and R.F. G.S. and D.A.P. and R.F. contributed to the concept development and ideas. D.A.P. carried out the E.S. assessment in the Greifswald Bay. J.B. carried out the E.S. assessment in Pomeranian Bay. R.F. developed the mathematical components of the work and provided data for the assessment of E.S.
Funding
This research was partly funded by SECOS-Synthese (The Service of Sediments in German Coastal Seas; FK: 03F0738A) and MOSSCO-Synthese (03F0470B), both funded by German Federal Ministry of Education and Research, and by BONUS Optimus (03A0020A). BONUS Optimus have received funding from BONUS (Art 185), funded jointly from the European Union’s Seventh Programme for research, technological development and demonstration, and from Baltic Sea national funding institutions. This work was in part supported by the Doctorate Study programme in Ecology and Environmental Sciences, Klaipėda University (undertaken by Miguel Inácio).
Acknowledgments
We like to thank Johanna Schumacher, Yaroslava Nazemtseva, Eglė Baltranaitė, Philipp Paysen, Svenja Hoef, Esther Robbe, Sven Dahlke, Kazimierz Rabski and all experts involved in the assessments, for supporting the work, providing data and information. To Fatima Aziz, Nils Droste and Paulo Pereira for English language check and support.
Conflicts of Interest
The authors declare no conflict of interest. The funders had no role in the design of the study; in the collection, analyses, or interpretation of data; in the writing of the manuscript, and in the decision to publish the results.
Appendix A

Table A1.
Indicators used in the MESAT approach, modified from Inácio et al. [23]. P—provisioning, RM—regulating and maintenance, C—cultural.
Table A1.
Indicators used in the MESAT approach, modified from Inácio et al. [23]. P—provisioning, RM—regulating and maintenance, C—cultural.
| Section | Class | Indicator | Units |
|---|---|---|---|
| Provisioning Services | P1. Wild plants, algae and their outputs | Harvest of wild plants, algae | ton yr−1 km−2 |
| Nºof species of wild plants, algae | No. km−2 | ||
| P2. Wild animals and their outputs | Landings (wild animals) | ton yr−1 km−2 | |
| Landing of key market species (wild animals) | ton yr−1/km−2 | ||
| P3. Animals from in situ aquaculture | Harvest (animals from aquaculture) | ton yr−1 km−2 | |
| Nº of species (animals from aquaculture) | no. km−2 | ||
| P4. Plants and algae from in situ aquaculture | Harvest (plants, algae from aquaculture) | ton yr−1 km−2 | |
| Nº of species (plants, algae from aquaculture) | no. km−2 | ||
| P5. Surface water for drinking purposes | Use of water for drinking | m−3 km−2 | |
| P6. Fibers and other materials from plants, algae and animals for direct use or processing | Harvest of materials from plants, algae and animals for direct use or processing | ton yr−1 km−2 | |
| P7. Materials from plants, algae and animals for agriculture | Harvest of materials from plants, algae and animals for agriculture, fodder | ton yr−1 km−2 | |
| P8. Surface Water for non-drinking purposes | Use of water for non-drinking | m−3 km−2 | |
| P9. Plant-based resources | Use of plant-based resources for energy | ton yr−1 km−2 | |
| P10. Animal-based resources | Use of animal-based resources for energy | ton yr−1km−2 | |
| Regulating and Maintenance Services | RM1. Filtration / sequestration /storage/accumulation by ecosystems | N-fixation | kg yr−1 km−2 |
| Burial of P | kg yr−1 km−2 | ||
| Denitrification | kg yr−1 km−2 | ||
| RM2. Dilution by atmosphere, freshwater and marine ecosystems | Average of beach closures per year | no. km−2 | |
| RM3. Mass stabilization and control of erosion rates | Extent of selected emerged, submerged and intertidal habitats | km−2 km−2 | |
| RM4. Buffering and attenuation of mass flows | Sediment accumulation rate | cm yr−1 | |
| RM5. Flood Protection | Shoreline erosion rate | mm yr−1 km−2 | |
| Maximum depth (to calculate maximum wave height) | m | ||
| Design-basis flood | m | ||
| RM6. Maintaining nursery populations and habitats | Submerged and intertidal habitats diversity | no. km−2 | |
| Occurrence of oxygen concentration < 6 mg/L | days yr−1 | ||
| Secchi depth | m | ||
| Species distribution | km−2 km−2 | ||
| Nursery areas | km−2 km−2 | ||
| % of nursery areas which are protected | km−2 km−2 | ||
| RM7. Pest and Disease control | Harmful algal bloom outbreaks | no. km−2 | |
| Presence of alien species | no. km−2 | ||
| RM8. Decomposition and fixing processes | Nitrogen removal | % | |
| Water residence time | months | ||
| RM9. Chemical condition of salt waters | Nutrients concentration | mg L | |
| Salinity | PSU | ||
| Oxygen concentration | mg L | ||
| RM10. Global climate regulation by reduction of greenhouse gas concentrations | C stock | tonC km−2 | |
| C sequestration | tonC yr−1 km−2 | ||
| pH | |||
| Primary production (PP) | tonC yr−1 km−2 | ||
| RM11. Micro and regional climate regulation | Evaporation rate | per km−2 | |
| Cultural Services | C1. Experiential use of plants, animals and land-/seascapes in different environmental settings | Nº of visitors taking part in activities related to biota | no. yr−1 km−2 |
| C2. Physical use of land-/seascapes in different environmental settings | Nº of tourists (within 1 km of the coastal zone) | no. km−2 | |
| Nº of ship berths in the marinas | no. km−2 | ||
| Nº of tourist Boat | no.*capacity km−2 | ||
| C3. Scientific and Educational | Scientific studies, Documentaries, educational publications | no. yr−1 km−2 | |
| Visits to scientific and artistic exhibits | no. yr−1 | ||
| C4. Heritage, cultural | Nº of cultural and heritage sites | no. km−2 | |
| C5. Entertainment | Nº of movies and broadcasts in the area | no. km−2 | |
| C6. Aesthetic | Nº of pictures | no. yr−1 km−2 | |
| C7. Symbolic | Nº of Red List and iconic species | no. km−2 | |
| C8. Sacred and/or religious | Nº of religious events (within 1 km of the coastal zone) | no. km−2 | |
| C9. Existence | Nº of offers for health treatments (within 1 km of the coastal zone) | no.*capacity km−2 | |
| C10. Bequest | Extent of marine protected areas | km−2 km−2 |
References
- Millennium Ecosystem Assessment. Ecosystems and Human Well-Being: Synthesis; Island Press: Washington, DC, USA, 2005; Volume 5, ISBN 1597260401. [Google Scholar]
- Costanza, R.; Arge, R.; De Groot, R.; Farberk, S.; Grasso, M.; Hannon, B.; Limburg, K.; Naeem, S.; O’Neill, R.V.; Paruelo, J.; et al. The value of the world’s ecosystem services and natural capital. Nature 1997, 387, 253–260. [Google Scholar] [CrossRef]
- Bastian, O.; Grunewald, K.; Syrbe, R.U. Space and time aspects of ecosystem services, using the example of the EU Water Framework Directive. Int. J. Biodivers. Sci. Ecosyst. Serv. Manag. 2012, 8, 5–16. [Google Scholar] [CrossRef]
- Daily, G.; Postel, S.; Bawa, K.; Kaufman, L. Nature’s Services: Societal Dependence on Natural Ecosystems; Bibliovault OAI Repository; The University of Chicago Press: Chicago, IL, USA, 1997. [Google Scholar]
- Bennett, E.M.; Chaplin-Kramer, R. Science for the sustainable use of ecosystem services. F1000Research 2016, 5, 2622. [Google Scholar] [CrossRef] [PubMed]
- Barbier, E.B. Progress and Challenges in Valuing Coastal and Marine Ecosystem Services. Rev. Environ. Econ. Policy 2012, 6, 1–19. [Google Scholar] [CrossRef]
- Comission, E. The EU Biodiversity Strategy to 2020; Publications Office of the European Union: Luxembourg, 2011. [Google Scholar]
- Directive 2000/60/EC Directive 2000/60/EC of the European Parliament and of the Council of 23 October 2000 establishing a framework for Community action in the field of water policy. Off. J. Eur. Parliam. 2000, L327, 1–82. [CrossRef]
- Voulvoulis, N.; Arpon, K.D.; Giakoumis, T. The EU Water Framework Directive: From great expectations to problems with implementation. Sci. Total Environ. 2017, 575, 358–366. [Google Scholar] [CrossRef]
- European Environment Agency. European Waters: Assessment of Status and Pressures 2018; European Environment Agency: Copenhagen, Denmark, 2018; ISBN 8801021704. [Google Scholar]
- Vugteveen, P.; Leuven, R.S.E.W.; Huijbregts, M.A.J.; Lenders, H.J.R. Redefinition and Elaboration of River Ecosystem Health: Perspective for River Management. Hydrobiologia 2006, 565, 289–308. [Google Scholar] [CrossRef]
- Martin-Ortega, J. Economic prescriptions and policy applications in the implementation of the European Water Framework Directive. Environ. Sci. Policy 2012, 24, 83–91. [Google Scholar] [CrossRef]
- Vlachopoulou, M.; Coughlin, D.; Forrow, D.; Kirk, S.; Logan, P.; Voulvoulis, N. The potential of using the Ecosystem Approach in the implementation of the EU Water Framework Directive. Sci. Total Environ. 2014, 470–471, 684–694. [Google Scholar] [CrossRef] [PubMed]
- Rouillard, J.; Lago, M.; Abhold, K.; Röschel, L.; Kafyeke, T.; Mattheiß, V.; Klimmek, H. Protecting aquatic biodiversity in Europe: How much do EU environmental policies support ecosystem-based management? Ambio 2018, 47, 15–24. [Google Scholar] [CrossRef] [PubMed]
- Giakoumis, T.; Voulvoulis, N. A participatory ecosystems services approach for pressure prioritisation in support of the Water Framework Directive. Ecosyst. Serv. 2018, 34, 126–135. [Google Scholar] [CrossRef]
- Grizzetti, B.; Liquete, C.; Antunes, P.; Carvalho, L.; Geamănă, N.; Giucă, R.; Leone, M.; McConnell, S.; Preda, E.; Santos, R.; et al. Ecosystem services for water policy: Insights across Europe. Environ. Sci. Policy 2016, 66, 179–190. [Google Scholar] [CrossRef]
- Saladin, M.; Neubauer, L.; Görlitz, S.; Borowski-Maaser, I.; Interwies, E.; Rotter, S. ESAWADI—Ecosystem Services Approach for Water Framework Directive Implementation—German Case Study Report; The Federal Ministry of Education and Research: Bonn, Germany, 2012; pp. 1–97. [Google Scholar]
- COWI Support Policy Development for Integration of Ecosystem Service Assessments into WFD and FD Implementation. Available online: https://circabc.europa.eu/sd/a/79584b30-a2a3-4fa8-9d07-85303dfdf9b1/Ecosystem%20services_WFD_FD_Annex%20report_Final.pdf (accessed on 24 April 2019).
- Polasky, S.; Tallis, H.; Reyers, B. Setting the bar: Standards for ecosystem services. Proc. Natl. Acad. Sci. USA 2015, 112, 7356–7361. [Google Scholar] [CrossRef]
- Renard, D.; Rhemtulla, J.M.; Bennett, E.M. Historical dynamics in ecosystem service bundles. Proc. Natl. Acad. Sci. USA 2015, 112, 13411–13416. [Google Scholar] [CrossRef] [PubMed]
- Dallimer, M.; Davies, Z.G.; Diaz-Porras, D.F.; Irvine, K.N.; Maltby, L.; Warren, P.H.; Armsworth, P.R.; Gaston, K.J. Historical influences on the current provision of multiple ecosystem services. Glob. Environ. Chang. 2015, 31, 307–317. [Google Scholar] [CrossRef]
- Dittrich, A.; von Wehrden, H.; Abson, D.J.; Bartkowski, B.; Cord, A.F.; Fust, P.; Hoyer, C.; Kambach, S.; Meyer, M.A.; Radzevičiūtė, R.; et al. Mapping and analysing historical indicators of ecosystem services in Germany. Ecol. Indic. 2017, 75, 101–110. [Google Scholar] [CrossRef]
- Inácio, M.; Schernewski, G.; Nazemtseva, Y.; Baltranaite, E.; Friedland, R.; Benz, J. Ecosystem services provision today and in the past: A comparative study in two Baltic lagoons. Ecol. Res. 2018, 33, 1255–1274. [Google Scholar] [CrossRef]
- Schernewski, G.; Paysen, P.; Robbe, E.; Inacio, M.; Schumacher, J. Ecosystem service assessments in water policy implementation: An analysis in urban and rural estuaries. Front. Mar. Sci. 2019, 6, 183. [Google Scholar] [CrossRef]
- Haines-Young, R.; Potschin, M. Common International Classification of Ecosystem Services (CICES): Consultation on Version 4, August–December 2012; EEA Framework Contract No EEA/IEA/09/003; European Environment Agency: Copenhagen, Denmark, 2013. [Google Scholar]
- European Commission. Guidance Document no 5. Transitional and Coastal Waters—Typology, Reference Conditions and Classification Systems. Common Implementation Strategy for the Water Framework Directive (2000/60/EC); European Commission: Brussels, Belgium, 2003. [Google Scholar]
- Schiewer, U. Ecology of Baltic Coastal Waters; Ulrich, S., Ed.; Springer: New York, NY, USA, 2008; ISBN 9780874216561. [Google Scholar]
- Fey, D.; Lejk, A.; Margonski, P.; Szymanek, L.; Psuty, I.; Nermer, T.; Stybel, N.; Hiller, A.; Laak, M.; Lempe, F.; et al. HERRING—Impact Report; World Maritime University: Malmö, Sweden, 2014. [Google Scholar]
- Lass, H.U.; Mohrholz, V.; Seifert, T. On the dynamics of the Pomeranian Bight. Cont. Shelf Res. 2001, 21, 1237–1261. [Google Scholar] [CrossRef]
- Schwarzer, K.; Diesing, M.; Larson, M.; Niedermeyer, R.-O.; Schumacher, W.; Furmanczyk, K. Coastline evolution at different time scales—Examples from the Pomeranian Bight, southern Baltic Sea. Mar. Geol. 2003, 194, 79–101. [Google Scholar] [CrossRef]
- Stock, A. Satellite mapping of Baltic Sea Secchi depth with multiple regression models. Int. J. Appl. Earth Obs. Geoinf. 2015, 40, 55–64. [Google Scholar] [CrossRef]
- Hoffmann, G.; Lampe, R. Sediment budget calculation to estimate Holocene coastal changes on the southwest Baltic Sea (Germany). Mar. Geol. 2007, 243, 143–156. [Google Scholar] [CrossRef]
- Townsend, M.; Davies, K.; Hanley, N.; Hewitt, J.E.; Lundquist, C.J.; Lohrer, A.M. The Challenge of Implementing the Marine Ecosystem Service Concept. Front. Mar. Sci. 2018, 5, 1–13. [Google Scholar] [CrossRef]
- Friedland, R.; Buer, A.-L.; Dahlke, S.; Schernewski, G. Spatial Effects of Different Zebra Mussel Farming Strategies in an Eutrophic Baltic Lagoon. Front. Environ. Sci. 2019, 6, 158. [Google Scholar] [CrossRef]
- Humborg, C.; Fennel, K.; Pastuszak, M.; Fennel, W. A box model approach for a long-term assessment of estuarine eutrophication, Szczecin lagoon, southern Baltic. J. Mar. Syst. 2000, 25, 387–403. [Google Scholar] [CrossRef]
- Wolnomiejski, N.; Witek, Z. The Szczecin Lagoon Ecosystem: The Biotic Community of the Great Lagoon and Its Food Web Model; De Gruyter: London, UK, 2013; ISBN 9788376560489. [Google Scholar]
- Schernewski, G.; Wielgat, M. Eutrophication of the shallow szczecin lagoon (baltic sea): Modelling, management and the impact of weather. Environ. Stud. 2001, 58. [Google Scholar] [CrossRef]
- Schernewski, G.; Neumann, T.; Podsetchine, V.; Siegel, H. Spatial impact of the Oder river plume on water quality along the south-western Baltic coast. Int. J. Hyg. Environ. Health 2001, 204, 143–155. [Google Scholar] [CrossRef]
- Munkes, B. Eutrophication, phase shift, the delay and the potential return in the Greifswalder Bodden, Baltic Sea. Aquat. Sci. 2005, 67, 372–381. [Google Scholar] [CrossRef]
- Schiewer, U.; Schernewski, G. Self-purification capacity and management of Baltic coastal ecosystems. J. Coast. Conserv. 2004, 10, 25–32. [Google Scholar] [CrossRef]
- Schernewski, G.; Friedland, R.; Carstens, M.; Hirt, U.; Leujak, W.; Nausch, G.; Neumann, T.; Petenati, T.; Sagert, S.; Wasmund, N.; et al. Implementation of European marine policy: New water quality targets for German Baltic waters. Mar. Policy 2015, 51, 305–321. [Google Scholar] [CrossRef]
- Pastuszak, M.; Nagel, K.; Nausch, G. Variability in nutrient distribution in the Pomeranian Bay in September 1993. Oceanologia 1996, 38, 195–225. [Google Scholar]
- Conley, D.J.; Carstensen, J.; Aigars, J.; Axe, P.; Bonsdorff, E.; Eremina, T.; Haahti, B.-M.; Humborg, C.; Jonsson, P.; Kotta, J.; et al. Hypoxia Is Increasing in the Coastal Zone of the Baltic Sea. Environ. Sci. Technol. 2011, 45, 6777–6783. [Google Scholar] [CrossRef]
- Stybel, N.; Kleissler, K.; Schulz, N.; Piotr, G. Fisheries management in the Sczecin Lagoon. In Fisheries Management in Coastal Waters of the Baltic Sea—AQUAFIMA Results of the Szczecin Lagoon, Vistula Lagoon, Curonian Lagoon and Gulf of Riga; Stybel, S., Ed.; Coastline Reports 22; EUCC-D: Rostock-Warnemünde, Germany, 2014. [Google Scholar]
- Radziejewska, T.; Schernewski, G. The Szczecin (Oder-) Lagoon. In Ecology of Baltic Coastal Waters; Schiewer, U., Ed.; Springer: Berlin/Heidelberg, Germany, 2008; pp. 115–129. ISBN 978-3-540-73524-3. [Google Scholar]
- Raillard, S. Die See- und Kuestenfischerei Mecklenburgs und Vorpommerns 1918 bis 1960: Traditionelles Gewerbe unter Oekonomischem und Politischem Wandlungsdruck. Veroeffentlichungen zur SBZ-/DDR-Forschung im Institut fur Zeitgeschichte; Oldenbourg: Munchen, Germany, 2012; ISBN 97834867140813486714082. [Google Scholar]
- Geneletti, D.; Scolozzi, R.; Adem Esmail, B. Assessing ecosystem services and biodiversity tradeoffs across agricultural landscapes in a mountain region. Int. J. Biodivers. Sci. Ecosyst. Serv. Manag. 2018, 14, 188–208. [Google Scholar] [CrossRef]
- Grizzetti, B.; Liquete, C.; Pistocchi, A.; Vigiak, O.; Zulian, G.; Bouraoui, F.; De Roo, A.; Cardoso, A.C. Relationship between ecological condition and ecosystem services in European rivers, lakes and coastal waters. Sci. Total Environ. 2019, 671, 452–465. [Google Scholar] [CrossRef]
- Maes, J.; Liquete, C.; Teller, A.; Erhard, M.; Paracchini, M.L.; Barredo, J.I.; Grizzetti, B.; Cardoso, A.; Somma, F.; Petersen, J.E.; et al. An indicator framework for assessing ecosystem services in support of the EU Biodiversity Strategy to 2020. Ecosyst. Serv. 2016, 17, 14–23. [Google Scholar] [CrossRef]
- La Notte, A.; D’Amato, D.; Mäkinen, H.; Paracchini, M.L.; Liquete, C.; Egoh, B.; Geneletti, D.; Crossman, N.D. Ecosystem services classification: A systems ecology perspective of the cascade framework. Ecol. Indic. 2017, 74, 392–402. [Google Scholar] [CrossRef]
- Haines-Young, R.; Potschin, M. Common International Classification of Ecosystem Services (CICES) V5.1 and Guidance on the Application of the Revised Structure; Fabis Consulting Ltd.: Nottinghamshire, UK, 2018. [Google Scholar]
- Campagne, C.S.; Roche, P.; Gosselin, F.; Tschanz, L.; Tatoni, T. Expert-based ecosystem services capacity matrices: Dealing with scoring variability. Ecol. Indic. 2017, 79, 63–72. [Google Scholar] [CrossRef]
- Burkhard, B.; Kroll, F.; Nedkov, S.; Müller, F. Mapping ecosystem service supply, demand and budgets. Ecol. Indic. 2012, 21, 17–29. [Google Scholar] [CrossRef]
- Saarikoski, H.; Primmer, E.; Saarela, S.-R.; Antunes, P.; Aszalós, R.; Baró, F.; Berry, P.; Blanko, G.G.; Goméz-Baggethun, E.; Carvalho, L.; et al. Institutional challenges in putting ecosystem service knowledge in practice. Ecosyst. Serv. 2018, 29, 579–598. [Google Scholar] [CrossRef]
- Busch, M.; La Notte, A.; Laporte, V.; Erhard, M. Potentials of quantitative and qualitative approaches to assessing ecosystem services. Ecol. Indic. 2012, 21, 89–103. [Google Scholar] [CrossRef]
- Liquete, C.; Piroddi, C.; Drakou, E.G.; Gurney, L.; Katsanevakis, S.; Charef, A.; Egoh, B. Current Status and Future Prospects for the Assessment of Marine and Coastal Ecosystem Services: A Systematic Review. PLoS ONE 2013, 8, e67737. [Google Scholar] [CrossRef]
- Newton, A.; Brito, A.C.; Icely, J.D.; Derolez, V.; Clara, I.; Angus, S.; Schernewski, G.; Inácio, M.; Lillebø, A.I.; Sousa, A.I.; et al. Assessing, quantifying and valuing the ecosystem services of coastal lagoons. J. Nat. Conserv. 2018, 44, 50–65. [Google Scholar] [CrossRef]
- Plieninger, T.; Draux, H.; Fagerholm, N.; Bieling, C.; Bürgi, M.; Kizos, T.; Kuemmerle, T.; Primdahl, J.; Verburg, P.H. The driving forces of landscape change in Europe: A systematic review of the evidence. Land Use Policy 2016, 57, 204–214. [Google Scholar] [CrossRef]
- Jiang, M.; Bullock, J.M.; Hooftman, D.A.P. Mapping ecosystem service and biodiversity changes over 70 years in a rural English county. J. Appl. Ecol. 2013, 50, 841–850. [Google Scholar] [CrossRef]
- Thiagarajah, J.; Wong, S.K.M.; Richards, D.R.; Friess, D.A. Historical and contemporary cultural ecosystem service values in the rapidly urbanizing city state of Singapore. Ambio 2015, 44, 666–677. [Google Scholar] [CrossRef]
- European Commission. Council Directive 92/43/EEC of 21 May 1992 on the Conservation of Natural Habitats and of Wild Fauna and Flora; European Commission: Brussels, Belgium, 1992. [Google Scholar]
- Bastian, O. The role of biodiversity in supporting ecosystem services in Natura 2000 sites. Ecol. Indic. 2013, 24, 12–22. [Google Scholar] [CrossRef]
Figure 1.
Location of the study area of all MESAT case studies. This study comprises the first assessment of Greifswald Bay (3) and Pomeranian Bay (4).
Figure 1.
Location of the study area of all MESAT case studies. This study comprises the first assessment of Greifswald Bay (3) and Pomeranian Bay (4).

Figure 2.
Ecosystem Services assessment of the two case studies for the Provisioning section. The circle represents the hierarchical organization of Common International Classification on Ecosystem Services (CICES), using the aggregation method based on reliability. The outer ring represents the indicators used: grey color means the indicator was used and white color that the indicator was not used. The second, third, fourth and fifth circle represent classes, groups, divisions and sections of ecosystem services (ES) respectively. Green and red shades represent an increase or decrease in services provision, respectively. Blue color represents a no change in services provision. P—provisioning services.

Figure 3.
Ecosystem Services assessment of the two case studies for the Regulating and Maintenance section. The circle represents the hierarchical organization of CICES, using the aggregation method based on reliability. The outer ring represents the indicators used: grey color means the indicator was used and white color that the indicator was not used. The second, third, fourth and fifth circle represent classes, groups, divisions and sections of ES respectively. Green and red shades represent an increase or decrease in services provision, respectively. Blue color represents a no change in services provision. RM—Regulating and Maintenance services.

Figure 4.
Ecosystem Services assessment of the two case studies for the cultural section. The circle represents the hierarchical organization of CICES, using the aggregation method based on reliability. The outer ring represents the indicators used: grey color means the indicator was used and white color that the indicator was not used. The second, third, fourth and fifth circle represent classes, groups, divisions and sections of ES respectively. Green and red shades represent an increase or decrease in services provision, respectively. Blue color represents a no change in services provision. C—cultural services.

Figure 5.
Aggregated results to section for the Szczecin Lagoon, Greifswald Bay and Pomeranian Bay CC—Category of change (based on the aggregation by reliability): 0 (blue) —no change; −1 to −5 (shades of red) —decrease in services provision; 1 to 5 (shades of green) —increase in services provision.

Table 1.
Classification used in the Marine Ecosystem Services Assessment Tool (MESAT) approach, modified from Inácio et al. [23]. P—provisioning, RM—regulating and maintenance, C—cultural.
Table 1.
Classification used in the Marine Ecosystem Services Assessment Tool (MESAT) approach, modified from Inácio et al. [23]. P—provisioning, RM—regulating and maintenance, C—cultural.
| Section | Division | Group | Class |
|---|---|---|---|
| Provisioning Services | Nutrition | Biomass | P1. Wild plants, algae and their outputs |
| P2. Wild animals and their outputs | |||
| P3. Animals from in situ aquaculture | |||
| P4. Plants and algae from in situ aquaculture | |||
| Water | P5. Surface water for drinking purposes | ||
| Biomass | Biomass | P6. Fibers and other materials from plants, algae and animals for direct use or processing | |
| P7. Materials from plants, algae and animals for agriculture | |||
| Water | P8. Surface water for non-drinking purposes | ||
| Energy | Biomass-based energy resources | P9. Plant-based resources | |
| P10. Animal-based resources | |||
| Regulating and Maintenance Services | Mediation of waste, toxins and other nuisances | Mediation by ecosystems | RM1. Filtration/sequestration/storage/accumulation by ecosystems |
| RM2. Dilution by the atmosphere, freshwater and marine ecosystems | |||
| Mediation of Flows | Mass flows | RM3. Mass stabilization and control of erosion rates | |
| RM4. Buffering and attenuation of mass flows | |||
| Liquid Flows | RM5. Flood protection | ||
| Maintenance of physical, chemical, biological conditions | Lifecycle maintenance, habitat and gene pool protection | RM6. Maintaining nursery populations and habitats | |
| Pest and disease control | RM7. Pest and disease control | ||
| Soil formation and composition | RM8. Decomposition and fixing processes | ||
| Water conditions | RM9. Chemical condition of salt waters | ||
| Atmospheric composition and climate regulation | RM10. Global climate regulation by reduction of greenhouse gas concentrations | ||
| RM11. Micro and regional climate regulation | |||
| Cultural Services | Physical and Intellectual interactions with biota, ecosystems, and land-/seascapes [environmental settings] | Physical and experiential interactions | C1. Experiential use of plants, animals and land-/seascapes in different environmental settings |
| C2. Physical use of land-/seascapes in different environmental settings | |||
| Intellectual and representative interactions | C3. Scientific and educational | ||
| C4. Heritage, cultural | |||
| C5. Entertainment | |||
| C6. Aesthetic | |||
| Spiritual, symbolic and other interactions with biota, ecosystems, and land-/seascapes | Spiritual and/or emblematic | C7. Symbolic | |
| C8. Sacred and/or religious | |||
| Other cultural outputs | C9. Existence | ||
| C10. Bequest |
Table 2.
Environmental characteristics of the case studies. The values and information were extracted from References [27,28,29,30,31,32]. a Area of the German part of the Pomeranian Bay. b Data product “OSITAC-L3S-merged_sensors-CMEMS-v1.3” downloaded from http://marine.copernicus.eu at 26 February 2019. The WFD typology defines B2 as mesohaline inner coastal waters and B3 as mesohaline outer coastal waters, characterized by 5–18 PSU, no tidal range, high sheltered location and days to months of retention time.
| Greifswald Bay | Pomeranian Bay | |
|---|---|---|
| Classification | bay | open coastal waters |
| Connections to the sea | multiple | - |
| Area (km2) | 514 | 5580 (a 2840) |
| Volume (106 m3) | 2906 | 7360 |
| Catchment area (km2) | 665 | - |
| Depth (mean) | 5.8 | 14 |
| Salinity (PSU) | 5 to 7 | 7 to 8 |
| Retention time (days) | 36 | <30 |
| WFD Typology | B2 | B3 |
| Temperature (°C) | 3 to 25 | b −1 to 25 (mean SST 11.5 to 13.5) |
| Ice-covered days | 50 | - |
| Area/Catchment relation | 0.772 | - |
| Water exchange rate (a−1) | 0.10 | - |
| Secchi depth (m) | 2 to 6.5 | 1 to 7 |
| Trophic level | Mesotrophic/eutrophic | Mesotrophic/eutrophic |
Table 3.
Anthropogenic characteristics of the case studies. The information was extracted from References [29,30,31].
| Greifswald Bay | The Greifswald Bay is located in Northeastern Germany, in the state of Mecklenburg Western Pomerania. The area around the bay is marked by a strong maritime culture, historically due to the enrollment of its biggest city, Greifswald, in the Hanseatic League. The main historical trading good was herring. The bay is one of the most important herring spawning grounds in the Baltic Sea, imprinting the importance of fisheries. Fisheries as a sector has declined since the 1960s, due to socio-economic reasons but also because the amount of fish has decreased since then. Tourism took its place as the main economic activity in the area. Today many events take place in the bay or connected to it. Water-related activities and recreational fisheries are one of the main uses occurring in the bay. The increase in tourism has also been connected to the political situation in the area, as in the 1960s Greifswald Bay was part of the German Democratic Republic (GDR). After 1989, there was much more “freedom” for development. |
| Pomeranian Bay | The Pomeranian Bay, also known as Pomeranian Bight or Oder Bight, is a typical coastal basin shared by Germany and Poland. The Bay is, in fact, an open coastal water body. In the north, the bay is “delineated” by a natural 20 m depth contour and in the south delineated by an extensive coastline from Ruegen (Germany) and stretching to Poland. The coastline bordering the bay is a touristic hotspot in Germany. The famous islands of Ruegen and Usedom attract many tourists for its natural sandy beaches and scenic landscape. Sailing, kite surfing, kayaking and bathing are very popular all along the coast. Tourism is the most important supporting economic activity. Already in the 1960s tourism was important, however because, the region was under the GDR, many activities were not allowed. After 1989, tourism collapsed first, followed by a steady increase due to more freedom for socio-economic development. Fisheries is another important economic activity in the area since an important fishing ground (Oder Bank) is located within the bay. Other important uses in the area include maritime transportation and marine wind farms. |
Table 4.
Assessment of ES provision changes for Provisioning, Regulating and Maintenance and Cultural section at the class level for all MESAT case studies: Sc—Schlei Estuary; Wn—Warnow Estuary; Sz—Szczecin Lagoon; Gr—Greifswald Bay; Pr—Pomeranian Bay; Cn—Curonian Lagoon. Categories of change (CC) (based on the aggregation by reliability and for Curonian Lagoon aggregation by number): 0 (white) —no change; −1 to −5 (shades of red) —decrease in services provision; 1 to 5 (shades of green) —increase in services provision; grey color—no data/not considered. P—Provisioning services; RM–Regulating and Maintenance services; C—Cultural services.
| Sc | Wn | Sz | Gr | Pr | Cn | |
|---|---|---|---|---|---|---|
| P1. Wild plants, algae and their outputs | −2 | −2 | ||||
| P2. Wild animals and their outputs | 3 | −2 | −3 | −3 | 1 | −3 |
| P3. Animals from in situ aquaculture | −1 | |||||
| P4. Plants and algae from (…) aquaculture | ||||||
| P5. Surface water for drinking purposes | ||||||
| P6. Fibers and other materials from plants (…) | −5 | 0 | 0 | |||
| P7. Materials from plants, algae (…) | 0 | −2 | ||||
| P8. Surface water for non-drinking purposes | 0 | −1 | ||||
| P9. Plant-based resources | 2 | |||||
| P10. Animal-based resources | −2 | |||||
| RM1. Filtration/sequestration/storage (…) | −2 | −3 | −2 | 0 | −1 | 1 |
| RM2. Dilution by (…) marine ecosystems | 0 | 5 | 0 | 0 | 0 | 0 |
| RM3. Mass stabilization and control (…) | 3 | −3 | −4 | −5 | 0 | 1 |
| RM4. Buffering and attenuation of (…) | 0 | 0 | 0 | 1 | ||
| RM5. Flood protection | 0 | −1 | −1 | 0 | −1 | 0 |
| RM6. Maintaining nursery populations (…) | 2 | 0 | −1 | 1 | 1 | 2 |
| RM7. Pest and disease control | −1 | 1 | −2 | 0 | −2 | 0 |
| RM8. Decomposition and fixing processes | 0 | 1 | 0 | 0 | 0 | −1 |
| RM9. Chemical conditions of salt water | 0 | 2 | −1 | 0 | 0 | 1 |
| RM10. Global climate regulation (…) | 1 | 0 | 0 | 1 | 0 | 1 |
| RM11. Micro and regional climate (…) | 0 | −1 | 0 | 0 | 0 | 1 |
| C1. Experiential use of plants (…) | 5 | 3 | 0 | 3 | 5 | 3 |
| C2. Physical use of seascapes (…) | 4 | 5 | 4 | 5 | 3 | 2 |
| C3. Scientific and educational | 3 | 5 | 5 | 5 | 5 | 2 |
| C4. Heritage, cultural | 5 | 5 | 4 | 2 | 5 | 3 |
| C5. Entertainment | 5 | 5 | 2 | 5 | 0 | 1 |
| C6. Aesthetic | 5 | 5 | 5 | 5 | 3 | 5 |
| C7. Symbolic | 5 | 5 | 4 | 5 | 4 | 1 |
| C8. Sacred and/or religious | 0 | −3 | 3 | 5 | 0 | 4 |
| C9. Existence | 0 | 0 | 0 | 0 | 5 | 3 |
| C10. Bequest | 5 | 5 | 5 | 5 | 4 |
© 2019 by the authors. Licensee MDPI, Basel, Switzerland. This article is an open access article distributed under the terms and conditions of the Creative Commons Attribution (CC BY) license (http://creativecommons.org/licenses/by/4.0/).
Share and Cite
MDPI and ACS Style
Inácio, M.; Schernewski, G.; Pliatsika, D.A.; Benz, J.; Friedland, R. Assessing Changes in Ecosystem Services Provision in Coastal Waters. Sustainability 2019, 11, 2632. https://doi.org/10.3390/su11092632
AMA Style
Inácio M, Schernewski G, Pliatsika DA, Benz J, Friedland R. Assessing Changes in Ecosystem Services Provision in Coastal Waters. Sustainability. 2019; 11(9):2632. https://doi.org/10.3390/su11092632
Chicago/Turabian StyleInácio, Miguel, Gerald Schernewski, Dimitra Alkisti Pliatsika, Juliane Benz, and René Friedland. 2019. "Assessing Changes in Ecosystem Services Provision in Coastal Waters" Sustainability 11, no. 9: 2632. https://doi.org/10.3390/su11092632
Note that from the first issue of 2016, this journal uses article numbers instead of page numbers. See further details here.