A Neutrosophic AHP and TOPSIS Framework for Supply Chain Risk Assessment in Automotive Industry of Pakistan


1
School of Economics and Management, Taiyuan University of Technology, Taiyuan 030000, China
2
Department of Business Administration, Ghazi University, D.G. Khan 32200, Pakistan
*
Author to whom correspondence should be addressed.
Sustainability 2020, 12(1), 154; https://doi.org/10.3390/su12010154
Submission received: 20 November 2019
/
Revised: 13 December 2019
/
Accepted: 20 December 2019
/
Published: 24 December 2019
(This article belongs to the Special Issue Supply Chain Risk Management)
Abstract
:Risk is inherent in all parts of life and brings consequences, but when it specifically emerges in supply chains, it is susceptible. Therefore, this study aims at identifying and assessing supply chain risks and developing criteria for managing these risks. Supply chain (SC) risks consist of complex, uncertain, and vague information, but risk assessment techniques in the literature have been unable to handle complexity, uncertainty, and vagueness. Therefore, this study presents a holistic approach to supply chain risk management. In this paper, neutrosophic (N) theory is merged with the analytic hierarchy process (AHP) and technique for order of preference by similarity to ideal solution (TOPSIS) to deal with complexity, uncertainty, and vagueness. Then the proposed methodology is practically implemented through a case study on the automotive industry. SC resilience, SC agility, and SC robustness were selected as criteria for managing supply chain risks and analyzed using N-AHP. Furthermore, seventeen risks were identified and assessed by using N-TOPSIS. Results suggest supply chain resilience is the most important criterion for managing supply chain risks. Moreover, supplier delivery delays, supplier quality problems, supplier communication failures, and forecasting errors are the most vulnerable risks that occur in supply chains of the automotive industry in Pakistan.
Keywords:
agility; AHP; neutrosophic theory; TOPSIS; resilience; robustness; supply chain risk management1. Introduction
Risk is inherent in almost all the phases of life, but when it comes to business, they are more vulnerable due to changing trends, globalization, complexity, and competitiveness of the firms [1,2,3,4,5]. Changes in demand, uncertain supply, cost savings, and implementing agile or lean structures increase the probability of risks [6,7]. Whatever the reason it would be, the firm’s supply chain (SC) is exposed to numerous risks, which create disruptions. If these disruptions are not treated in a timely manner, they affect the firm’s performance [8]. Supply chain disruptions (SCDs) can occur upstream and downstream of the supply chain or can be internal and external: supplier delivery delays, supplier insolvency, fluctuations in demand or estimation errors, natural disasters like hurricanes, floods, earthquakes, fires, etc. [3,9]. Recently, there have been many cases of SCDs, such as supply issues for one of the major suppliers for Boeing, which delayed the inauguration of their new model Boeing 787 [10]. The tensions between Japan and China (recently) have created demand disruptions for Japanese commodities and vehicles [11]. The Fukushima earthquake occurred in Japan in 2016, and it disrupted the supply for different parts to Toyota. As a result, 26 plants were shut down, and profits declined by 276.15 million USD [12].
Managing supply chain risks (SCRs) are especially crucial to the supply chains of the automotive industry, as they depend on lean and just-in-time practices for their complex supply chain network, which leads to high vulnerabilities of SCDs [4,13]. JLT insurance published a report about disruptions in American automotive supply chains in 2018, which produced an increase of 30% SCDs in the American automotive industry [14]. SCRs have enormous effects on the firm’s performance. Therefore, it is necessary to develop strategies appropriate for coping with SCRs and maintaining the firm’s performance level [15,16]. Adequate risk-mitigation strategies help firms in identifying, assessing, measuring, monitoring, and controlling SCRs [17]. Previous studies focusing on managing SCRs suggest that operational practices, strategic practices, or redundancy practices effectively cope with SCRs [15,18,19]. Practices for managing SCRs can be categorized as SC resilience, SC agility, and SC robustness [20,21,22,23]. The previous literature suggests that these three practices are followed when SCR mitigation strategies are developed [3,20,24,25,26,27,28,29].
SC resilience is a broader concept and is well-known for its adaptive characteristics and capabilities to deal with disruptive situations. SC resilience has three dimensions, alertness, preparedness, and flexibility, which are also known as its capabilities [30]. SC agility deals with disruptive situations quickly and tries to get back to its natural position as soon as possible, through its reactive ability to cope with changes, causing minimum or zero damage [21,31]. Both SC resilience and SC agility are reactive approaches for managing SCRs. SC agility refers to reaction speed and quickness to changing situations, while SC resilience deals with the situation in mature and steady manners [11]. Alternatively, SC robustness is a proactive approach that deals with risks through a reduction in complex organization structures, complex processes, maintaining excess resources, and developing more stable processes that resist SCRs [32,33,34]. Among SCR mitigation strategies based on SC resilience, SC agility, and SC robustness, previous studies have frequently cited an increase in capacity, increase in responsiveness, increase in flexibility, aggregate demand, increase in capability, redundant supplier, increase in inventory, and postponement [17,25,35].
Although the previous literature suggests the importance of SC resilience, SC agility, and SC robustness for managing SCRs [8,28,36], it has surprisingly treated them separately and lacks in clarifying their context to different situations and applicability. The previous literature is insufficient in explaining which practice to use in handling which type of risk. What is the most important criterion or practice among these? Implementing each practice and developing strategies for risk mitigation cost firms in many ways. Therefore, it is essential to clarify the use and applicability of each practice in managing SCRs. While quantifying SCRs, the critical questions for supply chain managers are as follows: Which are the essential criteria for managing supply chain risks? Which are the preferable risk mitigation strategies in different situations? Which are the most favorable risk assessment techniques? For each condition, which is the best criterion?
The conventional approaches for assessing and managing SCRs are unable to deal with the above questions. They cannot describe which risk has the most vulnerable effects on the firm’s supply chain and performance? Which practice/criteria can deal with which type of risk? Which strategies can be developed following the criteria for managing SCRs? Therefore, to investigate the most crucial practices/criteria among SC resilience, SC agility, and SC robustness for managing SCRs, we developed a holistic approach for managing SCRs based on multi-criteria decision-making (MCDM) approach. Neutrosophic logic is adopted due to its ability to deal with incompleteness, vagueness, and uncertainty. Smarandache introduced neutrosophic theory in 1995 which was advanced by the fuzzy theory and fuzzy intuitionistic theory [37]. Apart from the similarity of triangular numbers, with fuzzy theory, neutrosophic sets are classified based on the degree of truthiness, falsity, and indeterminacy [38]. To achieve research objectives, we adopted the neutrosophic theory and merged it with the analytic hierarchy process (AHP) and technique for order preference, by matching similarity to the ideal solution (TOPSIS).
Hence, this study aims at answering the following questions:
- What are the most important criteria/practices for managing SCRs in the automotive industry?
- Under which condition, what criteria perform better?
- Which are the most vulnerable SCRs in the automotive industry?
We developed a model based on the neutrosophic theory for assessing SCRs and evaluating the most essential practices/criteria for managing SCRs in the automotive industry. In particular, the model evaluates criteria based on scores from decision-makers’ judgments and ranks the most important criteria. Moreover, different risks are classified from the supply chain risk literature, assessed through expert scores, and ranked based on their scores and relevant criteria.
This paper contributes to the literature in multiple ways. First, there is a lack of research providing guidance to the managers to identify strategies for managing SCRs under the criteria of SC resilience, SC agility, and SC robustness. Therefore, this study fulfills this gap by identifying the most important criteria for developing strategies and managing SCRs. Second, this study ranks the most vulnerable SCRs according to their degree of harmfulness and relative criteria for supply chain risk management (SCRM). Third, according to the author’s knowledge, there is no previous evidence of any study related to SCR assessment in the automotive industry of Pakistan. Therefore, this study fills the gap in the literature and has practical and managerial implications for SC managers and firms in the automotive industry of Pakistan.
The remainder of the paper is as follows. The next section provides the literature review about SCRs, SCRM, and SCRM practices and gives overview of risk assessment methods. Section 3 deals with methodology and provides the information about neutrosophic logic and application of N-AHP, and N-TOPIS. Section 4 presents the practical implementation of the proposed methodology through a case study of the automotive industry in Pakistan. Finally, the conclusion is presented in Section 5, which also provides practical and managerial implications and study limitations.
2. Literature Review
This section contains the theoretical background of constructs and models used in this study, such as supply chain risks, criteria for managing supply chain risks, risk mitigation strategies, neutrosophic-AHP, and neutrosophic-TOPSIS. Based on the previous literature, research gaps are identified and methodology is proposed to fill these gaps.
2.1. Supply Chain Risk
Risk has three essential elements, which are loss, significance, and chances of occurrence [22]. What should be done about a risk depends on its attributes; the options are to accept, avoid, or mitigate. Risk is defined as the “likelihood of loss and the significance of that loss to the organization or individual” [39]. SCR has gained much consideration in recent years, and different studies [40,41,42,43] have presented the definition of SCR, but, they are dissimilar and depend on different situations and scenarios, and their applicability is limited in SCRM. However, there are few studies [6,41,42,44,45] which are considered the backbone of the SCR literature; definitions and classification of the SCRs presented by them are useful for the firms.
Zidisin stated that “SCR is the probability of an incident associated with inbound supply from an individual supplier failure or the supply market occurring, in which its outcomes result in the inability of the purchasing firm to meet the customers demand or causes threats to the customer’s life and safety” [44]. Juttner defined supply chain risk as “variation in the distribution of possible supply chain outcomes, their likelihood, and their subjective values” [42]. Moreover, Lavastre et al. defined SCR as follows: “Those small events and incidents that happen to one or several parts in the supply chain and affect the whole supply chain negatively and restricts in achieving organizational goals” [6]. Alternatively, Prakash et al. stated that “SCR is the potential occurrence of an incident or failure to seize opportunities in the Supply chain in which its outcomes result in a financial loss for the firm” [46].
Although previous researchers have presented definitions of SCR according to the context and nature of the study, there are still some similarities between them. Most of the researchers have classified SCR into two categories, internal SCR and external SCR [47]. Others [48,49,50,51] divided SCR into three groups: risk internal to supply chain, risk external to supply chain, and risk internal to firm but external to supply chain. The study of Chopra and Sodhi [1] proposed nine sources for SCRs: disruptions, forecast, delays, intellectual property, systems, receivables, capacity, inventory, and procurement. This classification is more comprehensive, as it contains all the operational levels in nine categories and elaborates the internal risks more precisely [1].
Moreover, Thun et al. categorized internal supply chain risks into two categories, internal company risks and cross-company-based risks. Internal risks are those which arise due to the internal settings of a company, while cross-company risks occur due to the noncooperation of supply chain partners and are outside the control of the focal company. It is also empirically proven that internal risks arise more frequently and affect the firm’s day-to-day operations [52]. In contrast, external risks do not occur as regularly, but their impact on the firm is more severe compared to internal SCRs. According to Manuj and Mentzer, internal supply chain risks should gain the primary attention of the supply chain managers, to mitigate risks and timely avoid supply chain disruption [53].
The literature on SCR investigated two comprehensive issues, which are the background and sources of SCRs, and the impact and management of SCRs [54]. SCRs may come up from multiple sources [9], such as regulatory changes, customer or supplier side [55], issues related to labor (such as strikes) [56], logistic providers, forecasting errors [55], machine breakdown, inventory shortage, IT malfunctioning, natural disasters, terrorist attacks [4], and geopolitical risks [57]. Moreover, there is an increasing trend regarding the adoption of sustainability, which requires firms to become sustainable and apply techniques in compliance with ISO 14000/14001 [48]. Sustainability has three pillars: environmental, economic, and social, also known as triple bottom line (TBL) [58]. Sustainable firms have different operations, and they face various risks, such as sustainable suppliers risk, sustainable demand risk, sustainable manufacturing risk, green logistics and distribution, and noncompliance with environmental management system (EMS) [24]. These factors create complexity among organizations’ structure in achieving firms’ efficiency and increases their exposure to SCRs. The discussion on SCRs is not to one direction, as many elements trigger SCRs and can disturb a firm’s operations, which decreases SC and overall performance. Therefore, firms are required to develop a framework that helps in supply chain risk management. The authors have taken the automotive industry as a case study to implement the proposed methodology.
2.2. Managing Supply Chain Risks
Managing risks in the supply chain is essential in the automotive sector. Automotive supply chains involve more uncertainty compared to other industries’ supply chains due to their complex nature of business and structure. Previous studies on SCRM among automotive firms have explained different approaches and strategies which can be adopted for managing SCRs [4,46,57,59,60]. According to Thun et al. [4], there are two types of approaches for SCRM in the automotive industry: proactive and reactive. Proactive approaches are often cause-related, which lowers the chances of occurrence of SCRs. Reactive approaches are effect-oriented, which strive for decreasing the impact of SCRs. The selection of high-quality and high on-time delivery suppliers, supplier development, integration, and preventing measures for geopolitical risks are some proactive instruments. Multiple sourcing, safety stocks, and IT system backup are some reactive instruments [23,52,60].
Previous studies of SCRM have stated that improving flexibility and building redundancies can help in managing SCRs and creating supply chain resilience [15,18,19]. Redundancy is a measure that maintains excessive resources, such as excessive inventory, safety stocks, etc. [18,33,34,61]. On the other hand, flexibility is referred to as being a firm’s ability to react to the environmental changes that occur in the supply chain and handle these changes with little damage, less time, low cost, and high performance [31,62]. Flexibility is a broader term than redundancy and varies from context to context. Postponement is a highly effective SCRM strategy developed following SC flexibility [25]. Postponement refers to the delay in activities that allow firms to cope with the changing environment [63]. Carbonara and Pellegrino extended the postponement strategy in managing supply and demand-side risks [25].
Previous literature on SCRM has categorized SCRM practices as either resilient, agile, or robust [26,28,29,59,64,65,66,67]. A resilient supply chain is one that returns to its original state after getting disturbed [68]. While an agile supply chain refers to speed and quickness of recovering from the disruption in the supply chain [20,26,69]. On the other hand, a robust supply chain is one that stays functional during uncertainties and can withstand disruptions and maintain the original state [32,70]. Although the previous literature has shown the importance of SC resilience, SC agility, and SC robustness, it is astonishing that existing studies have treated them separately. None of them has discussed which is the most important criterion among the three concepts in managing SCRs. Therefore, to fill the research gap, this study aims at analyzing which is the most important criterion among three in managing SCRs. The following section discusses SC resilience, SC agility, and SC robustness in detail.
2.2.1. Supply Chain Resilience
Resilience is an old concept that has its roots in sociology, psychology, and biological systems but is still in the development stage. Different disciplines, such as ecology, politics, and risk management, have tried to extract their essence to use in their fields. Although resilience is used in different disciplines, the existing terminology and context of resilience are contradictory. As far as resilience in the management discipline is concerned, various scholars have endeavored to provide a clear impression of resilience [8,26,28,36,71,72]. Supply chain disruption is an area of concern for supply chain managers due to its high rate of occurrence and severe impact on the supply chain itself and firms as a whole [73]. For minimizing the effects of SCRs, supply chains should be prepared to respond in a timely manner and return to the original state after SCDs have occurred. Therefore, firms pursue accelerating recovery or avoiding the SCRs, through developing supply chain resilience [74].
Supply chain resilience deals with various kinds of SCRs at different levels of the supply chain during the SCRM process. Therefore, SC resilience is a critical element for managing SCRs [75]. Ponomarove presented a comprehensive definition of SC resilience: SC resilience is “adaptive capability of the supply chain to prepare for unexpected events, respond to disruptions, and recover from them by maintaining continuity of operations at the desired level of connectedness and control over structure and function”. According to the definition, it seems that SC resilience has a two-way effect. On the one hand, it works as a proactive approach in SCRM due to its capability of avoiding SCDs; on the other hand, it works as a reactive approach in SCRM due to its capability of restoring the supply chain to its original state [74].
2.2.2. Supply Chain Agility
The concept of agility in the organization has gained popularity over the past few decades, but the concept of supply chain agility was termed by Christopher [76] and Lee [35]. Yusuf et al. [69] proposed that SC agility enhances a firm’s competitive advantage through its capabilities of managing uncertainties and improving SC performance. Different researchers [23,66,67,76,77] have presented the definition of SC agility, but Swafford et al. provided a comprehensive definition of SC agility: “SC agility is the capability of the supply chain to adapt or respond quickly to the dynamic and unpredictable business environment” [66]. SC agility is a reactive approach to managing SCRs [20]. SC agility is mostly misunderstood and is mistakenly interchanged with similar concepts, such as flexibility, adaptability, resilience, etc. [78]. Flexibility is known as the capacity to handle an uncertain situation, which is one characteristic of SC agility. On the other hand, adaptability denotes the capability to adapt to the uncertainty in it, which is also a characteristic of SC agility.
While SC resilience is another concept, both SC resilience and SC agility are reactive approaches in SCRM. SC agility responds quickly to uncertain situations and tries to get back to the original state as soon as possible. Due to its quickness and rapid solutions, firms try to be agile in their operations [54]. SC agility has different dimensions, such as demand responsiveness, customer responsiveness, supply responsiveness, supply chain integration, and joint planning. All these dimensions are key drivers of SCR mitigation and responding to market uncertainties [79]. SC agility has three levels; organizational level, capability level, and performance level [54]. At the organizational level, SC agility refers to the response to the changes in the needs of customers [80,81]. At the capability level, SC agility is about operational capabilities, such as integration amongst its supply chain partners to cope with uncertainties [27,82]. Performance-level SC agility refers to the outcomes and enhanced supply chain performance (SCP) [83].
2.2.3. Supply Chain Robustness
Firms’ supply chains are facing frequent disruptions from the last decade, and they need a system to cope with these disruptions. In this regard, researchers have come up with the concept of supply chain robustness, which deals with internal and external disruptions and maintains firms operations smoothly [64]. Weiland defined supply chain robustness as “the ability of a supply chain to resist change without adapting its initial stable configuration” [64]. The definition explains three concepts. First, SC robustness is proactive risk management practice. Second, it has ability to resist, which means it can cope with changing situations. Third, it has ability to avoid, which means it does not adapt to the changes resists them [29].
Moreover, SC robustness is about continuity in SC operations and resistance to supply chain disruptions [84]. In this stage, the supply chain does not need to adapt to the changes and resists the turbulence before they occur. Supply chains adopting this approach are known as robust supply chains [65]. Different researchers have different views about SC robustness. According to Tang and Christopher, the main characteristics of SC robustness are its physically stronger abilities to tackle disruption [3]. On the other hand, Dong proposed that redundancy is the main characteristic of SC robustness which can decrease supply chain vulnerabilities to complex and uncertain situations [85]. Monsotori distinguished SC robustness according to its types, such as SC robustness on a small and large scale, SC robustness on the global and local scale, SC robustness as active and passive, and SC robustness as operational and structural scales. Whatever the scale it is, SC robustness ability copes with internal and external SC disruptions and enhances SC performance [32].
2.3. Methods for Assessing and Managing Supply Chain Risks
The first and most crucial step in SCRM is SCR assessment. Risk assessment embraces three steps: risk identification, risk analysis, and risk evaluation [17]. Whether the risk is at an internal level, within the supply chain, or outside the supply chains, it should be identified, assessed, and managed [86]. Risk assessment provides managers with a better understanding of the uncertain situations, which helps in running operations smoothly through the implementation of proper mitigation strategy or management practice [87]. There are numerous techniques for supply chain risk assessment [51], which are classified as qualitative, quantitative, and hybrid risk assessment techniques [17].
The most used risk assessment techniques are qualitative techniques; these are used in the risk identification process. The most used qualitative methods in the literature are probability-impact matrix [4], failure mode and effect analysis (FMEA) [88], process–performance modeling [89], and empirical analysis [90].
On the other hand, quantitative techniques for risk assessment are based on analytical hierarchy and simulation methods. Several studies [91,92,93] have used analytical hierarchy methods in the supply chain context. The simulation technique is based on visualization, which deals with stochastic SCRs. Over the past few years, there has been a growing trend in using simulation techniques such as Monte Carlo simulation [94], discrete-event simulation (DES) [59,94], system dynamics (SD) [95], agent-based simulation (ABS) or multi-agent-based simulation (MAS) [50,96,97], and Petri nets [98].
Hybrid risk assessment techniques are based on the qualities of both qualitative and quantitative risk-assessment techniques. Hybrid techniques are useful in an uncertain situation where the information is vague and inconsistent [17]. The previously used hybrid techniques in SCR assessment are based on multi-criteria decision-making (MCDM) approaches, such as analytic hierarchy process (AHP) [99,100], fuzzy logic [101,102,103], fuzzy-AHP [46,55,99,104], fuzzy-TOPSIS [58,105], fuzzy interference system (FIS) [17], cluster analysis [106], and decision tree analysis (DTA) [107].
2.3.1. Multi-Criteria Decision-Making Approach
The multi-criteria decision-making approach is useful in a situation when there are different criteria present and are especially contradictory. Every criterion has its features, specifications, measurement units, and relative weights. It is possible to describe some features subjectively, while others can only be described numerically. Therefore, scientists developed the MCDM approach, which has evolved in the 1960s, and it can solve MCDM problems in dozens of different ways. During the 1990s, management issues have got the attention of MCDM approaches and they tend to increase rapidly [108]. Studies like [47,48,109] described the development stages and applicability of MCDM in the field of economics and management science, which demonstrates its advantages over the traditional approaches for complex and uncertain situations, such as uncertainty in the environment, supply chain disruptions, stakeholder preferences, contradictory criteria, etc. [108].
Previous studies on SCRM have widely used MCDM approaches, such as analytic hierarchy process (AHP) [99,100], fuzzy logic [101,102,103], fuzzy-AHP [46,55,99,104], fuzzy-TOPSIS [58,105], and fuzzy interference system (FIS) [17]. Although a number of MCDM techniques were applied in the previous studies, they are not free from drawbacks and limitations. Therefore, to deal with inconsistent, uncertain, and vague information in effective and efficient manners, the neutrosophic theory was developed by Smarandache in 1995. The theory is based on triangular numbers, like fuzzy theory, but has included the degree of membership, such as truthiness, indeterminacy, and falsity, which deal better with inconsistent, uncertain, and vague information. Therefore, in this study, we have combined neutrosophic logic with AHP and TOPSIS, which are MCDM approaches.
2.3.2. Neutrosophic AHP and TOPSIS
Multi-criteria decision-making is very useful in complex decision-making, where the information is vague, imprecise, and uncertain. There are many popular MCDM techniques based on fuzzy logic that can handle complex situations. Later, researchers felt that fuzzy sets were limited in their approach to MCDM. To cope with more complex situations, researchers like Smarandache introduced more advanced theory based on neutrosophic logic. Neutrosophic sets are classified based on the degree of truthiness, indeterminacy, and falsity [37]. Neutrosophic sets are in use for problem-solving from ways back, but the technique has merged with other techniques, such as AHP and TOPSIS recently [47].
AHP is an MCDM approach which was first proposed by Saaty in 1970; it is a widely used method for problem-solving and decision-making in complex situations, scenarios, and structures for designing and planning, forecasting, risk assessment, and measurements. AHP divides complex problems into criteria and sub-criteria, and then a pairwise comparison matrix is calculated, and weights are assigned to each criterion [110]. N-AHP is based on the Saaty AHP technique and integrates it into the neutrosophic sets proposed by Smarandache. In N-AHP neutrosophic scale is used to give preferences to the criteria, and neutrosophic numbers are utilized to indicate the relative preference of the criteria, sub-criteria, and alternatives. Afterward, crisp values are generated through conversion of neutrosophic numbers by the score function [38].
TOPSIS is an MCDM and order-preference technique that was developed in 1981 by Hwang and Yoon. The selected alternatives are based on the shortest distance to the best ideal solutions and the longest distance to the worst ideal solution. TOPSIS technique is widely used in the supply chain literature regarding supplier selection, risk assessment, ranking, and order preferences. In N-TOPSIS, the values are based on neutrosophic techniques and processes and neutrosophic numbers.
2.4. Motivation for This Study
Several reasons motivate this research work. First, although previous literature has shown the importance of SC resilience, SC agility, and SC robustness, surprisingly, the extant studies have treated them separately. None has discussed which is the essential criterion among the three concepts in managing SCRs. Second, there is a lack of research on SCRM which guides SC managers in identifying mitigation strategies based on these three principles/criteria and tells under which situation which criteria to follow while developing strategies. Third, there are various supply chain risks that affect SC performance. Assessing these risks helps SC managers in developing mitigation strategies. Therefore, to fill in the research gap, this study aims at analyzing the most important criteria among SC resilience, SC agility, and SC robustness in managing SCRs. This study also assesses the most vulnerable risks in the automotive industry of Pakistan.
Finally, since the existing qualitative, quantitative, and hybrid methods for managing risks in the supply chain are not excluded from drawbacks, it develops motivation for a more reliable method to deal with inconsistent and vague information. Qualitative techniques do not provide any mathematical expressions and are based on judgments that are inconsistent and vague. Quantitative techniques also have drawbacks, as they are dependent on the accuracy and range of the prescribed measurement scales. They lack in relating to qualitative techniques, which are the primary source of information for identification of risk. Moreover, quantitative methods are expensive and require more time and experience for accuracy. Hybrid techniques such as fuzzy logic and cluster analysis are based on subjective values and lack indeterminacy. Therefore, they also lack in handling inconsistent, uncertain, and vague information.
Therefore, to deal with inconsistent, uncertain, and vague information in effective and efficient manners, the neutrosophic theory was developed by Smarandache in 1995. The theory is based on triangular numbers, like the fuzzy theory, but has included the degree of membership, such as truthiness, indeterminacy, and falsity, which deal better with inconsistent, uncertain, and vague information. We combined neutrosophic logic with two MCDM approaches, AHP and TOPSIS, in this study as proposed by Abdel-Basset et al. [47].
3. Methodology
This section proposes a detailed methodology for SCR assessment and SCRM in the automotive industry through the incorporation of neutrosophic AHP and TOPSIS. Three crucial stages were performed in this study. First, experts in the field of the automotive industry, especially linked with supply chain operations, were contacted and asked to list all the risks they face in their supply chains. Second, we invited experts to list the criteria for risk assessment and management. Third, we requested experts to use a neutrosophic scale to give preferences to the criteria for managing supply chain risks and score each alternative. This process was finalized in almost 3 h, via questionnaires and personal interviews. Based on previous literature on SCRM and decisions of supply chain experts, this study proposes a research framework, which is shown in Figure 1.
3.1. Goal of the Study
Establish the goal of the study and define the criteria and alternatives for the hierarchal decision process (HDP).
3.2. Construct the Pairwise Comparison Matrix
To construct the pairwise comparison matrix for criteria and sub-criteria, we used the neutrosophic scale in Table 1. According to the experts, if the first criterion is equally preferable to the second criterion, then we add (1,1,1) in the comparison matrix. If the first criterion is strongly preferred to the latter, put (4,5,6) in the matrix. Alternatively, if the second criterion is strongly preferred to the first criterion than place it inversely in the matrix such as . Apart from triangular numbers, we should ask decision-makers to add the degree of truthiness, indeterminacy, and falsity. After adding these to the comparison matrix, it takes the following form [(4,5,6); 0.80,0.25,0.2], where 4 represents the lower value, 5 represents the medium value, and 6 represents the upper value of the triangular neutrosophic scale. Moreover, 0.80 represents the degree of truthiness, 0.25 represents the degree of indeterminacy, and 0.20 represents the degree of falsity.
3.3. Convert Neutrosophic Matrix into Crisp Matrix
The neutrosophic matrix can be transformed into a crisp matrix by the following score function:
where, , , and represents the lower, medium, and upper values of the neutrosophic triangular numbers. , , and represent the degree of truthiness, indeterminacy, and falsity. If there are more than one expert in the process, then the aggregate (mean) of all experts should be taken to construct the final matrix.
3.4. Calculate Weight for Criteria
Calculate weights for each criterion from the pairwise comparison matrix by dividing each cell with the total (sum) of its column.
3.5. Check Consistency of the Weighted Matrix
Consistency of the matrix based on the expert’s judgment should be checked. Consistency can be checked by dividing the consistency index (CI) to the random index (RI). Afterward, the obtained value should be less than 0.1.
3.6. Apply N-TOPSIS Technique for Risk Assessment
3.6.1. Construct the Decision Matrix
Use triangular neutrosophic numbers for the construction of the decision matrix through the comparison of each risk with specific criteria. If there are more than one expert in the process, then the aggregate (mean) of all experts should be taken to construct the final matrix. Later, convert it into the crisp matrix. Use Equations (1) and (2) to convert the matrix.
3.6.2. Normalize the Decision Matrix
Normalize the obtained decision matrix. The matrix consists of m number of risks and n criteria. With the help of the following equation, the normalized decision matrix can be obtained:
where, ; and .
3.6.3. Calculate Weighted Matrix
Calculate the weighted matrix by multiplying the criteria weights, wj, obtained from AHP normalized matrix, .
3.6.4. Calculate Positive Ideal and Negative Ideal Solutions
Positive ideal A+ and negative ideal A− solution should be calculated based on the following formulas:
3.6.5. Calculate Euclidean Distance
Euclidean distance is calculated among positive ideal solution and negative ideal solution through the following formulas:
3.6.6. Rank Alternatives
Once Euclidean distance is calculated, alternatives can be ranked through calculating the degree of closeness with the following formula. The largest number represents the highest rank.
3.7. Validate the Model
Validate the results of your model based on the goals/objectives. The model can be validated by performing the sensitivity analysis, which suggests how much stability the results of the model have if the weights of the criteria are increased or decreased.
The graphical representation of the proposed methodology is shown in Figure 2.
4. Practical Implementation of Proposed Methodology
4.1. Case Study
This study used automotive firms in Pakistan as an example and implemented the proposed methodology N-AHP and N-TOPSIS. N-AHP is used to calculate the weights of criteria, while N-TOPSIS is used to calculate the score and rank the most vulnerable risks in the supply chain for the automotive industry in Pakistan.
4.2. Data Acquisition and Sample Selection
To achieve the research objectives, a questionnaire was developed, and experts in the field and academia were requested for interviews. The selection of experts is quite critical in an MCDM study. Therefore, we created a database of the most relevant experts in the automotive industry in Pakistan and universities/institutions. Afterward, we carefully selected the number of experts based on their experience, designation, and knowledge and sent them invitations to take part in this study. The maximum number of experts in an MCDM study is limited. Therefore, we selected eight experts, five from the field of supply chain and three from academia. The selected number of experts is in accordance with the previous literature on similar studies [46,47,48,58,105,108]. The respondents’ profiles are shown in Table 2.
4.3. Goal Setting and Measurement Variables
The primary objective of this study is to identify key criteria for managing supply chain risks in the automotive industry of Pakistan. Therefore, this study focuses on evaluating supply chain risk management practices that can manage SCRs and thereby increase supply chain performance. Three concepts/practices are selected as criteria for managing supply chain risk:
- Supply chain resilience;
- Supply chain agility;
- Supply chain robustness.
Secondly, this study aims at identifying and assessing the most vulnerable supply chain risks in the automotive industry of Pakistan. Several supply chain risks were discussed with the experts based on a questionnaire obtained from the literature; this session lasted for more than one and a half hours. We requested experts to list all possible SCRs they face in the automotive industry in Pakistan. After direct interaction with the experts, we classified supply chain risks in the automotive industry into the following six categories:
- External risks;
- Industry risks;
- Organizational risks;
- Operational risks;
- Supply-side risks;
- Demand-side risks.
The classification is based on the SCRM literature and expert opinions. The selected risks for the assessment belong to six categories. First, external risks are those risks which arise due to the external factors and are out of a firm’s control. Examples include natural disasters, government restrictions, terrorist attacks, and economic and environmental risks. Natural disasters include floods, hurricanes, earthquakes, fires, etc. [1,2,42,90]. Government restrictions include the change in governmental policies, such as trade barriers, import restrictions, an increase in customs duties and changes in law, etc. [3,4,90]. Events like 9/11 are associated with terrorist attacks [4,42,52,90,99]. Economic and environmental (eco/environmental) risks include currency fluctuations, inflation, oil crises, government policies on solid waste management, Co2 emission, noncompliance with EMS standards, ISO 14001, etc. [4,40,52,58,75]. Second, industry risks are those which arise due to changes in industry patterns, regulations, and standards, such as customs duties in a specific industry, taxes related to that industry, and environmental policy related to that industry [3,4,52,74,89]. Third, organizational risks are those risks that arise inside the organization due to their policies and structure, i.e., forecasting errors, inventory shortage, and underutilized capacity [8,48,52,73,89]. Fourth, operational risks are those risks which arise and disturb a firm’s operations; these include machine breakdown, IT system failure, and lead times [1,4,52,58,73]. Fifth, supply-side risks are those which cause disruptions in the supply, such as supplier delivery delays, supplier quality problems, supplier communication failures, supplier insolvency, and increases in raw material prices [6,40,43,45,56,66,91]. Finally, demand-side risks are those which cause serious disruptions downstream of the firm, such as demand forecasting errors, cargo damages, and delivery delays due to troubling third-party logistics [6,8,43,49,65,92].
Therefore, during the process, a total of 17 risks which affect the supply chain performance of the automotive industry in Pakistan were identified. A detailed description of the identified risks is presented in Table 3.
Seventeen supply chain risks for assessment purposes and three criteria for managing supply chain risks were selected for this study based on literature and expert judgment. Alternatives (SCRs), criteria, and goals of the case study are illustrated in Figure 3.
4.4. Construction of Comparison Matrix
To construct a comparison matrix, experts were requested to score criteria based on the neutrosophic linguistic scale presented in Table 1. Afterward, the experts’ given scores were converted into neutrosophic triangular numbers, which are also shown in Table 1, along with the scores for degree of truthiness, indeterminacy, and falsity. Each expert individually provided scores for the three criteria for managing supply chain risks. After receiving scores from all the experts, we took the aggregate of the scores and constructed the final comparison matrix. The final comparison matrix of the criteria is presented in Table 4.
Once the final comparison matrix was created, we transformed it into the score matrix by using the formula presented in Equation (1). The obtained score matrix indicates that SC resilience is slightly preferable to SC agility and strongly preferable to SC robustness in the automotive industry in Pakistan, as its aggregated score is 3 and 5, respectively. SC agility is between slightly to strongly preferable to SC robustness in the automotive industry in Pakistan, as its aggregated score is 4. The obtained score matrix is presented in Table 5.
4.5. Calculating Weights for Criteria
After getting the score matrix with the help of Equation (1), we normalized the matrix by dividing each cell with the total (sum) of its column, to get the criteria final weights. The results suggest that SC resilience has a higher weight amongst the three SCRM practices. The weights for SC resilience, SC agility, and SC robustness are 0.62, 0.28, and 0.1, respectively. The total weight is equal to 1, which shows that results are satisfactory. If the combined total of all weights is higher than 1, then it indicates some error in calculation. The normalized pairwise matrix and criteria weights are found in Table 6.
According to the results of the normalized pairwise matrix, SC resilience is the most preferable criterion for achieving the goal of “managing supply chain risks.” The second most important criterion is SC agility, and the last one is SC robustness. All three criteria are vital for achieving the primary goal of the study, which is managing supply chain risks.
4.6. Consistency Ratio
To check consistency for the obtained results from the N-AHP method, we checked the consistency ratio for the experts’ aggregated decision matrix, and the obtained value is 0.068, which is less than the threshold value of 0.10. Therefore, it is said that there is no problem of inconsistency found in this study, and we can proceed with further analysis.
Hence, the weight for each criterion is defined, and since the study meets the requirements, we can proceed toward supply chain risk assessment. This study applies the N-TOPSIS approach for the assessment of supply chain risks in the automotive industry of Pakistan.
4.7. Application of N-TOPSIS for SC Risk Assessment
Our research employed the N-TOPSIS approach for the assessment of supply chain risks in the automotive industry of Pakistan. First of all, the decision matrix was calculated based on the scores received from experts for each risk relative to the criteria. Experts were requested to provide scores, using the neutrosophic scale in Table 1 and the degree of truthiness, indeterminacy, and falsity for each risk relative to its criteria. Each expert provided the scores for 17 SCRs, and then the aggregate scores of all experts were calculated, and the aggregated decision matrix was built, which is presented in Table 7.
After constructing the aggregated decision matrix, we used the score function presented in Equations (1) and (2) to transform the decision matrix into the score matrix/crisp matrix. Afterward, we performed a normalization process, to get the normalized decision matrix. We used Equation (3) to get the normalized matrix, which is presented in Table 8.
After calculating the normalized decision matrix, we calculated the weighted matrix by multiplying it with the criteria weights, wj, obtained from AHP normalized matrix, rij. We used Equation (4) to calculate the weighted matrix. The obtained weighted matrix is shown in Table 9.
The next step is to calculate the ideal best () and ideal worst () situations. We used Equations (5) and (6) to calculate the and , which are as follows:
Afterward, Euclidean distance is calculated after estimating the and scores. We used Equations (7) and (8) to calculate the Euclidean distance between the and situations. Later, we calculated the degree of closeness to the ideal solutions by using Equation (9) from which ranking of SC risks is calculated. Results of Euclidean distance between the and situations and degree of closeness and ranking of SC risks are presented in Table 10.
4.8. Ranking of Supply Chain Risks in Automotive Industry of Pakistan
To manage supply chain risks, firms need to assess the most vulnerable risks in their supply chains. In this study, we took the automotive industry of Pakistan as an example; therefore, we performed a risk assessment for the supply chains of the automotive industry in Pakistan through the N-TOPSIS approach. Experts were requested to provide scores for each risk relative to its criteria. Based on the experts’ scores, which are presented in Table 10, the degree of closeness to the ideal solutions () was calculated by using Equation (9). The higher the the higher level of harmfulness of a risk. The most harmful SCRs in the automotive industry of Pakistan are presented in Figure 4.
4.9. Validating Results and Model
We performed a sensitivity analysis in order to confirm the accuracy of the results of our study. Eight experts presented the scores in this research; therefore, they might have given different weights to different risks. Consequently, it is necessary to validate the results through sensitivity analysis. To check the sensitivity of the results, we performed three steps. In the first step, we increased the 10% weight for one factor and decreased other factors’ weight correspondingly. In the second step, we decreased the 10% weight for one factor and increased other factors’ weight correspondingly. In the third step, we did not change the weight, and it remained constant. After changing the weights, no considerable variations in the results of SC risks were observed, hence representing a stable solution. The results of the three scenarios are presented in Table 11.
We used the neutrosophic triangular numbers in this study for analysis; therefore, the chances of instability are less, but still, we have performed a sensitivity analysis to validate our results. The results are shown in Figure 5, which displays stability when weight is increased or decreased. The change in increase or decrease in SC risk values is smaller or equal to the change in weight, which suggests high stability in the model and results.
5. Discussion and Conclusions
This study was aimed at managing supply chain risks in the automotive industry of Pakistan. For this purpose, the following research questions were developed: What are the most vulnerable SCRs in the automotive industry of Pakistan? What are the most important criteria/practices for managing SCRs in the automotive industry? Under which conditions, what criteria perform better? Therefore, the results of the study are discussed in detail in this section.
Three criteria (SC resilience, SC agility, and SC robustness) for managing supply chain risk were developed after close interaction with supply chain risk literature and discussion with a panel of experts. This study employs the MCDM approach (N-AHP and N-TOPSIS) for selecting the best criteria for managing SCRS and the assessment of SCRs in the automotive industry of Pakistan. The neutrosophic-scale was used to collect the scores for each criterion from the panel of experts; then the score for each expert was aggregated, and the final matrix was generated. Using the score function of N-AHP, which is an MCDM approach, we calculated the weights for each criterion based on expert scores. The weights for the three criteria, SC resilience, SC agility, and SC robustness, for managing SCRs in the automotive industry of Pakistan are 0.68, 0.28, and 0.1, respectively. Therefore, the results of the study indicate that SC resilience is the most important criteria for managing supply chain risks, followed by SC agility and SC robustness. SC resilience has a two-way effect; on the one side, it works as a proactive approach in SCRM due to its capability in avoiding SCDs. On the other side, it works as a reactive approach in SCRM due to its capability of restoring the supply chain to its original state [55]. The primary capabilities of SC resilience are redundancy, flexibility, and collaboration among SC partners [3,19,54,57].
To assess the most vulnerable risks in the supply chain of the automotive industry in Pakistan, a questionnaire was discussed with the experts in the field and academia. Later, they were requested to list all possible risks in the automotive industry of Pakistan. This process took one and a half hours; in this time, we used the cognitive mapping technique for identifying the SCRs in the automotive industry of Pakistan. A total of seventeen risks were identified, which belong to six categories of SCRs: eco/environmental, industry-related, organizational, operational, supply-related, and demand-related risks. The identified risks are natural disasters, government restriction/tax impositions, terrorist attacks, environmental risks, insolvency of suppliers, supplier quality problems, supplier delivery failures, increase in raw material prices, communication failures, upstream cargo damages, demand fluctuations, inventory shortages, machine breakdowns, malfunction of IT systems, underutilized capacity, lead times, and troubling third-party logistics.
This is the first study of its kind that investigates SCRs relative to their management criteria and describes the degree of harmfulness of each risk under a particular criterion of management. For this purpose, the N-TOPSIS approach was applied to the case study, and the decision matrix was calculated (see Table 9). Results indicate the degree of closeness for each risk if a certain criterion is adopted for making risk mitigation strategies. For example, supplier delivery delay has a score of 0.29, 0.33, and 0.13, respectively, which represents that the degree of closeness of supplier delivery risks is 0.29 under SC resilience, 0.33 under SC agility, and 0.13 under SC robustness. This scenario tells that SC agility is the best, and SC robustness is the worst practice followed to formulate strategies for managing supply-delivery risks. Therefore, this study provides a comprehensive solution for managing supply chain risks in the automotive industry of Pakistan.
To perform an SCR assessment in the automotive industry of Pakistan, we used the N-TOPSIS approach. Decision-makers were requested to provide scores, using a neutrosophic scale by which SCRs are analyzed. The final matrix was calculated by taking the aggregate of scores provided by the decision-makers, and then the risks were ranked based on their score for the degree of closeness to the ideal solutions (see Table 10). The results of the study indicate that supply-related risks are the most vulnerable, and economic and environmental risks are the least vulnerable supply chain risks in the automotive industry of Pakistan. Moreover, supplier delivery delay is ranked as the most disruptive risks, and terrorist attacks are ranked as the least. According to these results, supply-side and demand-side risks are high in the automotive industry of Pakistan. Therefore, firms in the automotive industry in Pakistan are in dire need of criteria that could help them in managing these risks, which are provided through this study.
5.1. Managerial and Theoretical Implications of the Study
This study contributes to the SCRM literature by identifying key criteria for managing supply chain risks. The above discussion on the results of this study offers guiding principles to mangers in identifying, assessing, and managing SCRs in the automotive industry of Pakistan. This study provides several theoretical contributions. First, this study evaluates the principles of managing supply chain risks, which were not dealt with previously and treated separately. A framework for managing supply chain risks through its relevant criteria based on the degree of closeness is presented. Second, this study deals with identifying and assessing the most vulnerable risks in the automotive industry of Pakistan. Besides theoretical contributions, this study presents some practical implications for the managers in the automotive industry in Pakistan. First, this study has ranked SCRs based on their degree of harmfulness; managers can find which risk has what rank in the list. For example, supply delivery risk is ranked as no. 1, supplier communication is ranked as no.2, and a terrorist attack is ranked as the last one. Second, three risk-management criteria are identified and evaluated, which can be used for developing risk mitigation strategies. Finally, this study provides managers with a full understanding of under what circumstances which criteria perform better. SCRs are evaluated relative to each circumstance based on their degree of closeness, which tells what risk could be better managed with which criteria/practices. Managers in the field can follow the same procedure in making mitigation strategies and managing the supply chain risks.
5.2. Limitations and Future Research Avenues
Although this study contributes to the literature on supply chain risk management in multiple ways, it is subject to limitations which could be dealt with in future studies. First, this study deals with identifying key criteria/practices for managing supply chain risks among SC resilience, SC agility, and SC robustness, but their dimensions are not empirically tested. Therefore, a study that includes dimensions for each practice and their ability to handle supply chain risks and restoring firm performance on a large scale is proposed. Second, this study only deals with the automotive industry in Pakistan, and its applicability to other sectors is limited. Therefore, there is a huge potential to establish the research in the textile, IT, and electronics industries, to deal with risks arising in their supply chains, as they are the emerging sectors in Pakistan and other developing countries. Finally, this study explains the context of only one country, and its applicability to other countries is limited due to different behavioral and business peculiarities. Therefore, a cross-country comparison is suggested for future studies, to generalize the results.
Author Contributions
M.J. contributed to the development of the research framework, methodology, analysis of results, and manuscript writing. M.W.S. assisted in the compilation of results, manuscript editing. Y.X. and J.Z.L. participated in proofreading and supervision of the work carried out. M.Z. helped to conduct interviews with supply chain experts and academic experts, and calculation of results. All authors have read and agreed to the published version of the manuscript.
Funding
This research work was supported by the Program for the Soft Science of Shanxi Province in China (Grant No. 2017041025-2) and the Program for the Philosophy and Social Sciences Research of Higher Learning Institutions of Shanxi (PSSR) in China (Grant No. 2017314).
Acknowledgments
Authors pay sincere regards to supply chain/logistics/procurement/production/operations managers in the automotive industry of Pakistan for their cooperation in the data collection and their valued judgments about supply chain risks and supply chain risk management practices. The authors also acknowledge Maurice JM Lineman for providing editing assistance and proofreading the manuscript. He has published several articles on “Ecology Wetland Conservation and Public Awareness” and is a Canadian Expat working in China.
Conflicts of Interest
The authors declare no conflicts of interest.
References
- Chopra, S.; Sodhi, M.S. Managing risk to avoid: Supply-chain breakdown. MIT Sloan Manag. Rev. 2004, 46, 53–61. [Google Scholar]
- Blackhurst, J.; Craighead, C.W.; Elkins, D.; Handfield, R.B. An empirically derived agenda of critical research issues for managing supply-chain disruptions. Int. J. Prod. Res. 2005, 43, 4067–4081. [Google Scholar] [CrossRef]
- Tang, C.S. Robust strategies for mitigating supply chain disruptions. Int. J. Logist. Res. Appl. 2006, 9, 33–45. [Google Scholar] [CrossRef]
- Thun, J.H.; Hoenig, D. An empirical analysis of supply chain risk management in the German automotive industry. Int. J. Prod. Econ. 2011, 131, 242–249. [Google Scholar] [CrossRef]
- Wiengarten, F.; Humphreys, P.; Gimenez, C.; McIvor, R. Risk, risk management practices, and the success of supply chain integration. Int. J. Prod. Econ. 2016, 171, 361–370. [Google Scholar] [CrossRef]
- Lavastre, O.; Gunasekaran, A.; Spalanzani, A. Supply chain risk management in French companies. Decis. Support Syst. 2012, 52, 828–838. [Google Scholar] [CrossRef]
- Elmsalmi, M.; Hachicha, W. Risks prioritization in global supply networks using MICMAC method: A real case study. In Proceedings of the 2013 International Conference on Advanced Logistics and Transport, Sousse, Tunisia, 29–31 May 2013; pp. 394–399. [Google Scholar]
- Ivanov, D.; Sokolov, B.; Dolgui, A. The Ripple effect in supply chains: Trade-off “efficiency-flexibility-resilience” in disruption management. Int. J. Prod. Res. 2014, 52, 2154–2172. [Google Scholar] [CrossRef]
- Norrman, A.; Jansson, U. Ericsson’s proactive supply chain risk management approach after a serious sub-supplier accident. Int. J. Phys. Distrib. Logist. Manag. 2004, 34, 434–456. [Google Scholar] [CrossRef]
- Asian, S.; Nie, X. Coordination in Supply Chains with Uncertain Demand and Disruption Risks: Existence, Analysis, and Insights. IEEE Trans. Syst. Man, Cybern. Syst. 2014, 44, 1139–1154. [Google Scholar] [CrossRef]
- Pettit, T.J.; Croxton, K.L.; Fiksel, J. Ensuring supply chain resilience: Development and implementation of an assessment tool. J. Bus. Logist. 2013, 34, 46–76. [Google Scholar] [CrossRef]
- Kubota, Y. The Wall Street Journal. 2016. Available online: https://www.wsj.com/articles/japan-earthquakes-rattle-toyotas-supply-chain-1460986805 (accessed on 25 July 2019).
- Ceryno, P.S.; Scavarda, L.F.; Klingebiel, K. Supply chain risk: Empirical research in the automotive industry. J. Risk Res. 2015, 18, 1145–1164. [Google Scholar] [CrossRef]
- Automotive Supply Chain Disruption Report. 2018. Available online: https://www.jlt.com/-/media/files/sites/specialty/insights-automotive/jlt_automotive_supply_chain.ashx (accessed on 20 May 2019).
- Namdar, J.; Li, X.; Sawhney, R.; Pradhan, N. Supply chain resilience for single and multiple sourcing in the presence of disruption risks. Int. J. Prod. Res. 2018, 56, 2339–2360. [Google Scholar] [CrossRef] [Green Version]
- Tomlin, B. Disruption-management strategies for short life-cycle products. Nav. Res. Logist. 2009, 56, 318–347. [Google Scholar] [CrossRef]
- Aqlan, F.; Lam, S.S. A fuzzy-based integrated framework for supply chain risk assessment. Int. J. Prod. Econ. 2015, 161, 54–63. [Google Scholar] [CrossRef]
- Daultani, Y.; Kumar, S.; Vaidya, O.S.; Tiwari, M.K. A supply chain network equilibrium model for operational and opportunism risk mitigation. Int. J. Prod. Res. 2015, 53, 5685–5715. [Google Scholar] [CrossRef]
- Yu, K.; Cadeaux, J.; Luo, B.N. Operational flexibility: Review and meta-analysis. Int. J. Prod. Econ. 2015, 169, 190–202. [Google Scholar] [CrossRef]
- Wieland, A.; Marcus Wallenburg, C. Dealing with supply chain risks: Linking risk management practices and strategies to performance. Int. J. Phys. Distrib. Logist. Manag. 2012, 42, 887–905. [Google Scholar] [CrossRef] [Green Version]
- Azevedo, S.G.; Carvalho, H.; Cruz-Machado, V. LARG index: A benchmarking tool for improving the leanness, agility, resilience and greenness of the automotive supply chain. Benchmarking 2016, 23, 1472–1499. [Google Scholar] [CrossRef]
- Kamalahmadi, M.; Parast, M.M. A review of the literature on the principles of enterprise and supply chain resilience: Major findings and directions for future research. Int. J. Prod. Econ. 2016, 171, 116–133. [Google Scholar] [CrossRef]
- Dubey, R.; Altay, N.; Gunasekaran, A.; Blome, C.; Papadopoulos, T.; Childe, S.J. Supply chain agility, adaptability and alignment: Empirical evidence from the Indian auto components industry. Int. J. Oper. Prod. Manag. 2018, 38, 129–148. [Google Scholar] [CrossRef]
- Syed, M.W.; Li, J.Z.; Junaid, M.; Ye, X.; Ziaullah, M. An Empirical Examination of Sustainable Supply Chain Risk and Integration Practices: A Performance-Based Evidence from Pakistan. Sustainability 2019, 11, 5334. [Google Scholar] [CrossRef] [Green Version]
- Carbonara, N.; Pellegrino, R. Real options approach to evaluate postponement as supply chain disruptions mitigation strategy. Int. J. Prod. Res. 2018, 56, 5249–5271. [Google Scholar] [CrossRef]
- Altay, N.; Gunasekaran, A.; Dubey, R.; Childe, S.J. Agility and resilience as antecedents of supply chain performance under moderating effects of organizational culture within the humanitarian setting: A dynamic capability view. Prod. Plan. Control 2018, 29, 1158–1174. [Google Scholar] [CrossRef]
- Blome, D.; Schoenherr, T.; Rexhausen, C. Antecedents and enablers of supply chain agility and its effect on performance: A dynamic capabilities perspective. Int. J. Prod. Res. 2013, 51, 1295–1318. [Google Scholar] [CrossRef]
- Ivanov, D.; Dolgui, A. Low-Certainty-Need (LCN) supply chains: A new perspective in managing disruption risks and resilience. Int. J. Prod. Res. 2019, 57, 5119–5136. [Google Scholar] [CrossRef] [Green Version]
- Govindan, K.; Fattahi, M. Investigating risk and robustness measures for supply chain network design under demand uncertainty: A case study of glass supply chain. Int. J. Prod. Econ. 2017, 183, 680–699. [Google Scholar] [CrossRef]
- Li, J.; Liu, X.; Wu, J.; Yang, F. Coordination of Supply Chain with a Dominant Retailer under Demand Disruptions. Math. Probl. Eng. 2014, 2014, 1–10. [Google Scholar] [CrossRef]
- Lu, D.; Ding, Y.; Asian, S.; Paul, S.K. From Supply Chain Integration to Operational Performance: The Moderating Effect of Market Uncertainty. Glob. J. Flex. Syst. Manag. 2018, 19, 3–20. [Google Scholar] [CrossRef]
- Monostori, J. Supply chains robustness: Challenges and opportunities. Procedia CIRP 2018, 67, 110–115. [Google Scholar] [CrossRef]
- Choi, T.-M. Inventory Service Target in Quick Response Fashion Retail Supply Chains. Serv. Sci. 2016, 8, 406–419. [Google Scholar] [CrossRef]
- Rezaei Somarin, A.; Asian, S.; Jolai, F.; Chen, S. Flexibility in service parts supply chain: A study on emergency resupply in aviation MRO. Int. J. Prod. Res. 2018, 56, 3547–3562. [Google Scholar] [CrossRef]
- Tang, C.; Tomlin, B. The power of flexibility for mitigating supply chain risks. Int. J. Prod. Econ. 2008, 116, 12–27. [Google Scholar] [CrossRef] [Green Version]
- Hosseini, S.; Ivanov, D.; Dolgui, A. Review of quantitative methods for supply chain resilience analysis. Transp. Res. Part E Logist. Transp. Rev. 2019, 125, 285–307. [Google Scholar] [CrossRef]
- Smarandache, F. Neutrosophy: Neutrosophic Probability, Set, and Logic: Analytic Synthesis & Synthetic Analysis; American Research Press: Rehoboth, NM, USA, 1998; ISBN 1879585634. [Google Scholar]
- Abdel-Basset, M.; Mohamed, M.; Zhou, Y.; Hezam, I. Multi-criteria group decision making based on neutrosophic analytic hierarchy process. J. Intell. Fuzzy Syst. 2017, 33, 4055–4066. [Google Scholar] [CrossRef]
- Mitchell, V.-W. Organizational Risk Perception and Reduction: A Literature Review. Br. J. Manag. 1995, 6, 115–133. [Google Scholar] [CrossRef]
- Ho, W.; Zheng, T.; Yildiz, H.; Talluri, S. Supply chain risk management: A literature review. Int. J. Prod. Res. 2015, 53, 5031–5069. [Google Scholar] [CrossRef]
- Ellis, S.C.; Henry, R.M.; Shockley, J. Buyer perceptions of supply disruption risk: A behavioral view and empirical assessment. J. Oper. Manag. 2010, 28, 34–46. [Google Scholar] [CrossRef] [Green Version]
- Jüttner, U.; Peck, H.; Christopher, M. Supply chain risk management: Outlining an agenda for future research. Int. J. Logist. Res. Appl. 2003, 6, 197–210. [Google Scholar]
- Zhao, L.; Huo, B.; Sun, L.; Zhao, X. The impact of supply chain risk on supply chain integration and company performance: A global investigation. Supply Chain Manag. Int. J. 2013, 18, 115–131. [Google Scholar] [CrossRef]
- Zsidisin, G.A. A grounded definition of supply risk. J. Purch. Supply Manag. 2003, 9, 217–224. [Google Scholar] [CrossRef]
- Tummala, R.; Schoenherr, T. Assessing and managing risks using the Supply Chain Risk Management Process (SCRMP). Supply Chain Manag. 2011, 16, 474–483. [Google Scholar] [CrossRef]
- Prakash, A.; Agarwal, A.; Kumar, A. Risk Assessment in Automobile Supply Chain. Mater. Today Proc. 2018, 5, 3571–3580. [Google Scholar] [CrossRef]
- Abdel-Basset, M.; Gunasekaran, M.; Mohamed, M.; Chilamkurti, N. A framework for risk assessment, management and evaluation: Economic tool for quantifying risks in supply chain. Futur. Gener. Comput. Syst. 2019, 90, 489–502. [Google Scholar] [CrossRef] [Green Version]
- Rostamzadeh, R.; Ghorabaee, M.K.; Govindan, K.; Esmaeili, A.; Nobar, H.B.K. Evaluation of sustainable supply chain risk management using an integrated fuzzy TOPSIS- CRITIC approach. J. Clean. Prod. 2018, 175, 651–669. [Google Scholar] [CrossRef]
- Fan, Y.; Stevenson, M. A review of supply chain risk management: Definition, theory, and research agenda. Int. J. Phys. Distrib. Logist. Manag. 2018, 48, 205–230. [Google Scholar] [CrossRef] [Green Version]
- Giannakis, M.; Louis, M. A multi-agent based framework for supply chain risk management. J. Purch. Supply Manag. 2011, 17, 23–31. [Google Scholar] [CrossRef]
- Louis, M.; Pagell, M. Categorizing Supply Chain Risks: Review, Integrated Typology and Future Research. In Revisiting Supply Chain Risk; Zsidisin, G.A., Henke, M., Eds.; Springer Series in Supply Chain Management; Springer International Publishing: Cham, Germany, 2019; Volume 7, ISBN 978-3-030-03812-0. [Google Scholar]
- Thun, J.H.; Drüke, M.; Hoenig, D. Managing uncertainty-an empirical analysis of supply chain risk management in small and medium-sized enterprises. Int. J. Prod. Res. 2011, 49, 5511–5525. [Google Scholar] [CrossRef]
- Manuj, I.; Mentzer, J.T. Global supply chain risk management. J. Bus. Logist. 2008, 29, 133–155. [Google Scholar] [CrossRef]
- Jajja, M.S.S.; Chatha, K.A.; Farooq, S. Impact of supply chain risk on agility performance: Mediating role of supply chain integration. Int. J. Prod. Econ. 2018, 205, 118–138. [Google Scholar] [CrossRef]
- Gaudenzi, B.; Borghesi, A. Managing risks in the supply chain using the AHP method. Int. J. Logist. Manag. 2006, 17, 114–136. [Google Scholar] [CrossRef]
- Jiang, B.; Baker, R.C.; Frazier, G.V. An analysis of job dissatisfaction and turnover to reduce global supply chain risk: Evidence from China. J. Oper. Manag. 2009, 27, 169–184. [Google Scholar] [CrossRef]
- Vanalle, R.M.; Lucato, W.C.; Ganga, G.M.D.; Alves Filho, A.G. Risk management in the automotive supply chain: An exploratory study in Brazil. Int. J. Prod. Res. 2019, 1–17. [Google Scholar] [CrossRef]
- Nazam, M.; Xu, J.; Tao, Z.; Ahmad, J.; Hashim, M. A fuzzy AHP-TOPSIS framework for the risk assessment of green supply chain implementation in the textile industry. Int. J. Supply Oper. Manag. 2015, 2, 548–568. [Google Scholar]
- Carvalho, H.; Barroso, A.P.; MacHado, V.H.; Azevedo, S.; Cruz-Machado, V. Supply chain redesign for resilience using simulation. Comput. Ind. Eng. 2012, 62, 329–341. [Google Scholar] [CrossRef]
- Grötsch, V.M.; Blome, C.; Schleper, M.C. Antecedents of proactive supply chain risk management—A contingency theory perspective. Int. J. Prod. Res. 2013, 51, 2842–2867. [Google Scholar] [CrossRef]
- Paul, S.K.; Sarker, R.; Essam, D. A quantitative model for disruption mitigation in a supply chain. Eur. J. Oper. Res. 2017, 257, 881–895. [Google Scholar] [CrossRef]
- Pérez Pérez, M.; Serrano Bedia, A.M.; López Fernández, M.C. A review of manufacturing flexibility: Systematising the concept. Int. J. Prod. Res. 2016, 54, 3133–3148. [Google Scholar] [CrossRef]
- Yang, B.; Yang, Y. Postponement in supply chain risk management: A complexity perspective. Int. J. Prod. Res. 2010, 48, 1901–1912. [Google Scholar] [CrossRef] [Green Version]
- Durach, C.F.; Wieland, A.; Machuca, J.A.D. Antecedents and dimensions of supply chain robustness: A systematic literature review. Int. J. Phys. Distrib. Logist. Manag. 2015, 45, 118–137. [Google Scholar] [CrossRef] [Green Version]
- Vlajic, J.V.; Van Der Vorst, J.G.A.J.; Haijema, R. A framework for designing robust food supply chains. Int. J. Prod. Econ. 2012, 137, 176–189. [Google Scholar] [CrossRef]
- Swafford, P.M.; Ghosh, S.; Murthy, N. The antecedents of supply chain agility of a firm: Scale development and model testing. J. Oper. Manag. 2006, 24, 170–188. [Google Scholar] [CrossRef]
- Aslam, H.; Blome, C.; Roscoe, S.; Azhar, T.M. Dynamic supply chain capabilities: How market sensing, supply chain agility and adaptability affect supply chain ambidexterity. Int. J. Oper. Prod. Manag. 2018, 38, 2266–2285. [Google Scholar] [CrossRef]
- Klibi, W.; Martel, A. Modeling approaches for the design of resilient supply networks under disruptions. Int. J. Prod. Econ. 2012, 135, 882–898. [Google Scholar] [CrossRef]
- Yusuf, Y.Y.; Gunasekaran, A.; Adeleye, E.O.; Sivayoganathan, K. Agile supply chain capabilities: Determinants of competitive objectives. Eur. J. Oper. Res. 2004, 159, 379–392. [Google Scholar] [CrossRef]
- Behzadi, G.; O’Sullivan, M.J.; Olsen, T.L.; Scrimgeour, F.; Zhang, A. Robust and resilient strategies for managing supply disruptions in an agribusiness supply chain. Int. J. Prod. Econ. 2017, 191, 207–220. [Google Scholar] [CrossRef]
- Bhamra, R.; Dani, S.; Burnard, K. Resilience: The concept, a literature review and future directions. Int. J. Prod. Res. 2011, 49, 5375–5393. [Google Scholar] [CrossRef]
- Dolgui, A.; Ivanov, D.; Sokolov, B. Ripple effect in the supply chain: An analysis and recent literature. Int. J. Prod. Res. 2018, 56, 414–430. [Google Scholar] [CrossRef] [Green Version]
- Polyviou, M.; Croxton, K.L.; Knemeyer, A.M. Resilience of medium-sized firms to supply chain disruptions: The role of internal social capital. Int. J. Oper. Prod. Manag. 2019. [Google Scholar] [CrossRef]
- Melnyk, S.A.; Narasimhan, R.; DeCampos, H.A. Supply chain design: Issues, challenges, frameworks and solutions. Int. J. Prod. Res. 2014, 52, 1887–1896. [Google Scholar] [CrossRef] [Green Version]
- Raghunath, K.M.K.; Devi, S.L.T. Supply Chain Risk Management. Int. J. Inf. Syst. Supply Chain Manag. 2018, 11, 87–104. [Google Scholar] [CrossRef]
- Towill, M.C.R.; Christopher, M.; Towill, D.R. Research note Supply chain migration from lean and functional to agile and customised. Supply Chain Manag. Int. J. 2001, 5, 206–213. [Google Scholar] [CrossRef]
- Li, X.; Goldsby, T.J.; Holsapple, C.W. Supply chain agility: Scale development. Int. J. Logist. Manag. 2009, 20, 408–424. [Google Scholar] [CrossRef]
- Tse, Y.K.; Zhang, M.; Akhtar, P.; MacBryde, J. Embracing supply chain agility: An investigation in the electronics industry. Supply Chain Manag. Int. J. 2016, 21, 140–156. [Google Scholar] [CrossRef]
- Yang, J. Supply chain agility: Securing performance for Chinese manufacturers. Int. J. Prod. Econ. 2014, 150, 104–113. [Google Scholar] [CrossRef]
- Jayaram, J.; Tan, K.C. Supply chain integration with third-party logistics providers. Int. J. Prod. Econ. 2010, 125, 262–271. [Google Scholar] [CrossRef]
- Qi, Y.N.; Chu, Z.F. The impact of supply chain strategies on supply chain integration. In Proceedings of the 2009 International Conference on Management Science and Engineering, Moscow, Russia, 14–16 September 2009; pp. 534–540. [Google Scholar]
- Kauppi, K.; Longoni, A.; Caniato, F.; Kuula, M. Managing country disruption risks and improving operational performance: Risk management along integrated supply chains. Int. J. Prod. Econ. 2016, 182, 484–495. [Google Scholar] [CrossRef]
- Fayezi, S.; Mirkovski, K. Toward Supply Chain Agility: The Case of the Australian Manufacturing Sector. Supply Chain Quarterly. 2017. Available online: http://www.supplychainquarterly.com/topics/Manufacturing/20170622-toward-supply-chain-agility-the-case-of-the-australian-manufacturing-sector/ (accessed on 2 August 2019).
- Stonebraker, P.W.; Goldhar, J.; Nassos, G. Weak links in the supply chain: Measuring fragility and sustainability. J. Manuf. Technol. Manag. 2009, 20, 161–177. [Google Scholar] [CrossRef]
- Dong, M. Development of supply chain network robustness index. Int. J. Serv. Oper. Inform. 2006, 1, 54–66. [Google Scholar] [CrossRef]
- Neiger, D.; Rotaru, K.; Churilov, L. Supply chain risk identification with value-focused process engineering. J. Oper. Manag. 2009, 27, 154–168. [Google Scholar] [CrossRef]
- Wu, T.; Blackhurst, J. (Eds.) Managing Supply Chain Risk and Vulnerability; Springer London: London, UK, 2009; ISBN 978-1-84882-633-5. [Google Scholar]
- Sinha, P.R.; Whitman, L.E.; Malzahn, D. Methodology to mitigate supplier risk in an aerospace supply chain. Supply Chain Manag. 2004, 9, 154–168. [Google Scholar] [CrossRef]
- Tazelaar, F.; Snijders, C. Operational risk assessments by supply chain professionals: Process and performance. J. Oper. Manag. 2013, 31, 37–51. [Google Scholar] [CrossRef]
- Wagner, S.M.; Bode, C. An empirical investigation into supply chain vulnerability. J. Purch. Supply Manag. 2006, 12, 301–312. [Google Scholar] [CrossRef]
- Sarkar, A.; Mohapatra, P.K.J. Determining the optimal size of supply base with the consideration of risks of supply disruptions. Int. J. Prod. Econ. 2009, 119, 122–135. [Google Scholar] [CrossRef]
- Sawik, T. Selection of supply portfolio under disruption risks. Omega 2011, 39, 194–208. [Google Scholar] [CrossRef]
- Goh, M.; Lim, J.Y.S.; Meng, F. A stochastic model for risk management in global supply chain networks. Eur. J. Oper. Res. 2007, 182, 164–173. [Google Scholar] [CrossRef]
- Schmitt, A.J.; Singh, M. Quantifying supply chain disruption risk using Monte Carlo and discrete-event simulation. In Proceedings of the Winter Simulation Conference WSC, Austin, TX, USA, 13–16 December 2009; pp. 1237–1248. [Google Scholar] [CrossRef]
- Sidola, A.; Kumar, P.; Kumar, D. System dynamic methodological approach for design and analysis of risk in supply chain. In Proceedings of the IEEE First International Technology Management Conference, San Jose, CA, USA, 27–30 June 2011; pp. 495–500. [Google Scholar] [CrossRef]
- Mele, F.D.; Guillén, G.; Espuña, A.; Puigjaner, L. An agent-based approach for supply chain retrofitting under uncertainty. Comput. Chem. Eng. 2007, 31, 722–735. [Google Scholar] [CrossRef]
- Cao, Y.; Chen, X.H. An agent-based simulation model of enterprises financial distress for the enterprise of different life cycle stage. Simul. Model. Pract. Theory 2012, 20, 70–88. [Google Scholar] [CrossRef]
- Tuncel, G.; Alpan, G. Risk assessment and management for supply chain networks: A case study. Comput. Ind. 2010, 61, 250–259. [Google Scholar] [CrossRef]
- Schoenherr, T.; Rao Tummala, V.M.; Harrison, T.P. Assessing supply chain risks with the analytic hierarchy process: Providing decision support for the offshoring decision by a US manufacturing company. J. Purch. Supply Manag. 2008, 14, 100–111. [Google Scholar] [CrossRef] [Green Version]
- Sarrate, R.; Nejjari, F.; Mele, F.D.; Quevedo, J.; Puigjaner, L. Event-based approach for supply chain fault analysis. Comput. Aided Chem. Eng. 2005, 20, 1261–1266. [Google Scholar] [CrossRef]
- Murè, S.; Demichela, M. Fuzzy Application Procedure (FAP) for the risk assessment of occupational accidents. J. Loss Prev. Process Ind. 2009, 22, 593–599. [Google Scholar] [CrossRef]
- Buchmeister, B.; Kremljak, Z.; Polajnar, A.; Pandza, K. Fuzzy Decision Support System Using Risk Analysis. Adv. Prod. Eng. Manag. 2006, 1, 30–39. [Google Scholar]
- Wang, Y.M.; Elhag, T.M.S. A fuzzy group decision making approach for bridge risk assessment. Comput. Ind. Eng. 2007, 53, 137–148. [Google Scholar] [CrossRef]
- Wang, X.; Chan, H.K.; Yee, R.W.Y.; Diaz-Rainey, I. A two-stage fuzzy-AHP model for risk assessment of implementing green initiatives in the fashion supply chain. Int. J. Prod. Econ. 2012, 135, 595–606. [Google Scholar] [CrossRef]
- Sirisawat, P.; Kiatcharoenpol, T. Fuzzy AHP-TOPSIS approaches to prioritizing solutions for reverse logistics barriers. Comput. Ind. Eng. 2018, 117, 303–318. [Google Scholar] [CrossRef]
- Pavlou, S.; Manthou, V. Identifying and evaluating unexpected events as sources of supply chain risk. Int. J. Serv. Oper. Manag. 2008, 4, 604–617. [Google Scholar] [CrossRef]
- Jacinto, C.; Silva, C. A semi-quantitative assessment of occupational risks using bow-tie representation. Saf. Sci. 2010, 48, 973–979. [Google Scholar] [CrossRef]
- Erdogan, S.A.; Šaparauskas, J.; Turskis, Z. A Multi-Criteria Decision-Making Model to Choose the Best Option for Sustainable Construction Management. Sustainability 2019, 11, 2239. [Google Scholar] [CrossRef] [Green Version]
- Kahraman, C.; Onar, S.C.; Oztaysi, B. Fuzzy Multicriteria Decision-Making: A Literature Review. Int. J. Comput. Intell. Syst. 2015, 8, 637–666. [Google Scholar] [CrossRef] [Green Version]
- Saaty, T.L.; Vargas, L.G. Estimating technological coefficients by the analytic hierarchy process. Socioecon. Plann. Sci. 1979, 13, 333–336. [Google Scholar] [CrossRef]
Figure 1.
Research framework.

Figure 2.
N-AHP and TOPSIS steps.

Figure 3.
Assessment index for supply chain risk in the automotive industry.
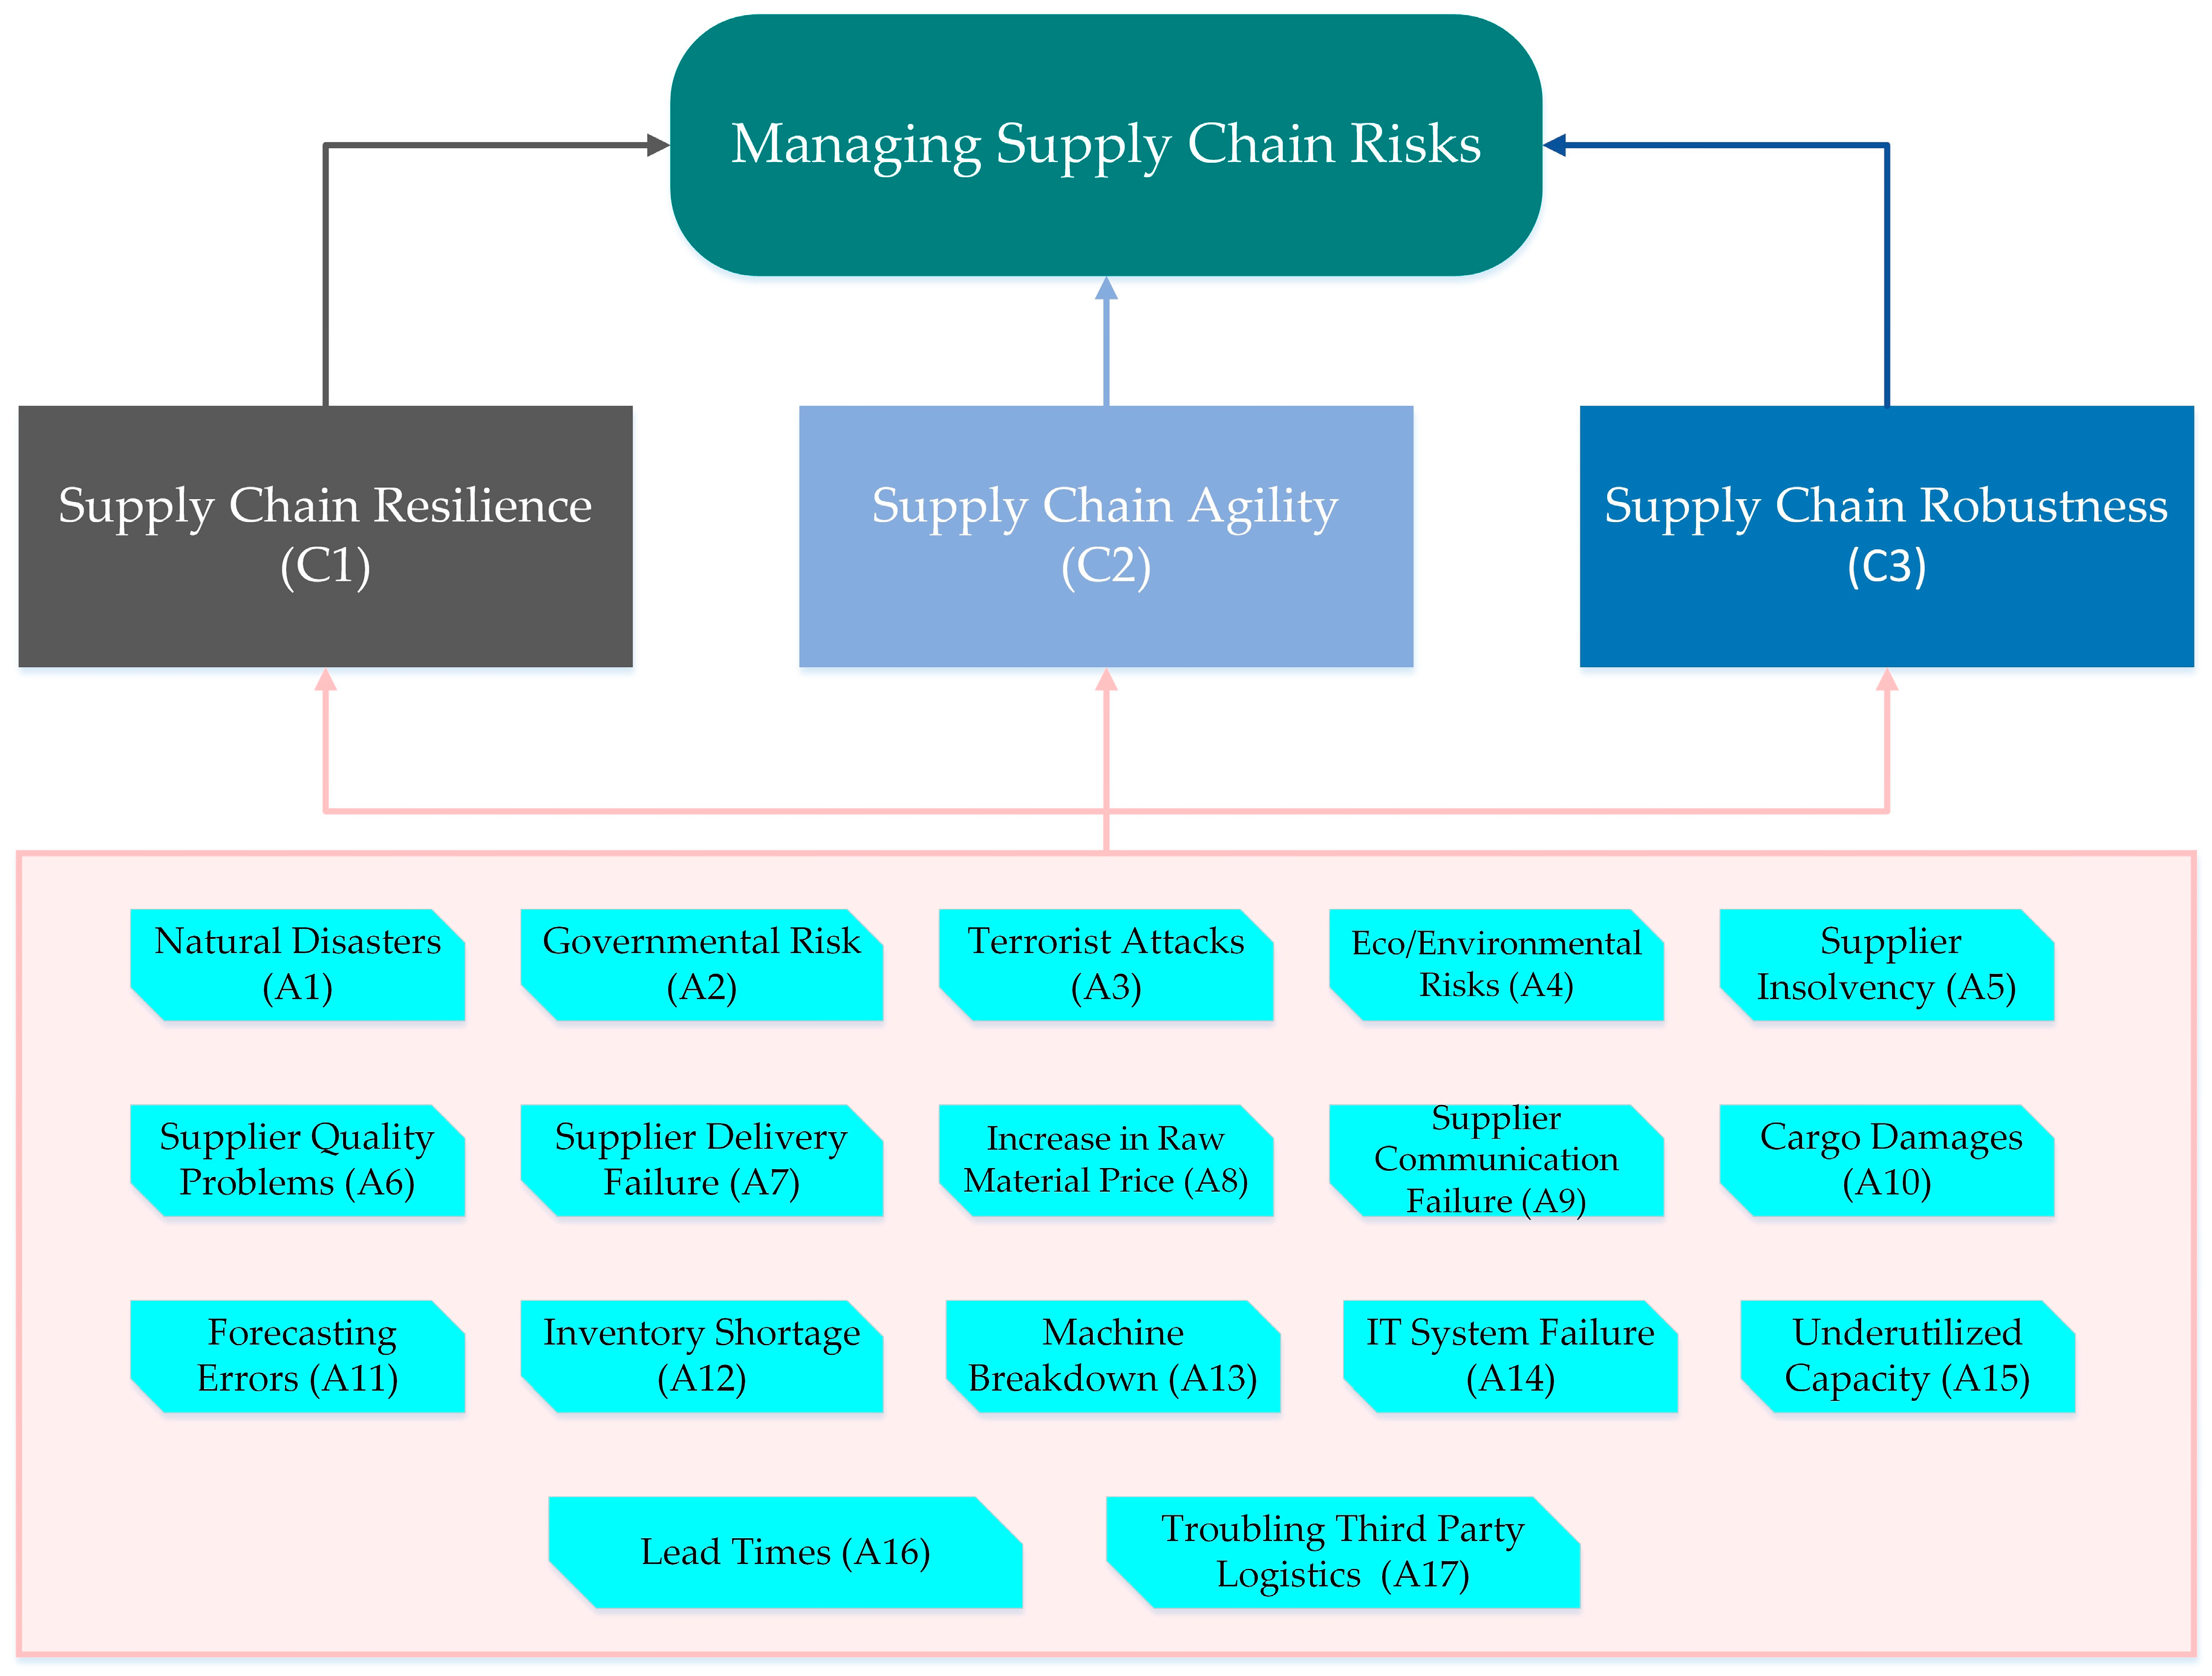
Figure 4.
Degree of the vulnerability of supply chain risks.

Figure 5.
Sensitivity analysis results.


Table 1.
Triangular N-AHP and TOPSIS scale.
| Saaty AHP | Description | Triangular Neutrosophic Scale |
|---|---|---|
| 1 | Equally preferable | = (1,1,1) |
| 3 | Slightly preferable | = (2,3,4) |
| 5 | Strongly preferable | = (4,5,6) |
| 7 | Very strongly preferable | = (6,7,8) |
| 9 | Absolutely preferable | = (9,9,9) |
| 2 | = (1,2,3) | |
| 4 | Sporadic values | = (3,4,5) |
| 6 | = (5,6,7) | |
| 8 | = (7,8,9) |
Table 2.
Respondents’ profiles.
| Sr. | Job Title | Experience (Years) | Qualification |
|---|---|---|---|
| 1 | Supply chain manager | 15 | MBA/CSCP |
| 2 | Logistic manager | 10 | MBA logistics |
| 3 | Production manager | 20 | Engineering and management |
| 4 | Distribution manager | 17 | MBA |
| 5 | Operations manager | 14 | MBA |
| 6 | Professor | 18 | PhD (Management sciences) |
| 7 | Professor | 16 | PhD (Logistics and distribution) |
| 8 | Assistant Professor | 6 | PhD (Supply chain management) |
Table 3.
Description of Supply chain risks in the automotive industry.
| Sr. | Supply Chain Risk | Description | References |
|---|---|---|---|
| 1 | Natural disasters | Events such as earthquake, fire, floods, hurricanes, etc. | [1,2,42,90] |
| 2 | Government restriction | Change in governmental policies, such as trade barriers, import restrictions, increase in customs duty and change in law, etc. | [3,4,90] |
| 3 | Terrorist attacks | Events like 9/11. | [4,42,52,90,99] |
| 4 | Economic and environmental risks | Currency fluctuations, inflation, oil crises, government policies on solid waste management, Co2 emission, EMS, ISO 14001, etc. | [4,40,52,75] |
| 5 | Supplier insolvency | When the supplier has insufficient funds to operate and becomes insolvent. | [44,54,76,90] |
| 6 | Supplier quality problem | Compromise of suppliers over high-quality equipment. | [7,43,67,92] |
| 7 | Supplier delivery delays | Not-on-time delivery by the supplier and frequent delays. | [20,27,56,92] |
| 8 | Increase in raw material prices | Increase in raw material prices causes problems in procurement. | [40,47,60,86] |
| 9 | Supplier communication failure | Supplier fails in the communication of delivery failure, delay, quality problem, etc. | [6,40,43,45] |
| 10 | Cargo damages | Damages during cargo, due to operating on long and risky routes. | [6,8,43,93] |
| 11 | Forecasting errors | Errors in estimating supply and demand. | [1,3,8,48] |
| 12 | Inventory shortage | Less inventory due to lean or Just in time methods. | [1,4,52,74] |
| 13 | Machine breakdown | Unplanned stoppage of a machine, which takes time for recovery. | [1,4,43,48] |
| 14 | IT system failure | Breakdown of communication or IT network within or outside the organization. | [8,23,74,75,76] |
| 15 | Underutilized capacity | The firm is not taking the benefits of its resources on the highest capacity. | [4,13,52,60,90] |
| 16 | Lead times | The idle and spare time during the manufacturing process. | [1,8,59,103] |
| 17 | Troubling third-party logistics | Delays in delivery and damages caused by the negligence of TPLS. | [20,27,49,66] |
Table 4.
Final comparison matrix.
| Goals | SC Resilience | SC Agility | SC Robustness |
|---|---|---|---|
| SC Resilience | [(1,1,1); 0.50,0.50,0.50] | [(2,3,4); 0.60,0.25,0.40] | [(4,5,6); 0.55,0.30,0.45] |
| SC Agility | [(); 0.60,0.25,0.40] | [(1,1,1); 0.50,0.50,0.50] | [(3,4,5); 0.70,0.25,0.30] |
| SC Robustness | [(); 0.55,0.30,0.45] | [(); 0.70,0.25,0.30] | [(1,1,1); 0.50,0.50,0.50] |
Table 5.
Score matrix.
| Goals | SC Resilience | SC Agility | SC Robustness |
|---|---|---|---|
| SC Resilience | 1 | 3 | 5 |
| SC Agility | 0.33 | 1 | 4 |
| SC Robustness | 0.2 | 0.25 | 1 |
Table 6.
Normalized pairwise matrix.
| Goals | SC Resilience | SC Agility | SC Robustness | Weights |
|---|---|---|---|---|
| SC Resilience | 0.65 | 0.7 | 0.5 | 0.62 |
| SC Agility | 0.21 | 0.24 | 0.4 | 0.28 |
| SC Robustness | 0.13 | 0.06 | 0.1 | 0.1 |
Table 7.
Aggregated neutrosophic decision matrix.
| SC Risk | SC Resilience (c1) | SC Agility (c2) | SC Robustness (c3) | |
|---|---|---|---|---|
| A1 | Natural disasters | 2,3,4 | 3,4,5 | 6,7,8 |
| (0.60,0.30,0.40) | (0.65,0.35,0.35) | (0.85,0.20,0.15) | ||
| A2 | Government restriction | 4,5,6 | 3,4,5 | 2,3,4 |
| (0.50,0.30,0.50) | (0.60,0.40,0.40) | (0.55,0.30,0.45) | ||
| A3 | Terrorist attacks | 2,3,4 | 2,3,4 | 4,5,6 |
| (0.70,0.20,0.30) | (0.75,0.20,0.25) | (0.70,0.25,0.30) | ||
| A4 | Eco/environmental risks | 2,3,4 | 2,3,4 | 5,6,7 |
| (0.55,0.30,0.45) | (0.85,0.30,0.20) | (0.80,0.20,0.20) | ||
| A5 | Insolvency of supplier | 5,6,7 | 2,3,4 | 5,6,7 |
| (0.60,0.40,0.40) | (0.65,0.30,0.35) | (0.85,0.25,0.15) | ||
| A6 | Supplier quality problem | 5,6,7 | 6,7,8 | 1,2,3 |
| (0.65,0.35,0.35) | (0.60,0.20,0.40) | (0.55,0.30,0.45) | ||
| A7 | Supplier delivery delays | 6,7,8 | 5,6,7 | 1,2,3 |
| (0.55,0.25,0.45) | (0.70,0.30,0.30) | (0.55,0.35,0.45) | ||
| A8 | Increase in raw material prices | 6,7,8 | 4,5,6 | 2,3,4 |
| (0.85,0.20,0.15) | (0.70,0.30,0.30) | (0.75,0.20,0.25) | ||
| A9 | Supplier communication failure | 7,8,9 | 3,4,5 | 1,2,3 |
| (0.70,0.25,0.30) | (0.60,0.25,0.40) | (0.55,0.25,0.45) | ||
| A10 | Upstream cargo damage | 5,6,7 | 3,4,5 | 2,3,4 |
| (0.55,0.35,0.45) | (0.65,0.30,0.35) | (0.70,0.20,0.30) | ||
| A11 | Forecasting errors | 6,7,8 | 4,5,6 | 2,3,4 |
| (0.65,0.25,0.35) | (0.65,0.35,0.35) | (0.60,0.20,0.40) | ||
| A12 | Inventory shortage | 6,7,8 | 2,3,4 | 3,4,5 |
| (0.60,0.30,0.40) | (0.55,0.40,0.45) | (0.65,0.35,0.35) | ||
| A13 | Machine breakdown | 7,8,9 | 3,4,5 | 1,2,3 |
| (0.75,0.20.0.30) | (0.60,0.45,0.40) | (0.55,0.30,0.45) | ||
| A14 | IT system failure | 6,7,8 | 3,4,5 | 2,3,4 |
| (0.60,0.25,0.40) | (0.60,0.30,0.40) | (0.65,0.30,0.40) | ||
| A15 | Underutilized capacity | 4,5,6 | 3,4,5 | 2,3,4 |
| (0.50,0.40,0.50) | (0.60,0.30,0.40) | (0.60,0.45,0.40) | ||
| A16 | Lead times | 4,5,6 | 2,3,4 | 2,3,4 |
| (0.60,0.35,0.40) | (0.55,0.35,0.45) | (0.60,0.40,0.40) | ||
| A17 | Troubling third-party logistics | 3,4,5 | 6,7,8 | 2,3,4 |
| (0.75,0.20,0.25) | (0.55,0.25,0.45) | (0.65,0.30,0.40) |
Table 8.
Normalized decision matrix.
| SC Risk | SC Resilience (c1) | SC Agility (c2) | SC Robustness (c3) | |
|---|---|---|---|---|
| A1 | Natural disasters | 0.11 | 0.22 | 0.44 |
| A2 | Government restriction | 0.21 | 0.23 | 0.19 |
| A3 | Terrorist attacks | 0.12 | 0.17 | 0.32 |
| A4 | Eco/environmental risks | 0.13 | 0.16 | 0.38 |
| A5 | Insolvency of supplier | 0.25 | 0.17 | 0.37 |
| A6 | Supplier quality problem | 0.26 | 0.37 | 0.13 |
| A7 | Supplier delivery delays | 0.29 | 0.33 | 0.13 |
| A8 | Increase in raw material prices | 0.30 | 0.28 | 0.18 |
| A9 | Supplier communication failure | 0.36 | 0.22 | 0.13 |
| A10 | Upstream cargo damage | 0.25 | 0.23 | 0.19 |
| A11 | Forecasting errors | 0.30 | 0.28 | 0.19 |
| A12 | Inventory shortage | 0.30 | 0.17 | 0.25 |
| A13 | Machine breakdown | 0.34 | 0.22 | 0.13 |
| A14 | IT system failure | 0.30 | 0.22 | 0.18 |
| A15 | Underutilized capacity | 0.21 | 0.23 | 0.19 |
| A16 | Lead times | 0.20 | 0.17 | 0.19 |
| A17 | Troubling third-party logistics | 0.17 | 0.39 | 0.19 |
Table 9.
Weighted decision matrix.
| SC Risk | SC Resilience (c1) | SC Agility (c2) | SC Robustness (c3) | |
|---|---|---|---|---|
| A1 | Natural disasters | 0.07 | 0.06 | 0.04 |
| A2 | Government restriction | 0.13 | 0.07 | 0.02 |
| A3 | Terrorist attacks | 0.06 | 0.04 | 0.03 |
| A4 | Eco/environmental risks | 0.08 | 0.05 | 0.05 |
| A5 | Insolvency of supplier | 0.16 | 0.05 | 0.04 |
| A6 | Supplier quality problem | 0.16 | 0.11 | 0.01 |
| A7 | Supplier delivery delays | 0.18 | 0.10 | 0.01 |
| A8 | Increase in raw material prices | 0.19 | 0.08 | 0.02 |
| A9 | Supplier communication failure | 0.22 | 0.06 | 0.01 |
| A10 | Upstream cargo damage | 0.16 | 0.07 | 0.02 |
| A11 | Forecasting errors | 0.19 | 0.08 | 0.02 |
| A12 | Inventory shortage | 0.19 | 0.05 | 0.03 |
| A13 | Machine breakdown | 0.21 | 0.06 | 0.01 |
| A14 | IT system failure | 0.19 | 0.06 | 0.02 |
| A15 | Underutilized capacity | 0.13 | 0.07 | 0.02 |
| A16 | Lead times | 0.12 | 0.05 | 0.02 |
| A17 | Troubling third-party logistics | 0.11 | 0.13 | 0.02 |
Table 10.
SC risk ranking.
| SC Risks Ranking | |||||
|---|---|---|---|---|---|
| A1 | 0.15 | 0.04 | 0.19 | 0.21 | 15 |
| A2 | 0.11 | 0.07 | 0.18 | 0.39 | 12 |
| A3 | 0.16 | 0.03 | 0.19 | 0.16 | 17 |
| A4 | 0.16 | 0.04 | 0.20 | 0.20 | 16 |
| A5 | 0.10 | 0.10 | 0.20 | 0.50 | 10 |
| A6 | 0.07 | 0.12 | 0.19 | 0.63 | 5 |
| A7 | 0.06 | 0.13 | 0.19 | 0.68 | 1 |
| A8 | 0.07 | 0.13 | 0.20 | 0.65 | 3 |
| A9 | 0.08 | 0.16 | 0.24 | 0.67 | 2 |
| A10 | 0.10 | 0.11 | 0.21 | 0.52 | 9 |
| A11 | 0.08 | 0.14 | 0.22 | 0.64 | 4 |
| A12 | 0.09 | 0.13 | 0.22 | 0.59 | 7 |
| A13 | 0.10 | 0.15 | 0.25 | 0.60 | 6 |
| A14 | 0.09 | 0.12 | 0.21 | 0.57 | 8 |
| A15 | 0.12 | 0.07 | 0.19 | 0.37 | 13 |
| A16 | 0.13 | 0.06 | 0.19 | 0.33 | 14 |
| A17 | 0.12 | 0.08 | 0.20 | 0.40 | 11 |
Table 11.
Sensitivity analysis.
| SC Risk | Weight Remained Unchanged | Weight Increased 10% | Weight Decreased by 10% | |
|---|---|---|---|---|
| A1 | Natural disasters | 0.23 | 0.16 | 0.26 |
| A2 | Government restriction | 0.40 | 0.39 | 0.31 |
| A3 | Terrorist attacks | 0.16 | 0.09 | 0.16 |
| A4 | Eco/environmental risks | 0.18 | 0.12 | 0.19 |
| A5 | Insolvency of supplier | 0.49 | 0.55 | 0.42 |
| A6 | Supplier quality problem | 0.64 | 0.64 | 0.62 |
| A7 | Supplier delivery delays | 0.67 | 0.73 | 0.63 |
| A8 | Increase in raw material prices | 0.66 | 0.75 | 0.61 |
| A9 | Supplier communication failure | 0.67 | 0.77 | 0.59 |
| A10 | Upstream cargo damage | 0.51 | 0.56 | 0.43 |
| A11 | Forecasting errors | 0.66 | 0.75 | 0.61 |
| A12 | Inventory shortage | 0.58 | 0.69 | 0.50 |
| A13 | Machine breakdown | 0.67 | 0.77 | 0.59 |
| A14 | IT system failure | 0.61 | 0.72 | 0.53 |
| A15 | Underutilized capacity | 0.40 | 0.39 | 0.31 |
| A16 | Lead times | 0.34 | 0.33 | 0.23 |
| A17 | Troubling third-party logistics | 0.41 | 0.32 | 0.44 |
© 2019 by the authors. Licensee MDPI, Basel, Switzerland. This article is an open access article distributed under the terms and conditions of the Creative Commons Attribution (CC BY) license (http://creativecommons.org/licenses/by/4.0/).
Share and Cite
MDPI and ACS Style
Junaid, M.; Xue, Y.; Syed, M.W.; Li, J.Z.; Ziaullah, M. A Neutrosophic AHP and TOPSIS Framework for Supply Chain Risk Assessment in Automotive Industry of Pakistan. Sustainability 2020, 12, 154. https://doi.org/10.3390/su12010154
AMA Style
Junaid M, Xue Y, Syed MW, Li JZ, Ziaullah M. A Neutrosophic AHP and TOPSIS Framework for Supply Chain Risk Assessment in Automotive Industry of Pakistan. Sustainability. 2020; 12(1):154. https://doi.org/10.3390/su12010154
Chicago/Turabian StyleJunaid, Muhammad, Ye Xue, Muzzammil Wasim Syed, Ji Zu Li, and Muhammad Ziaullah. 2020. "A Neutrosophic AHP and TOPSIS Framework for Supply Chain Risk Assessment in Automotive Industry of Pakistan" Sustainability 12, no. 1: 154. https://doi.org/10.3390/su12010154
Note that from the first issue of 2016, this journal uses article numbers instead of page numbers. See further details here.