Article

Experimental Setup for Splash Erosion Monitoring—Study of Silty Loam Splash Characteristics

1
Faculty of Civil Engineering, Czech Technical University in Prague, Thákurova 7, 166 29 Prague 6, Czech Republic
2
Institute for Soil Physics and Rural Water Management, University of Natural Resources and Life Sciences, 1190 Vienna, Austria
3
Federal Agency for Water Management, Institute for Land & Water Management Research, 3252 Petzenkirchen, Austria
*
Author to whom correspondence should be addressed.
Sustainability 2020, 12(1), 157; https://doi.org/10.3390/su12010157
Submission received: 21 November 2019 / Revised: 16 December 2019 / Accepted: 22 December 2019 / Published: 24 December 2019
(This article belongs to the Special Issue Soil Erosion and Sustainable Land Management (SLM))

Abstract

:
An experimental laboratory setup was developed and evaluated in order to investigate detachment of soil particles by raindrop splash impact. The soil under investigation was a silty loam Cambisol, which is typical for agricultural fields in Central Europe. The setup consisted of a rainfall simulator and soil samples packed into splash cups (a plastic cylinder with a surface area of 78.5 cm2) positioned in the center of sediment collectors with an outer diameter of 45 cm. A laboratory rainfall simulator was used to simulate rainfall with a prescribed intensity and kinetic energy. Photographs of the soil’s surface before and after the experiments were taken to create digital models of relief and to calculate changes in surface roughness and the rate of soil compaction. The corresponding amount of splashed soil ranged between 10 and 1500 g m−2 h−1. We observed a linear relationship between the rainfall kinetic energy and the amount of the detached soil particles. The threshold kinetic energy necessary to initiate the detachment process was 354 J m−2 h−1. No significant relationship between rainfall kinetic energy and splashed sediment particle-size distribution was observed. The splash erosion process exhibited high variability within each repetition, suggesting a sensitivity of the process to the actual soil surface microtopography.

Graphical Abstract

1. Introduction

The initial stage of the erosion process (splash erosion) occurs when raindrops with high kinetic energy hit bare soil, breaking down aggregates and detaching soil particles. Such particles are translocated a short distance from the raindrop’s impact and they then settle on the soil’s surface and block the interaggregate pores reducing the topsoil’s infiltration capacity and accelerating the formation of surface runoff. Hence, understanding the relationships between various rainfall characteristics and splash erosion is important to be able to predict the dominant runoff mechanisms of unprotected soils and to determine the rainfall kinetic energy threshold for erosion initiation.
Various monitoring techniques have been developed over the years to measure the degree of soil detachment in relation to the kinetic energy of raindrops. Besides splash cups (which are used in this study), splash boards or tracers have also been used in previous studies (as reviewed by Fernández-Raga et al. [1]). When monitoring splash erosion, there are several considerations to take into account when developing study design:
(A) collection mechanism:
  • detached soil is splashed into a collector located around the soil sample (e.g., [2], Figure 1a)
  • detached soil is splashed into a collector surrounded by the soil material (e.g., [3,4,5], Figure 1b)
(B) sample preparation:
  • disturbed soil sample (e.g., [6,7])
  • in situ undisturbed soil (e.g., [2,3,4]).
Each approach has its advantages and disadvantages. One needs to estimate the contributing area of the surrounding soil (Figure 1b), otherwise it is not possible to calculate the detached soil amount per specific area. This problem occurs (to some extent) in the Morgan setup [2] because some soil particles are transported within the sampling area (Figure 1a). Therefore, the optimum sampling area is a tradeoff between underestimating the splash, representativeness of the collected sample, as well as ease of sample handling [3].
Wei et al. [8] showed that the splash erosion rate is dependent on soil sample water saturation and texture. Sandy soil was not sensitive to degree of saturation whereas samples with increasing clay content were, and similar results were reported by Khaledi Darvishan et al. [9]. To the contrary, Watung et al. [10] did not observe any significant difference in soil splash under variable saturated conditions for tropical soil (Oxisol). Utilizing disturbed soil samples allows for the control of soil sample conditions. In situ measurement on undisturbed samples does not allow for the control of soil conditions; on the other hand the measurement may be more representative for a given location since soil structure and soil surface characteristics are preserved. Therefore, there are a lot of factors to consider when designing an experimental setup.
The splash-collecting device needs to have sufficient dimensions to trap most of the detached particles. As Leogun et al. [11] and Marzen et al. [12] showed, the amount of detached soil decreases exponentially with increasing distance from the soil sample. The transport splash distance increases with decreasing soil particle size. Fu et al. [13] added that the splashed distance is not only related to particle or aggregate sizes, but also to rainfall kinetic energy.
Transport distances ranged between 10 cm and 20 cm for aggregates with diameters between 0.5 mm and 1 mm and up to 35 cm for soil aggregates with diameters from 0.05 mm to 0.5 mm in a study by Legout et al. [11]. Most of the splashed particles were observed within 20 cm from the soil sample in Fu et al. [14] and within 35 cm in [12].
The most common problem with splash erosion experiments is that it is difficult to compare results across studies due to each author’s differing experimental setup [15]. Many different splash cup setups with various sizes and trapping principles have been used to measure splash erosion. Pioneering studies were performed using single soil fractions and cylindrically shaped cups [16,17,18]. Kinnell [6] added a thin external ring around the soil sample to exclude surface runoff which may occur during ponding conditions. Scholten et al. [7] developed splash cups in which sample saturation was controlled, their setup maintained nearly constant water content of the sample, and allowed for the simultaneous draining of rainfall. Two types of splash cups (cups and funnels) were compared by Fernández-Raga et al. [4]. The funnels collected systematically more particles because they prevent particle transport back to the surrounding soil (backsplash). The most frequently used splash cup design is inspired by Morgan (1981) (for example, [9,19,20,21,22]). In all studies reported above, the sediment loss was determined by weighing the dry sample prior to and after the measurement period. The Morgan setup is also suitable for use in both indoor and outdoor conditions with disturbed or undisturbed soil samples.
In general, the splash erosion process is very complex and the reported results usually exhibit high variability. Angulo-Martinez et al. [23] evaluated the effects of rainfall characteristics, rainfall erosivity index and soil type with a linear mixed-effects model. The rainfall erosivity index explained 55% of the data variability but soil type did not have a statistically significant influence on erosion. Up to 74% of the variability within a single soil type was attributed to random effects. The role of slope (and upward/downward splash) and rainfall intensity were investigated. It was reported that slope altered the splashed particle-size distribution and the role of slope for total splashed material varied for various rainfall intensities [22]. The rainfall itself is also a very important factor, and authors emphasize the need of accurate drop-shape estimation in order to obtain adequate kinetic energy of the rainfall. Rainfall changes the surface microtopography [24] which may have further effects on water infiltration, surface water retention and surface runoff [25]. A common method for the analysis of surface relief changes is close-range photogrammetry [26]. It has been shown that especially loose soils are prone to a fast decrease in microrelief roughness, leading to accelerated soil erosion [27,28].
Rainfall kinetic energy (KE) is often estimated based on measured rainfall intensity (KE-I relationship) due to the lack of a direct rainfall kinetic energy measurement [29]. Lobo and Monilla [30] tested several KE-I relationships for various geographical locations and concluded that parameters of the KE-I relationships are site specific. Meshesa et al. [31] tested parametric relationships between rainfall intensity and rainfall kinetic energy using artificial rainfall, noting that artificial rainfall exhibits raindrops with different sizes than natural rainfall. Therefore, KE-I relationships derived under natural conditions should not be applied to rainfall simulators.
The relationship between the rainfall kinetic energy and the amount of splash erosion on a bare surface varies for different soil types and tillage practices. Most of the studies of splash erosion on real soils come from arid or semi-arid climates, such as the Mediterranean region, Loess Plateau of China or southern states of the USA [1]. In Central Europe, soil erosion processes have been studied extensively, but splash erosion has not usually been considered or evaluated. Rainfall in Central Europe often does not generate overland flow (due to low intensity and/or short duration), but soil detachment and resulting soil surface changes take place from the impact of first drops with sufficient kinetic energy [32]. The lack of knowledge of splash erosion rates on agriculturally cultivated Cambisols is the main motivation for the presented research.
In this study we present a splash erosion experimental setup which utilizes techniques from previously published works. We utilize the Morgan design and provide an open-source, easy to manufacture splash cup. The objective of these experiments is to determine the impact of rainfall kinetic energy on splash detachment for a typical agricultural soil in Central Europe. An associated aim is to evaluate the particle-size distribution of the eroded material and to analyze the effects of the rainfall kinetic energy on soil consolidation.

2. Materials and Methods

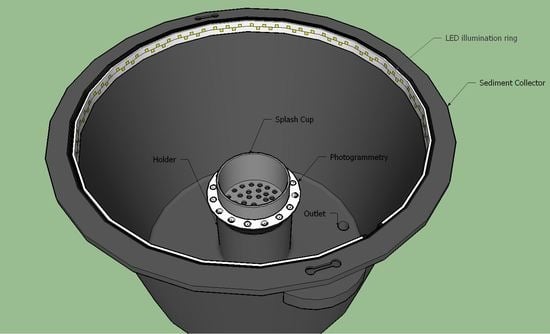
2.1. Splash Erosion Collection Device

The monitoring setup is designed for both indoor and outdoor measurements and is similar to the system proposed by Morgan [2].
The monitoring device includes (Figure 2): (1) the sediment collector, (2) the cylindric splash cup, (3) the photogrammetry reference targets, (4) the LED illumination ring, (5) the outlet for the sediment collection and (6) the splash cup holder. The sizes and proportions of the device components and the angle between the rim of the splash cup and the collector were adjusted to capture the maximum amount of splashed soil while allowing unchanged raindrop impact on the soil sample.
The splash cup (2 in Figure 2) consists of a polypropylene cylinder with a height of 60 mm, inner diameter of 100 mm and a surface area of 7854 mm2. The cylinder’s wall is 2.7 mm thick and the upper rim of the splash cup is sharpened. The bottom of the cup is perforated in order to allow for draining of percolated water. A fine mesh is placed in the bottom of the cup to prevent soil loss during manipulation and water percolation. Each tested soil is filled to one centimeter below the rim of the splash cup to prevent runoff in case of ponding water on the sample’s surface. The sediment collector’s purpose is to capture eroded (splashed) soil particles. Its walls are angled in order to funnel the water with soil particles to the outlet (5 in Figure 2) which leads to a storage bucket under the sediment collector. In the center, there is a holder (6 in Figure 2) which is used to support the splash cup above the sediment collector’s base so that the soil sample is protected from the backsplash of soil particles that accumulate inside the collector. The holder does not have a bottom, therefore, water percolating through the soil sample can freely drip out. This water is not usually collected. The collector is made from a commercially available polypropylene bucket, and all the firmly attached components (the holder and the outlet) are butt welded to the collector. The CAD drawings of the splash cup’s components as well as mounting procedure are freely available here: rain.fsv.cvut.cz/splashcup.
After every experiment, the detached particles still attached to the collector’s walls or settled on the collector’s bottom were washed into the outlet and added to the remaining eroded particles. The suspension of the collected sediment and rainfall water was then filtered, oven dried and weighed.
The splash erosion device was then prepared for photogrammetrical analysis of soil sample surface changes due to rainfall impact. Typically, 10 to 15 referenced photographs from different angles were taken for the successful reconstruction of a digital surface model. Therefore, around the splash cup there is a white ring with the photogrammetry reference targets (3 in Figure 2). An LED illumination ring (4 in Figure 3) was attached to the sediment collector to provide adequate illumination to ensure that there were no shadows on the surface. The specification of the LED light strip was: chromaticity 4250 K, power 12 W/m, 60 LEDs/m, luminous flux 1050 lm/m.

2.2. Soil Sample Preparation and Analysis

The soil used for testing of the splash collection system was taken from a topsoil horizon (upper 10 cm) of a cultivated field at the experimental site of Bykovice in Central Bohemia, Czech Republic. The soil type is classified as a Cambisol, and the texture corresponds to silty loam according to the World Reference Base (WRB) classification [33] (12.7% sand, 76.6% silt, 10.7% clay), CaCO3 content is <0.92%, pH 6.9, and total organic carbon 1.7%.
Soil was collected in April 2017 during seedbed conditions. The soil was transported to the laboratory, stripped of large organic residues (stems, roots), large clods and stones, and then air dried.
Collected soil was sieved to remove particles and aggregates larger than 10 mm before filling the splash cup. A piece of permeable geotextile was placed inside the cup to prevent the soil from passing through the splash cup’s perforations. The splash cup was then loosely packed with the same amount of prepared soil to reach a similar bulk density to that of seedbed conditions (0.83 g cm−3). The soil sample was not compacted; we only distributed soil aggregates equally along the sample surface and removed any remaining organic residues. Then, the filled splash cups were placed inside the sediment collectors so that the splash cup’s surface was level.
After each rainfall simulation the eroded soil particles were carefully washed out from the sediment collector, and the suspension of rain water and eroded sediment was transferred to the laboratory. The obtained sample was filtered on a paper filter with a mesh size of 5 mm, oven dried (at 40 °C) and weighed.
The dried soil was further analyzed using a laser diffraction particle-size analyzer (Mastersizer 3000, Malvern Panalytical Ltd., UK) to determine soil texture. We mixed the splashed material from all the repetitions to obtain enough soil for this analysis. Each soil sample was dispersed in distilled water and placed into an ultrasonic bath for 320 s to disaggregate the soil. Then the sample was analyzed by the laser diffractometer. Measurements were repeated 25 times for every sample. The procedure is described in detail by Kubínová [34].

2.3. Rainfall Simulation

A laboratory Norton Ladder type rainfall simulator was used to generate rainfall. The simulator had an experimental area of 0.9 × 4 m. The rainfall was produced by eight oscillating nozzles, type Veejet 80100, which were mounted in two parallel sections at 2.6 m above the soil samples. Tap water was used, water pressure was set to 32 kPa and rainfall intensity was controlled by the nozzle oscillating frequency. The average raindrop diameter generated by the simulator was 2.3 mm according to monitoring with disdrometers [35].
In this experiment we took advantage of the fact that rainfall intensity spatially varies over the experimental plot. Eleven positions with the rainfall intensity between 20 and 70 mm h−1 were chosen for further testing. Figure 3 shows the spatial distribution of rainfall intensity. The pattern is based on the intensity measurements of the splash cup positions and inverse distance weighted interpolation. The rainfall kinetic energy was measured with the Laser Precipitation Monitor (LPM) by Thies Clima® and the KE-I relationship for the given rainfall simulator was established in advance of the splash erosion simulations. The rainfall simulation lasted 15 min, then the soil samples were collected and the splashed amount was analyzed. The whole procedure was repeated five times (totaling 55 samples analyzed).

3. Results and Discussion

The measured relationship between rainfall intensity and rainfall kinetic energy is shown in Figure 4. The observed trend of the KE-I is linear with the slope of 18.69. Compared to the published relationships for natural rainfall (e.g., [36,37,38,39]) the KE of the simulated rainfall is lower by approximately 35%. Similar results show that underestimation of the simulated rainfall kinetic energy were also obtained by Petrů and Kalibová [40]. The KE-I relationship is strongly dependent on the rainfall simulator design, nozzle types and water pressure (e.g., simulators generating larger raindrops than the natural rainfall overestimate KE) [31].
The measured soil splash rate ranged between 10 and 2012 g m−2 h−1 for rainfall kinetic energy between 380 and 1450 J m2 h−1. The threshold kinetic energy needed to initiate the detachment process was identified by extrapolation to be 354 J m−2 h−1. The recorded mass of the detached particles exhibits large variability across the five replicates at each position (Figure 5). The variability was higher for the positions where higher soil erosion was recorded (positions with higher rainfall intensity and kinetic energy). Similar variability during comparable experiments was reported in literature [23]. The variability could be explained by very complex soil erosion behavior which is influenced by size distribution and arrangement of the soil particles and aggregates on the sample’s surface (random roughness).
The overall relationship between the mass of the eroded particles and the rainfall kinetic energy has a linear trend (Figure 5). The coefficient of determination is 0.7 which is higher than or in a similar range as presented in comparable studies (e.g., [6,15,41]). Table 1 summarizes selected splash erosion experiments from the literature to show how the experiments vary in setup. They show similar, most often linear, relationships between the amount of detached soil particles and various rainfall characteristics. The slope of the linear trendline differs in each study because of differing experimental setups (rainfall duration, sample preparation) and soil properties [6,15,42]. Bisal [17] and Mazurak and Mosher [18] already experimentally showed that the splashed amount is linearly dependent on drop size and velocity. Surprisingly, in contrast to the more recently published studies, Bisal [17] did not find a significant relationship between rainfall intensity and the amount of sand splashed as long as no ponding occurred on the sand’s surface.
The observed splash–KE trendline is strongly influenced by duration of the rainfall experiment. Splash erosion varies over time, especially in the case of structured soils with developed aggregates that are initially broken down into smaller fractions by raindrops. It has been observed that the splash increases with decreasing aggregate size [45,46] and increasing event duration [47,48]. The fact that splash erosion is strongly dependent on surface microtopography is another reason why it is difficult to compare results across studies. Artificial samples filled with smooth, fine-grained sand produce different erosion than natural soils with higher surface roughness and particle cohesion. This is, as noted above, due to the smaller size of individual particles, but is also due to microrelief variation. The effect of surface roughness on splash erosion is not a straightforward process [49]. Some authors found decreasing erosion with increasing roughness [50], and some the opposite trend [49]. The changes in surface microrelief in one sample (applied kinetic energy of 1150 J m−2 h−1, recorded average soil surface consolidation of 0.75 mm) is shown in Figure 6. The soil surface consolidated due to rainfall and splash erosion. Figure 7 shows the linear relationship between rainfall kinetic energy and soil consolidation even though the measured soil settling is very heterogeneous and the coefficient of determination is low.
Analysis of the splashed material particle-size distribution (PSD) did not show a significant relationship between rainfall kinetic energy (KE) and detached sediment texture (Figure 8). The Pearson’s correlation coefficient of KE versus clay content was 0.36 (p-value 0.39, for a = 0.05), KE versus silt −0.22 (p-value 0.61) and KE versus sand −0.24 (p-value 0.56). The PSD of the detached sediment is not significantly different from the texture of the original soil sample (see the horizontal dashed lines on Figure 7). Therefore, all particle fractions are detached uniformly with no preference toward fine or coarse fractions, no matter the kinetic energy applied. It is important to note that the splashed sediment is usually detached in the form of aggregates and therefore the aggregate size distribution should be evaluated. We have not done this analysis as we were not able to collect the undisturbed splashed soil aggregates. For example, Fu et al. [13] show that especially the fine particle and aggregate (<0.053 mm) ratios change with variable rainfall KE. The KE per mm of rainfall is the same for all the measured points shown in Figure 8, which is due to the design of the rainfall simulator. The results may change if different types of the rainfall simulators (with various drop size distribution or drop velocities) are applied.
Fernández-Raga et al. [15] demonstrated that splash erosion estimation is strongly dependent on the splash collection setup. Poesen and Torri [3] found that the area of the splash cup is the main influencer defining the amount splashed and therefore coefficients for different splash cup areas should be used. Even the trendline between the amount splashed and the rainfall kinetic energy differs based on the methodology of collection. The experimental design proposed in this study, a modified version of Morgan’s splash cup, proved to be reliable, practical and easy to handle. As the splash cups are compact, light, and robust, they can be easily mounted to any support mechanism either in the laboratory and in the terrain. Due to the materials used, the device is durable and can be used for several seasons under field conditions. The soil sample can be packed separately from the collection tray and fixed to its position just before the rainfall experiment.

4. Conclusions

A splash cup methodology was presented and used to analyze splash erosion of a silty loam agricultural topsoil with simulated rainfall across various kinetic energies.
The splash cup, which consists of commercially available components, proved to be a versatile and practical tool for the monitoring of splash erosion. The design follows the dimensions proposed by Morgan, therefore, the splash cup can be used for comparison with other studies in which Morgan’s device was employed. Even though the soil particle detachment process is very sensitive to factors other than experimental design, standardization or harmonization of splash cup designs would be a beneficial step forward in the complex research area of the splash erosion process. Therefore, we provide a detailed description of the splash erosion setup, including technical drawings, assembly manual and description of sample preparation and collection on the website rain.fsv.cvut.cz/splashcup.
The results of the presented splash erosion experiment show similar results to previously published studies. The relationship between rainfall kinetic energy and splashed soil amount is linear and there is a kinetic energy threshold to initiate erosion. Even under controlled experimental conditions, when the soil samples were prepared the same way and rainfall characteristics remained constant during the experiment, the eroded soil amount varies across each replicate. This reinforces that splash erosion is a very complex process and the resulting erosion is sensitive to small changes in soil properties and soil surface relief which is problematic and remains an open question that needs to be studied further.

Author Contributions

Conceptualization, D.Z. and T.D.; Formal analysis, D.V.M., J.J., M.N., T.L., L.L.J. and N.Z.; Methodology, D.Z. and P.K.; Project administration, T.D. and A.K.; Supervision, A.K., P.S. and T.D.; Visualization, D.V.M., T.L. and J.J.; Writing—original draft, D.Z.; Writing—review & editing, All. All authors have read and agreed to the published version of the manuscript.

Funding

This research was performed within the project “Kinetic energy of rainfall as a driving force of soil detachment and transport”. Financial support was provided through the Czech Science Foundation (GACR): GF17-33751L and the Austrian Science Fund (FWF): I 3049-N29.

Conflicts of Interest

The authors declare no conflict of interest.

References

  1. Fernández-Raga, M.; Palencia, C.; Keesstra, S.; Jordán, A.; Fraile, R.; Angulo-Martínez, M.; Cerdà, A. Splash erosion: A review with unanswered questions. Earth-Sci. Rev. 2017, 171, 463–477. [Google Scholar] [CrossRef] [Green Version]
  2. Morgan, R.P.C. Field measurement of splash erosion. Int. Assoc. Sci. Hydrol. Publ. 1981, 133, 373–382. [Google Scholar]
  3. Poesen, J.; Torri, D. The effect of cup size on splash detachment and transport measurements. Part I. Field measurements. Geomorphic Process. Environ. Strong Seas. Contrasts Vol. I Hillslope Process. Catena Suppl. 1988, 12, 113–126. [Google Scholar]
  4. Fernández-Raga, M.; Fraile, R.; Keizer, J.J.; Teijeiro, M.E.V.; Castro, A.; Palencia, C.; Calvo, A.I.; Koenders, J.; Marques, R.L.D.C. The kinetic energy of rain measured with an optical disdrometer: An application to splash erosion. Atmos. Res. 2010, 96, 225–240. [Google Scholar] [CrossRef]
  5. Truman, C.C.; Bradford, J.M. Soil Science Society of America journal. Soil Sci. Soc. Am. J. 1976, 59, 519–526. [Google Scholar] [CrossRef]
  6. Kinnell, P.I.A. Splash Erosion: Some Observations on the Splash-Cup Technique 1. Soil Sci. Soc. Am. J. 1974, 38, 657–660. [Google Scholar] [CrossRef]
  7. Scholten, T.; Geißler, C.; Goc, J.; Kühn, P.; Wiegand, C. A new splash cup to measure the kinetic energy of rainfall. J. Plant Nutr. Soil Sci. 2011, 174, 596–601. [Google Scholar] [CrossRef]
  8. Wei, Y.; Wu, X.; Cai, C. Splash erosion of clay–sand mixtures and its relationship with soil physical properties: The effects of particle size distribution on soil structure. Catena 2015, 135, 254–262. [Google Scholar] [CrossRef]
  9. Khaledi Darvishan, A.; Sadeghi, S.H.; Homaee, M.; Arabkhedri, M. Measuring sheet erosion using synthetic color-contrast aggregates. Hydrol. Process. 2014, 28, 4463–4471. [Google Scholar] [CrossRef]
  10. Watung, R.L.; Sutherland, R.A.; El-Swaify, S.A. Influence of rainfall energy flux density and antecedent soil moisture content on splash transport and aggregate enrichment ratios for a Hawaiian Oxisol. Soil Technol. 1996, 9, 251–272. [Google Scholar] [CrossRef]
  11. Legout, C.; Leguedois, S.; Le Bissonnais, Y.; Issa, O.M. Splash distance and size distributions for various soils. Geoderma 2005, 124, 279–292. [Google Scholar] [CrossRef]
  12. Marzen, M.; Iserloh, T.; Casper, M.C.; Ries, J.B. Quantification of particle detachment by rain splash and wind-driven rain splash. CATENA 2015, 127, 135–141. [Google Scholar] [CrossRef]
  13. Fu, Y.; Li, G.; Wang, D.; Zheng, T.; Yang, M. Raindrop Energy Impact on the Distribution Characteristics of Splash Aggregates of Cultivated Dark Loessial Cores. Water 2019, 11, 1514. [Google Scholar] [CrossRef] [Green Version]
  14. Fu, Y.; Li, G.; Zheng, T.; Li, B.; Zhang, T. Splash detachment and transport of loess aggregate fragments by raindrop action. Catena 2017, 150, 154–160. [Google Scholar] [CrossRef]
  15. Fernández-Raga, M.; Campo, J.; Rodrigo-Comino, J.; Keesstra, S.D. Comparative Analysis of Splash Erosion Devices for Rainfall Simulation Experiments: A Laboratory Study. Water 2019, 11, 1228. [Google Scholar] [CrossRef] [Green Version]
  16. Bisal, F. Calibration of splash cup for soil erosion studies. Agric. Eng. 1950, 31, 621–622. [Google Scholar]
  17. Bisal, F. The effect of raindrop size and impact velocity on sand-splash. Can. J. Soil Sci. 1960, 40, 242–245. [Google Scholar] [CrossRef] [Green Version]
  18. Mazurak, A.P.; Mosher, P.N. Detachment of Soil Particles in Simulated Rainfall 1. Soil Sci. Soc. Am. J. 1968, 32, 716–719. [Google Scholar] [CrossRef]
  19. Vigiak, O.; Okoba, B.O.; Sterk, G.; Groenenberg, S. Modelling catchment-scale erosion patterns in the East African Highlands. Earth Surf. Process. Landf. 2005, 30, 183–196. [Google Scholar] [CrossRef]
  20. Vigiak, O.; Sterk, G.; Romanowicz, R.J.; Beven, K.J. A semi-empirical model to assess uncertainty of spatial patterns of erosion. Catena 2006, 66, 198–210. [Google Scholar] [CrossRef]
  21. Moghadam, B.K.; Jabarifar, M.; Bagheri, M.; Shahbazi, E. Effects of land use change on soil splash erosion in the semi-arid region of Iran. Geoderma 2015, 241, 210–220. [Google Scholar] [CrossRef]
  22. Sadeghi, S.H.; Harchegani, M.K.; Asadi, H. Variability of particle size distributions of upward/downward splashed materials in different rainfall intensities and slopes. Geoderma 2017, 290, 100–106. [Google Scholar] [CrossRef]
  23. Angulo-Martinez, M.; Beguería, S.; Navas, A.; Machin, J. Splash erosion under natural rainfall on three soil types in NE Spain. Geomorphology 2012, 175, 38–44. [Google Scholar] [CrossRef]
  24. Dexter, A.R. Effect of rainfall on the surface micro-relief of tilled soil. J. Terramechanics 1977, 14, 11–22. [Google Scholar] [CrossRef]
  25. Assouline, S.; Mualem, Y. Modeling the dynamics of seal formation and its effect on infiltration as related to soil and rainfall characteristics. Water Resour. Res. 1997, 33, 1527–1536. [Google Scholar] [CrossRef]
  26. Bretar, F.; Arab-Sedze, M.; Champion, J.; Pierrot-Deseilligny, M.; Heggy, E.; Jacquemoud, S. An advanced photogrammetric method to measure surface roughness: Application to volcanic terrains in the Piton de la Fournaise, Reunion Island. Remote Sens. Environ. 2013, 135, 1–11. [Google Scholar] [CrossRef]
  27. de Oro, L.A.; Buschiazzo, D.E. Degradation of the soil surface roughness by rainfall in two loess soils. Geoderma 2011, 164, 46–53. [Google Scholar] [CrossRef]
  28. Luo, J.; Zheng, Z.; Li, T.; He, S. Spatial heterogeneity of microtopography and its influence on the flow convergence of slopes under different rainfall patterns. J. Hydrol. 2017, 545, 88–99. [Google Scholar] [CrossRef]
  29. Angulo-Martínez, M.; Beguería, S.; Kyselý, J. Use of disdrometer data to evaluate the relationship of rainfall kinetic energy and intensity (KE-I). Sci. Total Environ. 2016, 568, 83–94. [Google Scholar] [CrossRef] [Green Version]
  30. Lobo, G.P.; Bonilla, C.A. Sensitivity analysis of kinetic energy-intensity relationships and maximum rainfall intensities on rainfall erosivity using a long-term precipitation dataset. J. Hydrol. 2015, 527, 788–793. [Google Scholar] [CrossRef]
  31. Meshesha, D.T.; Tsunekawa, A.; Tsubo, M.; Haregeweyn, N.; Tegegne, F. Evaluation of kinetic energy and erosivity potential of simulated rainfall using Laser Precipitation Monitor. CATENA 2016, 137, 237–243. [Google Scholar] [CrossRef]
  32. Bauer, B. Soil splash as an important agent of erosion. Geogr. Pol. 1990, 58, 99–106. [Google Scholar]
  33. Chesworth, W.; Camps Arbestain, M.; Macías, F.; Spaargaren, O.; Spaargaren, O.; Mualem, Y.; Morel-Seytoux, H.J.; Horwath, W.R.; Almendros, G.; Chesworth, W.; et al. Classification of Soils: World Reference Base (WRB) for Soil Resources; Springer: Dordrecht, The Netherlands, 2008; pp. 120–122. [Google Scholar]
  34. Kubínová, R. Grain Size Distribution of Eroded Soil. Master’s Thesis, Faculty of Civil Engineering, Czech Techical University in Prague, Prague, Czech Republic, 2019. [Google Scholar]
  35. Kavka, P.; Neumann, M.; Laburda, T.; Zumr, D. Developing of the laboratory rainfall simulator for testing the technical soil surface protection measures and droplets impact. In Proceedings of the XVII ECSMGE-2019 European Conference on Soil Mechanics and Geotechnical Engineering, Reykjavik, Iceland, 1–6 September 2019. [Google Scholar]
  36. Van Dijk, A.I.J.; Bruijnzeel, L.; Rosewell, C. Rainfall intensity–kinetic energy relationships: A critical literature appraisal. J. Hydrol. 2002, 261, 1–23. [Google Scholar] [CrossRef]
  37. Steiner, M.; Smith, J.A.; Steiner, M.; Smith, J.A. Reflectivity, Rain Rate, and Kinetic Energy Flux Relationships Based on Raindrop Spectra. J. Appl. Meteorol. 2000, 39, 1923–1940. [Google Scholar] [CrossRef]
  38. Wischmeier, W.H.; Smith, D.D. Predicting Rainfall Erosion Losses—A Guide to Conservation Planning; Science and Education Administration United States Department of Agriculture: Hyattsville, MD, USA, 1978; p. 58. [Google Scholar]
  39. Brown, L.C.; Foster, G.R. Storm Erosivity Using Idealized Intensity Distributions. Trans. ASABE 1987, 30, 0379–0386. [Google Scholar] [CrossRef]
  40. Petrů, J.; Kalibová, J. Measurement and computation of kinetic energy of simulated rainfall in comparison with natural rainfall. Soil Water Res. 2018, 13, 226–233. [Google Scholar]
  41. Geißler, C.; Kühn, P.; Böhnke, M.; Bruelheide, H.; Shi, X.; Scholten, T. Splash erosion potential under tree canopies in subtropical SE China. CATENA 2012, 91, 85–93. [Google Scholar] [CrossRef]
  42. Angulo-Martínez, M.; Beguería, S.; Latorre, B.; Fernández-Raga, M. Comparison of precipitation measurements by OTT Parsivel2 and Thies LPM optical disdrometers. Hydrol. Earth Syst. Sci. 2018, 22, 2811–2837. [Google Scholar] [CrossRef] [Green Version]
  43. Boroghani, M.; Hayavi, F.; Noor, H. Affectability of splash erosion by polyacrylamide application and rainfall intensity. Soil Water Res. 2012, 7, 159–165. [Google Scholar] [CrossRef] [Green Version]
  44. Wu, B.; Wang, Z.; Zhang, Q.; Shen, N.; Liu, J. Evaluating and modelling splash detachment capacity based on laboratory experiments. CATENA 2019, 176, 189–196. [Google Scholar] [CrossRef]
  45. Farres, P.J. The dynamics of rainsplash erosion and the role of soil aggregate stability. CATENA 1987, 14, 119–130. [Google Scholar] [CrossRef]
  46. Ekwue, E.I. The effects of soil organic matter content, rainfall duration and aggregate size on soil detachment. Soil Technol. 1991, 4, 197–207. [Google Scholar] [CrossRef]
  47. Ma, R.-M.; Li, Z.-X.; Cai, C.-F.; Wang, J.-G. The dynamic response of splash erosion to aggregate mechanical breakdown through rainfall simulation events in Ultisols (subtropical China). CATENA 2014, 121, 279–287. [Google Scholar] [CrossRef]
  48. Rezaei Arshad, R.; Mahmoodabadi, M.; Farpoor, M.H.; Fekri, M. Experimental investigation of rain-induced splash and wash processes under wind-driven rain. Geoderma 2019, 337, 1164–1174. [Google Scholar] [CrossRef]
  49. Luo, J.; Zheng, Z.; Li, T.; He, S. Assessing the impacts of microtopography on soil erosion under simulated rainfall, using a multifractal approach. Hydrol. Process. 2018, 32, 2543–2556. [Google Scholar] [CrossRef]
  50. Helming, K.; Roth, C.H.; Wolf, R.; Diestel, H. Characterization of rainfall-microrelief interactions with runoff using parameters derived from digital elevation models (DEMs). Soil Technol. 1993, 6, 273–286. [Google Scholar] [CrossRef]
Figure 1. Two methods to collect detached soil particles: (a) collector is around the soil sample; (b) collector is surrounded by the sampled soil.
Sustainability 12 00157 g001
Figure 2. Splash erosion device and its parts and dimensions (units in centimeters).
Sustainability 12 00157 g002
Figure 3. Sketch of the 10 fixed positions and the rainfall intensity distribution below the nozzles. The positions of four nozzles used in the experiment are depicted with a spray symbol, and the X marks denote additional positions where the rainfall intensity was also measured.
Sustainability 12 00157 g003
Figure 4. Measured relationship between simulated rainfall intensity and kinetic energy.
Sustainability 12 00157 g004
Figure 5. Relationships between rainfall intensity (A) and rainfall kinetic energy (B) and splash erosion rate. The bars stand for standard deviation, the marker denotes the mean value.
Sustainability 12 00157 g005
Figure 6. Soil sample surface before and after simulated rainfall. The lower photos represent digital surface models (DSM) in which green areas have higher elevation than the red areas. The soil surface consolidated in the average by 0.75 mm.
Sustainability 12 00157 g006
Figure 7. Relationship between rainfall kinetic energy and soil surface settling.
Sustainability 12 00157 g007
Figure 8. Relationship between rainfall kinetic energy and textural classes (clay, silt, sand) of detached sediment. The dashed lines represent the texture of the Bykovice soil. No significant difference between the soil sample and splashed sediment was observed.
Sustainability 12 00157 g008
Table 1. Comparison of the results with the published splash erosion studies.
ReferenceSoilSample Preparation, Experiment SpecificationsRainfall Intensity (mm h−1)Rainfall Kinetic Energy (J m−2 mm−1)Splash–Rainfall Relationship
Bisal 1960 [17,18]SandLeveled with the rim76–152-No significant relationship (R2 = 0.31)
Angulo-Martinez et al. 2012 [23]Silty soilLeveled 25 mm below the rim, under natural rainfall12–932–12Linear function
Geissler et al., 2012 [41]Fine sandLeveled with the rim; measured under forest vegetation where the throughfall’s KE is reported as 2.53 times higher1–45-Linear function (R2 = 0.74)
Boroghani et al., 2012 [43]Silt-clay-loamNot known, only three datapoints measured69–120-Linear function (R2 = 0.91)
Wu et al., 2019 [44]Silty loam, seedbed conditionsLeveled with the rim48–1504–7Polynomial function
Fernández-Raga et al., 2019 [15]Fine sandLeveled to the rim38–16026–29Linear function (R2 = 0.18)
This studySilty loam, seed bed conditions (Cambisol)Leveled 10 mm below the rim19–7811Linear function (R2 = 0.70)

