Is Sustainable Watershed Management Feasible under Climate Change? An Economic Appraisal of the Nile River


1
Department of International Economics and Trade & Global Sustainable Development Economic Institute, Sunmoon University, Asan 31460, Korea
2
Program in Environmental Technology and Policy, Department of Environmental Engineering, Korea University, Sejong 30019, Korea
*
Author to whom correspondence should be addressed.
Sustainability 2020, 12(1), 162; https://doi.org/10.3390/su12010162
Submission received: 1 November 2019
/
Revised: 16 December 2019
/
Accepted: 19 December 2019
/
Published: 24 December 2019
(This article belongs to the Special Issue Common-Pool Resources and Sustainability)
Abstract
:Historically, the Nile, a well-known transboundary river, has been a major contributor to Egyptian economic growth in many ways but has suffered from sediment accumulation. Since anthropocentric activities on the Nile delta heavily rely on nutrient-rich sediment from the Ethiopian highland, sediment control schemes in the Aswan High Dam not only prolong the life of the dam but also increase the economic value of the watershed. The purpose of our study is to use an economic optimization approach to evaluate the feasibility of sustainable management of the Nile concerning climate change. The model considers significant anthropocentric effects on the reservoir as well as the impacts of climate change on the entire watershed. Moreover, the social planner’s model is developed to unravel somewhat numerous externalities. The results indicate that among the various technically feasible sediment removal schemes, the hydro-suction sediment removal system (HSRS) is the only desirable solution under severe climate change. In order to control the negative externalities in the watershed, the in-stream flow control should be applied. By implementing appropriate management schemes simultaneously, the life of the AHD can be extended, and the total economic benefits of the entire watershed can be maximized to approximately $272 billion USD.
1. Introduction
Among a range of common-pool resource, transboundary water resource problems are one of the well-known examples introduced in the literature, but realistically, it is difficult to reach a middle ground. Although countless efforts from stakeholder groups have been carried out to derive meaningful solutions, the climate change vulnerability of water resources has recently aggravated the problems. A substantial amount of research has introduced how recent climate change impacts water resources (e.g., [1]). For example, in rivers, an increase in temperature causes a rise in the evaporation rate, which leads to a reduction in incoming water flow from upstream to downstream. The situation can be worsened when there is a dam downstream, since the decreased incoming water flow will eventually reduce the value of a reservoir [2]. Moreover, climate change also influences the exacerbation of upstream soil erosion, decreasing the storage capacity of a reservoir resulting from the higher sediment deposition [3]. Payne, et al. [4] investigated climate change impacts on the Glen Canyon Dam where its hydropower benefits were reduced by decreased precipitation and increased evaporation. On the contrary, climate change may increase runoff, which tends to occur during the wet season, whereas water availability may decrease during the dry season [5]. On top of the tragedy of commons, the impacts of climate change on water resources significantly worsen the situation for stakeholders to come up with a solution.
Recently, the Nile River, a well-known transboundary river and a typical example of a common-pool resource in the water domain, has become the arena for water conflicts between Egypt and Ethiopia due to a new River Nile dam construction. For thousands of years, Egyptians have relied on the waters from the Nile and without its waters, the most of the downstream turns into wilderness. When the upstream country, Ethiopia, builds a dam, critical problems may occur. In the short run, to fill the reservoir behind the dam may hold back more than a year’s flow of the Nile that creates a compulsory drought in Egypt. In the long run, the dam allows Sudan to take out more waters for massive irrigation because the Sudanese agriculture can only use a few months waters without the dam [6]. Moreover, the Nile has fundamental problems in that soil erosion from Ethiopia and Sudan reduces the original storage capacity of the Aswan High Dam (AHD), the only water source for Egypt, by approximately 36% [3].
There are a few examples that consider reservoir-level sedimentation. Palmieri et al. [7] developed a theoretical model for reservoir sedimentation and analyzed the optimal sediment removal management scheme. Pattanapanchai [8] expanded this model by incorporating upstream watershed management for multi-purpose dams. Kawashima [9] simulated cascading dam cases with impacts of sediment removal. Lee et al. [2,3] investigated integrated water resource management considering sedimentation and degradation of downstream water quality in the AHD. Since the River Nile flows over 6500 km with a range of different climatic zones, the impact of climate change on the basin has long been a topic of research. To simulate future Nile flows, general circulation models (GCMs) are employed, but its potential impact on Nile discharge was found to have a wide range of results, spanning from the positive to the negative [10]. For instance, Kim et al. [11] projected the precipitation of the Upper Blue Nile basin with annual precipitation changes from −7 to +28% by applying the SRES A2 scenario. On the contrary, Dile et al. [12] simulated the Gilgel Abay River, tributary to the Lake Tana, with the SRES A2 and B2 scenarios and concluded that there was a decrease in mean monthly precipitation by up to −30% during 2010–2040. From previous literature, there have been no studies that investigate the link between climate change impacts on water resources and economic value of the dam simultaneously. Note that no economic literature has investigated the holistic approach to consider sedimentation, water quality, and downstream impacts of dams with respect to recent climate change scenarios (e.g., the representative concentration pathway from the IPCC AR5, RCP) to date.
In this sense, the purpose of our study is to present an economic optimization approach to evaluate if sustainable management of the Nile River is feasible under climate change. Moreover, the social planner’s model is introduced to consider not only significant anthropocentric effects on the reservoir but also the climate change impacts on the watershed. This approach could bring a new pathway to solve common-pool resource problems in the water domain. A current-value Hamiltonian is applied with respect to three distinguished IPCC AR5 climate change scenarios. In addition, we selected RCP 4.5 as the baseline scenario which represented the status quo of the future climate change, RCP 2.6 and RCP 8.5 as the future optimistic and pessimistic climate change, respectively. Although these scenarios are used for analytical purpose of calculating the climate change impacts on a watershed, our attempt could fill the gap in previous literatures.
The rest of the paper is organized as follows: Section 2 describes the integrated watershed model with dynamic optimization approaches that captures the climate change impacts through the modification of the water yield function to calculate benefits of reservoir and anthropocentric activity functions to elaborate agriculture productions for upstream and downstream. Downstream damage function is also introduced. Section 3 provides the background of the River Nile along with the AHD, climate change data and scenarios in the River Nile watershed, and agricultural activities in Ethiopia and Sudan. Section 4 summarizes the dynamic optimization results associated with the net present value and the sensitivity analysis for the River Nile. Section 5 provides a conclusion of this research, a summary of the findings for policy makers, and a discussion of future research topics by presenting the limitations of this research.
2. Theoretical Model Specification
2.1. Upstream Watershed Agriculture
Assuming that the entire watershed is affected by climate change, negatively or positively, irrigation allows upstream agriculture to harvest fresh water directly from a river. Thus, changes in irrigation water availability through climate change significantly impacts upstream agriculture productivity. Moreover, soil loss is also a significant factor for agriculture productivity and may also be affected by climate change. The overall impacts of climate change on agriculture productivity are assumed to be calculable as parameter . With any given climate change conditions, upstream farmers’ objective function is to maximize their lifetime net benefits, which can be written as
subject to:
where NBUF is the total upstream farmers’ net benefits of agricultural production, is the total hectares of upstream agricultural land, is the agriculture production elasticity on climate change impacts (i.e., 0 ≤ ≤ 1), is the representative crop price, is the production function with , , , is the cost function, D is the depth of the top soil, E is the soil conservation effort per hectare, is the upstream fertilizer use per hectare, Z is other inputs such as labor and capital, is the salvage value of farm land when the depth of the top soil is completely depleted, is the annual soil loss per hectare, A is the initial soil depth, and r is the discount rate. A detailed explanation of the model can be found in Lee et al. [2].
Since upstream farmers try to maximize their economic benefits in myopic points of view, inevitable consequences such as exacerbation of water quality may cause environmental and social problems downstream. For instance, degradation of reservoir-level water quality due to upstream agricultural residues such as fertilizers or pesticides can be monitored but may not be manageable. In theory, we can convert this situation into a mathematical formula. A dam manager is assumed to have full responsibility to provide clean and safe water to downstream users, and a zero-dimensional reservoir water quality model is used to simulate a reservoir-level pollution concentration [13]. Since the water treatment cost is depended on the pollution load at the reservoir -level and the incoming and outgoing water volume, a systematic analysis is needed. The following equations express these ideas in mathematical terms:
where is the incoming pollutant concentration depending on upstream fertilizer use, is the outgoing pollutant concentration, is the fertilizer residual rate for adjusting pollution load at the reservoir-level, is the volume of incoming water, is the outgoing water amount, is an eutrophication rate (i.e., ), is the residence time of water in the reservoir (i.e., the remaining reservoir capacity(/the volume of incoming water )), is the total water treatment cost, is the unit cost of water treatment per volume , is the water treatment adjustment parameter, and is the water quality standard.
2.2. Reservoir-Level Benefits Function
For any given reservoir or dam, its economic value is relied on its storage capacity that can be reduced by either sediment deposition from upstream soil erosion or increased net evaporation due to severe climate change or both. In hydraulics, an effective storage capacity of a reservoir can be inferred from the Gould-Gamma function [14]. In this sense, we modify the reservoir-level water yield function, which allows us to capture the climate change impacts of evaporation and precipitation at a reservoir level. The following equation shows the relationship between reservoir storage capacity and sedimentation associated with climate change impacts:
where is the reservoir yield at time t (volume), is the remaining reservoir capacity after year t (volume), is the mean annual water inflow (volume), is the standard normal variate of p%, Gd is the adjustment factor to approximate the Gamma distribution (offset from normal distribution), sd is the standard deviation of incoming flows calculated from the user-specified coefficient of variation and , is the reservoir-level temperature elasticity of net evaporation change, and is the watershed-level temperature elasticity of net evaporation. Therefore, the latter parameter will capture a certain percentage change in water flow when there is a change in watershed-level evaporation due to climate change. Likewise, the amount of water stored in the reservoir is also affected by the latter parameter. In the model, explicitly indicates the temperature elasticity at the reservoir level. Note that the remaining storage capacity of a reservoir is significantly decreased by either incoming sediment or increased net evaporation rate, or both at the reservoir level. Therefore, Equation (7), namely the water yield function, can be incorporated with lifetime reservoir net benefits into the following mathematical form:
subject to:
where ADB represents the aggregate net benefits of the reservoir with hydropower and irrigation, is the water price of hydropower, is the water price of irrigation, is the coefficient of irrigation (i.e., −), is the in-stream water threshold, is the reliable reservoir water yield function, is the remaining capacity of the reservoir at time t, is the per unit cost of sediment removal, is the amount of sediment removal to recover certain level of storage capacity, OMC is the annual operating cost, r is the discount rate, SV is the salvage value of the dam, IC is the initial construction cost of the dam, is the total incoming sediment, is the sediment from upstream agriculture, is the sediment from natural soil loss, is the maximum sediment removal in any event, is the initial active storage capacity of the reservoir, and is the optimally determined terminal time of the reservoir.
2.3. Downstream Watershed Benefits and Externalities
In our simulation, downstream agriculture is affected by climate change only through irrigation water availability. Unlike upstream farmers, downstream agriculture relies on irrigation water from the reservoir, which is denoted as the irrigation coefficient, , in Equation (8) in our model. Since both upstream and downstream farmers are assumed to have homogenous production technology, dynamic optimization problem for downstream farmers can be written as
where NBDF is the net benefits of downstream agriculture, Y is the crop output per given land unit, is the downstream fertilizer consumption per given land unit, U is the nutrients spread coefficient by annual flooding, I is the irrigation water consumption per given land unit that is assumed to be , is the total hectares of downstream agriculture land, is the irrigation parameter, and is the cost of fertilizer per ton. While natural flooding enriches topsoil, a certain amount of nutrient is assumed to be contained in sediment deposition and is released to downstream agriculture by any given sediment control options. In this circumstance, we introduce the nutrient coefficient, , for downstream agriculture and assume that the relationship can be written as + , where N is the per hectare natural sediment released from the reservoir and is the per hectare sediment removal from the reservoir. Like upstream agriculture, downstream farmers try to maximize their benefits by applying excessive fertilizer uses that could exacerbate water quality downstream. In this case, the water quality downstream depends on residues of fertilizer in the river and the volume of water, which can be in-stream water flow from the reservoir minus consumptive water uses. Since pollution concentration in a river is assumed to be diluted by in-stream water flow, downstream water quality is assumed to be controlled by a dam manager. Therefore, downstream water quality relationship can be written as follows:
where DP is the downstream pollution concentration, AP is the total fertilizer residues that remains in a river , and INW is the annual in-stream water flow ). A downstream damage function with water quality downstream can be introduced as
where DD is the downstream damage, is the unit cost of water pollution, pop is the total population downstream, and is the water quality standard threshold. Therefore, the social planner’s model should consider downstream net benefits associated with the damage function, i.e., Equation (17).
DP = AP/INW,
2.4. Social Planner’s Optimization Framework
The objective of the social planner’s model is to maximize the lifetime social net benefits under given uncertainties, i.e., climate change in this model. The social planner has no control over climate change impacts on upstream agriculture productivity, water runoff, and reservoir-level evaporation. To maximize upstream agriculture benefits, however, upstream soil conservation and fertilizer consumption management may play an important role. Similarly, reservoir-level sediment removal strategies are crucial in maintaining the storage capacity of the reservoir under different climate conditions. In addition, downstream may suffer from climate change in several ways. For instance, downstream irrigation water availability can be affected by less water from the reservoir. Reduced water from the reservoir may also increase the possibility of downstream drinking water quality degradation. To avoid different time frames among agents, T1 and T2 are assumed to reach infinite time horizon. This optimization process is well elaborated by Lee at al. [2].
The social planner’s model can be introduced in the following way:
subject to Equations (2), (3), (6), (9)–(14) and (16).
In addition, recall that as , the discounted salvage value term becomes negligible. Now, the Hamiltonian equation for the social planner’s problem can be written as
The first-order conditions with respect to control variables that either an individual agent or the social planner only could choose policy or strategic options (i.e., the amount of sediment removal (X), soil conservation efforts (E), fertilizer use (), and the amount of environmental flow ()). Therefore, the first-order conditions can be written as follows:
and the co-state equations are
3. Case Study and Empirical Specification
3.1. The Nile River (Blue Nile) and the Aswan High Dam
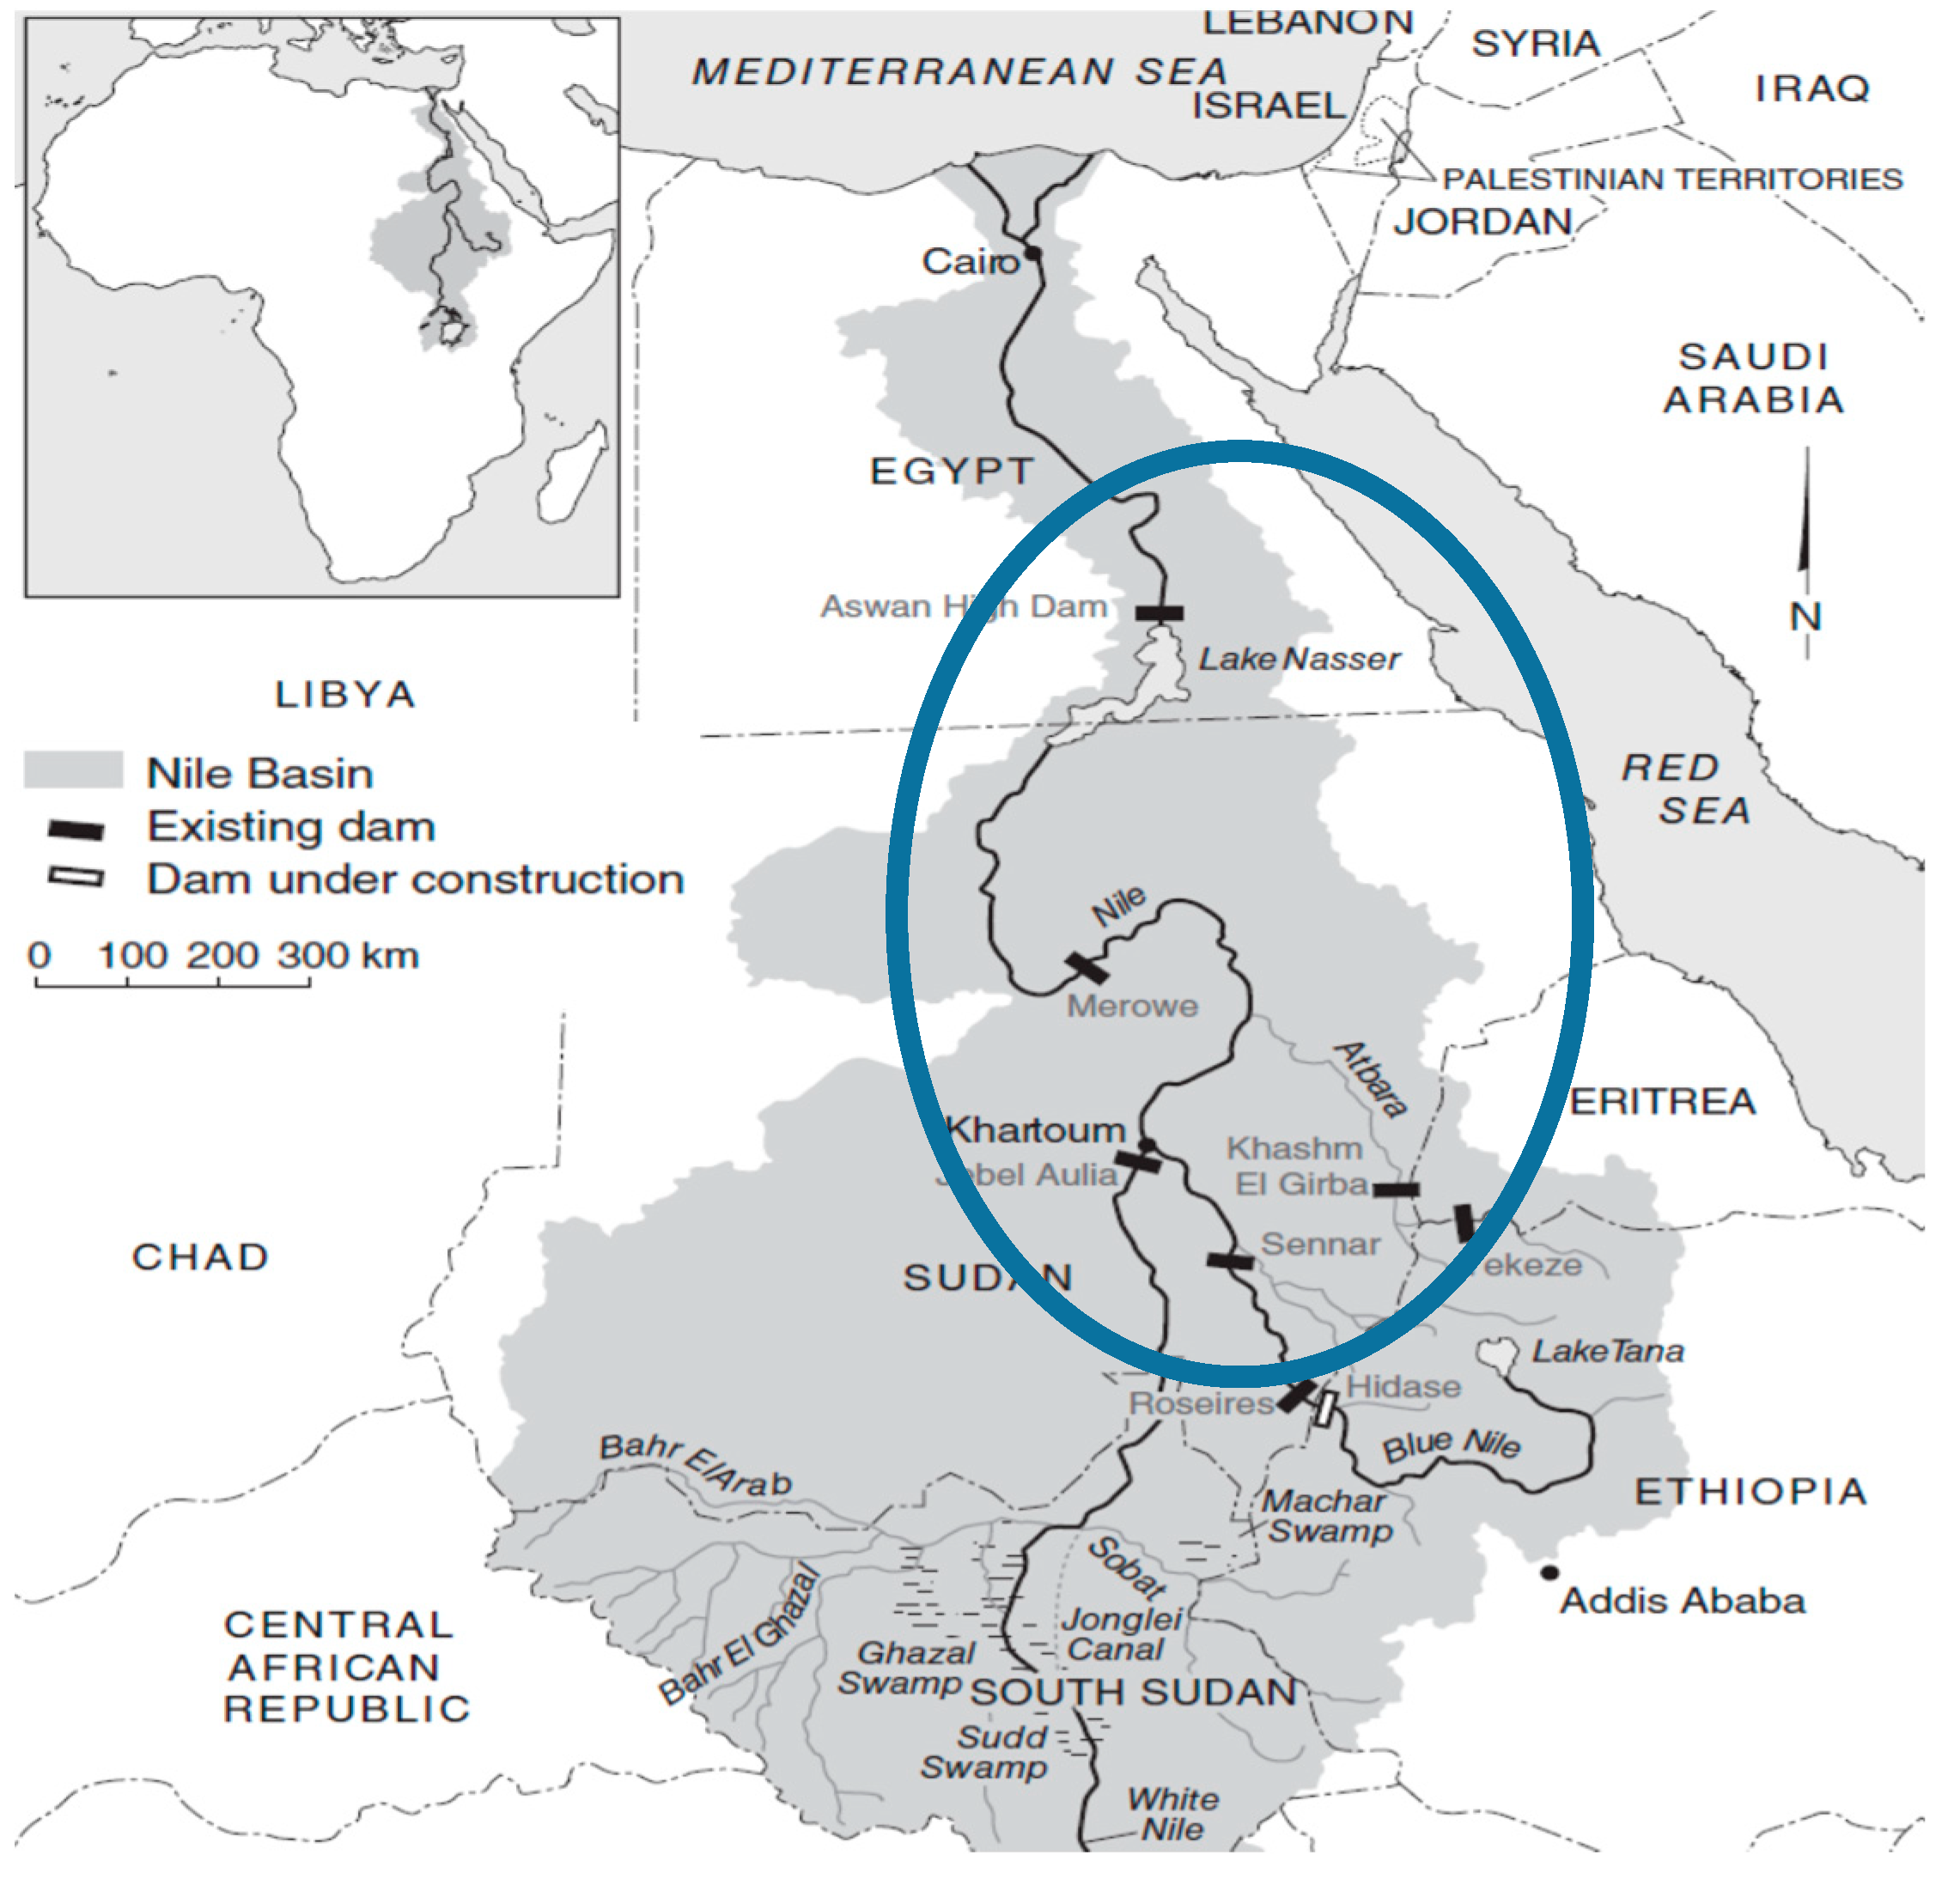
The Nile, which is about 6650 km long, is fed by two main water sources—the Ethiopian Highlands, which provides approximately 60% of the river’s flow via the Blue Nile and most of the silt, and Lake Victoria, which is a headwater of the White Nile (see Figure 1). In this river basin, 11 countries rely on the Nile (i.e., Ethiopia, Sudan, South Sudan, Egypt, Rwanda, Tanzania, Uganda, Burundi, the Democratic Republic of Congo, Eritrea, and Kenya), and many of them are heavily dependent on the Nile as their main source of fresh water. Unlike the rest of the countries, Egypt is the most affected by the Nile and the Aswan High Dam (AHD) located on the border of Sudan and Egypt, containing waters from the Blue Nile. This dam can be categorized as the only fresh water source for this downstream country, Egypt. In this sense, there are many political and historical conflicts between Egypt and the rest of the countries [2,3]. Setting those conflicts aside, sedimentation and climate change are the major contributors that threat Egyptians by loss of its storage capacity and agriculture productivity. Since the AHD is the primary fresh water source for Egypt, managing the dam is a high priority for the country. On the contrary, upstream countries such as Sudan and Ethiopia have no incentive to provide a sustainable solution. Therefore, this is a traditional common-pool resource problem, which makes it a good case study for our research.
We apply our dynamic optimization model to the watershed of the AHD and its upstream countries (i.e., Sudan and Ethiopia). Some researchers have investigated that the excessive amount of soil erosion from upstream impacted the expected life of the reservoir to be 176 years, which is less than 35% of its designed life [2,16]. Since the AHD impounds water from the upper Nile, a variation in river runoff through climate change is crucial to operating the dam. Under current climatic conditions, the AHD receives 80 billion m3 of fresh water annually from the upper Nile, 13% of which disappears annually due to evaporation. Furthermore, climate change may have severe impacts on the reservoir and its watershed. Before the full impoundment of the AHD, the downstream experienced repetitive catastrophic floods from June to October. Since the AHD became fully operative, however, the downstream no longer suffers from flooding during the summer. The AHD discharges about 150 million m3 of fresh water monthly, controls downstream flooding, and provides constant irrigation supply all year round. Such stable discharge depends on the incoming water flow and the remaining storage capacity of the reservoir. Unfortunately, Conway and Hulme [17] indicated that the Nile’s water flow could decrease by up to 40% due to climate change impacts. They also estimated that a 1 °C increase in temperature would lead to a 4% storage loss in the AHD due to evaporation. This result is fatal to Egypt because of its high dependency on the reservoir as its only fresh water source. In addition, the Egyptian economy is based mostly on traditional agriculture, which is also vulnerable to climate change. For instance, three representative crops, i.e., wheat, maize, and cotton, in Egypt need approximately 10% more irrigation water as temperature rises by 1 °C [18].
3.2. Data Collection
Date used in our simulation for the conceptual framework was collected from multiple published sources, but the reliability of these data is hard to verify. Note that our empirical simulation exercises are viewed as illustrative. For upstream soil erosion, we assumed that Sudanese agricultural area is very flat and a certain amount of soil erosion causes sediment deposition at the reservoir. We accessed FAOSTAT, the International Lake Environmental Committee (ILEC), and the Korea Trade-Investment Promotion Agency (KOTRA) databases for obtaining reliable data of the Nile watershed. Selected economic and hydrologic data are in Table 1.
3.3. Simulation Procedure
Based on Lee et al. [2,3], the upstream agriculture production function is estimated by acquiring 10 years of time series data of sedimentation and agricultural inputs-outputs in Egypt and Sudan. This result allows us to define a relationship between accumulative soil loss and production yield. We estimated the upstream agriculture production function to be as follows:
Since the major crops for Egyptian and Sudanese agriculture differ, it is rational to expect that farmers applied different production technologies. Of course, different production technologies could have been used for cultivating the same crops based on farmers’ own needs. For simplification purposes, we applied methodology followed by Lee et al. [2,3] and Aly et al. [20]. The aggregative downstream production function is to be as follows:
where IW is irrigation water use per hectare.
Among the various sediment control schemes at the reservoir, only the hydro-suction sediment removal system (HSRS) is considered as feasible. For instance, flushing is not even possible due to an absence of a flushing gate at the AHD. Also, trucking would not be applied for such a large dam. Dredging can be implemented, but this technique has no contribution to its downstream environment. Finally, we conducted our simulations without considering return flows due to lack of data. In addition, the design life of the AHD is to be 500 years ( for carrying out our simulations).
Since climate change impacts have been incorporated into the model, a regional climate change scenario (RCP4.5) for the Nile watershed, with 2525 km horizontal resolution and extending up to the reservoir’s terminal life, was obtained by dynamically downscaling from results of the Community Earth System Model (CESM) incorporated with the Weather Research and Forecasting (WRF) model. This process allowed us to forecast the changes of precipitation, temperature, and evaporation rate at the Nile watershed. A detailed procedure of this method is well elaborated by Seo et al. [23].
There representative climate change scenarios were selected in our simulation procedure: RCP8.5, RCP4.5(Baseline), and RCP2.6. Furthermore, three different time periods were considered to provide more accurate analysis. Table 2 summarizes the forecasted temperature change, upstream agricultural production change, and reservoir-level evaporation change in the Nile watershed. For each of the three climate change scenarios, two control variables, i.e., soil conservation and downstream in-stream water flow separately considered to introduce two non-cooperative behaviors. Finally, the cooperative solution or social planner’s view was computed by using all of the control variables simultaneously.
4. Results
4.1. Simulation Results
For making a reference case in our model, the current management strategies in the River Nile, which are roughly equivalent to no management, was calculated and turns out to be a myopic perspective. For instance, upstream farmers apply a certain level of fertilizer to maximize short-term profit with no soil conservation efforts. Since a reservoir manager’s responsibility is not to operate sustainably but to maintain complacently, there is a high possibility that sedimentation problems were ignored that means no sediment removal schemes applied at reservoir-level. For downstream farmers, water quality degradation is mostly beyond their consideration. In these regards, baseline results indicate that the overall net social present value (NSPV) is approximately −$277 billion USD in RCP4.5. When future climate change moves to RCP8.5, however, the aggregate NSPV becomes –$472 billion USD. In addition, we simulate the non-cooperative cases where all the stakeholders maximize their own lifetime benefits without considering negative externalities. For simplification purposes, upstream farmers are assumed to adopt an all-or-nothing soil conservation schemes, and a dam manager only has a hydro-suction sediment removal system (HSRS) option to sustain a dam operation. HSRS has two options that can remove 100 million m3 or 200 million m3 of incoming sediment, namely HSRS (a) and HSRS (b) [2]. These options obviously have two different initial construction costs, $100 million USD and $200 million USD, respectively [7]. For analyzing two control variables, soil conservation and in-stream flow control, we introduce two separate management options, no soil conservation and no flow control. Therefore, a socially optimal option contains all management schemes, but no soil conservation option excludes in-stream control and no flow control option excludes soil conservation practices.
Under no upstream watershed management strategies with the RCP4.5 scenario, HSRS (a) is the most effective solution, maximizing the NSPV to $270.1 billion USD and extending the life of the dam sustainably. Applying the no flow control, HSRS (a) still provides the maximum NSPV of $193.9 billion USD but is not sustainable. However, HSRS (a) with a no flow control option minimizes downstream damage up to $30.4 billion USD. Soil conservation efforts upstream increases upstream farmers benefits from $32.6 billion USD to $39.1 billion USD, but this difference is trivial compared to the rest of the effects on the entire watershed. Downstream benefits can increase dramatically by implementing an in-stream flow control scheme that allows the downstream to be enriched with nutrients. For the socially optimal case with RCP4.5, HSRS (a) gives the highest NSPV of $278.9 billion.
As shown in Table 3, under RCP 2.6, the baseline case gives approximately −$133.1 billion USD, which is roughly $339 billion USD more than the baseline case in RCP 8.5. Under the no soil conservation option, HSRS (b) is the best management alternative to maximize the NSPV to $314.2 billion USD and HSRS (b) minimizes downstream damage to −$37.2 billion USD. Under the no in-stream flow control, HSRS (b) again enables a maximum NSPV of $216.2 billion USD, while HSRS (a) minimizes downstream damage to $38.9 billion. For the social planner’s point of view, implementing HSRS (b) with all control options allows to maximize social NSPV to $321.7 billion USD, which is the highest among the simulation results.
If the climate condition becomes worse, RCP8.5, baseline results indicate that downstream damage would be $763.6 billion USD, which is the lowest in our model. However, applying all control options to maximize the NSPV of the entire watershed social planner’s model gives us $255.6 billion USD under HSRS (b). The aforementioned results indicate that HSRS options certainly provide the highest NSPV of the entire watershed, but which options to select mainly depends upon climate change scenarios.
4.2. Sensitivity Analysis
Although it is well known that future values are very sensitive to interest rate, the role of the HSRS in the entire watershed becomes much more important when climate conditions of the Nile watershed change. Furthermore, the HSRS effect on altering nutrient deposition to downstream agriculture impacts the social planner’s decision making. Since the model assumes that only 7% of nutrients are deposited to downstream agricultural land by the HSRS, we conduct the sensitivity analysis by introducing 30% of the nutrient deposition rate to downstream agriculture. The result can be found in Table 4.
.
5. Conclusion and Discussions
Among the many common-pooled resource problems, transboundary rivers have numerous difficulties and conflicts including upstream-downstream issues. This paper presents a dynamic optimization watershed model with a holistic approach for achieving sustainable manners under three representative climate change scenarios. The model allows us to investigate not only the relationships among upstream, reservoir-level, and downstream but also the physical impacts on each other in terms of economics. The Nile was selected as a case study for applying this integrated approach. Egypt, Sudan, and Ethiopia are considered as a downstream and an upstream watershed, respectively. Natural climate conditions make policy makers implement adaptation policy for the Aswan High Dam and the entire Nile watershed―hence, three different representative climate change scenarios (i.e., RCP 2.6, RCP 4.5, and RCP 8.5) have been introduced to simulate the impacts of climatic changes on the entire watershed. Furthermore, since the Egyptian economy relies solely on fresh water from the AHD, implementing sustainable management options for this dam is crucial to the social planner of this watershed. Under climate uncertainties, upstream soil conservation efforts mutually benefit farmers and the dam manager from reduced sediment accumulation. Although there are several well-known sediment removal techniques, HSRS is the only feasible option to the study site. Additionally, this scheme releases nutrient enriched sediment downstream increasing agriculture productivity downstream. Such sediment removal extends the life of the dam and also enables downstream farmers to be free from chemical fertilizers. In addition, the function of in-stream flow control allows the dam manager to mitigate downstream damages from water quality degradation. Although individual components of the model have been presented in previous studies, the main contribution of our research is to merge them in a single dynamic framework introducing uncertainties (i.e., climate change). Such effort allows us to evaluate the social value of the entire watershed by minimizing negative externalities. Moreover, the results from this research provide the basis of appropriate recommendations for policy makers.
When a transboundary river runs through more than two countries, the upstream country’s management schemes with respect to soil conservation may be critical to reservoir management and the downstream country’s agriculture. Simulation results from our model indicate that Sudan and Ethiopia, upstream countries, could benefit substantially from increasing soil conservation efforts. Moving from myopic perspective to far-sighted behavior, cooperation across different agents increase more substantial benefits to the entire watershed under any climate uncertainties. Shifting from the status quo to the socially optimal solution increases net benefits by approximately $570 billion USD. Introducing climate uncertainties in the watershed presents several significant findings. First, the HSRS is an only feasible technical solution to Egypt, but the net social present value increases within all cases and the sustainable life of the dam is guaranteed for good. Even though climate uncertainties could be a problem for the Nile, implementing an economically and technically feasible sediment control solution, the HSRS, enables Egypt to provide fresh water downstream. Second, water quality degradation can be improved by introducing a desirable in-stream flow management by the dam manager. According to our simulation results, implementing the HSRS not only increases reservoir-related benefits but also agricultural gains due to releasing enriched nutrients to downstream agriculture. Downstream damages due to water pollution and nutrient starvation can be reduced by more than $738 billion USD in RCP 8.5 while sacrificing a relatively small portion of downstream agriculture productivity. Third, collaborative watershed management among three nations could achieve more constructive solutions for the Nile. Based on the 1929 Nile Waters Agreement, which excluded the role of Ethiopia in the watershed, Egypt has a right to use the most of the Nile water. In practice, however, our findings indicate that upstream countries play an important role in reducing the impact on Egypt and providing possible ways to resolve water conflicts within the Nile in practice.
We feel that this research provides a useful guideline for assessing integrated watershed management with respect to climate uncertainties, but several modifications to our attempt can be made for future research. First, determining the prices of water and crops endogenously can reflect better reality. In addition, the price dynamic could reach different solutions than what we presented in the paper. Second, the reservoir size was considered as a fixed variable in the model, but relaxing this assumption can allow us to select the optimal size of the dam before construction. Third, there may be many indirect costs in operating a dam, and environmental costs of sediment removal should also be considered. Fourth, this paper assessed a multi-purpose dam, but flood control benefits are ignored due to lack of information. Such benefits are important especially when there is a large number of populations relying on the reservoir downstream. Finally, although our findings rely on existing documents and previous literature, the available data for the Nile and its watershed is partial and out of date. Recent data or science-based simulation results excluding climate change scenarios have a high probability in increasing the accuracy of the results. A stochastic approach along with recent data could provide more realistic empirical results. We believe that our research would be a starting point to lead a promising research agenda for the future.
Author Contributions
Y.L. contributed to the design and development of this research. Y.L. and T.Y. developed the program coding for the dynamic optimization model. Y.H. conducted the water quality model in the dynamic system equation. The main part of manuscript was written by Y.L. and Y.H. All authors have read and agreed to the published version of the manuscript.
Funding
This work was supported by the National Research Foundation of Korea Grant funded by the Korean Government (NRF-2019S1A5C2A03082527).
Acknowledgments
The authors thank the University of Connecticut and the Korea Environmental Institute, who supported to build the preliminary research of this manuscript. The authors also thank Ayman Abou-zeid for providing valuable data on the Aswan watershed. In addition, constructive comments from three anonymous reviewers greatly helped improve this paper.
Conflicts of Interest
The authors declare no conflict of interest.
References
- Vörösmarty, C.J.; Green, P.; Salisbury, J.; Lammers, R.B. Global water resources: Vulnerability from climate change and population growth. Science 2000, 289, 284–288. [Google Scholar] [CrossRef] [PubMed] [Green Version]
- Lee, Y.; Yoon, T.; Shah, F.A. Economics of integrated watershed management in the presence of a dam. Water Resour. Res. 2011, 47. [Google Scholar] [CrossRef]
- Lee, Y.; Yoon, T.; Shah, F.A. Optimal watershed management for reservoir sustainability: Economic appraisal. J. Water Resour. Plan. Manag. 2012, 139, 129–138. [Google Scholar] [CrossRef]
- Payne, J.T.; Wood, A.W.; Hamlet, A.F.; Palmer, R.N.; Lettenmaier, D.P. Mitigating the effects of climate change on the water resources of the Columbia River basin. Clim. Chang. 2004, 62, 233–256. [Google Scholar] [CrossRef]
- Bates, B.; Kundzewicz, Z.; Wu, S. Climate Change and Water; Intergovernmental Panel on Climate Change Secretariat: Geneva, Switzerland, 2008. [Google Scholar]
- Pearce, F. On the River Nile, a Move to Avert a Conflict Over Water; YaleEnvironment360; Yale School of Forestry & Environmental Studies: New Heaven, CT, USA, 12 March 2015. [Google Scholar]
- Palmieri, A.; Shah, F.; Dinar, A. Economics of reservoir sedimentation and sustainable management of dams. J. Environ. Manag. 2001, 61, 149–163. [Google Scholar] [CrossRef] [PubMed]
- Pattanapanchai, M. Economics of Renewable Resource Management: An Application to Multipurpose Dams; University of Connecticut: Storrs, CT, USA, 2005. [Google Scholar]
- Kawashima, S. Conserving reservoir water storage: An economic appraisal. Water Resour. Res. 2007, 43. [Google Scholar] [CrossRef]
- Barnes, J. The future of the Nile: Climate change, land use, infrastructure management, and treaty negotiations in a transboundary river basin. Wiley Interdiscip. Rev. Clim. Chang. 2017, 8, e449. [Google Scholar] [CrossRef]
- Kim, U.; Kaluarachchi, J.J. Climate Change Impacts on Water Resources in the Upper Blue Nile River Basin, Ethiopia 1. JAWRA J. Am. Water Resour. Assoc. 2009, 45, 1361–1378. [Google Scholar] [CrossRef]
- Dile, Y.T.; Berndtsson, R.; Setegn, S.G. Hydrological Response to Climate Change for Gilgel Abay River, in the Lake Tana Basin-upper Blue Nile Basin of Ethiopia. PLoS ONE 2013, 8, e79296. [Google Scholar] [CrossRef] [PubMed] [Green Version]
- Vollenweider, R.A. Advances in Defining Critical Loading Levels for Phosphorus in Lake Eutrophication; Memorie dell’Istituto Italiano di Idrobiologia, Dott. Marco de Marchi Verbania Pallanza; dell’Istituto Italiano di Idrobiologia: Verbania Pallanza, Italy, 1976. [Google Scholar]
- Morris, G.L.; Fan, J. Reservoir Sedimentation Handbook: Design and Management of Dams, Reservoirs, and Watersheds for Sustainable Use; McGraw Hill Professional: New York, NY, USA, 1998. [Google Scholar]
- Jobin, W. Dams and Disease: Ecological Design and Health Impacts of Large Dams, Canals and Irrigation Systems; CRC Press: Boca Raton, FL, USA, 2014. [Google Scholar]
- Conway, D. From headwater tributaries to international river: Observing and adapting to climate variability and change in the Nile basin. Glob. Environ. Chang. 2005, 15, 99–114. [Google Scholar] [CrossRef]
- Ouda, S.A.; El-Marsafawy, S.M.; Eid, H.M. Assessing the Economic Impacts of Climate Change on Agriculture in Egypt: A Ricardian Approach; The World Bank: Washington, DC, USA, 2007. [Google Scholar]
- Pimentel, D.; Harvey, C.; Resosudarmo, P.; Sinclair, K.; Kurz, D.; McNair, M.; Blair, R. Environmental and economic costs of soil erosion and conservation benefits. Science 1995, 267, 1117–1123. [Google Scholar] [CrossRef] [PubMed] [Green Version]
- Ezzat, M.N.; Shehab, H.; Hassan, A.A.; El-Sharkawy, M.; El-Diasty, A.; El-Assiouty, I.; Tczap, A. APRP-Water Policy Activity: Survey of Nile System Pollution Sources; Report No. 64; USAID: Washington, DC, USA, 2002.
- Aly, I.; Zein, R.; Abou-Sassd, H. Irrigation water pricing: Is it an efficient instrument for water consumption rationalization? Minufiya J. Agric. Res. 2005, 30, 817–833. [Google Scholar]
- Nixon, S.W. Replacing the Nile: Are anthropogenic nutrients providing the fertility once brought to the Mediterranean by a great river? AMBIO A J. Hum. Environ. 2003, 32, 30–40. [Google Scholar] [CrossRef] [PubMed]
- Yongguan, C.; Seip, H.M.; Vennemo, H. The environmental cost of water pollution in Chongqing, China. Environ. Dev. Econ. 2001, 6, 313–333. [Google Scholar] [CrossRef]
- Seo, J.; Shim, C.; Hong, J.; Kang, S.; Moon, N.; Hwang, Y.S. Application of the WRF Model for Dynamical Downscaling of Climate Projections from the Community Earth System Model (CESM). Atmosphere 2013, 23, 347–356. [Google Scholar] [CrossRef] [Green Version]
Figure 1.
The Nile River, modified from reference [15].
Figure 1.
The Nile River, modified from reference [15].


Table 1.
Selected economic and hydrologic parameters in the Blue Nile watershed.
| Description | Notation | Value | Unit | Source | |
|---|---|---|---|---|---|
| Upstream | Price of crops | 215 | $/ton | FAOSTAT | |
| Cost of soil conservation efforts | 6 | $/ton/ha | [19] | ||
| Cost of fertilizer | 160 | $/ton | FAOSTAT | ||
| Agriculture land | 4 | million ha | |||
| Annual soil loss | 30 | ton/ha | [2] | ||
| Reservoir-level | Fertilizer residual rate | 0.5 | fraction | [2] | |
| Mean annual water flow | 80 | BCM | ILEC database | ||
| Storage capacity | 31.5 | BCM | |||
| Water quality threshold | 10 | ppm | [20] | ||
| Cost of water treatment | 0.02 | $/m3 | [5] | ||
| Price of irrigation water | 0.02 | $/m3 | [21] | ||
| Price of hydropower | 0.01 | $/m3 | KOTRA database | ||
| Unit cost of HSRS | 7.23 | $/ m3 | [7] | ||
| Annual reservoir operation cost | 10 | million $ | [2] | ||
| Total incoming sediment | 200 | million ton | [15] | ||
| Sediment from upstream agriculture | 120 | million ton | [2] | ||
| Trap efficiency | 99 | % | [15] | ||
| Downstream | Agriculture land | 2.9 | million ha | FAOSTAT | |
| Population | 80 | million | |||
| Discount factor | 5 | % | [2] | ||
| Nutrient deposition | 7 | % | [21] | ||
| Unit cost of pollution | 32 | $ | [22] |
All dollar values in the table are converted to 2004 US dollars.
Table 2.
Temperature, production, evaporation, and stream flow change according to alternative climate change scenarios.
Table 2.
Temperature, production, evaporation, and stream flow change according to alternative climate change scenarios.
| Climate Change Scenarios | Phase I | Phase II | Phase III |
|---|---|---|---|
| 2010~2039 | 2040~2069 | 2070~ | |
| RCP8.5 | |||
| Temperature (°C) | +1.76 | +3.56 | +4.72 |
| Production (%) | −35.2 | −71.2 | −94.4 |
| Evaporation (%) | +7.04 | +14.24 | +18.88 |
| Stream flow (%) | −0.23 | −0.29 | −0.38 |
| Baseline (RCP4.5) | |||
| Temperature (°C) | +1.34 | +2.54 | +3.83 |
| Production (%) | −20.1 | −38.1 | −57.45 |
| Evaporation (%) | +5.36 | +10.16 | +15.32 |
| Stream flow (%) | +0.08 | +0.02 | +0.07 |
| RCP2.6 | |||
| Temperature (°C) | +0.78 | +1.55 | +2.87 |
| Production (%) | −7.8 | −15.5 | −28.7 |
| Evaporation (%) | +3.12 | +6.2 | 11.48 |
| Stream flow (%) | +0.36 | +0.27 | +0.15 |
Table 3.
Simulation results under different RCP scenarios and management scenarios including the use of hydro-suction sediment removal system (HSRS) (Unit: billion USD).
Table 3.
Simulation results under different RCP scenarios and management scenarios including the use of hydro-suction sediment removal system (HSRS) (Unit: billion USD).
| Management Scenario | RCP8.5 | Baseline (RCP4.5) | RCP2.6 | |||||||||||||||||
|---|---|---|---|---|---|---|---|---|---|---|---|---|---|---|---|---|---|---|---|---|
| U * | D * | Ds * | Da * | PV * | DL * | U * | D * | Ds * | Da * | PV * | DL * | U * | D * | Ds * | Da * | PV * | DL * | |||
| No Management (Baseline) | 23.9 | 52.3 | 215.6 | −763.6 | −471.9 | Un | 32.6 | 71.5 | 225.9 | −607.1 | −277.0 | Un | 30.7 | 91.1 | 232.3 | −487.2 | −133.1 | Un | ||
| No Soil Conservation | HSRS | (a) | 24.7 | 35.1 | 189.5 | −24.0 | 224.5 | Sus | 32.6 | 51.5 | 225.7 | −34.7 | 270.1 | Sus | 30.7 | 67.1 | 243.6 | −37.2 | 303.2 | Sus |
| (b) | 24.7 | 34.8 | 185.5 | −25.3 | 219.0 | Sus | 32.6 | 51.0 | 219.8 | −35.6 | 262.9 | Sus | 30.7 | 67.9 | 254.1 | −38.5 | 314.2 | Sus | ||
| No Flow Control | HSRS | (a) | 27.6 | 49.6 | 130.6 | −38.0 | 169.8 | Un | 39.1 | 67.3 | 125.5 | −30.4 | 193.9 | Un | 35.6 | 85.7 | 110.1 | −38.9 | 192.5 | Un |
| (b) | 27.6 | 49.5 | 113.8 | −41.7 | 147.5 | Sus | 39.1 | 67.1 | 115.8 | −45.3 | 168.8 | Sus | 35.6 | 86.8 | 133.7 | −39.8 | 216.2 | Sus | ||
| Socially Optimal | HSRS | (a) | 27.6 | 37.0 | 191.8 | −23.7 | 232.7 | Sus | 39.1 | 54.0 | 227.4 | −33.9 | 278.9 | Sus | 35.6 | 69.4 | 243.5 | −37.7 | 310.7 | Sus |
| (b) | 27.6 | 36.8 | 188.0 | −25.0 | 255.6 | Sus | 39.1 | 53.6 | 222.5 | −34.7 | 272.6 | Sus | 35.6 | 70.1 | 254.3 | −38.2 | 321.7 | Sus | ||
Note: * U and D indicate value of upstream and reservoir-level benefits, respectively. Ds is denoted as value of downstream benefits and Da indicates value of downstream damages. PV stands for net social present value (NSPV) and DL indicates the life of the AHD. Un and Sus represented unsustainable and sustainable life of the reservoir, respectively.
Table 4.
Sensitivity analysis for nutrient deposition (.
| Management Alternatives (unit: billion $) | U * | D * | Ds * | Da * | NSPV * | Dam Life | |
|---|---|---|---|---|---|---|---|
| Socially Optimal (RCP8.5) | |||||||
| HSRS | (a) | 27.33 | 37.04 | 261.54 | −23.68 | 302.21 | Sus |
| (b) | 25.24 | 36.75 | 243.69 | −25.03 | 281.24 | Sus | |
| Socially Optimal (RCP4.5) | |||||||
| HSRS | (a) | 31.53 | 54.00 | 296.90 | −33.96 | 348.47 | Sus |
| (b) | 31.24 | 53.59 | 276.74 | −34.73 | 326.81 | Sus | |
| Socially Optimal (RCP2.6) | |||||||
| HSRS | (a) | 35.56 | 69.35 | 295.49 | −37.73 | 362.67 | Sus |
| (b) | 35.50 | 70.05 | 324.11 | −38.17 | 391.50 | Sus | |
Note: * U and D indicate value of upstream and reservoir-level benefits, respectively. Ds is denoted as downstream benefits and Da indicates downstream damages. NSPV stands for net social present value and DL indicates the life of the AHD. Un and Sus represented unsustainable and sustainable life of the reservoir, respectively.
© 2019 by the authors. Licensee MDPI, Basel, Switzerland. This article is an open access article distributed under the terms and conditions of the Creative Commons Attribution (CC BY) license (http://creativecommons.org/licenses/by/4.0/).
Share and Cite
MDPI and ACS Style
Lee, Y.; Yoon, T.; Hong, Y. Is Sustainable Watershed Management Feasible under Climate Change? An Economic Appraisal of the Nile River. Sustainability 2020, 12, 162. https://doi.org/10.3390/su12010162
AMA Style
Lee Y, Yoon T, Hong Y. Is Sustainable Watershed Management Feasible under Climate Change? An Economic Appraisal of the Nile River. Sustainability. 2020; 12(1):162. https://doi.org/10.3390/su12010162
Chicago/Turabian StyleLee, Yoon, Taeyeon Yoon, and Yongsuk Hong. 2020. "Is Sustainable Watershed Management Feasible under Climate Change? An Economic Appraisal of the Nile River" Sustainability 12, no. 1: 162. https://doi.org/10.3390/su12010162
Note that from the first issue of 2016, this journal uses article numbers instead of page numbers. See further details here.