Article

Urban Expansion and Growth Boundaries in an Oasis City in an Arid Region: A Case Study of Jiayuguan City, China

1
School of Land Science and Technology, China University of Geosciences, Beijing 100083, China
2
School of Civil Engineering, Qinghai University, Xining 810016, China
3
Key Laboratory of Land Consolidation, Ministry of Natural Resources, Beijing 100035, China
4
College of Resources and Environmental Sciences, Gansu Agricultural University, Lanzhou 730070, China
5
College of Faculty of Geomatics, Lanzhou Jiaotong University, Lanzhou 730070, China
6
Department of Ecological Economy, Qinghai Academy of Social Sciences, Xining 81000, China
7
Department of Land Space Planning, Gansu Academy of Natural Resources Planning, Lanzhou 730000, China
*
Authors to whom correspondence should be addressed.
Sustainability 2020, 12(1), 210; https://doi.org/10.3390/su12010210
Submission received: 25 October 2019 / Revised: 15 December 2019 / Accepted: 22 December 2019 / Published: 25 December 2019

Abstract

:
China is undergoing rapid urbanization, which has caused undesirable urban sprawl and ecological deterioration. Urban growth boundaries (UGBs) are an effective measure to restrict the irrational urban sprawl and protect the green space. However, the delimiting method and control measures of the UGBs is at the exploratory stage in China. In this paper, a cellular automata model based on multi-criteria evaluation (MCE-CA) was proposed to delimit the UGBs. The MCE-CA model considers influencing factors related to urban growth and generates UGBs based on spatiotemporally dynamic simulations. The MCE-CA model was applied to generate the UGBs of Jiayuguan City in 2020 and 2030, the results show that the simulation accuracy is higher than 0.8 and the compactness increases to 0.23, which demonstrates that the MCE-CA model is an effective model for delimiting UGBs. Moreover, the MCE-CA model can corporate the contradiction between environmental protection and urban development, promoting urban smart growth and sustainable development. UGBs is an effective tool for China to realize ecological civilization construction and improve the spatial governance ability, and the MCE-CA model can be used to assist planners in delimiting future UGBs, this study provides a methodological reference for future research of UGBs in Chinese cities.

1. Introduction

Urban land is where most human activities in the world take place. Its evolving dynamic characteristics profoundly reflect the urbanization process and the changing rules and contradictions of urban spatial structure [1,2]. With the advancement of global urbanization, China’s urbanization rate is increasing rapidly, from 10.6% in 1949 to 59.6% in 2018, and the urban population grew from 58 million in 1949 to 831 million by the end of 2018. The number of cities with populations more than 0.5 million increased enormously from 12 in 1949 to 297 by the end of 2018, and the urban land area increased from 5600 km2 in 1949 to 74,800 km2 in 2018. Which is accompanied by a series of negative impacts, such as urban sprawl, deteriorating urban ecological environment, reduction of cultivated land resources, and weakened capacity of ecosystem services [3,4,5,6,7]. That being the case, the rapid urban expansion is a major challenge for the sustainable urban development of China [8]. Therefore, determining how to effectively curb urban sprawl and coordinate the contradiction between urban development and ecological conservation has become an urgent problem for China in the new era [9,10]. Urban growth boundaries (UGBs) are an effective tool to coordinate the relationship between urban development and environment protection and promote the city sustainable development [11]. The United State’s Environmental Protection Agency (EPA) defines an UGB as “a mapped line that separates land on which development will be concentrated from land on which development will be discouraged or prohibited” [12]. The American Planning Association (APA) recommends that UGBs be established “to promote compact and contiguous development patterns that can be efficiently served by public services and to preserve or protect open space, agricultural land, and environmentally sensitive areas” [13]. The first US UGB was established in Lexington, Kentucky, in 1958 [14]. UGBs can be traced back to the “pastoral city” theory put forward by Howard [14], and influenced by smart growth, UGBs have been implemented in various countries around the world, including the United States, Saudi Arabia, Canada, Albania, Australia, and Korea, to name a few [15]. At the same time, Western scholars have carried out a great deal of research on the concept, delimitation techniques, and effectiveness of UGBs [16,17,18,19,20]. The techniques of delimitation and evaluation have been expanded from qualitative to quantitative, and new techniques and large-volume high-accuracy data are increasingly being used (e.g., geographic information system (GIS), remote sensing (RS), and the night-time light data) [21,22,23]. The abundance of Western study cases and practices enriched the theory and methodology of UGBs, which laid a profound foundation for us to research UGBs. Compared with the Western countries, the study of UGBs in China has come later.
The idea of UGBs was introduced into China in the late 1990s, the People’s Republic of China Town and Country Planning Act requires the establishment of urban construction boundaries (UCBs) in Chinese city master and detail plans in 2006, which is the initial exploration of the idea of UGBs [24]. After that, delimiting the UGBs has inspired the great attention of Chinese government and researchers [25]. The Outline of National Land Use Master Plan approved by the State Council in 2008 called for the implementation of the expansion boundary to control the urban and rural construction land. China’s Central Urbanization Work Conference in December 2013 put forward the idea that urban planning should be transform from expansionary planning to connotative planning by delimiting the urban boundary and optimizing the spatial layout. The National New Urbanization Planning (2014–2020), issued by the Communist Party of China (CPC) Central Committee and the State Council in 2014, put forward the idea that reasonably determining the size of cities and delimiting the UGBs. The Ministry of Land and Resources (the current name is Ministry of Natural Resources) and the Ministry of Housing and Urban-Rural Development jointly selected 14 cities (Beijing, Shanghai, Guangzhou, Shenzhen, Nanjing, Wuhan, Xiamen, Shenyang, Suzhou, Hangzhou, Zhengzhou, Chengdu, Xian, and Guiyang) as the first-phase pilot cities to delimit the UGBs in July 2014. On 25 April 2015, the ‘Opinions of the CPC Central Committee and the State Council on Accelerating the Ecological Civilization Construction’ was published, which stated that there was a further need for the vigorous promotion of green urbanization, the delineation of UGBs, and promotion of urbanization development from outward expansion to internal content improvements. On 23 May 2019, the ‘Opinions of the CPC Central Committee and the State Council on Establishing the Land Space Planning System and Supervising Its Implementation’ was published. This policy stated that all the territorial space should been classified and managed based on the territorial spatial planning, and the UGBs should been implemented by the different measurements of planning permission and zoning. These policies showed that the delimitation of UGBs is an urgent problem for China to solve as soon as possible, and it is an effective tool for China to realize ecological civilization construction and improve the spatial governance ability. However, the practice of UGBs in China is still in the exploratory stage. The first 14 cities have delimited the UGBs, but the uniformed analysis has rarely been seen in the related literature.
Although Chinese scholars have studied the concept, significance, delimitation methods, and influencing factors of UGBs [26,27,28,29,30], relevant research has regrettably not yet reformed a mature UGB method, nor has it explored its governing measures. At present, influenced by the New Urbanism, the two main schools of thought regarding delimiting the UGBs in China are “positive” thinking and “anti-planning” thinking. The “positive” thinking is to forecast the scale of people and construction based on the constructed model, then delimit the UGBs according to the scale, which pays more attention to the land needs of people and neglects the protection of ecological space. The model used in related studies is cellular automata (CA) or its modified versions [27,29,30,31,32,33]. On the contrary, “anti-planning” thinking, which was put forward by Yu [34,35], gives priority to the protection of ecological space and basic farmland, then forecasts the scale of construction land, which preferentially protects ecological space while also guaranteeing that the land needs of people are met. The studies adopting this approach use green infrastructure assessment, landscape ecological indices, ecological sensitivity evaluation, resource and environment carrying capacity evaluation, and space development suitability evaluation [36,37,38]. However, the delineation of UGBs is still at the exploratory stage in China. Therefore, new methods that can account for urban ecological security and all of the forces driving urban development are necessary and meaningful for the delimitation of UGBs.
Oasis cities in China are mostly located in the continental river basin within the arid to semi-arid areas having fragile eco-environment [39], are highly concentrated and sensitive areas and are a complex representative area of human activities [40]. The contradiction between urban expansion and ecological conservation is prominent in oasis cities. Studying the process of urban spatial expansion in an oasis city and delimiting the UGBs are of great significance for China to master urban spatial expansion in arid areas and promote the sustainable development of oasis cities [41]. However, most of the research on delimiting UGBs in China has been focused on Beijing, Shanghai, Shenzhen, and other megacities or big cities, so research on the UGBs of small and medium-sized cities—especially the small and medium-sized oasis cities in the Northwest arid region of China—has attracted little attention. Moreover, small and medium-sized oasis cities in the Northwest arid region of China have the characteristics that the population is less than 500,000, the urban land area is limited and scattered, the ecological environment is fragile, and the contradiction between urban land and farmland is prominent. Optimizing the urban spatial layout of small and medium-sized oasis cities is of great significance for coordinating the contradiction between resources, environment, and population, promoting the urban smart development and ecological conservation [42]. Therefore, Jiayuguan City was selected as the study area to quantitatively analyze the temporal and spatial expansion characteristics from 1990 to 2015 by RS and GIS techniques based on MSS/TM data and four representative indices. Then, the cellular automata model based on multi-criteria evaluation (MCE-CA) organically combining “positive” and “anti-planning” thinking was applied to explore the delimitation of the UGBs in Jiayuguan City. The MCE-CA model can help in solving spatial contradiction between urban development and ecological conservation for Jiayuguan City in achieving a balance between economic development and environmental protection and promoting urban development transformation. Furthermore, the aim of this paper is to provide a methodological reference for future research of UGBs in Chinese cities.
The rest of this paper is organized as follows. Section 2 introduces the study area and data sources which includes the remote sense image data and the spatial variables in the MCE-CA model. Section 3 introduces the research methods in detail. As the core section, the Section 4 presents the results and analysis in which we analyzed the characteristics of urban spatial expansion and delimited the UGBs of Jiayuguan City. Section 5 provides a discussion comprised of the rationality of the MCE-CA model, suggestions on UGBs, limitations and prospects. The last section presents our conclusions.

2. Study Area and Data Sources
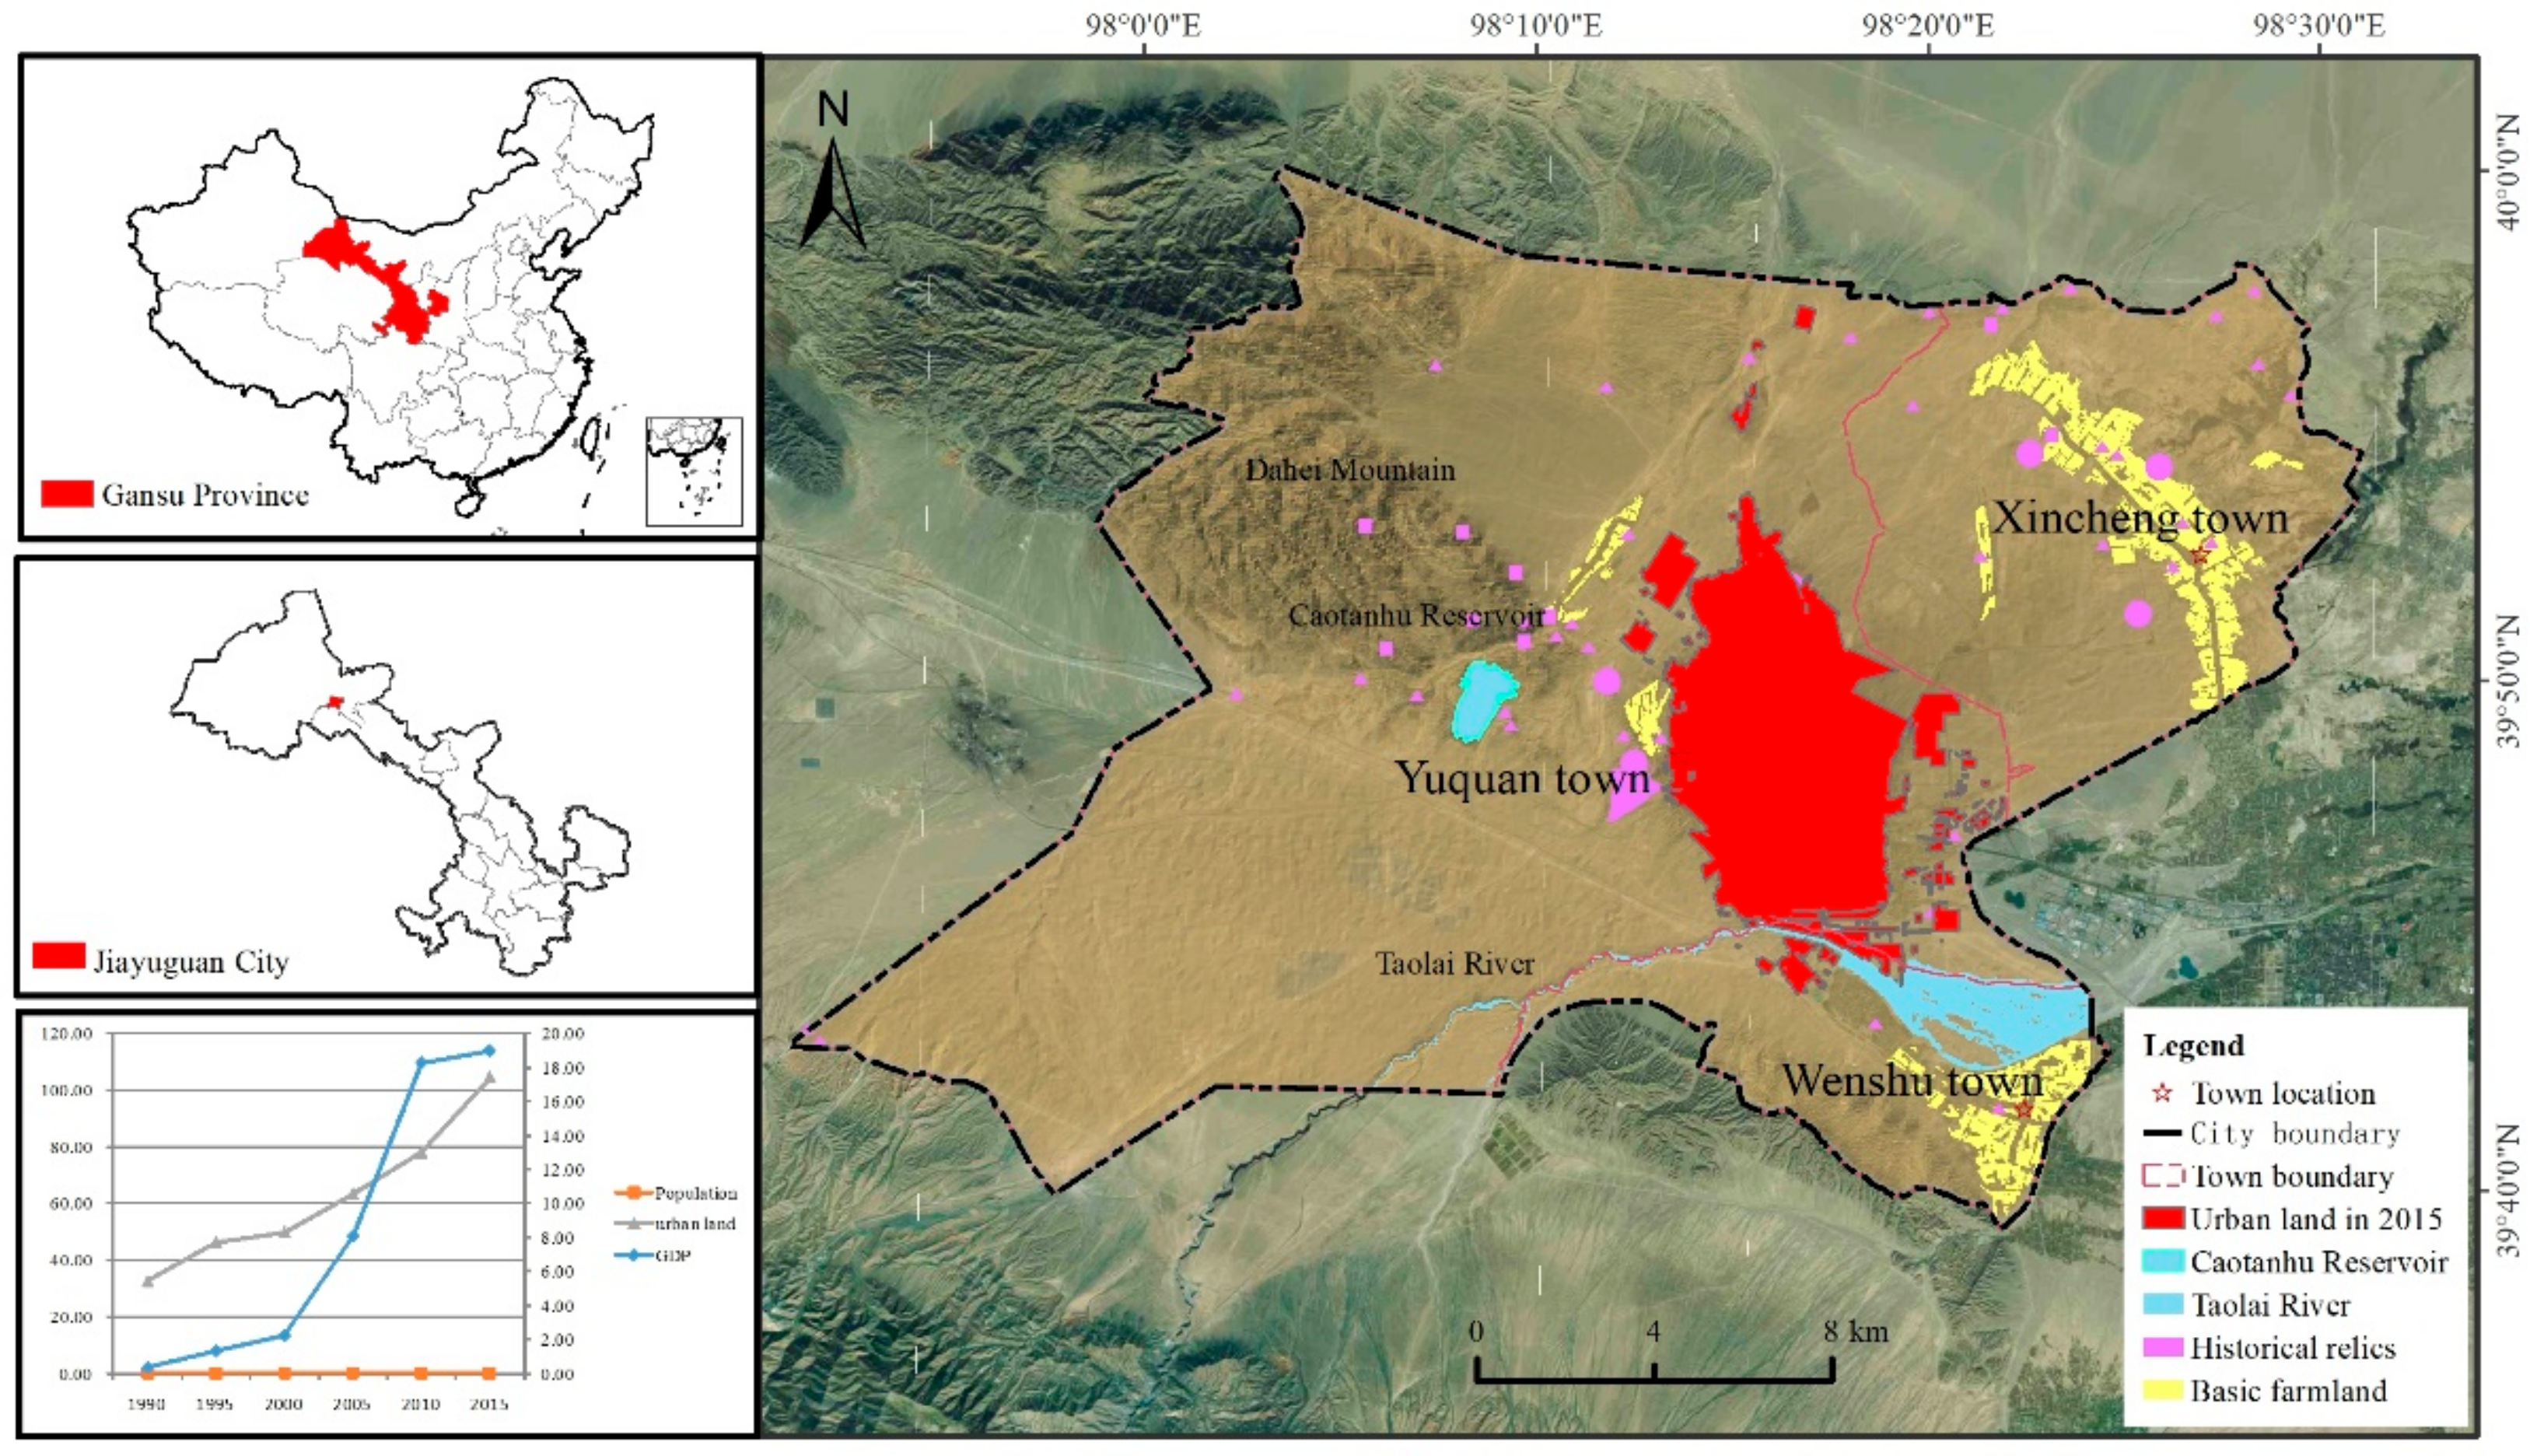
2.1. Study Area

Jiayuguan City is located in the middle of the Hexi Corridor in Gansu province, located in the arid area of Northwest China (Figure 1). It was surrounded by Gobi in the west and north, the farmland mainly scattered in the northeast and the southeast. The Dahei mountain and the Qilian mountain locates in the northwest and south of Jiayuguan City. The city’s elevation is 1412–2722 m and it has a typical temperate desert climate: The average annual temperature is 6.7–7.7 °C, average annual rainfall is 85.3 mm, average annual evaporation is 1923.4 mm, and the area has a fragile ecological environment [43]. Therefore, it is an important part of the national ecological barrier in China.
Jiayuguan City is one of five prefecture-level cities (Dongguan City and Zhongshan city in Guangdong Province, Sansha City and Danzhou City in Hainan Province, and Jiayuguan City in Gansu Province) in China that do not have municipal districts, located in Northwest, it has three towns (Yuquan town, Wenshu town, and Xincheng town). It is one of the most important and vigorous cities in the Hexi Corridor and in the Belt and Road Initiative. It has a total area of 2935 km2, and the urbanization rate exceeded 93% by the end of 2015 [43]. Historically, Jiayuguan City was set up because the Chinese key projection of constructing the Jiuquan Iron and Steel Company in 1965, it has experienced rapid urbanization in terms of the total gross domestic product (GDP) and urban land growth since the West Development Strategy in 2000. The GDP was 19.0 billion CNY in 2015, 8.26 times that was in 2000 (2.3 billion CNY), the total population was 0.24 million in 2015, 1.5 times that was in 2000 (0.16 million), and the urban land area in 2015 was 104.58 km2, 2.1 times that was in 2000 (49.90 km2). Urbanization in Jiayuguan City is characterized by rapid land urbanization accompanied by a relative lag in population urbanization. As a result, the urban sprawl, farmland occupation, and eco-environment deterioration have occurred in Jiayuguan City.
Affected by the trend of a new type of urbanization in China, Jiayuguan City is gradually starting to explore urban development transformation. In this case, Jiayuguan City has to change the patter of urban development, control the urban scale, and then guide rational urban development, which is conducive to promoting urban smart development and sustainable development. Therefore, how to delimit more reasonable UGBs for Jiayuguan City is an issue concern. At present, scholars have only unilaterally researched Jiayuguan from the perspective of city expansion type [39,42]. Worse, few scholars have studied UGBs from the perspective of urban expansion in Jiayuguan City. It is a typical industrial oasis city with a high level of urbanization, rapid urban sprawl, and fragile eco-environment, making it both typical and representative of the arid area of Northwest China, so Jiayuguan City was selected as the study case in this paper to explore the delimitation of the UGBs.

2.2. Data Sources

2.2.1. Landsat Image Processing and Derivation of Land Use Map

The Lanzhou-Wulumuqi railway was opened for operation in 1990, the West Development Strategy was implemented in 2000, the Belt and Road Initiative was proposed in 2013 and the Lanzhou-Wulumuqi High-Speed Railway was opened for operation in 2014, which has an great influence on the urban construction and economic development for Jiayuguan City, and considered the availability of the remote sensing images, so the study period was set from 1990 to 2015. In this study, the data source was the remote sensing data (Path135/Row32) for the years 1990, 1995, 2000, 2005, 2010, and 2015, respectively, obtained from the United States Geological Survey (USGS) website (www.usgs.gov) and Geospatial Data Cloud (www.gscloud.cn) [44,45,46]. The cell size is 30 by 30 m2 and the total number of cells in Jiayuguan city is 1,359,217. The remotely sensed images were corrected by geometric correction (using ground control points and topographic maps) and the atmospheric method (using dark object subtraction), which can meet the precision requirements of urban land use simulation. Using the Erdas9.2 and ArcGIS10.2 platforms, image data were preprocessed by band fusion, projection transformation, supervised classification, and data cutting [39,42]. According to the actual situation in the study area, the combination of visual interpretation and the supervised classification (maximum likelihood) method was used to extract the urban land from 1990 to 2015 (Figure 2) [10]. Other data were provided by the Gansu Academy of Natural Resources Planning [39,41,42].

2.2.2. Spatial Variables Selection and Expression

The main driving factors for the urban expansion are location, economy, transportation, natural resources, population, culture, national policy, and so on [7,39,42,44,47]. Referencing previous research on the driving forces of urban expansion and combining with the availability of data, we selected the population density (x1), distance from the city center (x2), distance from the town center (x3), distance from the airport (x4), distance from the railway (x5), distance from the highway (x6), and distance from the county road (x7) as the main driving factors of the urban expansion. Considering the terrain, fragile ecology, precious basic farmland, and the rich historical and cultural resources of Jiayuguan, we chose the slope (x8), the ecological protection zone (x9), the basic farmland protection zone (x10), and the historical relics protection zone (x11) as the global constraint factors. Namely, x8 is the natural condition factor, and x9, x10, and x11 are the spatial protection policy factors. All data have been normalized in GIS, so the value range is zero to one. The smaller the values of x2, x3, x4, x5, x6, x7, and x8, the greater the possibility of being converted to urban land; the opposite is true for x1, x9, x10, and x11. Currently, it is difficult to obtain the population density in Jiayuguan from the statistical data, so we extracted it from the night-time light data. The variables data sources are shown in Table 1, and the spatial variables of the MCE-CA model are shown in Figure 3.

3. Methodology

Currently, a large volume of research has been developed to study urban expansion, and many indices for measuring urban expansion have been developed [9,10,48,49,50,51]. In this study, four indicators based on the principle of representativeness, completeness, and data availability were selected to measure the urban expansion of Jiayuguan City—namely, the compactness index (C), the patch density index (PD), the spatial center of gravity transfer index (GT), and the orientation proportion index (OP). The MCE-CA model was applied to simulate the urban expansion and delimit the UGBs from the perspective of “anti-planning” in the first time. The analytic hierarchy process (AHP) was selected to determine the weight of the spatial variables, and the Kappa coefficient was selected to evaluate the simulated accuracy.

3.1. Morphological Index of Urban Spatial Expansion

(1)
The Compactness Index (C)
C has been widely used in the urban expansion and simulation literature. It can reflect the compactness characteristics of a city during different periods by the contour perimeter of its boundary [52]. It is calculated as follows:
C = 2 π A / P ,
where C refers to the city’s compactness; A refers to the urban area; and P refers to the urban contour perimeter. The larger the C, the more regular the boundary of the city, and the more compact the city is.
(2)
The Patch Density Index (PD)
Landscape pattern indices have been widely used to measure urban land expansion. PD is an important index that can reflect the fragmentation and connectivity of urban land [53]. This information can then be used to manage the urban land with a predictable effect on urban sprawl. The PD can be calculated by FRAGTAS 4.2, and is defined as follows:
P D = N A ,
where PD is the landscape patch density, indicating the degree of fragmentation of urban land; N is the number of urban land patches; and A is the total area of urban land use. The smaller the PD, the better the urban land connectivity.
(3)
The Spatial Center of Gravity Transfer Index (GT)
The center of gravity is an important indicator for describing the spatial distribution of geographic objects, and is often used in research on urban evolution and land use type change [54]. The GT can reflect the transfer longitude and latitude of the urban land in the study period, and thus to analyze the transfer distance of the center of gravity in the spatial structure evolution of urban land use, which can scientifically explain the spatial morphological change characteristics of the urban land. The GT is defined as follows:
X t = i = 1 n C t i × X i / C t i , Y t = i = 1 n C t i × Y i / C t i ,
D = ( x t + 1 x t ) 2 + ( y t + 1 y t ) 2 ,
β t + 1 = arctan ( y t + 1 y t x t + 1 x t ) , ( x t + 1 x t ) 0 , β t + 1 = π arctan ( y t + 1 y t x t + 1 x t ) , ( x t + 1 x t ) < 0 ,
where Xt and Yt are respectively the gravity longitude and latitude of urban land in period t; Xi and Yi are the i block urban land geometric center longitude and latitude, respectively; Cti is the area of the i block urban land in period t; D is the urban land transfer distance from period t to t + 1; and βt+1 refers to the urban land transfer directional intersection angle to due east from the period t to t + 1.
(4)
The Orientation Proportion Index (OP)
To further analyze the transfer directionality of the center of gravity in the process of urban land use spatial evolution, we chose the OP. It can reflect the expansion and development of urban land in a specific direction and can also reflect the land use patterns of different periods. In the following experiments, we used the equal fan analysis to calculate the OP of each position in different periods and to construct a radar map [46,55]. The equal fan analysis method involves dividing the study area into several equal fan-shaped areas with the center of the study area as the center of a circle with an appropriate radius, then uses GIS spatial overlay analysis to overlay and analyze the urban land layers at different time stages so that the OP in each area of urban land expansion can be obtained. In this study, the study area was divided into eight equal fan-shaped areas to analyze the OP of Jiayuguan City. The OP is defined as follows:
O P i = ( d i S t 2 d i S t 1 ) S t 2 S t 1 × 100 % ,
where OPi is the di orientation proportion during the t2t1 period; diSt2 is the area of time t2 on the orientation di; diSt1 is the area of t1 time on orientation di; St1 is the total area at t1; and St2 is the total area at t2.

3.2. MCE-CA Model

The MCE-CA model was first put forward by Wu and Webster and can accurately simulate the spatiotemporal patterns of land use change in two aspects of quantity and space and is more applicable to more subjective variables [31,56,57]. In this model, the state of a cell j at a time t+1 is determined by the state of its cell i and its neighborhood at a time t, and the transition of the state is determined by the transformation rules. The transformation rules of MCE-CA are expressed in Equations (9) and (10):
S g t + 1 = ( f P i t ) ,
P i t = exp [ α × ( r i t r max 1 ) ] ,
where S g t + 1 is the state of cell i at a time t + 1, and P l t is the transition probability of the cell i at a time t. The conversion probability is determined by the location attribute r i t of cell i, and rmax is the highest attribute value. α is the diffusion coefficient. The cellular location attribute is determined by a series of spatial elements, and can be expressed as in Equation (11):
r i t = w 1 x 1 + w 2 x 2 + w 3 x 3 + + w n x n × R i ,
where xn is the spatial variable, wn is the weight, and Ri is the restrictive factor. For example, when the cell i is in the restricted zone, the value of Ri is 0; otherwise, the value is 1. The MCE-CA model needs to load the remote sensing image data of land use and impact factors, set parameters, and obtain the weight of variables by the analytic hierarchy process method to finally simulate land use.
The MCE-CA model is a dynamic and complex systematic simulation tool that has been widely used in the simulation of urban expansion [33]. The Geographical Simulation and Optimization System (GeoSOS) was proposed by Professor Xia Li and developed by his team at Sun Yat-Sen University in China, and can be downloaded for free (http://www.geosimulation.cn). GeoSOS integrates cellular automata, agent-based models (ABMs), and swarm intelligence models (SIMs) to solve geographical process simulation and complex spatial optimization problems, and is implemented using the Microsoft.NET Framework version 2.0 and C# [58,59,60]. This system is equipped with common CA algorithms such as MCE-CA, logistic-CA, PCA-CA, ANN-CA, and decision-tree-CA. In the MCE-CA model, simulation data are required in ASCII or TXT file formats, and the TXT file format was used in this study. Therefore, in the process of simulation, the data were first converted to TXT, and the size of the grid was 30 m by 30 m based on the image resolution and the reality of the study area. Second, the main driving and global constraint factors were put into the MCE-CA model. Third, the weight of each parameters was determined by the AHP. Then, based on the remote sensing interpretation image from 2015, the situation of urban land expansion in 2020 and 2030 were simulated by the MCE-CA model. The technical process of the simulation UGBs in MCE-CA model was shown in Figure 4.

3.3. Analytic Hierarchy Process (AHP) Method

The AHP is the decision mechanism that a human being instinctively adopts when they are faced with the problem of decision-making, based on mathematics and psychology [61]. It provides a comprehensive and rational framework for structuring a decision problem, representing and quantifying its elements, relating those elements to overall goals, and evaluating alternative solutions. The AHP method is simple and effective for determining the weights of spatial variables. The specific formulas were detailed in [61]. The mean random consistency index (RI) was selected according to Table 2 [38], the RI was 1.51, and the random consistency ratio (CR) less than 0.1. The technical process of the AHP method in this paper was shown in Figure 5.

3.4. Kappa Coefficient

The Kappa coefficient has been employed by many studies of land use change to assess the accuracy of the results [32,38]. The Kappa coefficient can be calculated using the following formula:
K = M i = 1 r x i i i = 1 r x i + * x + i M 2 i = 1 r x i + * x + i ,
where K is the Kappa coefficient; M is the total number of cells in Jiayuguan (i.e., 1,359,217); xii is the elements in the main diagonal of the error matrix, xi+ is the sum of the ith row of the error matrix, and x+i is the sum of the ith column of the error matrix.
The Kappa coefficient usually falls between zero and one, and can be divided into five groups to represent different levels of consistency: 0.0 to 0.20 indicate extremely low consistency (slip), 0.21 to 0.40 general consistency (fair), 0.41 to 0.60 moderate consistency (moderate), 0.61 to 0.80 high consistency (substantial), and 0.81 to 1 indicate almost perfect consistency (perfect).

4. Results

4.1. Characteristics of Urban Land Use Spatiotemporal Expansion

As previously introduced in the Methodology, the four morphological indicators were calculated using Equations (1)–(6). The spatiotemporal expansion characteristics of urban land use in Jiayuguan City are depicted in following section, and the results are shown in Table 3.

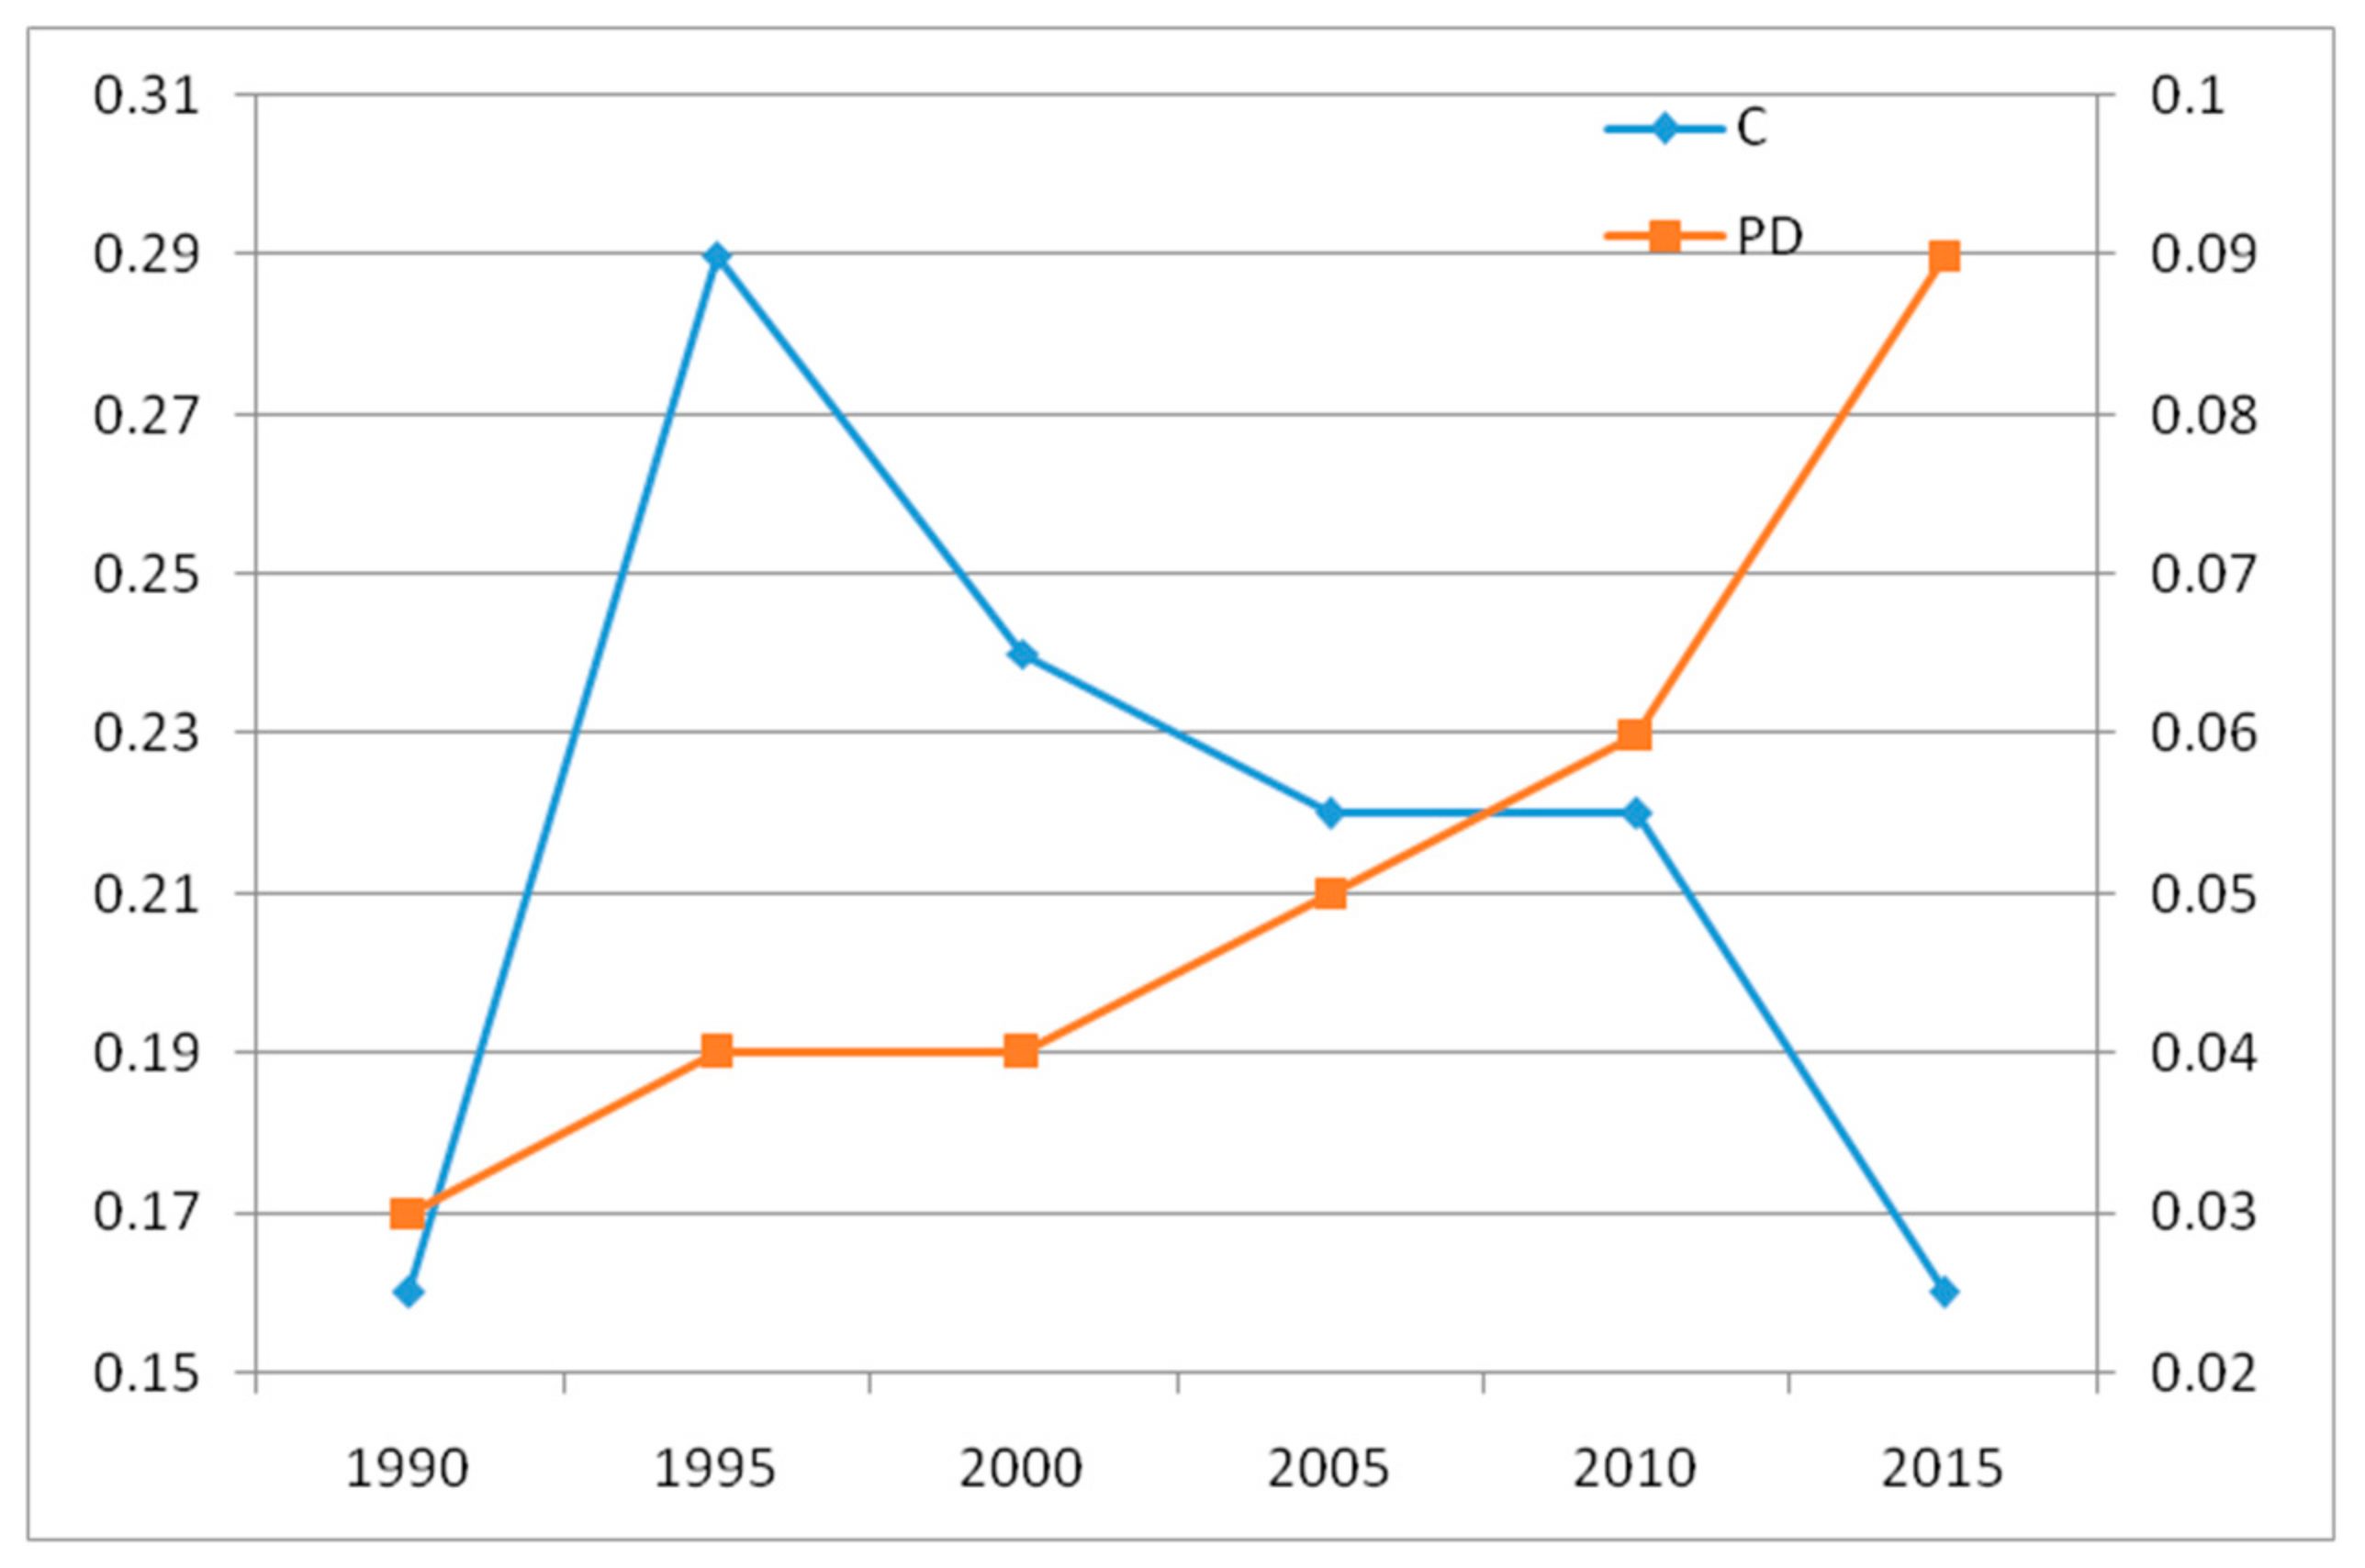
4.1.1. Characteristics of Urban Morphological Change

From Table 3, it can be seen that the urban land area of Jiayuguan City in 1990 was only 32.51 km2, while after the 26a of rapid development the urban land area was extended to 104.58 km2 at the end of 2015, representing an increase of 72.07 km2. The urban land area expanded by 3.22-fold, and the average annual growth rate was 2.77 km2 a−1, indicating that as time went by the urban land use in Jiayuguan City presented a sustained and rapid increasing trend. From 1990 to 2000, the urban land area increased by 17.39 km2, representing an average annual growth rate of 1.58 km2 a−1; however, in 2000–2015, the urban land area increased by 54.68 km2, representing an average annual growth rate of 3.65 km2 a−1. From 2000 to 2015, the area and speed of urban land expansion were higher than in 1990–2000, indicating the influence of the West Development Strategy and the Belt and Road Initiative. The land urbanization process in Jiayuguan continued to accelerate and the urban sprawl growth were rapid.
From Figure 6, it can be seen that the C and PD were all less than one from 1990 to 2015. Specifically, the C first increased (0.16–0.29) and then decreased (0.29–0.16), and the PD increased continuously (0.03–0.09), indicating that the urban land expansion form was non-compact, and the degree of fragmentation increased. From 1990 to 2000, the C increased from 0.16 to 0.24, indicating that the urban development presented a trend of compactness at this stage. This was a result of the gradual improvement of the internal infrastructure in Jiayuguan City, so the connection of the city increased, the distance from the city center decreased, and the outer boundary of the city was more regular. In 2000–2015, the C of urban land decreased from 0.24 to 0.16, indicating that the urban land presented a spreading trend in this period. This was due to the planning and construction of the Jiayuguan industrial park, and the scattered and irregular land use resulted in an irregular urban morphology. From 1990 to 2015, the urban land PD increased from 0.03 to 0.09, and urban land fragmentation increased, exhibiting a disordered scatter pattern. Influenced by the rapid economic development and population growth, the area of urban land increased continually and scattered gradually in Jiayuguan City, reflecting a continuous decline in urban land connectivity and urban landscape pattern. That is to say, the urban land of Jiayuguan City exhibited a trend of extensive expansion, which reduced the efficiency of land use and increased the cost of urban management.

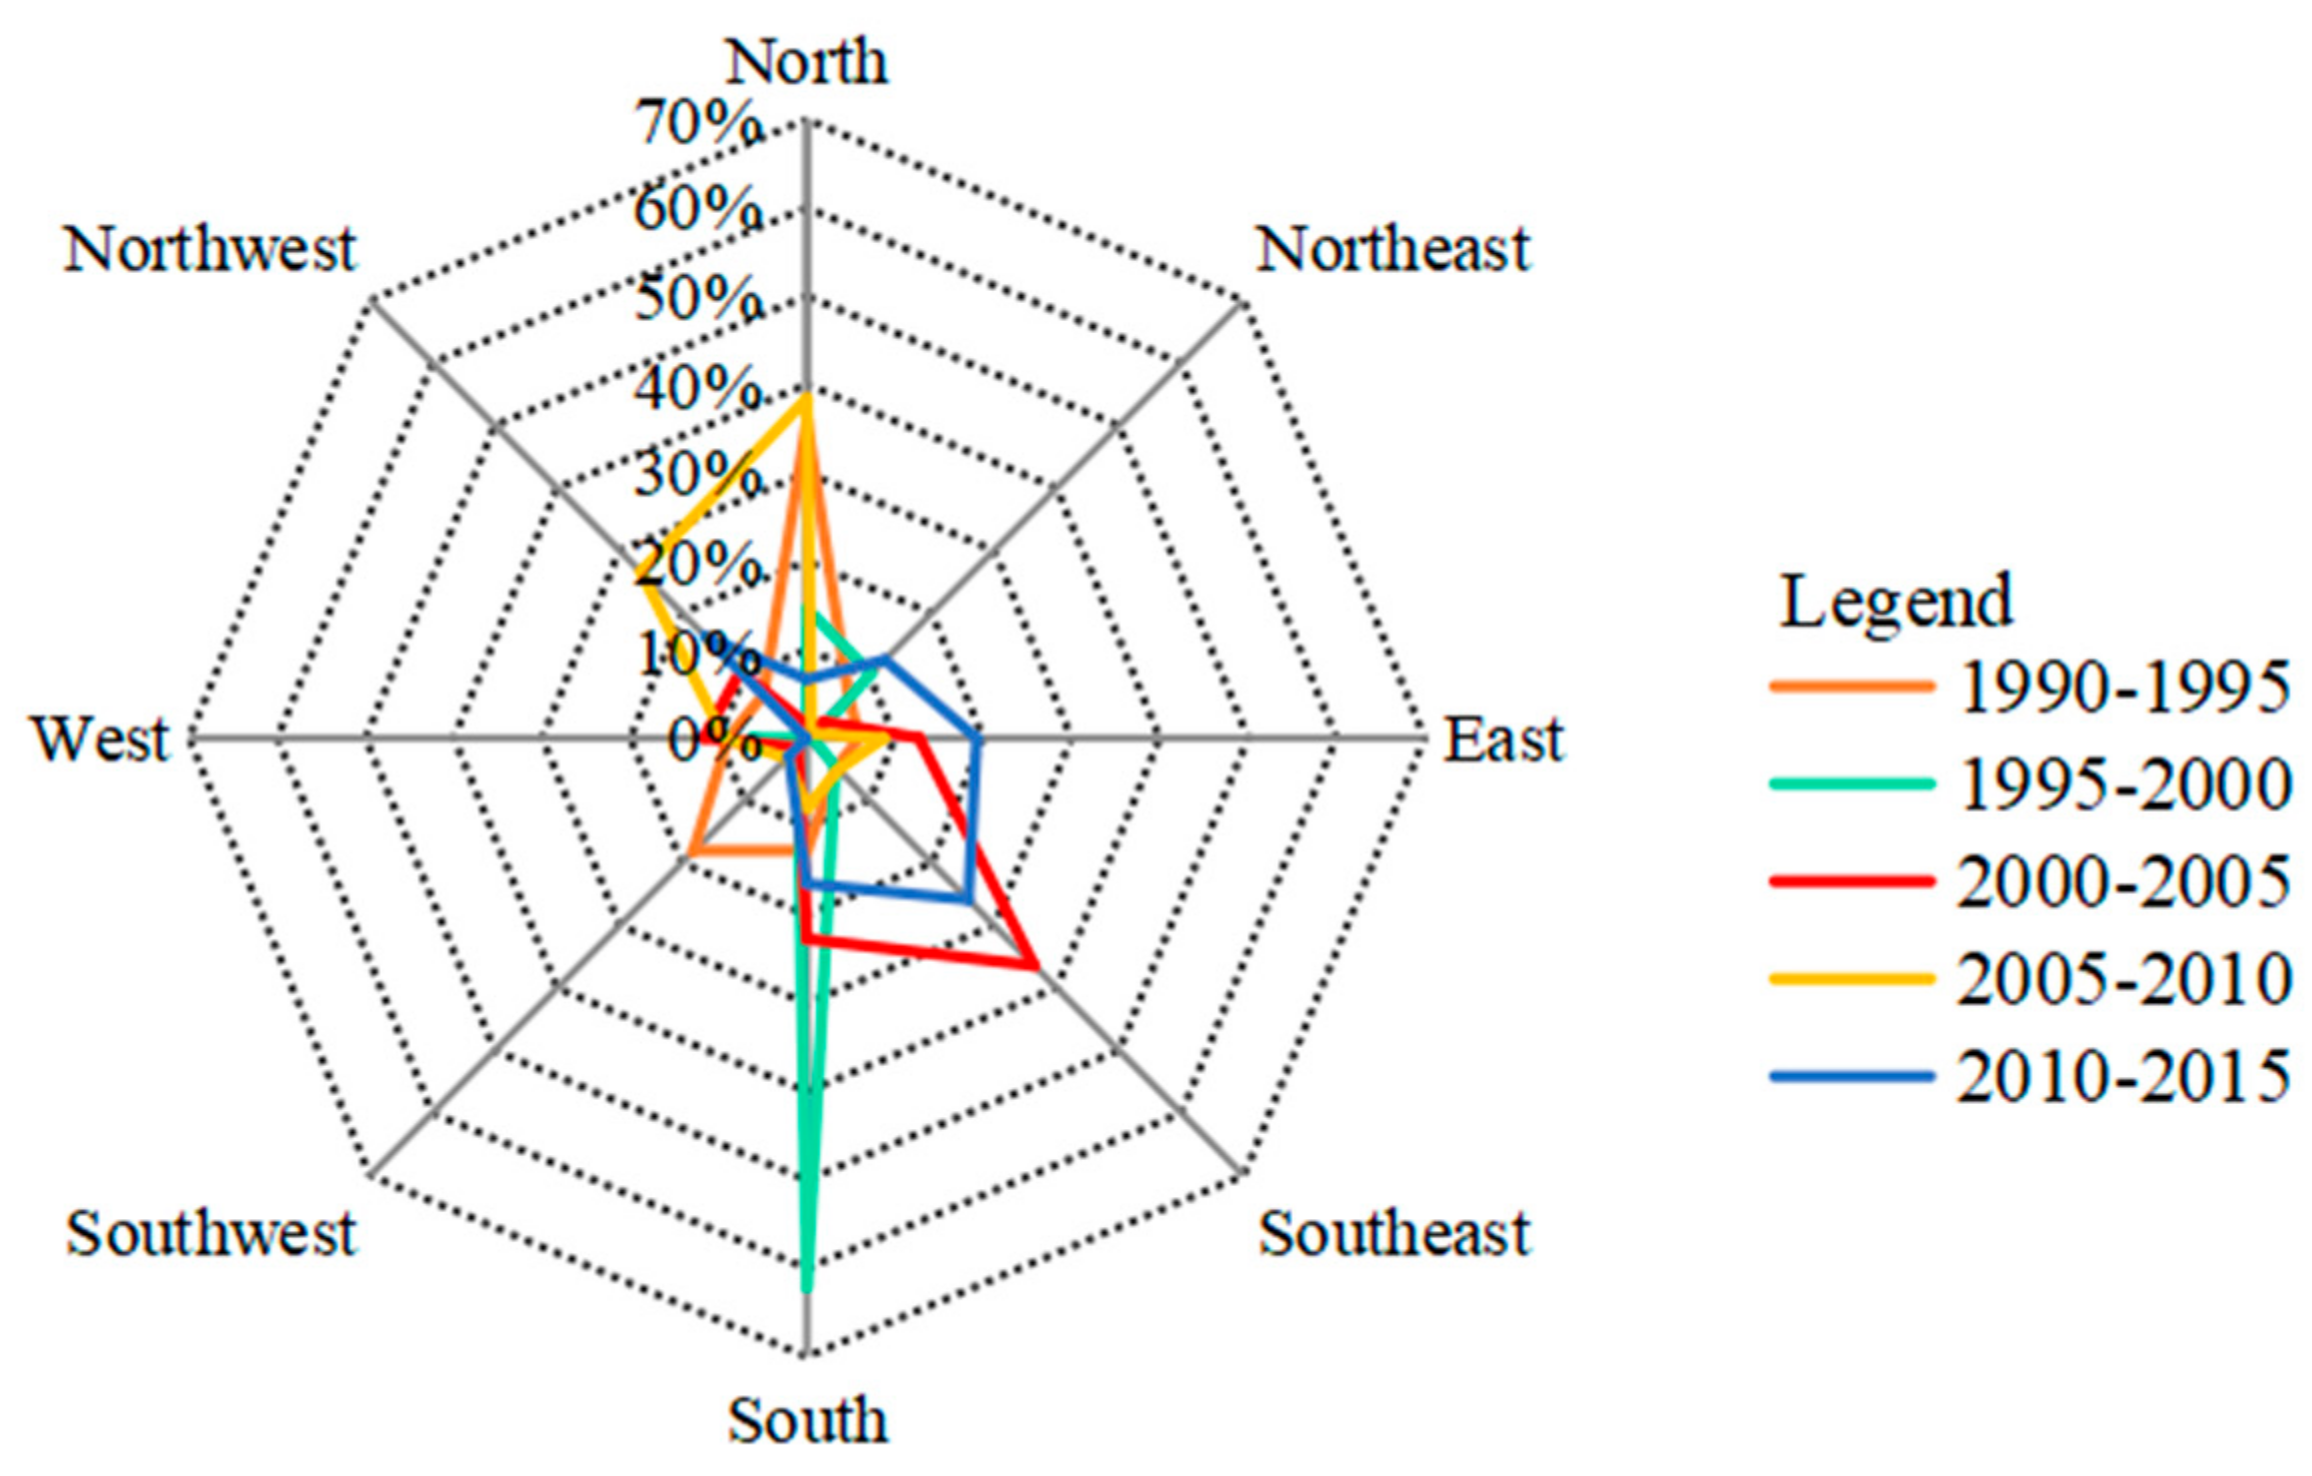
4.1.2. The Spatial Center of Gravity Transfer and Orientation Proportion Analysis

From Table 3 and Figure 2, it can be seen that the urban land use in Jiayuguan City has expanded rapidly. The GT mainly moved to the southeast and northwest and the transfer distance was 461.07 m in 1990–2015. Influenced by the West Development Strategy in China, the construction of Lanxin road network, the topographic features, and the attraction of the surrounding city, the urban land of Jiayuguan City was moved to the southeast and northwest and presented cluster expansion characteristics. Based on the equal fan analysis, we drew a radar map of urban expansion in Jiayuguan City (Figure 7). From Figure 7, it can be seen that the urban land of Jiayuguan City was moved mainly to the north; the OP was 35.84% and 38.41% in 1990–1995 and 2005–2010, respectively. However, the urban land was mainly moved to the south, and the OP was 62.14 in 1995–2000. Furthermore, the urban land of Jiayuguan City was mainly moved to the southeast, and the OPs were 36.43% and 25.88% in 2000–2005 and 2010–2015, respectively. It can be seen that the urban land of Jiayuguan City presented a continuous rapid expansion trend in the north, south, and southeast during the study period, and showed a rapid expansion trend in the northwest and southeast after 2000, which was due to the construction of the Lanxin railway and the Lianhuo highway. However, the urban land of Jiayuguan City extended slowly in the west and southwest because of the Dahei Mountain, Caotanhu reservoir, and Taolai River in the city administrative area.
Generally speaking, from 1990 to 2015, as the city was mainly distributed on the plains of the Hexi Corridor, the area of urban land use in Jiayuguan City expanded rapidly, the urban spatial expansion was relatively loose, and the urban sprawl growth characteristic was prominent. The spatial center of gravity shifted to the southeast and northwest, and the azimuth differentiation was distinct. Therefore, it is necessary for Jiayuguan City to delimit the UGBs, which can curb urban sprawl expansion, improve the efficiency of urban land use, and promote sustainable and livable urban development.

4.2. Delimiting the Urban Development Boundaries Based on the MCE-CA Model

As Professor Liangyong Wu said, “the main purpose of planning is not only to plan the build part, but also to do everything possible to protect the unused non-construction land” [62]. The size of the city and the function of construction land can be constantly changing but the landscape ecological infrastructure consisting of river water systems, green corridors, forest lands, and wetlands in the landscape is always necessary for the city and needs to be constant. The terrain condition is the foundation of urban development, which has an important influence on the scale, density, and layout of urban development. It is more important for industrial oasis city to protect ecological environment, natural resources and cultivated land resources for its sustainable development. Starting from the idea of “anti-planning”, we chose x8, x9, x10, and x11 as the global constraint factors. City is a complex and open system, the flow of population, material, energy, information, and capital could provide the driving force for urban development, and accelerate the process of industrialization and urbanization. From the perspective of “planning”, we chose x1, x2, x3, x4, x5, x6, and x7 as the driving factors (Figure 3).
Referring the National New Urbanization Planning of China (2014–2020) [63] and the Land Use Master Plan of Jiayuguan City (2006–2020) [64], which regulated the long-deadline is 2020. Referring to the Urban Master Plan of Jiayuguan City (2018–2030) regulated the near-deadline is 2020 and the long-deadline is 2030 [65]. Moreover, the 13th Five Year National Social-economic Plan of Jiayuguan City (2016–2020) regulated the long-deadline is 2020 [66]. In order to consistent with the related plan, so the MCE-CA model was used to simulate the urban expansion of Jiayuguan City in 2020 and 2030 and explore the delimitation of UGBs of it. The MCE-CA model was calculated by the Equations of (7)–(9). The variable weights were calculated by the AHP method (Table 4). The Kappa coefficients can be calculated in the Equation (10), and the Kappa coefficients for the simulations of 2020 and 2030 were 0.87 and 0.86, respectively, which meets the perfect designation. The simulation results are shown in Table 5.
From Table 5, it can be seen that, influenced by “anti-planning” thinking, which emphasizes ecological space conservation, the simulated urban land area of Jiayuguan City would be 110.73 km2 and 152.63 km2 in 2020 and 2030, respectively. At the same time, the simulated urban land compactness would increase to 0.18 and 0.23, and the simulated urban land patch density would decrease to 0.07 and 0.06. Compared with 2015 and influenced by the terrain and constraints of the ecological space, the compactness increased by 0.02 and 0.07, and the patch density decreased by 0.02 and 0.03 in 2020 and 2030, respectively. This indicates that the connectivity of urban land increased, urban development presented a compact trend. In addition, the spatial center of gravity of Jiayuguan City would shift to the southeast in the future and the distance of spatial center of gravity would be 359.66 m and 470.28 m in 2020 and 2030, respectively, which indicates that the simulated urban land use shows a cluster expansion pattern. Thus, this was consistent with the regional development strategy of Jiuquan–Jiayuguan integration in Gansu Province and the Belt and Road Initiative in China.
Due to the scarcity of water and soil resources and the fragile ecological environment, the compact spatial layout of an oasis city can avoid the disturbance and occupation of limited cultivated land resources and the fragile ecological environment, and at the same time can improve the intensity of urban land use and motivate the city’s livable and sustainable development [42,52]. The average annual growth rate of urban land in Jiayuguan City was 2.77 km2 a−1 from 1990 to 2015, while the average annual growth rate of urban land would be 2.52 km2 a−1 and 2.43 km2 a−1 from 1990 to 2020 and from 1990 to 2030, respectively. Thus, this showed that the urban land growth rate would continuously decline, it would be helpful for Jiayuguan City to transform the urban development from sprawl expansion to connotative development. At the same time, from the perspective of spatial layout, the simulated urban land would coordinate the relationship between urban development and environment protection, and the urban development would actively protect ecological space and historical and cultural space, which would meet the construction requirements of an eco-city. Therefore, based on the simulation results, the UGBs would have an area of 110.73 km2 and 152.63 km2 in 2020 and 2030, respectively (Figure 8). Thus, we believe that the MCE-CA model is an effective model to delimit UGBs, and it can provide a methodological reference for future research into UGBs in Chinese cities.

5. Discussion

5.1. Spatial Characteristic of Urban Land

The compactness index, patch density index, spatial center of gravity transfer index and orientation proportion index, and the remote sensing images of 1990, 1995, 2000, 2005, 2010, 2015 were selected to measure the urban expansion of Jiayuguan City from 1990 to 2015 in this study. The results show that the urban sprawl was rapid and spatial heterogeneity of Jiayuguan City were distinct, which is consistent with the study of Liu et al. [39]. In addition, Jiayuguan City is an industrial oasis city in the arid area of Northwest China, it has Jiabei industrial park, Jiadong industrial park, Jiaxi industrial park, and Jiugang aluminum production new industrial park, and the distribution of industrial land was scattered and leapfrogged. Since the West Development Strategy began to be implemented in 2000, the industrial land rapidly increased and the compactness of urban land was continuously declined. Furthermore, influenced by the Belt and Road Initiative and the Lanzhou–Wulumuqi High-Speed Railway, the urban land of Jiayuguan City and the patch density index would continuously increase, while the compactness index would decline according to the urban development trend, the urban sprawl growth were rapid. Therefore, it is necessary for Jiayuguan City to delimit the UGBs.

5.2. Technical Methods of Delimitation UGBs

It is critically important to delimit the UGBs in the new transitional stage of China’s industrialization and urbanization [1]. The conventional approaches to establishing UGBs are based on planners’ personal experiences, which lacks a scientific basis and quantitative support. Thus, the Inventory Approach [21], LUTI model [22], constrained CA model [29], FLUS model [31], SLEUTH model [67], ANN [68], and other models have been used by scholars to simulate urban development [7,37]. While these methods have paid more attention to urban growth, data availability, uncertainty [22,26], they regrettably paid scarce attention to the external urban ecological security and spatial policies constraints. The result of delimiting the UGBs is subjective to a certain extent, or can only simulate the expansion of the city, ignoring the urban ecological security. Therefore, new methods that can account for the urban ecological security and all of the forces driving urban development are necessary for the delimitation of UGBs. Compared with these methods, in this paper, the MCE-CA model was easily and scientifically used to quantitatively express the spatial policies and driving factors of urban expansion in space and time [34,55,60], thereby increasing the simulation accuracy. Especially, from the perspective of “anti-planning”, eleven factors were chosen, and the GIS spatial analysis method based on the MCE-CA model was applied to delimit the UGBs in this paper, which was an exploration of the methodology for delimiting the UGBs in China. Moreover, the ecological constraint, basic farmland protection, and historical relics protection were put into the MCE-CA model, which provides the decision-making support for urban planning and land use. Therefore, the UGBs based on the MCE-CA model were not only the boundaries of permitting construction and prohibiting construction, but would also translate the function of ecological space from passive defense to active constraint [28] and consciously protect the regional ecological environment, natural environment, and cultural resources, which would be helpful to realize a vision of urban sustainable development that is people-oriented, resource-conserving, as well as environmentally friendly in the future. The delimitation of the UGBs is an effective tool for China to realize ecological civilization construction and improve the spatial governance ability, this method can provide a methodological reference for future research of UGBs in Chinese cities.

5.3. Suggestions on UGBs

The related literature on UGBs in China has paid more attention to the delimitation technique, while the control measures and effective evaluation for UGBs have been rarely studied in China [24]. Regrettably, although the Law of the People’s Republic of China on Land Administration was revised on 26 August 2019, a specific control measure for UGBs has not been proposed. So we suggest—according to the “Opinions of the CPC Central Committee and the State Council on Accelerating the Ecological Civilization Construction”—from the spatial planning reform perspective, delimiting the UGBs based on “multi-planning integration” [69], combined with the basic requirement of protecting cultivated land and the ecological environment in the process of urban development. It is most important to form a unified and effective method of delimiting UGBs. Thus, the MCE-CA model proposed in this paper will been given priority to recommend. Furthermore, there are no clear legal requirements for UGBs in the City and Countryside Planning Act and the Law of the People’s Republic of China on Land Administration. So, it is necessary for China to enact a law of territorial planning or specific regulation of UGBs based on the legislative form of the National People’s Congress of the People’s Republic of China, and clarifying the rights and responsibilities of UGBs, which is consistent with the research of Fekade [70]. Additionally, referencing the latest streamlined UGB method in Oregon [19,71], for China the revision and supervisory mechanism of UGBs should been clarified in the law. Last but not least, delimiting UGBs is a process of integrating different objectives and is a way to coordinate different interests among different departments, participants, and ideals, while the public rarely have the chance to participate in the planning process in China. We suggest that enhancing public participation awareness, encouraging the public to participate throughout the process of delimiting the UGBs, and listening to suggestions from the public are necessary to guarantee that UGBs root and sprout in China.

5.4. Research Prospects of UGBs

This paper measured the spatial expansion rules of Jiayuguan City, and the MCE-CA model was applied to explore the delimitation of UGBs from the perspective of “anti-planning”, which provides a methodological reference for future research of UGBs in Chinese cities. However, China is the most populous country in the word, the policy of population and social-economy will have great influence on urban development in the future [1]. We have put the population in 2015 into the MCE-CA model with the population density, but the changes of future social-economy have much uncertainty, so we cannot put it into the MCE-CA model. In a future study, we will apply the GDP and other statistics to study the future social-economical development, and put it into the MCE-CA model to simulate the UGBs. Another limitation associated with this method is that the resolution of the remote sense image is relatively low, thus causing simulation biases, we will improve this in the future by interpreting the higher resolution image.
In the future, how to scientifically estimate the potential effect of the UGBs on land value, housing price, and individual behavior, and how to establish a sound policy system for UGBs in China still need to be researched and discussed. In addition, delimiting UGBs has become an important breakthrough in promoting the modernized construction of spatial governance systems and governance capacity in China [8], and should be fully combined with the recent planning and construction works including renovation and restoration projects (urban renovation and ecology restoration), urban utility tunnels, and the “Sponge city” initiative, and fully make use of existing construction land to improve its utilization intensive degree and benefits as well as improve the utilization efficiency of urban land, therefore promoting a livable city and sustainable development. Moreover, big data will also be an important approach to study the UGBs of China in the future (e.g., point of interest (POI) data, transit smart card data, and residential travel survey data) [26,72]. We will devote more effort to overcome the limitations in our study and apply the new approach to study the UGBs in the future works of China.

6. Conclusions

In this paper, the spatial and temporal characteristics of urban land expansion in Jiayuguan City from 1990 to 2015 were investigated by using the remote sensing image data, the GIS spatial analysis method, and four indicators. We found that the land urbanization process in Jiayuguan City continued to accelerate and the urban sprawl growth were rapid, influenced by the West Development Strategy and the Belt and Road Initiative. At the same time, the urban land connectivity and urban landscape pattern declined continuously, which reduced the efficiency of land use and destroyed the surrounding environment, so, it is necessary for Jiayuguan City to delimit the UGBs. Therefore, the MCE-CA model organically combining “positive” and “anti-planning” thinking was applied to explore the delimitation of the UGBs in Jiayuguan City in this study. The results showed that UGBs would have an area of 110.73 km2 and 152.63 km2 in 2020 and 2030, respectively. The connectivity of urban land would increase, urban development would present a compact tendency, and the spatial center of gravity would shift to the southeast in the future, so the MCE-CA model is helpful to solve the contradiction between environmental protection and urban development, achieving the mutually beneficial for social-economical development and environmental protection. Although the future social-economical development cannot be input into the MCE-CA model and the resolution of remote sensing image need to be improved, we believe that the MCE-CA model is an effective model to delimit UGBs and its advantages outweigh the limitations, it can provide a methodological reference for future research into UGBs in Chinese cities.
In addition, most of the studies on UGBs so far have focused on “what UGBs is and how to delimit them” [24], but the related regulations and legal system of UGBs were rarely investigated. We suggest that, from the spatial planning reform perspective, it would be necessary for China to formulate a series of policies to manage and implement the UGBs. Furthermore, the essence of delimiting the UGBs is a process to design policy, so innovating the management ideals, enhancing public participation awareness, encouraging the public to participate throughout the process of delimiting the UGBs, and listening to the suggestions from the public are necessary to guarantee that UGBs root and sprout in China.
In summary, city is a complex and open system, the MCE-CA model can coordinate the contradiction between environmental protection and urban development, and it provides the spatial information of urban land for decision makers or planners. Thus, the UGBs is an effective tool to promote the city sustainable development and the MCE-CA is applicable to explore the delimitation of UGBs in China.

Author Contributions

All authors contributed to this work. In particular, J.R. and X.L. had the original idea of this study; W.Z., L.Z., and X.L. conceived and designed the experiments; J.R., Y.G., J.G., and Y.W. made substantial contributions to the data processing and analysis; X.L., L.Z., and W.Z. revised the paper critically; J.R., Y.H., and J.M. contributed original Landsat TM images and land use classification data; J.R. wrote the paper; and R.M. gave valuable suggestions for the revision of the paper. All authors read and approved the final manuscript. All authors have read and agreed to the published version of the manuscript.

Funding

This research was funded by the [National Natural Science Foundation of China] grant number [41977415], the [Social Science Foundation for Young Projection of Qinghai University] grant number [2018-QSY-4], the [National Social Science Foundation for Young Projection of China] grant number [16CJY012], and the [Postdoctoral Science Foundation of China] grant number [2016M600121].

Acknowledgments

We sincerely thank the Gansu Academy of Natural Resources Planning for supplying the research data, and sincere thanks are given for the valuable comments and contributes of anonymous reviewers and editors.

Conflicts of Interest

The authors declare no conflicts of interest.

References

  1. Chen, M.X.; Liu, W.D.; Lu, D.D. Challenges and the way forward in China’s new-type urbanization. Land Use Policy 2015, 55, 334–339. [Google Scholar] [CrossRef]
  2. Alex, A.; David, P. Anti-sprawl policies in a system of congested cities. Reg. Sci. Urban Econ. 2008, 38, 408–423. [Google Scholar]
  3. Deng, X.Z.; Huang, J.K.; ScottRozelle, R.; Emi, U. Growth, population and industrialization, and urban land expansion of China. J. Urban Econ. 2008, 63, 96–115. [Google Scholar] [CrossRef]
  4. Wang, Y.F.; Liu, Y.S.; Li, Y.H.; Li, T.T. The spatiotemporal patterns of urban–rural development transformation in China since 1990. Habitat Int. 2016, 53, 178–187. [Google Scholar] [CrossRef]
  5. Yuan, Y.J.; Chen, D.X.; Wu, S.H.; Mao, L.J.; Tong, G.J.; Yan, D.H. Urban sprawl decreases the value of ecosystem services and intensifies the supply scarcity of ecosystem services in China. Sci. Total Environ. 2019, 697, 134170. [Google Scholar] [CrossRef]
  6. Gao, J.L.; Wei, Y.D.; Chen, W.; Chen, J.L. Economic transition and urban land expansion in Provincial China. Habitat Int. 2014, 44, 461–473. [Google Scholar] [CrossRef]
  7. Kuang, W.H.; Liu, J.Y.; Dong, J.W.; Chi, W.F.; Zhang, C. The rapid and massive urban and industrial land expansions in China between 1990 and 2010: A CLUD based analysis of their trajectories, patterns, and drivers. Landsc. Urban Plan. 2016, 145, 21–33. [Google Scholar] [CrossRef]
  8. Chen, M.X.; Gong, Y.H.; Lu, D.D.; Ye, C. Build a people-oriented urbanization: China’s new-type urbanization dream and Anhui model. Land Use Policy 2019, 80, 1–9. [Google Scholar] [CrossRef]
  9. Fang, C.L.; Wang, Z.B. Quantitative diagnoses and comprehensive evaluations of the rationality of Chinese urban development patterns. Sustainability 2015, 7, 3859–3884. [Google Scholar] [CrossRef] [Green Version]
  10. Liu, J.Y.; Kuang, W.H.; Zhang, Z.X.; Xu, X.; Qin, Y.; Ning, J.; Zhou, W.; Zhang, S.; Li, R.; Yan, C.; et al. Spatiotemporal characteristics, patterns, and causes of land-use changes in China since the late 1980s. J. Geogr. Sci. 2014, 24, 195–210. [Google Scholar] [CrossRef]
  11. Nelson, A.C.; Moore, T. Assessing Urban Growth Management: The Case of Portland, Oregon, the USA’s Largest Urban Growth Boundary. Land Use Policy 1993, 10, 293–302. [Google Scholar] [CrossRef]
  12. Cho, H.S.; Chen, Z.; Yen, S.T.; Eastwood, D.B. Estimating Effects of an Urban Growth Boundary on Land Development. J. Agric. Appl. Econ. 2006, 38, 287–298. [Google Scholar] [CrossRef] [Green Version]
  13. American Planning Association. Growing Smart Legislative Guidebook: Model Statutes for Planning and the Management of Change; American Planning: Washington, DC, USA, 2002. [Google Scholar]
  14. Nelson, A.C.; Duncan, J.B. Growth Management: Principles and Practice; American Planning Association: Chicago, IL, USA, 1995. [Google Scholar]
  15. Jun, M.J. The Effects of Portland’s Urban Growth Boundary on Urban Development Patterns and Commuting. Urban Stud. 2004, 41, 1333–1348. [Google Scholar] [CrossRef] [Green Version]
  16. Ding, C.R.; Gerrit, J.K.; Lewis, D.H. Managing urban growth with urban growth boundaries: A theoretical analysis. J. Urban Econ. 1998, 46, 53–68. [Google Scholar] [CrossRef]
  17. Turnbull, G.K. Urban growth controls: Transitional dynamics of development fees and growth boundaries. J. Urban Econ. 2004, 55, 215–237. [Google Scholar] [CrossRef]
  18. Tayyebi, A.; Pijanowski, B.C.; Pekin, B. Two rule-based Urban Growth Boundary Models applied to the Tehran Metropolitan Area, Iran. Appl. Geogr. 2011, 31, 908–918. [Google Scholar] [CrossRef]
  19. Dempsey, J.A.; Plantinga, A.J. How well do urban growth boundaries contain development? Results for Oregon using a difference-in-difference estimator. Reg. Sci. Urban Econ. 2013, 43, 996–1007. [Google Scholar] [CrossRef]
  20. Gennaio, M.P.; Hersperger, A.M.; Bürgi, M. Containing urban sprawl—Evaluating effectiveness of urban growth boundaries set by the Swiss Land Use Plan. Land Use Policy 2009, 26, 224–232. [Google Scholar] [CrossRef]
  21. Knaap, G.J.; Hopkins, L.D. The Inventory Approach to Urban Growth Boundaries. J. Am. Plan. Assoc. 2001, 67, 314–326. [Google Scholar] [CrossRef]
  22. Acheampong, R.A. Land use-transport interaction modelling: A review of the literature and future research directions. J. Transp. Land Use 2015, 8, 11–38. [Google Scholar]
  23. Kill, M.; Moeckel, R.; Thill, J.C. Land use, transport, and environment interactions: WCTR 2016 contributions and future research directions. Comput. Environ. Urban Syst. 2019, 77, 101335. [Google Scholar]
  24. Long, Y.; Mao, Q.Z.; Dang, A.R. Beijing urban development model: Urban growth analysis and simulation. Tsinghua Sci. Technol. 2009, 14, 782–794. [Google Scholar] [CrossRef]
  25. Long, Y.; Han, H.Y.; Tu, Y.C.; Shu, X.F. Evaluating the effectiveness of urban growth boundaries using human mobility and activity records. Cities 2015, 46, 76–84. [Google Scholar] [CrossRef]
  26. Liu, J.X.; Zhang, G.; Zhuang, Z.Z.; Cheng, Q.; Gao, Y.; Chen, T.; Huang, Q.; Xu, L.; Chen, N. A new perspective for urban development boundary delineation based on SLEUTH-InVEST model. Habitat Int. 2017, 70, 13–23. [Google Scholar] [CrossRef]
  27. Zheng, B.; Liu, G.S.; Wang, H.M.; Zhu, X.; Wang, M.; Yi, L. Study on the Delimitation of the Urban Development Boundary in a Special Economic Zone: A Case Study of the Central Urban Area of Doumen in Zhuhai, China. Sustainability 2018, 10, 756. [Google Scholar] [CrossRef] [Green Version]
  28. Ma, S.F.; Li, X.; Cai, Y. Delimiting the urban growth boundaries with a modified ant colony optimization model. Comput. Environ. Urban Syst. 2017, 62, 146–155. [Google Scholar] [CrossRef]
  29. Long, Y.; Han, H.Y.; Lai, S.K.; Mao, Q.Z. Urban growth boundaries of the Beijing Metropolitan Area: Comparison of simulation and artwork. Cities 2012, 31, 337–348. [Google Scholar] [CrossRef]
  30. Duan, D.G.; Lu, S.Y.; Tian, T. Some preliminary exploration of UGB establishment management system. Planners 2009, 8, 11–14. (In Chinese) [Google Scholar]
  31. Liang, X.; Liu, X.P.; Li, X.; Chen, Y.; Tian, H.; Yao, Y. Delineating multiscenario urban growth boundaries with a CA based FLUS model and morphological method. Landsc. Urban Plan. 2018, 177, 47–63. [Google Scholar] [CrossRef]
  32. Liu, Y.L.; Hu, Y.M.; Long, X.Q.; Liu, L.; Liu, X. Analysis of the Effectiveness of Urban Land-Use-Change Models Based on the Measurement of spatiotemporal, Dynamic Urban Growth: A Cellular Automata Case Study. Sustainability 2017, 5, 796. [Google Scholar] [CrossRef] [Green Version]
  33. Chen, Y.M.; Li, X.; Li, X.P.; Liu, X.; Ai, B.; Li, S. Capturing the varying effects of driving forces over time for the simulation of urban growth by using survival analysis and cellular automata. Landsc. Urban Plan. 2016, 152, 59–71. [Google Scholar] [CrossRef]
  34. Yu, K.J.; Li, H.L.; Li, D.H. The negative approach and ecological infrastructure: The smart preservation of natural system in the process of urbanization. J. Nat. Resour. 2008, 23, 937–958. [Google Scholar]
  35. Yu, K.J.; Li, D.H.; Li, N.Y. The evolution of greenways in China. Landsc. Urban Plan. 2006, 14, 223–239. [Google Scholar] [CrossRef]
  36. Zhang, L.; Wang, H. Planning an ecological network of Xiamen Island (China) using landscape metrics and network analysis. Landsc. Urban Plan. 2006, 78, 449–456. [Google Scholar] [CrossRef]
  37. Liu, X.P.; Ma, L.; Li, X.; Ai, B.; Li, S.; He, Z. Simulating urban growth by integrating landscape expansion index (LEI) and cellular automata. Int. J. Geogr. Inf. Sci. 2014, 1, 148–163. [Google Scholar] [CrossRef]
  38. Jiang, P.; Cheng, Q.; Gong, Y.; Wang, L.; Zhang, Y.; Cheng, L.; Chen, D. Using Urban Development Boundaries to Constrain Uncontrolled Urban Sprawl in China. Ann. Am. Assoc. Geogr. 2016, 106, 1321–1343. [Google Scholar] [CrossRef]
  39. Liu, H.L.; Shi, P.J.; Tong, H.L.; Zhu, G.; Liu, H.; Zhang, X.; Wei, W.; Wang, X. Characteristics and driving forces of spatial expansion of oasis cities and towns in Hexi Corridor, Gansu Province, China. Chin. Geogr. Sci. 2015, 2, 250–262. [Google Scholar] [CrossRef]
  40. Lei, J.; Dong, W.; Yang, Y.; Lu, J.; Sterr, T. Interactions between water-land resources and oasis urban development at the northern slopes of the Tianshan Mountains, Xinjiang, China. J. Arid Land 2012, 2, 221–229. [Google Scholar] [CrossRef]
  41. Sun, C.L.; Zhang, X.L.; Jin, N.; Du, H.R.; Ma, W.W. Spatial difference features and organization optimization of cities and towns in Tarim River Basin. J. Arid Land 2010, 2, 33–42. [Google Scholar]
  42. Liu, Y.Q.; Song, W.; Deng, X.Z. Understanding the spatiotemporal variation of urban land expansion in oasis cities by integrating remote sensing and multi-dimensional DPSIR-based indicators. Ecol. Indic. 2019, 96, 23–37. [Google Scholar] [CrossRef]
  43. Jiayuguan City Bureau of Statistic of China (JCBSC). Jiayuguan City Statistical Yearbook; Jiayuguan City Bureau of Statistic of China (JCBSC): Jiayuguan, China, 2016. [Google Scholar]
  44. Bumairiyemu, M.; Ding, J.L.; Bibula, S.; Alimujiang, K. Characterizing urban expansion of Korla City and its spatial-temporal patterns using remote sensing and GIS methods. J. Arid Land 2017, 3, 458–470. [Google Scholar]
  45. Gong, J.Z.; Liu, Y.S.; Xia, B.C.; Zhao, G.W. Urban ecological security assessment and forecasting, based on a cellular automata model: A case study of Guangzhou, China. Ecol. Model. 2017, 24, 3612–3620. [Google Scholar] [CrossRef]
  46. Yu, W.H.; Zang, S.Y.; Wu, C.S.; Liu, W.; Na, X. Analyzing and modeling land use land cover change (LUCC) in the Daqing City, China. Appl. Geogr. 2011, 2, 600–608. [Google Scholar] [CrossRef]
  47. Liu, J.Y.; Wang, X.S.; Zhuang, D.F. Application of convex hull in identifying the types of urban land expansion. Acta Geogr. Sin. 2003, 6, 885–892. [Google Scholar]
  48. Wang, Z.B.; Luo, K.; Song, J.; Xu, J. Characteristics of change and strategic considerations of the structure of urban functional divisions in the Yangtze River Economic Belt since 2000. Prog. Geogr. 2015, 11, 3575–3582. [Google Scholar]
  49. Tian, G.J.; Liu, J.Y.; Xie, Y.C.; Yang, Z.; Zhuang, D.; Niu, Z. Analysis of spatiotemporal dynamic pattern and driving forces of urban land in China in 1990s using TM images and GIS. Cities 2005, 6, 400–410. [Google Scholar] [CrossRef]
  50. Jiao, L.M.; Mao, L.F.; Liu, Y.L. Multiorder landscape expansion index: Characterizing urban expansion dynamics. Landsc. Urban Plan. 2014, 37, 30–39. [Google Scholar]
  51. Seto, K.C.; Fragkias, M. Quantifying spatiotemporal patterns of urban land-use change in four cities of china with time series landscape metrics. Landsc. Ecol. 2005, 7, 871–888. [Google Scholar] [CrossRef]
  52. Mouratidis, K. Compact city, urban sprawl, and subjective well-being. Cities 2019, 92, 261–272. [Google Scholar] [CrossRef]
  53. Xu, Z.; Zhang, Z.; Li, C. Exploring urban green spaces in China: Spatial patterns, driving factors and policy implications. Land Use Policy 2019, 89, 104249. [Google Scholar] [CrossRef]
  54. Zhang, S.; Zhang, J.; Li, F. Vector analysis theory on landscape pattern in Sanjiang plain marsh, China. Wetl. Sci. 2004, 9, 161–170. [Google Scholar]
  55. Juan, C.D.; Nancy, L.G.; Gorge, E.P.; Paula, R.; Wilson, A.V. Spatiotemporal dynamics of urban growth in Latin American cities: An analysis using nighttime light imagery. Landsc. Urban Plan. 2019, 191, 103640. [Google Scholar]
  56. WU, F.; Webster, C.J. Simulation of land development through the integration of cellular automata and multicriteria evaluation. Environ. Plan. B 1998, 25, 103–126. [Google Scholar] [CrossRef]
  57. Zhang, X.J.; Zhou, Q.G.; Wang, Z.L.; Wang, F.H. Simulation and prediction of land use change in Three Gorges Reservoir Area based on MCE-CA-Markov. Trans. Chin. Soc. Agric. Eng. 2017, 33, 268–277. (In Chinese) [Google Scholar]
  58. Li, X.; Chen, Y.; Liu, X.; Li, D.; He, J. Concepts, methodologies, and tools of an integrated geographical simulation and optimization system. Int. J. Geogr. Inf. Sci. 2011, 25, 633–655. [Google Scholar] [CrossRef] [Green Version]
  59. Li, X.; Lao, C.; Liu, X.; Chen, Y. Coupling urban cellular automata with ant colony optimization for zoning protected natural areas under a changing landscape. Int. J. Geogr. Inf. Sci. 2011, 25, 575–593. [Google Scholar] [CrossRef]
  60. Li, X.; Li, D.; Liu, X.P. Geographical simulation and optimization system (GeoSOS) and its cuttingedge researches. Adv. Earth Sci. 2009, 8, 899–907. (In Chinese) [Google Scholar]
  61. Saaty, T.L. Decision-making with the AHP: Why is the principal eigenvector necessary. Eur. J. Oper. Res. 2003, 145, 85–91. [Google Scholar] [CrossRef]
  62. Wu, L.Y. Rehabilitation in Beijing. Habitat Int. 1991, 15, 55–61. [Google Scholar]
  63. Communist Party of China Central Committee and the State Council. National New Urbanization Planning of China (2014–2020). 2014. Available online: http://www.gov.cn/gongbao/content/2014/content_2644805.htm (accessed on 16 March 2014).
  64. Jiayuguan City Bureau of Planing of China. Land Use Master Plan of Jiayuguan City (2006–2020); Jiayuguan City Bureau of Planing of China: Jiayuguan, China, 2007. [Google Scholar]
  65. Jiayuguan City Bureau of Planing of China. Master Plan of Jiayuguan City (2018–2030); Jiayuguan City Bureau of Planing of China: Jiayuguan, China, 2018. [Google Scholar]
  66. Government of Jiayuguan City. The 13th Five Year National Social-Economic Plan of Jiayuguan City (2016–2020); Government of Jiayuguan City: Jiayuguan, China, 2016.
  67. Dietzel, C.; Clarke, K.C. Toward optimal calibration of the SLEUTH land use change model. Trans. GIS 2007, 1, 29–45. [Google Scholar] [CrossRef]
  68. Tayyebi, A.; Pijanowski, B.; Tayyebi, A.H. An urban growth boundary model using neural networks, GIS and radial parameterization: An application to Tehran, Iran. Landsc. Urban Plan. 2011, 100, 35–44. [Google Scholar] [CrossRef]
  69. Liu, Y.; Fu, B.; Zhao, W.; Wang, S.; Deng, Y. A solution to the conflicts of multiple planning boundaries: Landscape functional zoning in a resource-based city in China. Habitat Int. 2018, 77, 43–55. [Google Scholar] [CrossRef]
  70. Fekade, W. Defificits of formal urban land management and informal responses under rapid urban growth, an international perspective. Habitat Int. 2000, 24, 127–150. [Google Scholar] [CrossRef]
  71. Ye, Y.; Tochen, R.; Wang, C. Exploration of the streamlined urban growth boundary method in Oregon and its potential application to China. Urban Dev. Study 2017, 33, 88–97. (In Chinese) [Google Scholar]
  72. Zhou, L.; Sun, Q.K.; Dan, X.W.; Wang, S.H. Comparison on Multi-Scale Urban Expansion Derived from Nightlight Imagery between China and India. Sustainability 2019, 11, 4509. [Google Scholar] [CrossRef] [Green Version]
Figure 1. Location of the study area and land use map in 2015. Source: Drawn by the authors.
Sustainability 12 00210 g001
Figure 2. The eight-direction expansion diagram of urban land use in Jiayuguan. Source: Drawn by the authors.
Sustainability 12 00210 g002
Figure 3. Spatial variables in the MCE-CA model. Source: Drawn by the authors. Note: x1, x2, x3, x4, x5, x6, x7, x9, x10, and x11 were obtained from Euclidean distance of spatial analyst tool in geographic information system (GIS), the timeline of these factors is in 2015. The x8 was obtained from the Raster surface of 3D analyst tool in GIS, the timeline of it is in 2009.
Sustainability 12 00210 g003aSustainability 12 00210 g003b
Figure 4. The technical process of the simulation urban growth boundaries (UGBs) in MCE-CA model. Source: Drawn by the authors.
Sustainability 12 00210 g004
Figure 5. The process of the analytic hierarchy process (AHP) method. Source: Drawn by the authors. Note: x1: Population density; x2: Distance from the city center; x3: Distance from the town center; x4: Distance from the airport; x5: Distance from the railway; x6: Distance from the highway; x7: Distance from the county road; x8: Slope; x9: Ecological protection zone; x10: Basic farmland protection zone; and x11: Historical relics protection zone.
Sustainability 12 00210 g005
Figure 6. Changes of the C and PD from 1990 to 2015. Source: Drawn by the authors.
Sustainability 12 00210 g006
Figure 7. The radar map of urban land use directional expansion in Jiayuguan City from 1990 to 2015. Source: Drawn by the authors.
Sustainability 12 00210 g007
Figure 8. Urban development boundaries of Jiayuguan City. Source: Drawn by the authors.
Sustainability 12 00210 g008
Table 1. Data source of spatial variables in the cellular automata (CA) model based on multi-criteria evaluation (MCE-CA) model.
TypeVariableDescriptionValueData Source
Driving factorsx1Population density0–1Night-time light data from the National Centers for Environmental Information (NCEI) of the National Oceanic and Atmospheric Administration (NOAA) (https://www.ngdc.noaa.gov/ngdc.html)
x2Distance from the city center0–1City center data from Gansu Academy of Natural Resources Planning
x3Distance from the town center0–1Town center data from Gansu Academy of Natural Resources Planning
x4Distance from the airport0–1Airport data from Gansu Academy of Natural Resources Planning
x5Distance from the railway0–1Railway data from Gansu Academy of Natural Resources Planning
x6Distance from the highway0–1Highway data from Gansu Academy of Natural Resources Planning
x7Distance from the county road0–1County road data from Gansu Academy of Natural Resources Planning
Constraint factorsx8Slope0–1Digital Elevation Model (DEM) data from Geospatial Data Cloud (http://www.gscloud.cn)
x9Ecological protection zone0–1Ecological protection zone data from Gansu Academy of Natural Resources Planning
x10Basic farmland protection zone0–1Basic farmland protection zone data from Gansu Academy of Natural Resources Planning
x11Historical relics protection zone0–1Historical relics protection zone data from Gansu Academy of Natural Resources Planning
Source: Drawn by the authors.
Table 2. Selection criteria of RI.
N1234567891011
RI000.580.901.121.241.321.411.451.491.51
Note: The source of the Table 2 is from the reference [36].
Table 3. The characteristic indices of urban land use expansion in Jiayuguan from 1990 to 2015.
YearArea/km2CPDX YD/mOPβ/Degree Minute Second
199032.51 0.16 0.0398°16′16″39°48′34″
199546.47 0.29 0.04 98°16′16″39°48′45″348.92N103°41′31″
200049.90 0.24 0.0498°16′16″39°48′40″138.91S92°16′50″
200563.41 0.22 0.05 98°16′23″39°48′24″559.79SE63°30′1″
201077.94 0.22 0.0698°16′23″39°48′42″580.96N106°32′29″
2015104.58 0.16 0.09 98°16′35″39°48′36″501.53SE23°10′35″
Notes: C: Compactness index; PD: Patch density index; X: The gravity longitude of urban land; Y: The gravity latitude of urban land; D: Urban land transfer distance; OP: Orientation proportion index; β: The urban land transfer directional intersection angle to due east; and Source: Drawn by the authors.
Table 4. Spatial variables and their weights in the MCE-CA model.
xnx1x2x3x4x5x6x7x8x9x10x11
wn0.1630.1260.0960.0830.1050.0880.0730.1120.0650.0510.038
Note: RI = 1.51, CR < 0.1; x1: Population density; x2: Distance from the city center; x3: Distance from the town center; x4: Distance from the airport; x5: Distance from the railway; x6: Distance from the highway; x7: Distance from the county road; x8: Slope; x9: Ecological protection zone; x10: Basic farmland protection zone; x11: Historical relics protection zone; and Source: Drawn by the authors.
Table 5. The characteristic indices of urban land use expansion in Jiayuguan City from 2015 to 2030.
YearArea/km2CPDXYD/mOPβ/Degree Minute Second
2015104.580.160.0998°16′35″39°48′36″
2020110.730.180.0798°16′42″39°48′33″359.66SE70°47′32″
2030152.630.230.0698°17′36″39°47′35″470.28SE35°44′26″
Notes: C: Compactness index; PD: Patch density index; X: The gravity longitude of urban land; Y: The gravity latitude of urban land; D: Urban land transfer distance; OP: Orientation proportion index; β: The urban land transfer directional intersection angle to due east; and Source: Drawn by the authors.

