Factors Contributing to Efficient Forest Production in the Region of the Three-North Shelter Forest Program, China

1
State Key Laboratory of Water Environment Simulation, School of Environment, Beijing Normal University, Beijing 100875, China
2
College of Public Administration, Nanjing Agricultural University, Nanjing 210095, China
3
Institute of Geographic Sciences and Natural Resources Research, Chinese Academy of Sciences, Beijing 100101, China
4
Center for Chinese Agricultural Policy, Chinese Academy of Sciences, Beijing 100101, China
5
School of Land Science and Technology, China University of Geosciences, Beijing 100083, China
*
Author to whom correspondence should be addressed.
Sustainability 2020, 12(1), 302; https://doi.org/10.3390/su12010302
Submission received: 26 November 2019
/
Revised: 17 December 2019
/
Accepted: 25 December 2019
/
Published: 30 December 2019
Abstract
:Forests are the most important renewable resources and provide critical ecosystem services worldwide, especially the provisioning service, making a great contribution to human well-being. The Three-North Shelter Forest Program (TNSFP) is a large-scale ecological project aimed at improving ecological environments and consolidating economic construction in China through the development of artificial forests. In our study, stochastic frontier analysis was adopted to estimate forest production efficiency (FPE) by using dynamic panel data. Based on the FPE of 13 provinces located within the TNSFP region during the period 2000–2016, the effects of the natural and socioeconomic influencing factors on FPE were further explored by using the Tobit regression model. The estimated results confirmed the validity of the constructed model and revealed an increasing trend of the mean annual FPE value, which ranged from 0.3147 in 2000 to 0.5681 in 2016. The FPE was declining from the eastern region to the western region in 2000. However, this spatial distribution characteristic changed enormously in 2016; regions with low FPE were in the center of the TNSFP region, surrounded by the regions with high FPE. Moreover, the following factors positively influenced FPE: average temperature (1.4476), total annual rainfall (0.0800), per capita GDP (0.0882), the education levels of forestry employees (0.2120), the number of forest technology stations in townships (0.0149), and disease and pest control areas (0.0190). However, the impacts of the policy relating to the Natural Forest Protection Program on FPE were insignificant. These influencing factors had differential effects on FPE within the TNSFP’s three sub-regions during the period 2000–2016. These findings can contribute to more efficient forest management and strengthen resource and environment management.

1. Introduction
Forests are the most important renewable resources and provide critical ecosystem services worldwide, especially the provisioning service, making a great contribution to human well-being [1,2,3]. Since 2015, China has transcended most of the countries in the world on the trade of the manufactured forest products. With the rapid economic development and urbanization, the demand for forest products has been continuing to increase, which gives considerable pressures on the whole forest supply system [4,5]. The fifth plenary session of the 18th Central Committee of the Communist Party of China put forward “five major development concepts”, referring to innovation, coordination, green, open, and sharing. In light of this new guidance, it has become imperative to improve the way and the efficiency of the forest production [6]. Furthermore, the 13th Five-Year Plan also advocated the development of the forest economics to optimize the forest production structure and improve the forest production efficiency (FPE). FPE is a critical indicator which is often used to measure the levels of forest production technology and management. Moreover, FPE is influenced by multiple factors. The existing studies have categorized them into natural factors, socioeconomic factors, and resource endowments [7,8]. Therefore, the exploration of the relationship between the production efficiency and its influencing factors can be conducive to maintain and improve the overall efficiency of forest production and management.
Production efficiency is usually used to present the performance of a production unit [9]. It is commonly calculated by using the ratio of the actual output to the maximum output conditional on a given input, or the ratio of the minimum input to the actual input conditional on a given output [10,11]. These two calculations are evidently based on input and output orientations, respectively. Either the nonparametric method or the parametric method is applied to measure the production efficiency for a decision-making unit [12]. Data envelopment analysis (DEA), as one of the nonparametric methods and the stochastic frontier approach (SFA), as one of the parametric methods, are representative and they are widely used for measuring efficiency to support forestry management and policy-making [13]. Reinhard et al. employed both of the methods to estimate the environmental efficiency to score the Dutch dairy farms and found that different methods in calculation would lead to different results [14]. Lee used SFA and DEA separately to measure the technological efficiency, then to score for 79 forest and paper companies [15]. There were slight differences between the results by using these two approaches. However, the rank of these companies’ efficiency remained the same. Kuosmanen et al. and Bai et al. also conducted empirical studies by applying the two methods, compared the theories and the deviation process, and summarized their corresponding advantages and disadvantages [16,17]. DEA was a popular tool used to analyze efficiency within many fields [18]. Li et al. used DEA to calculate the relative efficiency and energy-saving potential of 30 provinces in China during the period 1997–2014 [19]. Jia et al. evaluated the urbanization efficiency of Chengdu’s urbanization process using a three-stage DEA model [20]. In recent years, an increasing number of researchers have developed improved DEA models to measure efficiency. These included, for example, life cycle assessment (LCA) + DEA [21], dynamic network data DEA [22,23], and the slacks-based measure (SBM)-DEA approach [24]. The original conceptualization of the DEA approach entailed the technical frontier as a measure to distinguish the efficient units based on the input and output variables. Prior assumptions regarding the function form were not required when applying the DEA approach. Consequently, the results of the DEA cannot yield a specific function that describes the relationship between the input and output variables. Moreover, some errors may arise in the process of estimation when using this method, especially in relation to macroeconomic data, because random noises are discounted [17]. Contrasting with DEA, SFA is a parametric method accounting for random errors, and it enables the identification of inefficient factors and random errors [25]. It provides a numerical relation between inputs and outputs, which can also explain technical inefficiency [26]. Katuwal et al. used the SFA model to examine the production frontier and the efficiency of the measures on suppressing wildfires [27]. Xiong et al. applied the SFA model to estimate the technical efficiency of forest production in Northwest China during the period 2005–2015 [28]. Wang et al. employed SFA and the directional distance function to estimate the energy efficiency, technology gap, and carbon emission performance of enterprises in Guangdong Province in relation to their geographical boundaries as well their industrial categories [29]. SFA frameworks were also adopted to estimate the levels of energy conservation and pollution reduction of various industries along with their total factor energy production efficiency and environmental performance [30,31]. In sum, SFA has proven to be an effective approach for estimating the production efficiency of various industrial sectors.
Currently, China is facing increasing problems of environmental pollution and ecological damage [32]. Anthropogenic activities have created extensive footprints within natural ecosystems, including forests [33]. Their impacts are particularly evident in Northern China, where phenomena such as sandstorms, associated with extreme weather conditions; deforestation and desertification, which are manifestations of ecological degradation; and various types of environmental pollution, such as water and land pollution, have occurred frequently since the last century [34,35]. To deal with these problems, the Chinese government has introduced various strategies to protect and restore ecologies. Examples of such strategies implemented in Northern China, include The West Development Strategy and the Three-North Shelter Forest Program (TNSFP). These strategies have significantly influenced regional processes of ecological recovery and economic development. Various policies on forest protection as well as other projects implemented in this region have had some positive impacts in terms of alleviating poverty and enhancing local livelihoods. However, it is notable that the forest industry of the TNSFP region is the most developed within China. The total output of forest industry in this region accounted for more than 20% of the total national output in 2016 [36]. Therefore, a study on FPE and forest management would provide valuable information for protecting ecosystems and improving socioeconomic conditions in the TNSFP region.
The construction of a comprehensive parameter model using SFA method enables avoidance of the disadvantages entailed in the use of DEA method. Few researchers have studied the production efficiency of forests, especially within locations such as the TNSFP region, which are the sites of typical forest projects. Therefore, a study that applies SFA to estimate the production efficiency and identify the influencing factors in the TNSFP region, is necessary and salient in the face of the double challenge of improving production efficiency and optimizing forest management.
Our study focused on the application of FPE and its influencing factors, supporting efficient forest management. We had the following objectives. The first was to build an SFA-based model for estimating the efficiency of forest production. The second was to carry out empirical research to estimate the FPE values for the 13 provinces covered by the TNSFP for the period 2000–2016 and to analyze spatiotemporal variations in these values. The final objective was to develop an influencing index system for FPE and to analyze the effects of influencing factors in the TNSFP region, thereby providing scientific findings to support efficient forest management and related policy formulation.
This paper is organized as follows. The following section describes the study area and materials. The third section presents the methodology adopted in the study. The results and analysis, which reveal spatiotemporal variations in FPE and the characteristics of the influencing factors in the TNSFP region, are presented in the fourth section. The fifth and final section presents a discussion of the results and conclusion as well as policy recommendations for forest management and development.
2. Study Area and Materials
2.1. Study Area
The study area covered by the TNSFP, which is a large-scale ecological engineering program for producing artificial forests, encompasses 13 provinces in Northern China, with latitudes and longitudes ranging from 73°26′ to 127°50′ E and 33°30′ to 50°12′ N (Figure 1). The TNSFP region can be divided into three sub-regions: a northwestern region comprising Shaanxi, Gansu, Qinghai, Ningxia, and Xinjiang; a north-central region comprising Beijing, Tianjin, Hebei, Shanxi, and Inner Mongolia; a northeastern region comprising Heilongjiang, Jilin, and Liaoning. The total area of the TNSFP region is 4.069 million km2, accounting for 42.4% of China’s total land area. The TNSFP was implemented in 1979 as an important national economic construction project, aiming at combating severe environmental degradation in Northern China [37]. The program has been associated with a number of significant achievements. More than 100 million mu (1 mu = 0.667 × 10³ km2) of wind-resistant and sand-fixing forests have been developed in hazard-prone areas, extending from Xinjiang to Heilongjiang, which have resulted in effective control of 20% of desertification in China. The annual expansion rate of land desertification dropped from 2100 km2 in the 1980s to 1700 km2 in the 2010s. Moreover, the historical trends of desertification in Liaoning, Jilin, Heilongjiang, Beijing, Tianjin, Shanxi, and Ningxia have been halted.
The expansion of the forest land has contributed to the development of forest industry in the TNSFP region. The second phase of the program (2000–2019) commenced in 2000. As Figure 1 shows, forest land is mainly distributed in the eastern section of the program area (southeastern Inner Mongolia, Heilongjiang, Jilin, and Liaoning) and the south-central section (Shanxi and Shaanxi), constrained by harsh natural conditions. The land surface is dominated by deserts that cover approximately 85% of the TNSFP region, and the arid and semiarid land cover more than 1.6 million km2 [38]. From 2000 to 2016, the forest industry in this region developed at a rapid rate, with its outputs increasing from 3.98 × 10¹⁰ yuan (Chinese currency unit, 1 USD was equal in value to 6.74 yuan in 2016) to 32.4 × 10¹⁰ yuan. Figure 1 shows the provinces within the region covered by the program. Moreover, significant spatiotemporal changes of socioeconomic development correspond to the spatiotemporal changes of the harsh natural conditions within the region (Figure A1 and Figure A2 in Appendix A). Accordingly, an exploration of pathways to improve the production efficiency and related influencing factors would constitute significant contributions to forest management in the TNSFP region.
2.2. Data Preparation
Our study estimates FPE, analyzes its influence factors by dynamic panel data and provides scientific information for the forest management and environment protection in the region of TNSFP. The dynamic panel dataset here mainly includes remote sensing data, climate data, social and economic statistic data, forest monitoring data, and other kinds of data. It statistically shows the ecological and economic changes of TNSFP region.
For the efficiency estimation, the input variables (labor, capital, and land) and the output variable (forest output) were used to estimate FPE for the 13 provinces in TNSFP region. Labor here referred to the number of forestry employees; capital was the investments in fixed assets for forest production; land referred to the forest area. The output variable was the gross forest production output. Furthermore, the other dataset needed to analyze how the natural factors and socioeconomic factors influence FPE. As both the Natural Forest Protection Program and the second stage of the TNSFP commenced in 2000, we chose the year 2000 as the starting year. Thus, the research period covered 17 years from 2000 to 2016. Moreover, the statistical data after 2000 was more accurate, and it could yield more scientific and useful results for policy formulating. The 221 samples can meet the requirements of the SFA model and the Tobit model. Data on forests were derived from the China Forestry Statistical Yearbook (2001–2017), the natural and socioeconomic data of each province were derived from the China Statistic Yearbook (2001–2017) and the statistical yearbooks of each province (2001–2017). We used the comparable price index to adjust the economic data, setting 1990 as the base year. Table 1 shows the statistic description of all variables.
3. Methods
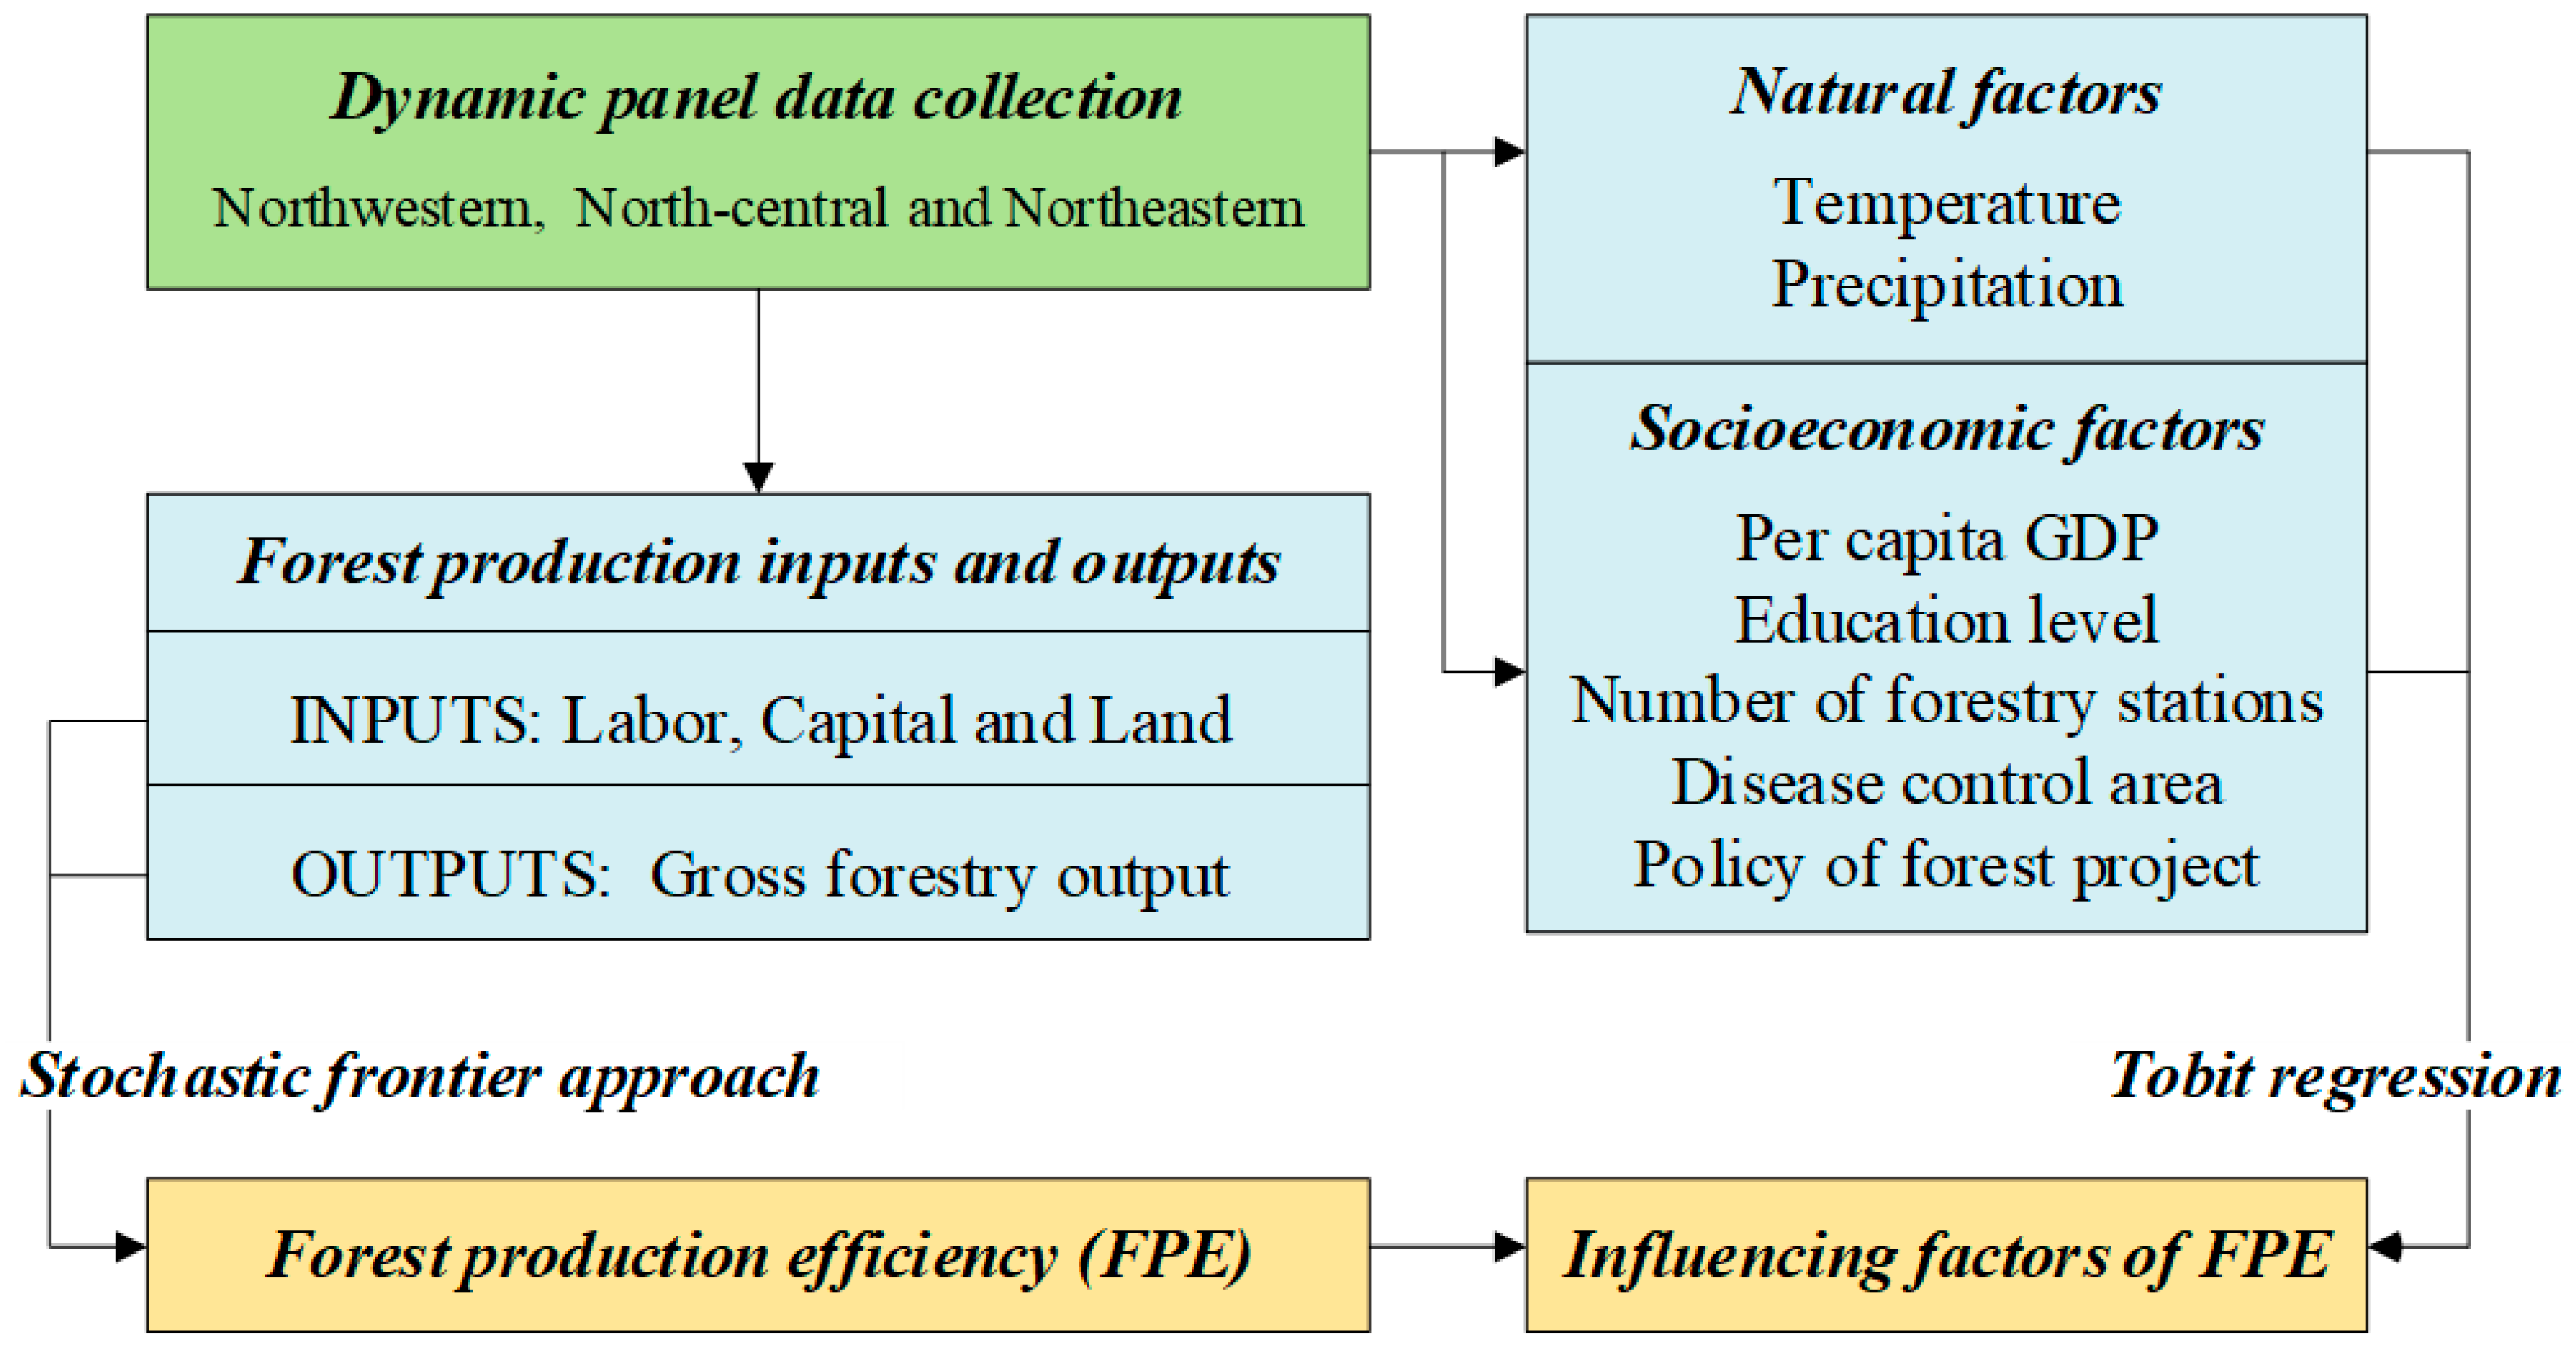
Based on the panel data, we constructed an analytical framework to estimate FPE and identify the factors that influence FPE, as shown in Figure 2. We used SFA to measure FPE based on input and output panel data and subsequently employed Tobit regression models to identify its influencing factors.
3.1. Parameter Estimation of FPE
The estimated model is deduced based on the framework of SFA model. The Debreu–Farrell efficiency framework proposed by Debreu and Farrell is a basic framework for analyzing production efficiency [39,40]. Its underlying premise is that technical efficiency is determined by the directions of inputs and outputs. For the forestry industrial production system, we constructed the production function between the input and output variables. The input vector was defined as and the desirable output was defined as . The function is expressed in the following equation:
where , , and denote labor, capital, and land inputs, respectively. denotes the forest production output. FPE is measured by applying SFA model in combination with the translog production function within the basic methodological framework [41]. The function for the parameter estimation is derived from the following equation:
where is the parameter vector of the observation variables; denotes the random noise variable, reflects normal distribution. (non-negative random error term) denotes a truncated version of normal distribution and it is independent of .
Accordingly, the efficiency was defined as the ratio of the observed (actual) output to the maximum potential output determined by the production frontier. Therefore, the production efficiency, denoted as TE, was defined as follows:
3.2. Influencing Factor Analysis of FPE
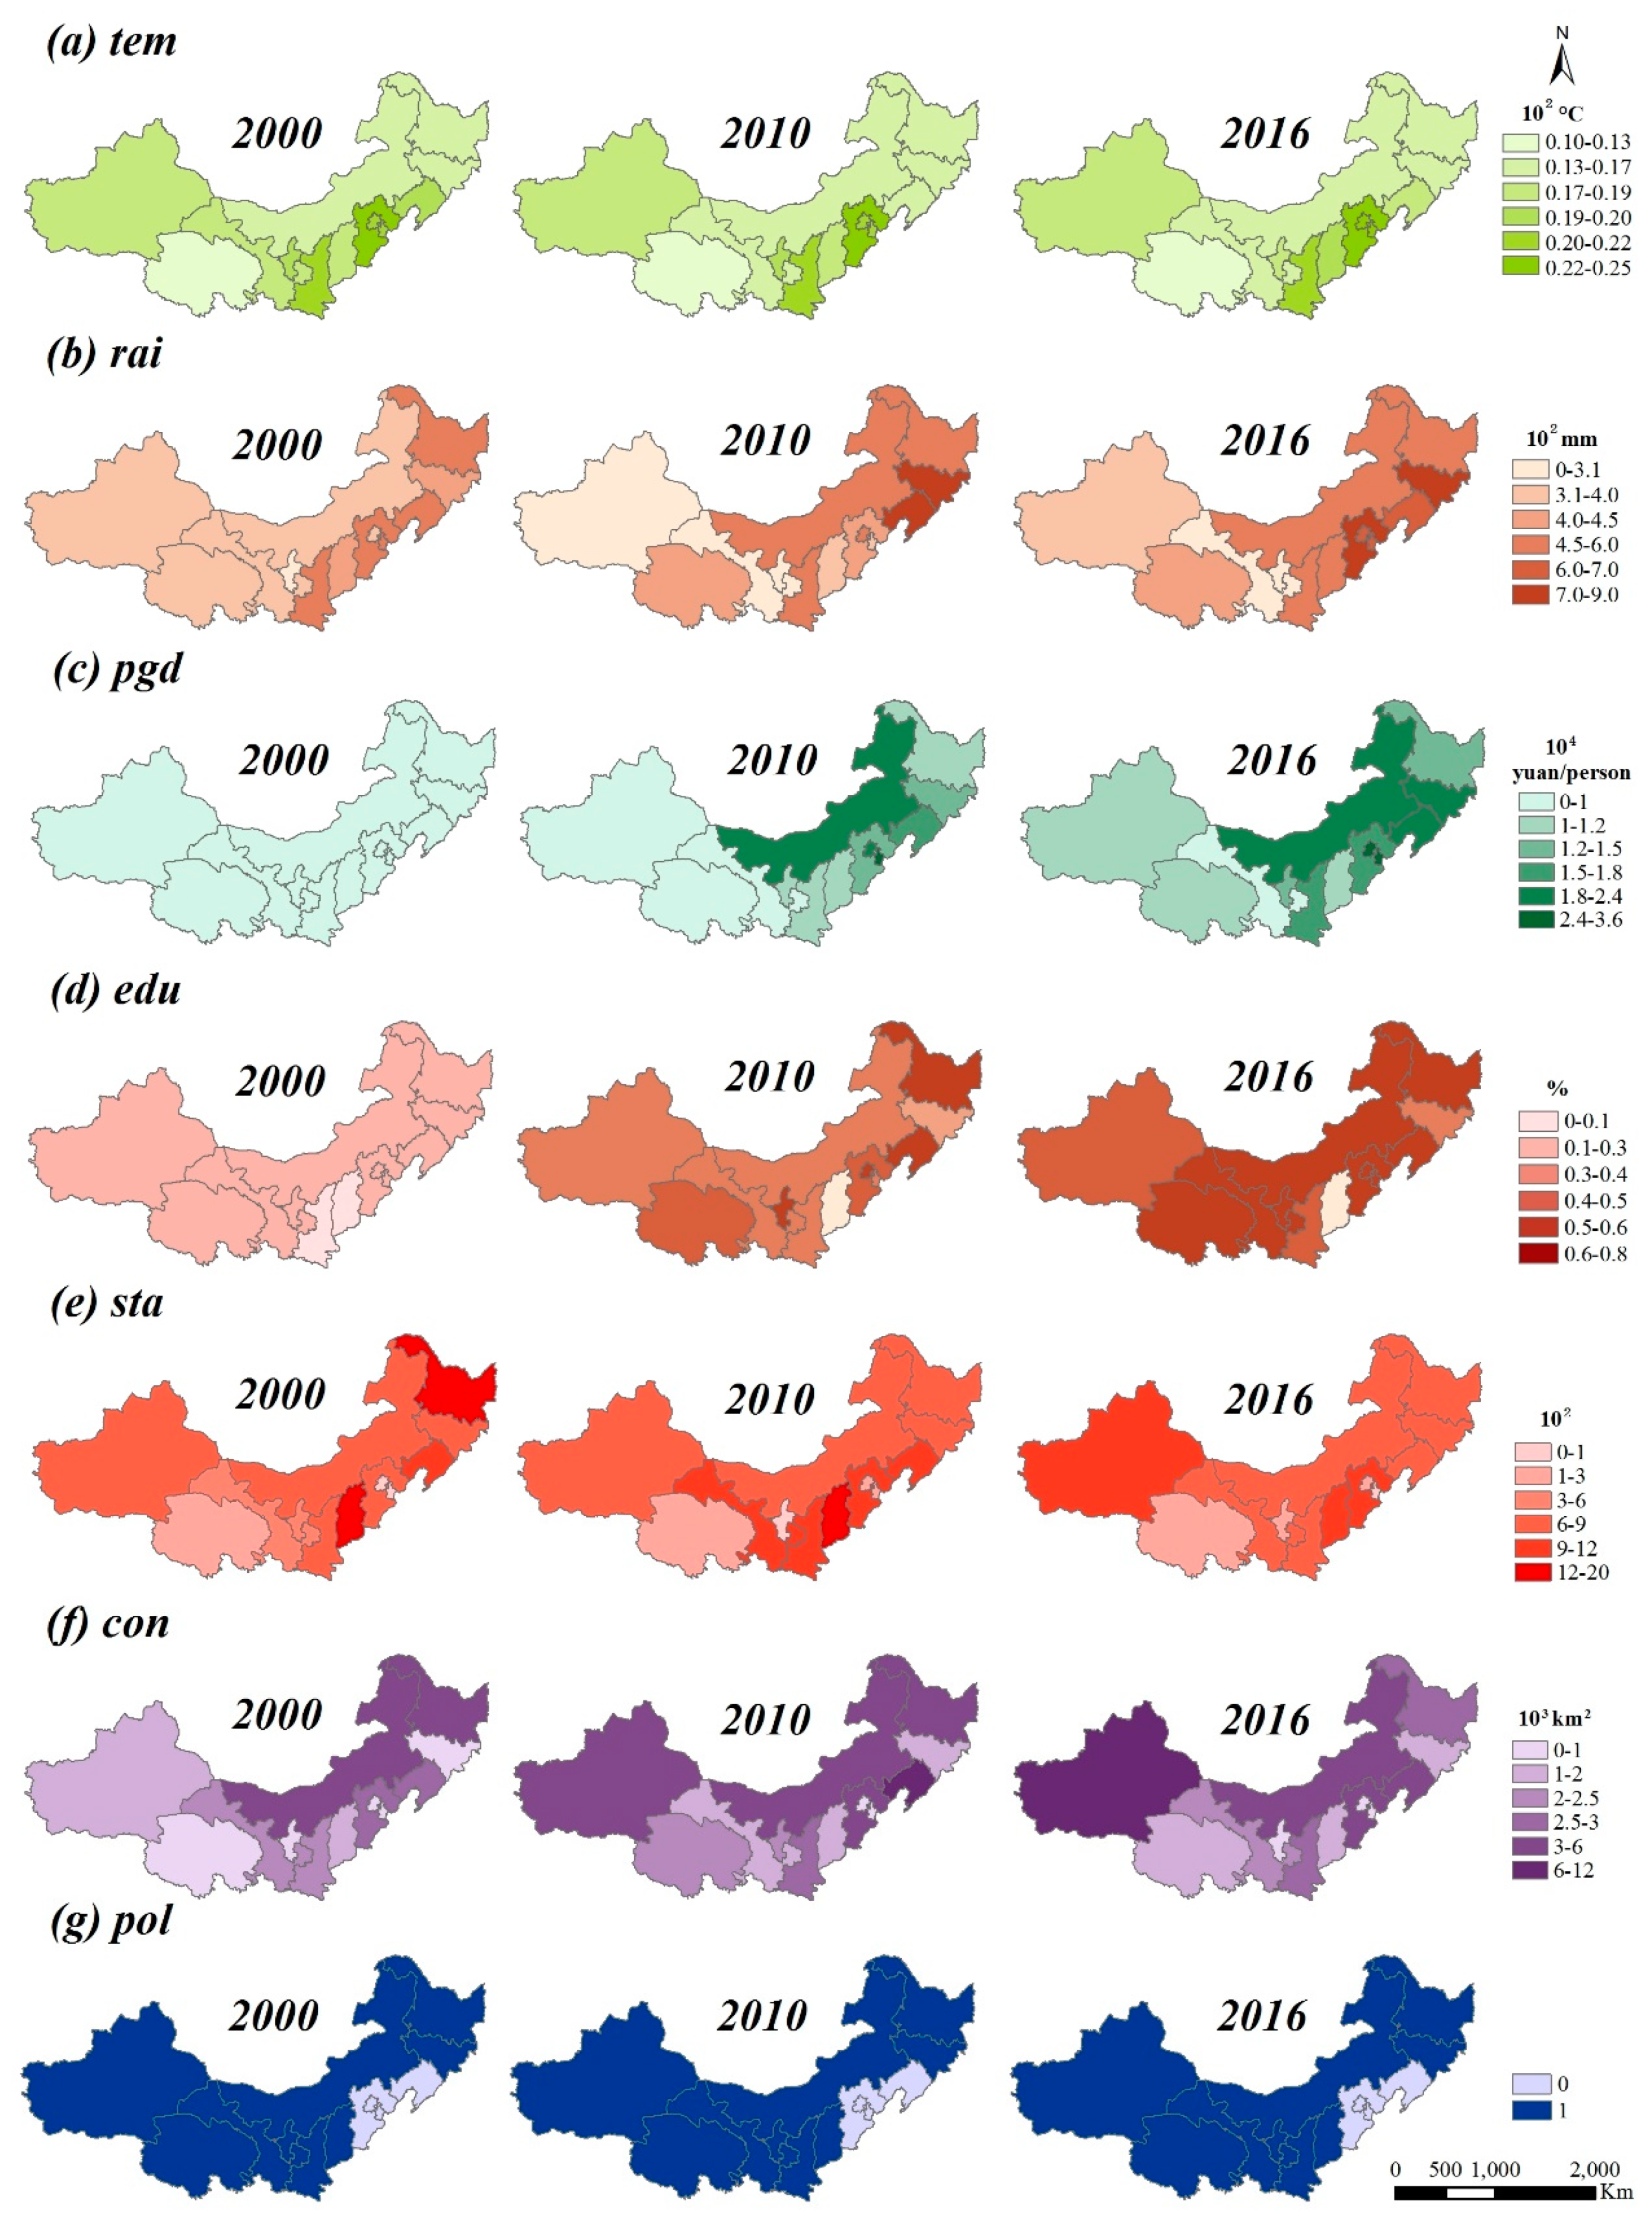
The gap in provincial forest outputs within the TNSFP region has expanded in relation to the changes of natural environmental, socioeconomic, and human factors. As shown in Table 1, we constructed a comprehensive index of influencing factors extracted from our review of the literature [42,43]. This index included two natural environmental factors, namely the average temperature for the period April–October (tem) and the total annual rainfall (rai). It also included the following five socioeconomic factors: per capita GDP (pgd), education levels of forestry employees (edu), the number of forestry technology stations in townships (sta), disease and pest control areas (con), and the policy relating to the Natural Forest Protection Program (pol).
The Tobit model is an effective regression model that has been widely applied, both empirically and theoretically, within the field of micro-econometrics [42,44]. Compared with the ordinary least-squares regression model, the Tobit model has several advantages relating to the treatment of continual and discrete variables [45]. The FPE value (), calculated during the first stage of the analytical procedure, ranged between 0 and 1. It was validated by influencing factors (). Seven influencing factors (tem, rai, pgd, edu, sta, con, and pol) were considered in this study. The parameters for the Tobit regression model were estimated as follows:
where is the FPE of province i in the year t, is a vector (m × 1) of influencing factors, and is a vector (m × 1) of parameters to be estimated (m = 7).
4. Results and Analysis
4.1. The Estimation Function for Forest Production Efficiency
We estimated the trans-log form using the stochastic frontier production function (Equation (2)). As shown in Table 2, most of the estimated parameters were found to be valid after testing (significant at the 5% level). The coefficients of capital (βk = 1.6790) and forest land (βt = 3.6556) were significantly positive at the 1% and 5% levels, respectively, implying that larger quantities of capital and forest land corresponded to higher productive outputs from forest industry. Specifically, each respective increase in capital and forest land by 1% corresponded to increases in the total output of the forest industry by 167.9% and 365.56%, respectively. However, the estimated coefficient of labor input (βl = −1.4921) was negative but not significantly so at 10%. Figure 3 depicts the changes of labor and outputs in the 13 provinces from 2000 to 2016. The relationships between labor and outputs were evidently negative in Shaanxi, Inner Mongolia, Liaoning, Heilongjiang, and Shaanxi. While, positive relationships between them were not evident in other provinces. Moreover, not only the quantity of the labor contribution but also the quality of labor should be considered. Thus, it was reasonable of the non-significant parameter of the labor in the SFA results. The SFA model and its results were found to be valid after performing mathematical testing and an empirical check.
4.2. Spatial and Temporal Variations of Forest Production Efficiency
The distribution of the efficiency should conform the underlying hypothesis of the SFA model. Figure 4 shows the distribution of the 221 FPE values of the 13 provinces from 2000 to 2016 was skewed to the left. Almost half of the 221 FPE values ranged between 0.4091 and 0.5924. The FPE values were more than 0.5924 in 24.89% and less than 0.4091 in 21.26% of the 221 observations.
Our estimation indicated that the average FPE values for the 13 provinces were 0.3147 in 2000 and 0.5681 in 2016, thereby showing an increase by 80.52%. The finding indicates that the FPE status has remained relatively inefficient. From 2000 to 2016, fluctuations in the FPE values increased, as shown in Figure 5. Two distinct phases relating to changes in spatial characteristics were identified: 2000–2010 and 2010–2016. There was an evident increase in the FPE value of the entire TNSFP region during the first phase (2000–2010). The FPE values of 12 provinces (excluding Tianjin) also increased to some extent. The increase in the FPE value of Xinjiang from 0.2070 to 0.7104 was most apparent, while that of Tianjin evidenced a weak decreased from 0.6225 to 0.6009. The FPE values of the northwestern and northeastern sub-regions evidenced relatively steady increases in FPE during the second phase (2010–2016) compared with their values during the first phase, but temporal changes in FPE values during the latter period were weakly inverted in the north-central region. In particular, the PFE values obtained for Inner Mongolia and Qinghai showed evident decreases. On the whole, the FPE values and their changes within the different provinces in the northwestern region varied during this whole phase. The FPE values in the north-central region varied during the first phase of the study but remained relative consistent during the second phase. However, the FPE values in the northeastern region remained consistent throughout the whole period.
The spatial changes from 2000 to 2016 in FPE values are depicted in Figure 6. The spatial characteristics in 2000, 2010, and 2016 were explored through trend surface analysis. The spatial characteristics changed evidently during the period 2000–2016. In 2000, the overall trend was one of a decrease in FPE moving from east to west. The northeastern region evidenced relatively high FPE values (0.5544 in Jilin, 0.3893 in Heilongjiang, and 0.32193 in Liaoning) while the FPE values in the north-central region ranged between 0.0999 (the value for Inner Mongolia, which was the lowest) to 0.6225 (the highest value calculated for Tianjin). FPE values were relatively consistent in the northwestern region but were generally the lowest of the values obtained for the three sub-regions, ranging from 0.1378 (Gansu) to 0.2562 (Shaanxi). Over time, the geographical spatial distribution characteristics of FPE changed, mainly in the northwestern region. In 2016, the FPE value in the central section of the TNSFP region was lower than the values in the western section (the highest FPE value was obtained for Xinjiang at 0.7451) and in the eastern section (the lowest FPE value of 0.2035 was obtained for Qinghai). Moreover, from 2000 to 2016, the mean center of the FPE values is concentrated in the east-central of the TNSFP region, at the border of Hebei and Inner Mongolia. The mean center varies slightly from east to west during the research period. As for the changes of FPE values in each province, there are evident differences among the 13 provinces. The FPE values in Beijing and Tianjin decreased by 0.0007 and 0.0215 from 2000 to 2016, respectively. Except Beijing and Tianjin, the FPE values in other provinces increased at different degrees. The FPE change in Xinjiang was 0.5381 (highest among the TNSFP region) and that in Qinghai was 0.0657 (lowest among the TNSFP region).
4.3. Influencing Factors of Forest Production Efficiency
After conducting unit root and co-integration tests on the variable data (Table 3), the effects of seven influencing factors on the FPE were examined. The results of the unit root test of the variables were significant at 1%, except the forest land area at 5%. Considering the three basic input variables of labor, capital, and land (K, L, and T, respectively), we built three Tobit regression models: Tobit1 (natural factors), Tobit2 (socioeconomic factors), and Tobit3 (comprehensive factors), as shown in Table 4.
Among the three basic input variables, labor had a positive effect on the FPE, whereas capital and forest land had negative effects on the FPE. Based on Tobit1 model, both of the natural influencing factors, namely the average temperature during the period April–October and the total annual rainfall, had significant positive effects on FPE. Through the Tobit2 model, four of the socioeconomic factors (per capita GDP, education level, the number of forest technology stations, and the disease and pest control area) had positive effects on FPE and were significant at 1%. The effects of the policy relating to the Natural Forest Protection Program were weak and not significant. Considering all the seven factors, Tobit3 model results confirmed that one natural factor (temperature) and four socioeconomic factors (per capita GDP, education level, the number of forest technology stations, and the disease and pest control area) had positive effects on FPE and were significant at 1%. Our analysis revealed that most factors, apart from the policy on Natural Forest Protection Program and total annual rainfall, had significant influences on the FPE at 1%, while capital had a significant influence at 5%.
4.4. Analyzing the Influencing Factors of Forest Production Efficiency in the Three Sub-Regions
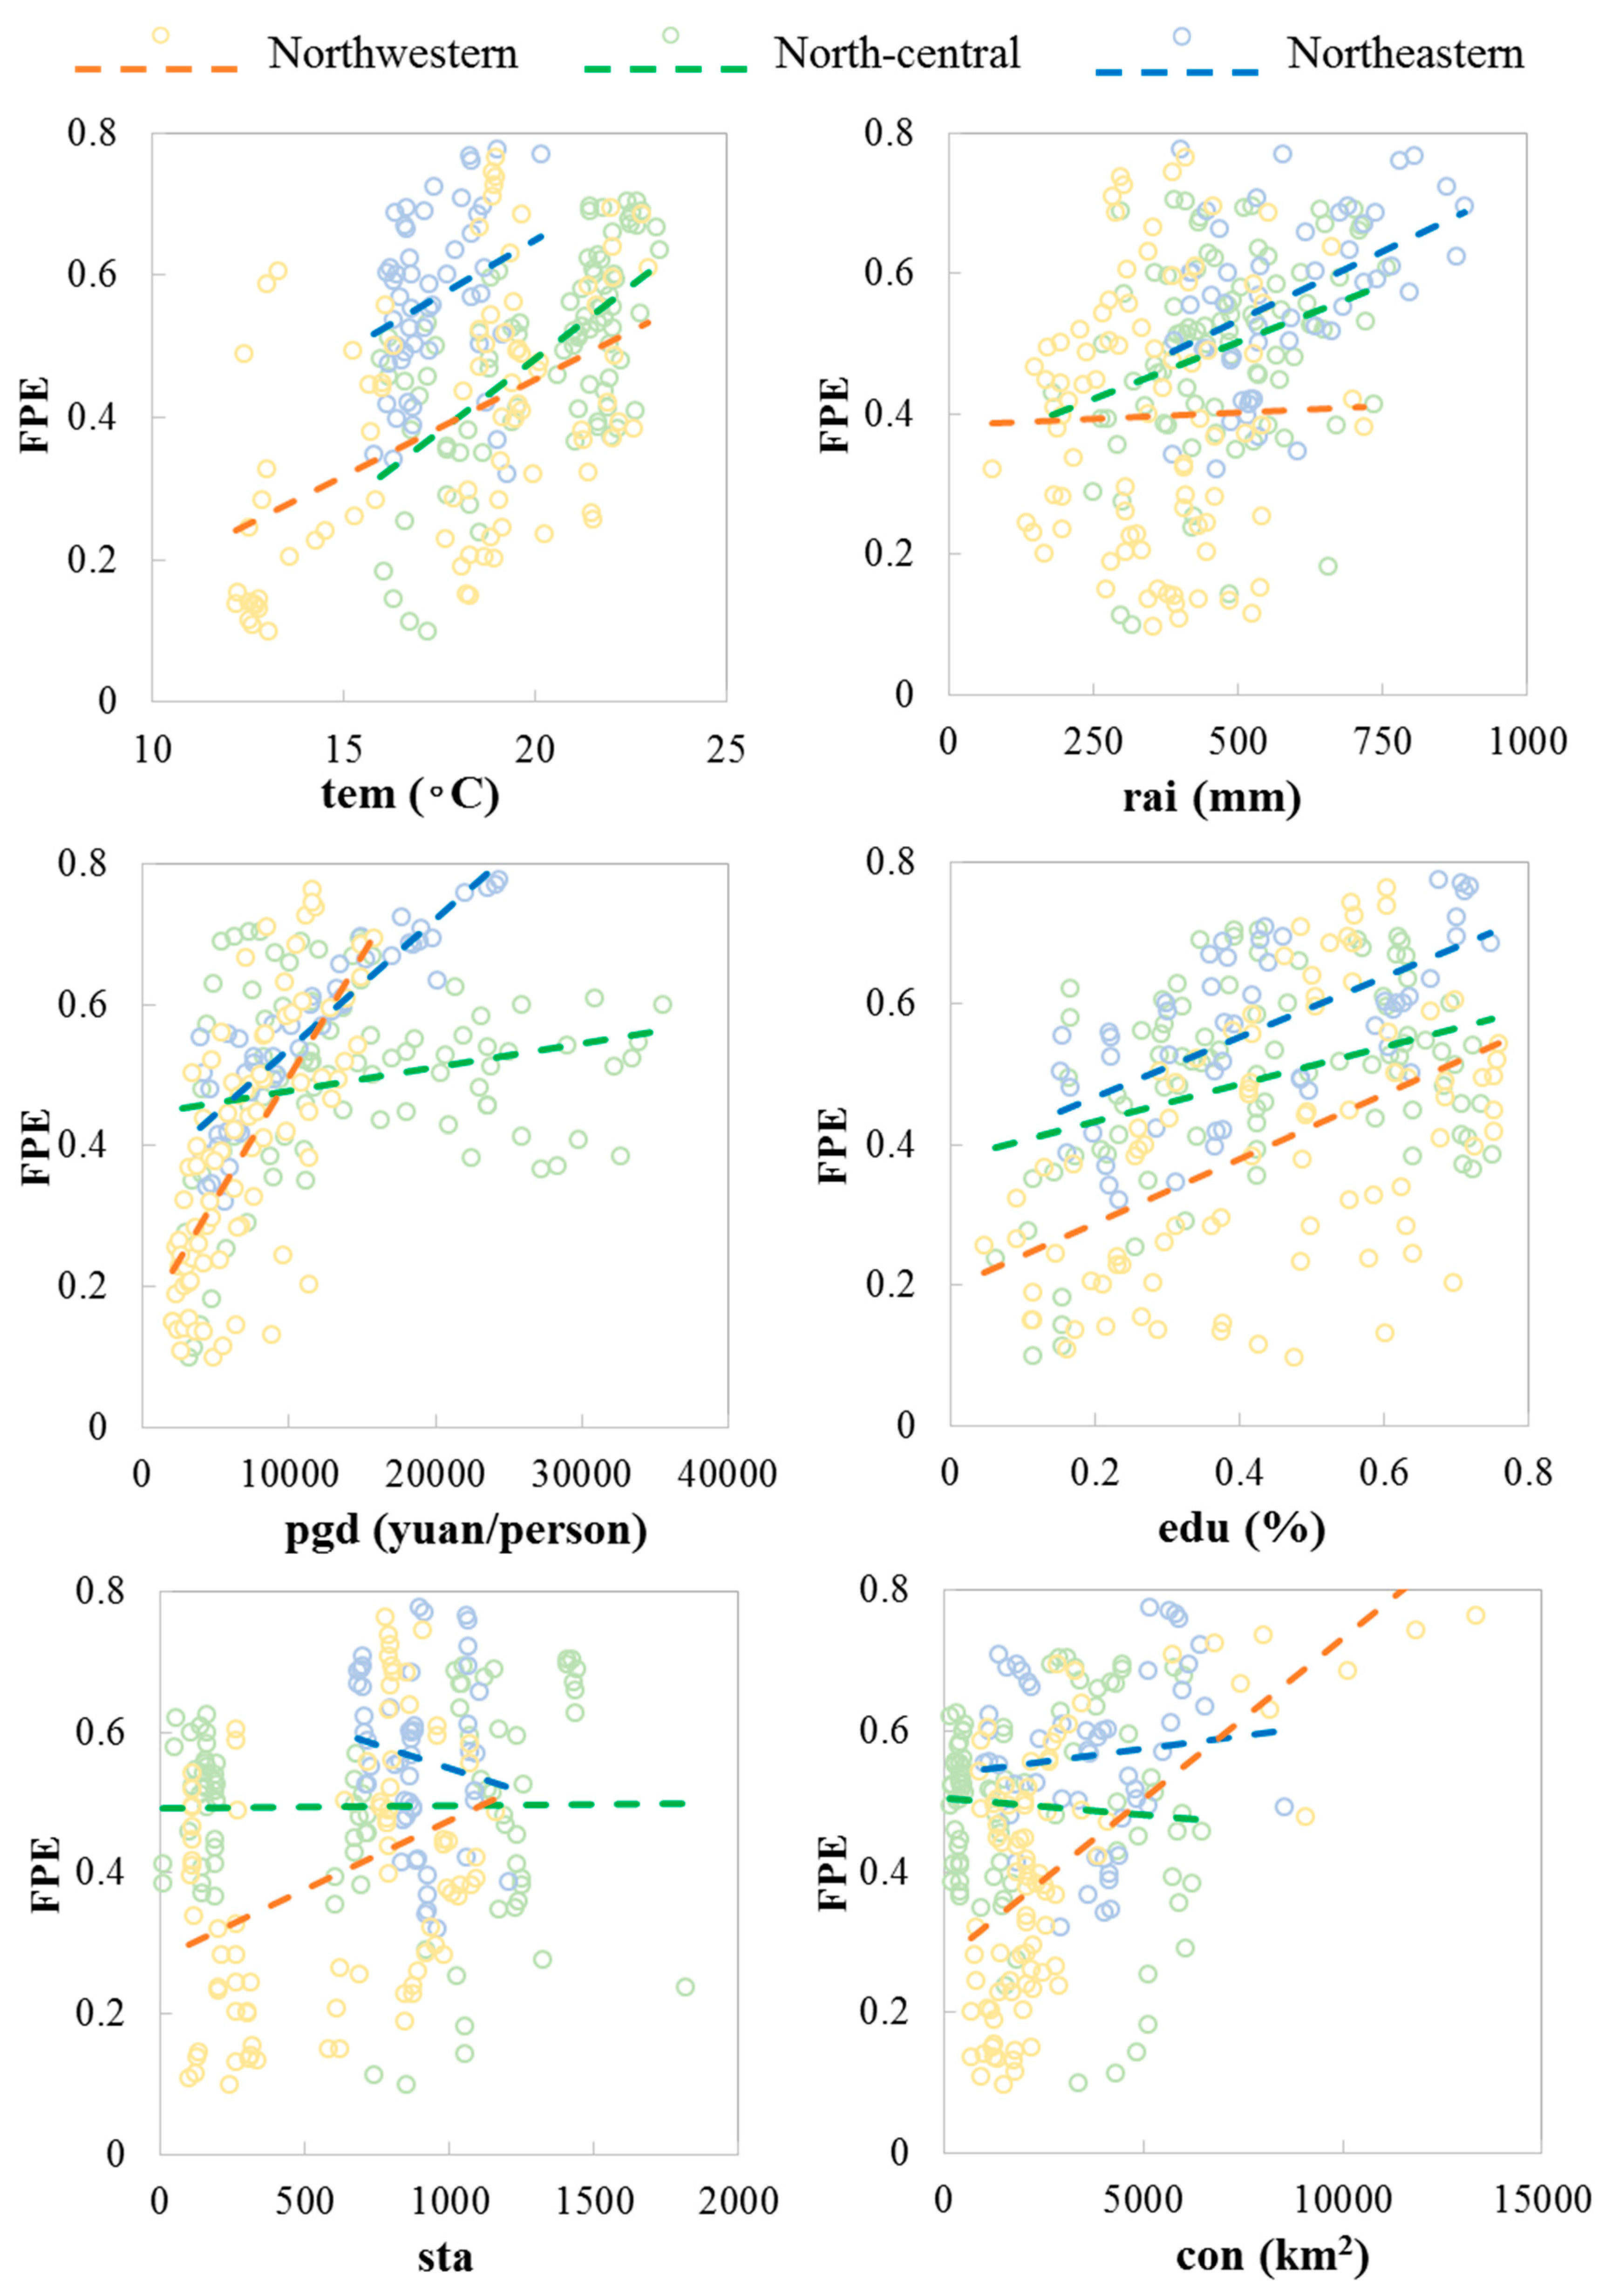
The Tobit regression models confirmed the relationships existing between the influencing factors and FPE, but the variations in these relationships among the three sub-regions had not been revealed, respectively. The scatter plots shown in Figure 7 depicted the trend lines between the FPE values and each influencing factor. The contributions of the average temperature from April to October (tem) on FPE were similar and the intensities (slope of the trend line) were similar across the three sub-regions. The temperature factor made significant positive effects on FPE in the three sub-regions. The effects of the total annual rainfall (rai) on FPE were evidently positive in the north-central and northeastern sub-regions but were weak in the northwestern sub-region. Per capita GDP (pgd) had positive effects on FPE in all the three sub-regions, with the strongest effect in the northwestern sub-region, followed by the northeastern and north-central sub-regions. The effects of the education level of forestry employees (edu) were positive in all three sub-regions, with the north-central sub-region evidencing the weakest effect. The number of forestry technology stations in townships (sta) had a negative effect on the FPE in the northeastern sub-region, a positive effect in the northwestern sub-region, and an insignificant effect in the north-central sub-region. The effect of disease and pest control areas (con) was more strongly positive in the northwestern sub-region than in the northeastern sub-region, and its effect was clearly negative in the north-central sub-region.
In each of the three sub-regions, the impact characteristics of the influencing factors were largely consistent, with positive effects being predominant. Because of differences of natural environmental and socioeconomic conditions, these effects showed some variations across the sub-regions. Policy makers should consider the natural environmental and socioeconomic factors in forest management and industry development.
5. Conclusions and Discussion
With development of panel data, dynamic efficiency estimation and factor analysis gradually promote the efficient environmental management and provide scientific evidence for decision-making. This study focuses on the model for production efficiency evaluation, aiming at providing the basis for supporting scientific evidences for forest resource and environment management. In this paper, we collected the natural and socioeconomic dynamic panel data on forestry industry in the TNSFP region. We applied the SFA method to estimate the FPE values for 13 provinces within the TNSFP region for the period 2000–2016. We subsequently used the Tobit regression models to explore the effects of natural environmental and socioeconomic influencing factors on FPE. We further analyzed differences in the impacts of the influencing factors among the three sub-regions. Our findings indicated an increase in the annual mean value of FPE from 0.3147 in 2000 to 0.5681 in 2016. In general, the FPE values obtained for the northeastern sub-region were relative higher than the values obtained for the other sub-regions, with similar FPE values obtained for three provinces in northeastern sub-region (Jilin, Liaoning, and Heilongjiang) during the period 2000–2016. The FPE value for Xinjiang in the northwestern sub-region evidenced a rapid increase, reaching the highest level among the 13 provinces in 2016. Moreover, the north-central sub-region evidenced relative FPE values. The overall trend for changes in the spatial characteristics of FPE revealed a shift from “high in the west and low in the east” in 2000 to “high along the two sides and low in the center” in 2016. Among the influencing factors, the effects of temperature, rain, disease area, per capita GDP, forestry employees’ education levels, and the number of forest technology stations on FPE were all significantly positive, whereas those of the policy directive relating to the Natural Forest Protection Program on FPE were insignificant. All of the findings would contribute to the effective forest management and regional sustainable development.
The increase in FPE in the TNSFP region is correlated with rapid socioeconomic development. Lots of natural environmental and socioeconomic factors make various effects on forest production level. Apart from the impacts of natural environmental factors, the main hurdles to developing forest industry pertain to the government’s investments and management of the industry. Consequently, there is a need for the government to increase the investments for forestry-related infrastructure to improve the production conditions; attract more skilled and better-educated employees through the introduction of preferential talent policies; and organize training activities to enhance employees’ working skills. Moreover, the policy relating to the Natural Forest Protection Program has no significant impacts in terms of increasing the technological efficiency of forest production. As most of Northern China comprises arid or semiarid areas, the issues of water saving and temperature require special consideration in the process of managing forest production. The adoption of appropriate and comprehensive modes in forest management would not only increase outputs, but also help to promote the balance between forest production and the protection of ecological environments. The government should take into account the production efficiency and related influencing factors comprehensively for regional efficient forest management.
Author Contributions
C.W. and J.Z. had the original idea and designed this research. X.C. was responsible for data collecting and preparation. C.W. analyzed the data and wrote this paper. F.Z., P.W. and Z.X. supervised the research and proofread the manuscript. All authors have read and agreed to the published version of the manuscript.
Funding
This research was funded by the General Program of National Natural Science Foundation of China (grant no. 41771546) and the major research plan of the National Natural Science Foundation of China (grant no. 91325302).
Conflicts of Interest
The authors declare no conflicts of interest.
Appendix A
Figure A1.
Changes of the basic variables in in the region of Three-North Shelter Forest Program.
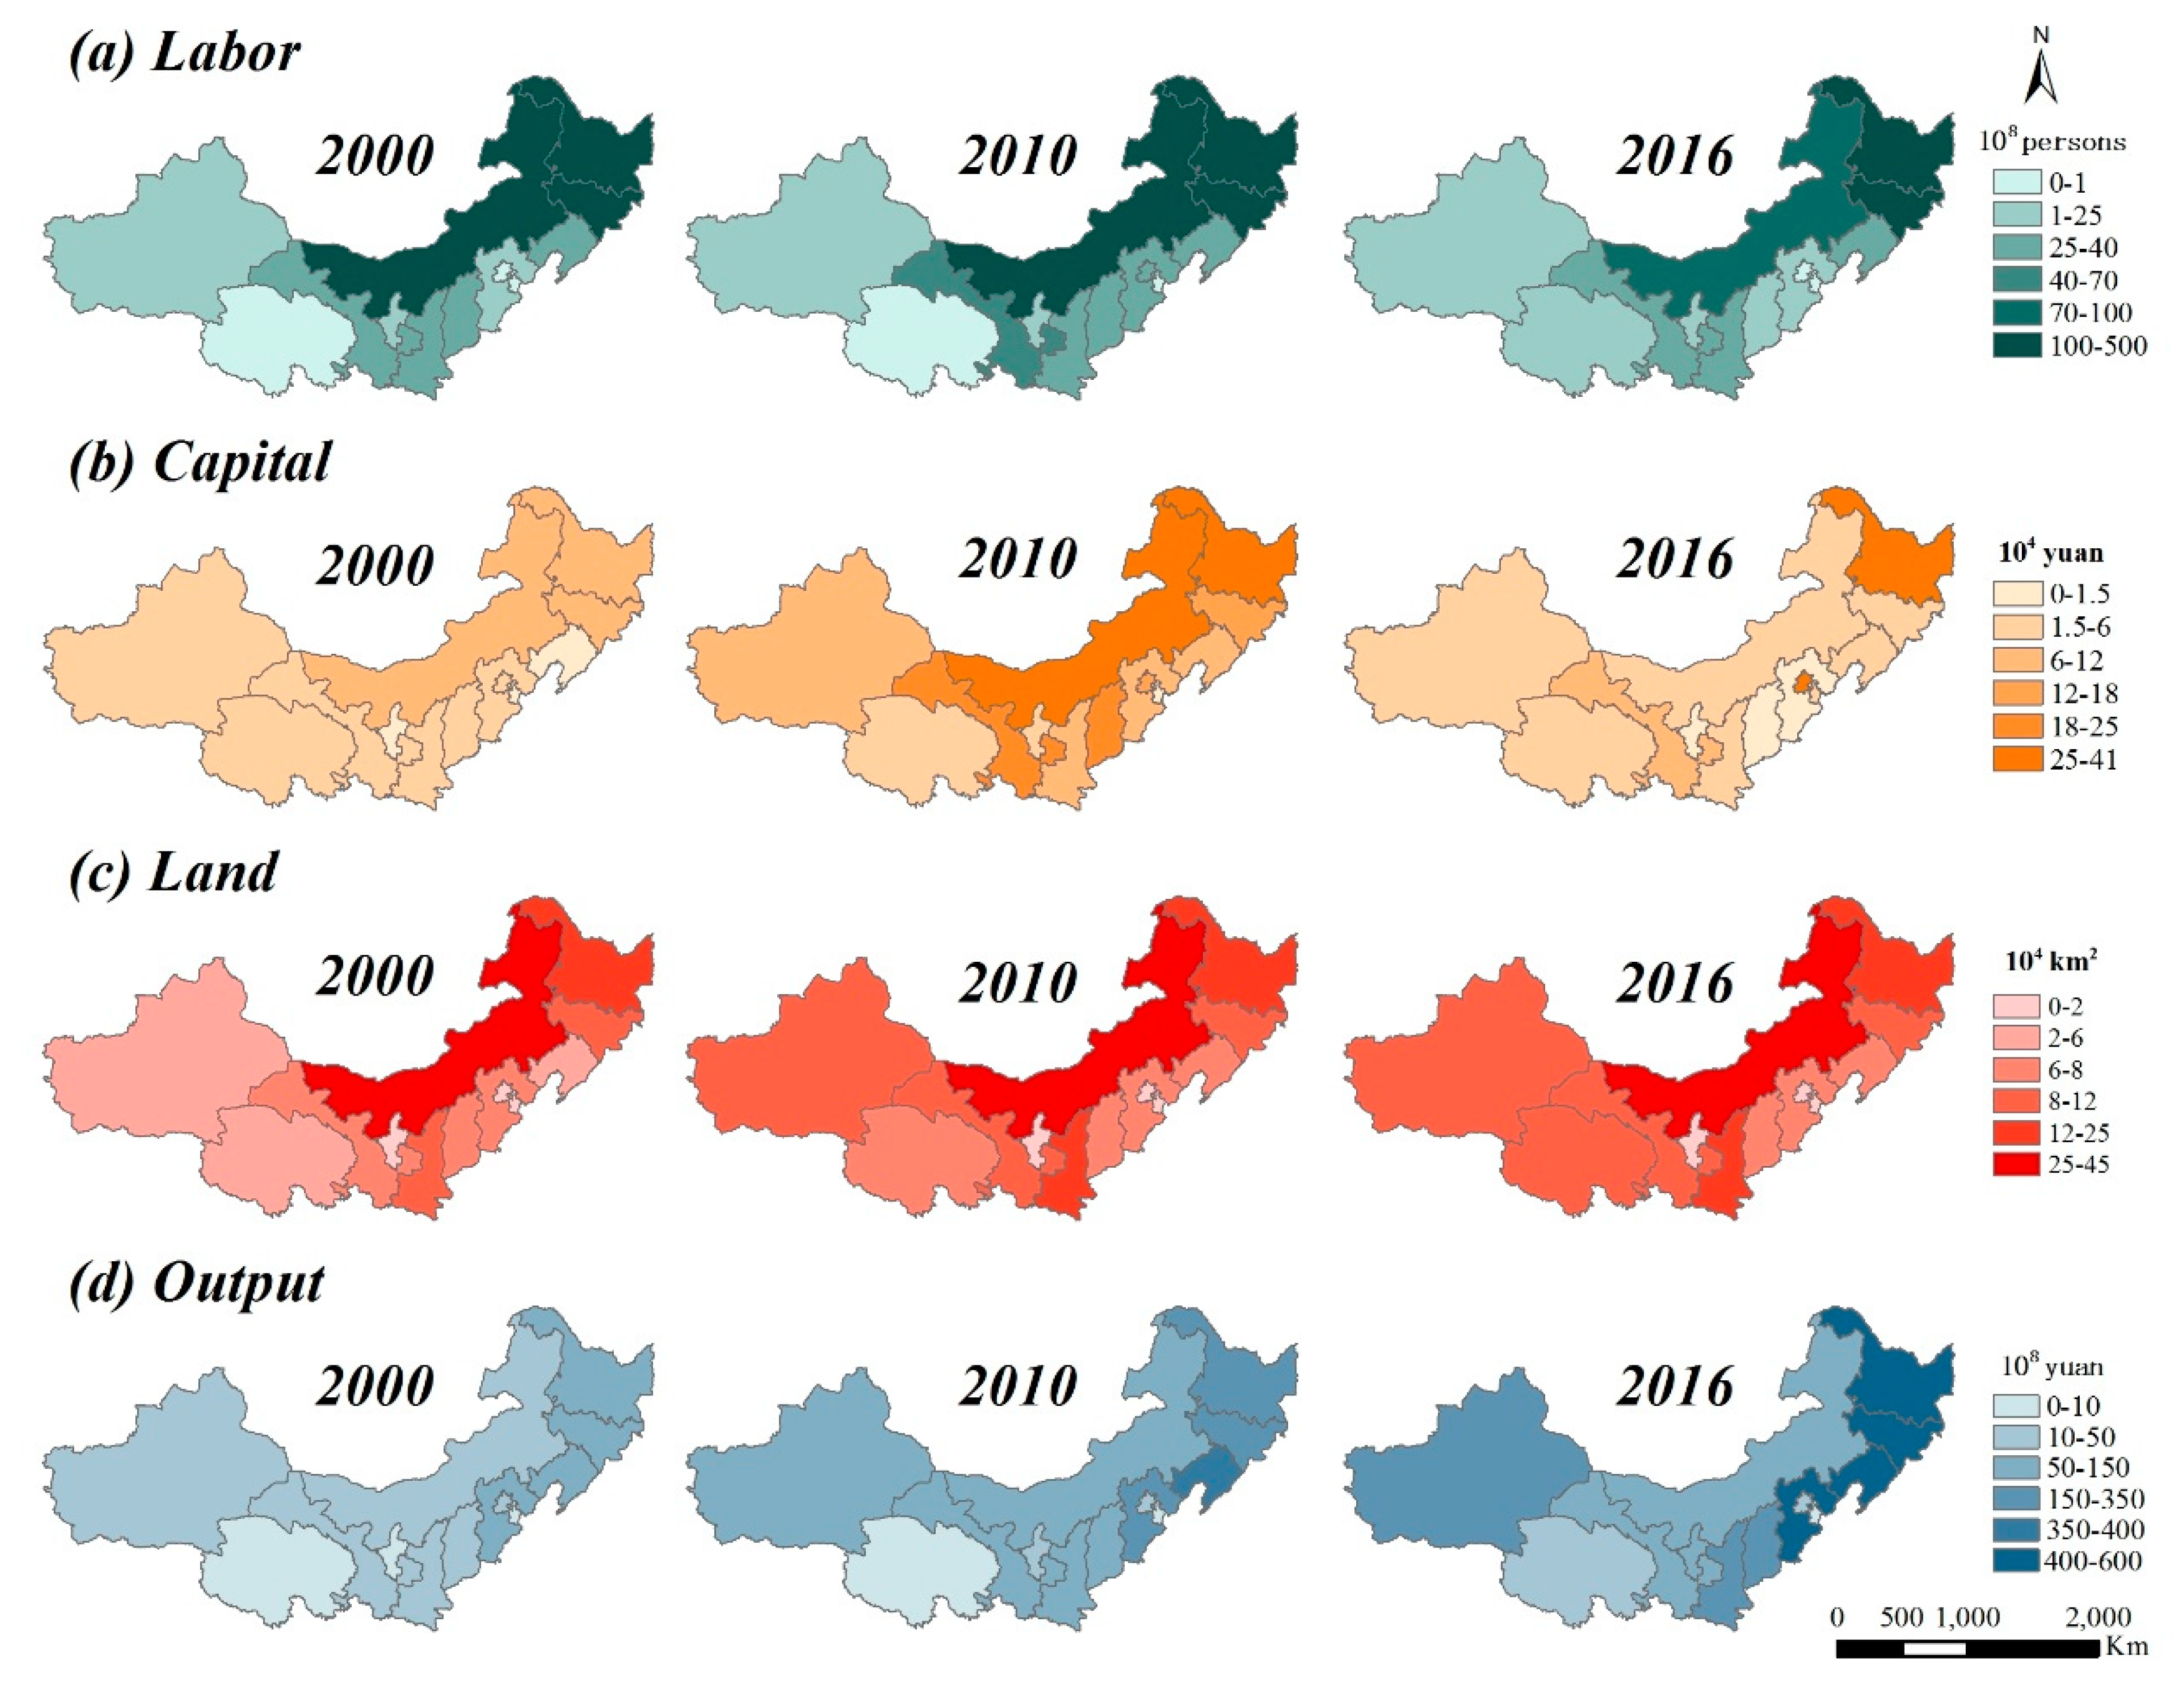
Figure A2.
Changes of the influencing factors in the region of Three-North Shelter Forest Program.
References
- Ali, A. Forest stand structure and functioning: Current knowledge and future challenges. Ecol. Indic. 2019, 98, 665–677. [Google Scholar] [CrossRef]
- Jåstad, E.O.; Bolkesjø, T.F.; Trømborg, E.; Rørstad, P.K. Large-scale forest-based biofuel production in the Nordic forest sector: Effects on the economics of forestry and forest industries. Energy Convers. Manag. 2019, 184, 374–388. [Google Scholar] [CrossRef]
- Hua, F.; Wang, X.; Zheng, X.; Fisher, B.; Wang, L.; Zhu, J.; Tang, Y.; Yu, D.W.; Wilcove, D.S. Opportunities for biodiversity gains under the world’s largest reforestation programme. Nat. Commun. 2016, 7, 12717. [Google Scholar] [CrossRef] [PubMed] [Green Version]
- Adami, M.; Theodor Rudorff, B.F.; Freitas, R.M.; Aguiar, D.A.; Sugawara, L.M.; Mello, M.P. Remote Sensing Time Series to Evaluate Direct Land Use Change of Recent Expanded Sugarcane Crop in Brazil. Sustainability 2012, 4, 574–585. [Google Scholar] [CrossRef] [Green Version]
- Chen, W.; Xu, D.; Liu, J. The forest resources input–output model: An application in China. Ecol. Indic. 2015, 51, 87–97. [Google Scholar] [CrossRef]
- Chen, J.; Wu, Y.; Song, M.; Zhu, Z. Stochastic frontier analysis of productive efficiency in China’s Forestry Industry. J. For. Econ. 2017, 28, 87–95. [Google Scholar] [CrossRef]
- Eggers, J.; Holmgren, S.; Nordstrom, E.-M.; Lamas, T.; Lind, T.; Ohman, K. Balancing different forest values: Evaluation of forest management scenarios in a multi-criteria decision analysis framework. For. Policy Econ. 2019, 103, 55–69. [Google Scholar] [CrossRef]
- Djurfeldt, G.; Hall, O.; Jirstrom, M.; Bustos, M.A.; Holmquist, B.; Nasrin, S. Using panel survey and remote sensing data to explain yield gaps for maize in sub-Saharan Africa. J. Land Use Sci. 2018, 13, 344–357. [Google Scholar] [CrossRef] [Green Version]
- Mwalupaso, G.E.; Wang, S.; Rahman, S.; Alavo, E.J.-P.; Tian, X. Agricultural Informatization and Technical Efficiency in Maize Production in Zambia. Sustainability 2019, 11, 2451. [Google Scholar] [CrossRef] [Green Version]
- Lin, B.; Wang, X. Carbon emissions from energy intensive industry in China: Evidence from the iron & steel industry. Renew. Sustain. Energy Rev. 2015, 47, 746–754. [Google Scholar]
- Zhan, J.; Zhang, F.; Jia, S.; Chu, X.; Li, Y. Spatial Pattern of Regional Urbanization Efficiency: An Empirical Study of Shanghai. Comput. Econ. 2018, 52, 1277–1291. [Google Scholar] [CrossRef]
- Fall, F.; Akim, A.-M.; Wassongma, H. DEA and SFA research on the efficiency of microfinance institutions: A meta-analysis. World Dev. 2018, 107, 176–188. [Google Scholar] [CrossRef] [Green Version]
- Zhu, Q.; Wu, J.; Song, M. Efficiency evaluation based on data envelopment analysis in the big data context. Comput. Oper. Res. 2018, 98, 291–300. [Google Scholar] [CrossRef]
- Reinhard, S.; Knox Lovell, C.A.; Thijssen, G.J. Environmental efficiency with multiple environmentally detrimental variables; estimated with SFA and DEA. Eur. J. Oper. Res. 2000, 121, 287–303. [Google Scholar] [CrossRef]
- Lee, J.Y. Comparing SFA and DEA methods on measuring production efficiency for forest and paper companies. For. Prod. J. 2005, 55, 51–56. [Google Scholar]
- Kuosmanen, T.; Saastamoinen, A.; Sipiläinen, T. What is the best practice for benchmark regulation of electricity distribution? Comparison of DEA, SFA and StoNED methods. Energy Policy 2013, 61, 740–750. [Google Scholar] [CrossRef]
- Bai, Y.; Deng, X.; Zhang, Y.; Wang, C.; Liu, Y. Does climate adaptation of vulnerable households to extreme events benefit livestock production? J. Clean. Prod. 2019, 210, 358–365. [Google Scholar] [CrossRef]
- Makridou, G.; Andriosopoulos, K.; Doumpos, M.; Zopounidis, C. Measuring the efficiency of energy-intensive industries across European countries. Energy Policy 2016, 88, 573–583. [Google Scholar] [CrossRef]
- Li, N.; Jiang, Y.; Mu, H.; Yu, Z. Efficiency evaluation and improvement potential for the Chinese agricultural sector at the provincial level based on data envelopment analysis (DEA). Energy 2018, 164, 1145–1160. [Google Scholar] [CrossRef]
- Jia, S.; Wang, C.; Li, Y.; Zhang, F.; Liu, W. The urbanization efficiency in Chengdu City: An estimation based on a three-stage DEA model. Phys. Chem. Earth Parts A/B/C 2017, 101, 59–69. [Google Scholar] [CrossRef]
- Angulo-Meza, L.; González-Araya, M.; Iriarte, A.; Rebolledo-Leiva, R.; Soares de Mello, J.C. A multiobjective DEA model to assess the eco-efficiency of agricultural practices within the CF + DEA method. Comp. Electron. Agric. 2019, 161, 151–161. [Google Scholar] [CrossRef]
- Gidion, D.K.; Hong, J.; Adams, M.Z.A.; Khoveyni, M. Network DEA models for assessing urban water utility efficiency. Util. Policy 2019, 57, 48–58. [Google Scholar] [CrossRef]
- Wanke, P.; Abul Kalam Azad, M.; Emrouznejad, A.; Antunes, J. A dynamic network DEA model for accounting and financial indicators: A case of efficiency in MENA banking. Int. Rev. Econ. Financ. 2019, 61, 52–68. [Google Scholar] [CrossRef] [Green Version]
- Wang, J.; Wang, S.; Li, S.; Cai, Q.; Gao, S. Evaluating the energy-environment efficiency and its determinants in Guangdong using a slack-based measure with environmental undesirable outputs and panel data model. Sci. Total Environ. 2019, 663, 878–888. [Google Scholar] [CrossRef]
- Deng, X.; Gibson, J. Improving eco-efficiency for the sustainable agricultural production: A case study in Shandong, China. Technol. Forecast. Soc. Chang. 2019, 144, 394–400. [Google Scholar] [CrossRef]
- Musaba, E.; Bwacha, I. Technical efficiency of small scale maize production in Masaiti district, Zambia: A stochastic frontier approach. J. Ecol. Sustain. Dev. 2014, 5, 104–111. [Google Scholar]
- Katuwal, H.; Calkin, D.E.; Hand, M.S. Production and efficiency of large wildland fire suppression effort: A stochastic frontier analysis. J. Environ. Manag. 2016, 166, 227–236. [Google Scholar] [CrossRef]
- Xiong, L.; Wang, F.; Cheng, B.; Yu, C. Identifying factors influencing the forestry production efficiency in Northwest China. Resour. Conserv. Recycl. 2018, 130, 12–19. [Google Scholar] [CrossRef]
- Wang, P.; Deng, X.; Jiang, S. Global warming, grain production and its efficiency: Case study of major grain production region. Ecol. Indic. 2018, 105, 563–570. [Google Scholar] [CrossRef]
- Du, K.R.; Lin, B.Q. International comparison of total-factor energy productivity growth: A parametric Malmquist index approach. Energy 2017, 118, 481–488. [Google Scholar] [CrossRef]
- Lin, B.Q.; Zheng, Q.Y. Energy efficiency evolution of China’s paper industry. J. Clean. Prod. 2017, 140, 1105–1117. [Google Scholar] [CrossRef]
- Jin, G.; Li, Z.; Deng, X.; Yang, J.; Chen, D.; Li, W. An analysis of spatiotemporal patterns in Chinese agricultural productivity between 2004 and 2014. Ecol. Indic. 2019, 105, 591–600. [Google Scholar] [CrossRef]
- Wingate, V.R.; Phinn, S.R.; Kuhn, N. Mapping precipitation-corrected NDVI trends across Namibia. Sci. Total Environ. 2019, 684, 96–112. [Google Scholar] [CrossRef] [PubMed]
- Liu, W.; Zhan, J.; Zhao, F.; Yan, H.; Zhang, F.; Wei, X. Impacts of urbanization-induced land-use changes on ecosystem services: A case study of the Pearl River Delta Metropolitan Region, China. Ecol. Indic. 2019, 98, 228–238. [Google Scholar] [CrossRef]
- Deng, X.; Huang, J.; Rozelle, S.; Uchida, E. Cultivated land conversion and potential agricultural productivity in China. Land Use Policy 2006, 23, 372–384. [Google Scholar] [CrossRef]
- China Year Books. China Forest Statistical Yearbook; China Forestry Press: Beijing, China, 2017. [Google Scholar]
- Duan, H.; Yan, C.; Tsunekawa, A.; Song, X.; Li, S.; Xie, J. Assessing vegetation dynamics in the Three-North Shelter Forest region of China using AVHRR NDVI data. Environ. Earth Sci. 2011, 64, 1011–1020. [Google Scholar] [CrossRef]
- Chu, X.; Zhan, J.; Li, Z.; Zhang, F.; Qi, W. Assessment on forest carbon sequestration in the Three-North Shelterbelt Program region, China. J. Clean. Prod. 2019, 215, 382–389. [Google Scholar] [CrossRef]
- Debreu, G. The Coefficient of Resource Utilization. Econometrica 1951, 19, 273–292. [Google Scholar] [CrossRef]
- Farrell, M.J. The Measurement of Productive Efficiency. J. Royal Stat. Soc. Ser. a-Gen. 1957, 120, 253–290. [Google Scholar] [CrossRef]
- Battese, G.E.; Coelli, T.J. Frontier production functions, technical efficiency and panel data: With application to paddy farmers in India. J. Prod. Anal. 1992, 3, 153–169. [Google Scholar] [CrossRef]
- Amemiya, T. Regression analysis when the dependent variable is truncated normal. Econom. J. Econom. Soc. 1973, 41, 997–1016. [Google Scholar] [CrossRef]
- Peltonen-Sainio, P.; Pirinen, P.; Mäkelä, H.M.; Ojanen, H.; Venäläinen, A. Spatial and temporal variation in weather events critical for boreal agriculture: II Precipitation. Agric. Food Sci. 2016, 25, 57–70. [Google Scholar] [CrossRef]
- Tobin, J. Estimation of relationships for limited dependent variables. Econom. J. Econom. Soc. 1958, 26, 24–36. [Google Scholar] [CrossRef] [Green Version]
- Peterson, E.B. Estimating cover of an invasive grass (Bromus tectorum) using tobit regression and phenology derived from two dates of Landsat ETM plus data. Int. J. Remote Sens. 2005, 26, 2491–2507. [Google Scholar] [CrossRef]
Figure 1.
The distribution of forests within the region of Three-North Shelter Forest Program.
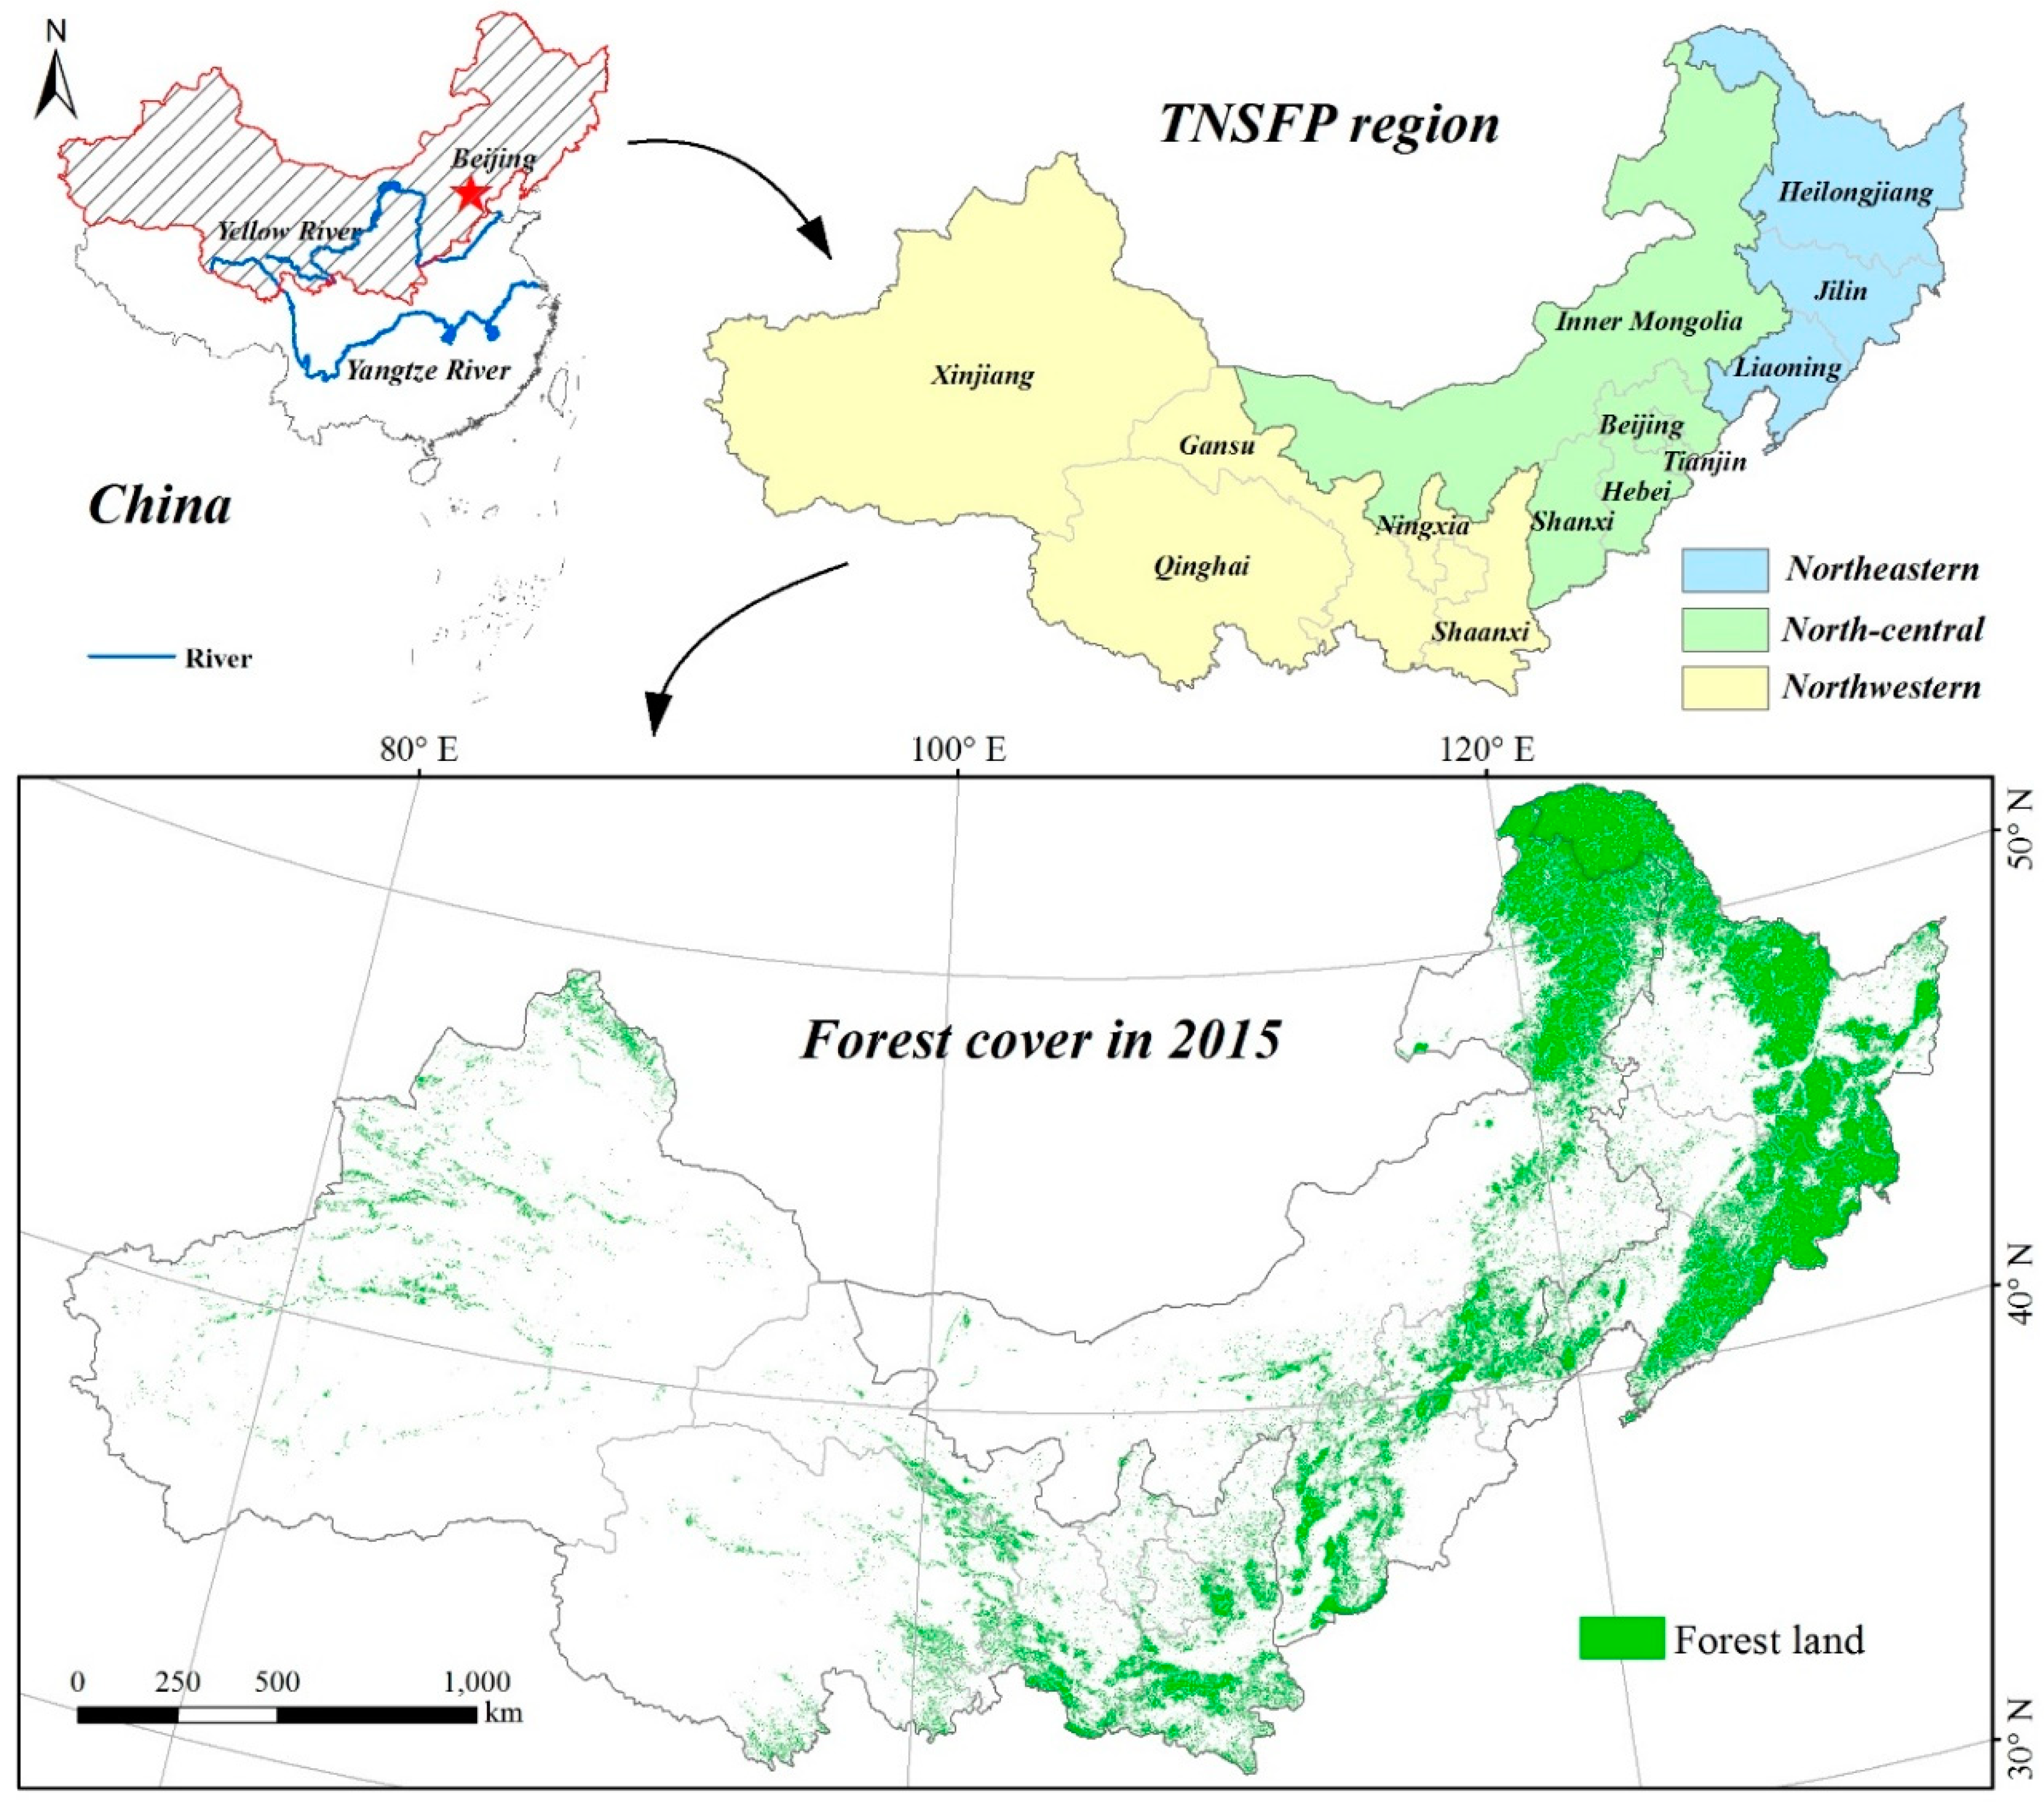
Figure 2.
The general analytical framework of the study.

Figure 3.
Changes in labor and output in the 13 provinces from 2000 to 2016.
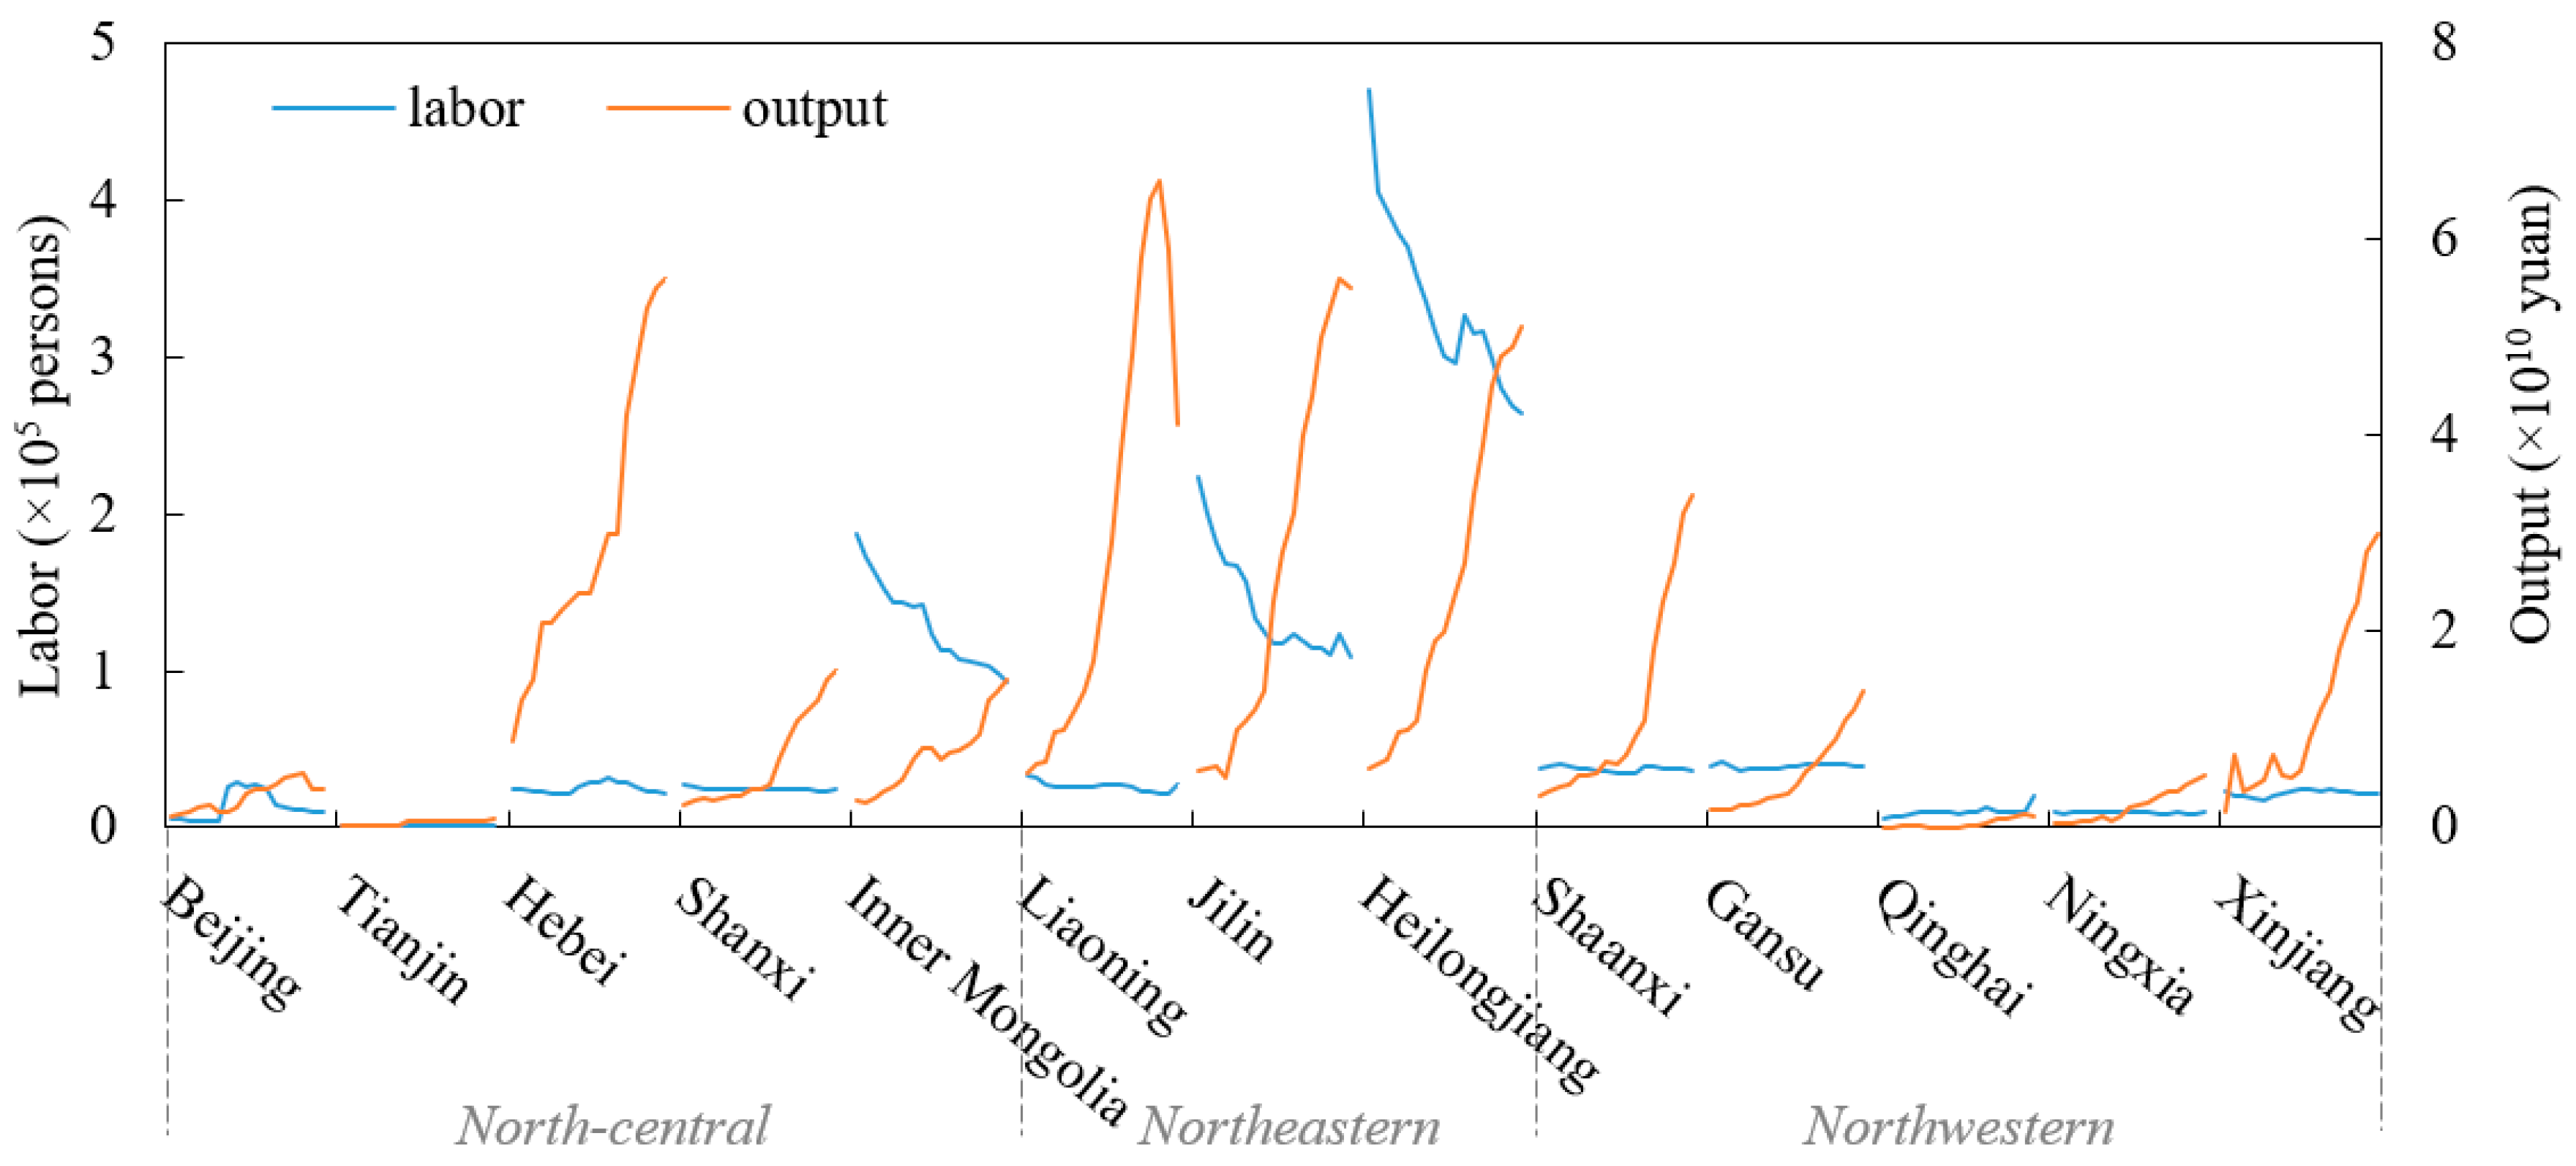
Figure 4.
Distribution of Forest Production Efficiency (FPE) of the 13 provinces from 2000 to 2016.

Figure 5.
Temporal changes of Forest Production Efficiency in the region of Three-North Shelter Forest Program.
Figure 5.
Temporal changes of Forest Production Efficiency in the region of Three-North Shelter Forest Program.

Figure 6.
Spatial changes and trend surface analysis of Forest Production Efficiency (FPE) values in the region of Three-North Shelter Forest Program (a) FPE in 2000; (b) FPE in 2010; (c) FPE in 2016; (d) the change of FPE from 2000 to 2016; X, Y, and Z axes represent east, north, and FPE values, respectively).

Figure 7.
Relationships between the influencing factors and Forest Production Efficiency from 2000 to 2016.
Figure 7.
Relationships between the influencing factors and Forest Production Efficiency from 2000 to 2016.

Table 1.
Summary statistics on the variables used in the forest production efficiency (FPE) estimation and the Tobit regression.
Table 1.
Summary statistics on the variables used in the forest production efficiency (FPE) estimation and the Tobit regression.
| Variables | Unit | Abbr. | Obs. | Mean | Std. Dev | Min. | Max. | |
|---|---|---|---|---|---|---|---|---|
| Input | Labor | 104 | L | 221 | 62,737.78 | 91,446.81 | 735.00 | 470,317.00 |
| Capital | 104 yuan | K | 221 | 77,482.55 | 85,302.16 | 343.59 | 484,956.00 | |
| Land | km2 | T | 221 | 98,249.17 | 105,839.60 | 1330.00 | 440,361.00 | |
| Output | Gross forestry output | 104 yuan | Y | 221 | 1,241,460.00 | 1,539,604.00 | 8231.24 | 6,600,000.00 |
| Factors | Average temperature for the period April–October | 102 °C | tem | 221 | 0.1866 | 0.0275 | 0.12 | 0.23 |
| Total annual rainfall | 103 mm | rai | 221 | 0.4514 | 0.1594 | 0.07 | 0.89 | |
| Per capita GDP | 104 yuan/person | pgd | 221 | 1.0982 | 0.7358 | 0.20 | 3.55 | |
| Education levels of forestry employees | % | edu | 221 | 0.4322 | 0.1904 | 0.05 | 0.76 | |
| Number of forest technology stations in townships | 102 | sta | 221 | 7.0121 | 3.9793 | 0.09 | 18.15 | |
| Disease and pest control areas | 103 km2 | con | 221 | 2.7484 | 2.2020 | 0.12 | 13.34 | |
| Natural Forest Protection Program (Yes = 1, No = 0) | - | pol | 221 | 0.6923 | 0.4626 | 0 | 1 | |
Table 2.
The results of the stochastic frontier approach (SFA) model.
| Number of Obs. = 221 | Wald chi2(9) = 289.67 | ||||||
|---|---|---|---|---|---|---|---|
| Log Likelihood = −327.24 | Prob > chi2 = 0.0000 | ||||||
| Coefficient | Variable | Coef. Value | Std. Err. | z | p-Value | [95% Conf. Interval] | |
| β0 | _cons | −10.3848 *** | 3.9973 | −2.60 | 0.009 | −18.2193 | −2.5503 |
| βl | lnL | −1.4921 | 1.7952 | −0.83 | 0.406 | −5.0106 | 2.0264 |
| βk | lnK | 1.6790 *** | 0.5746 | 2.92 | 0.003 | 0.5528 | 2.8052 |
| βt | lnT | 3.6556 ** | 1.7022 | 2.15 | 0.032 | 0.3194 | 6.9919 |
| βll | lnLlnL | −1.0713 *** | 0.1697 | −6.31 | 0.000 | −1.4040 | −0.7387 |
| βkk | lnKlnK | 0.0208 | 0.0376 | 0.55 | 0.580 | −0.0529 | 0.0945 |
| βtt | lnTlnT | −0.8223 *** | 0.1575 | −5.22 | 0.000 | −1.1309 | −0.5136 |
| βlk | lnLlnK | 0.3295 ** | 0.1626 | 2.03 | 0.043 | 0.0109 | 0.6481 |
| βlt | lnLlnT | 1.9217 *** | 0.3020 | 6.36 | 0.000 | 1.3297 | 2.5136 |
| βkt | lnKlnT | −0.5185 *** | 0.1331 | −3.90 | 0.000 | −0.7794 | −0.2577 |
Note: ** significant at 5%; *** significant at 1%.
Table 3.
Unit root test results.
| No. | Variables | Adjusted t | p-Value |
|---|---|---|---|
| 1 | lab | −2.8934 *** | 0.0019 |
| 2 | cap | −2.4056 *** | 0.0081 |
| 3 | lan | −1.5803 * | 0.0570 |
| 4 | tem | −4.5568 *** | 0.0000 |
| 5 | rai | −7.2397 *** | 0.0000 |
| 6 | pgd | −2.8716 *** | 0.0020 |
| 7 | edu | −4.0350 *** | 0.0000 |
| 8 | con | −4.5640 *** | 0.0000 |
| 9 | sta | −4.9882 *** | 0.0000 |
| 10 | pol | - | - |
Note: * significant at 10%, *** significant at 1%.
Table 4.
The results of the Tobit regression models for factors influencing forest production efficiency.
Table 4.
The results of the Tobit regression models for factors influencing forest production efficiency.
| FPE | Tobit1 | Tobit2 | Tobit3 | |||||||||
|---|---|---|---|---|---|---|---|---|---|---|---|---|
| Coef. | Std. Err. | t | p-Value | Coef. | Std. Err. | t | p-Value | Coef. | Std. Err. | t | p-Value | |
| lab | 0.0002 | 0.0001 | 1.4600 | 0.1460 | 0.0003 *** | 0.0001 | 3.1700 | 0.0020 | 0.0004 *** | 0.0001 | 3.5500 | 0.0000 |
| cap | −8.70 × 10⁻⁴ | 0.0013 | −0.6700 | 0.5020 | −0.0019 * | 0.0011 | −1.7600 | 0.0810 | −0.0021 ** | 0.0010 | −2.0500 | 0.0420 |
| lan | −4.46 × 10⁻⁵ | 0.0011 | −0.0400 | 0.9680 | −0.0058 *** | 0.0011 | −5.3600 | 0.0000 | −0.0050 *** | 0.0011 | −4.6700 | 0.0000 |
| tem | 2.5271 *** | 0.3718 | 6.8000 | 0.0000 | 1.4476 *** | 0.3440 | 4.2100 | 0.0000 | ||||
| rai | 0.3319 *** | 0.0612 | 5.4300 | 0.0000 | 0.0800 | 0.0591 | 1.3500 | 0.1780 | ||||
| pgd | 0.1138 *** | 0.0165 | 6.8900 | 0.0000 | 0.0882 *** | 0.0181 | 4.8700 | 0.0000 | ||||
| edu | 0.1554 *** | 0.0587 | 2.6500 | 0.0090 | 0.2120 *** | 0.0591 | 3.5800 | 0.0000 | ||||
| sta | 0.0180 *** | 0.0024 | 7.6300 | 0.0000 | 0.0149 *** | 0.0025 | 6.0600 | 0.0000 | ||||
| con | 0.0205 *** | 0.0048 | 4.2800 | 0.0000 | 0.0190 *** | 0.0046 | 4.1000 | 0.0000 | ||||
| pol | −0.0331 | 0.0215 | −1.5300 | 0.1260 | 0.0064 | 0.0232 | 0.2800 | 0.7810 | ||||
| _cons | −0.1539 ** | 0.0741 | −2.0800 | 0.0390 | 0.1720 *** | 0.0331 | 5.2000 | 0.0000 | −0.1412 * | 0.0825 | −1.7100 | 0.0890 |
| /sigma | 0.1393 | 0.0066 | 0.1085 | 0.0052 | 0.1044 | 0.0050 | ||||||
| Log likelihood = 122.0705 | Log likelihood = 177.32173 | Log likelihood = 185.86889 | ||||||||||
| Pro > chi2 = 0.0000 | Pro > chi2 = 0.0000 | Pro > chi2 = 0.0000 | ||||||||||
| LR chi2 (7) = 77.56 | LR chi2(6) = 188.06 | LR chi2 (3) = 205.16 | ||||||||||
| Pseudo R2 = −0.4656 | Pseudo R2 = −1.1289 | Pseudo R2 = −1.2316 | ||||||||||
Note: * significant at 10%, ** significant at 5%, *** significant at 1%.
© 2019 by the authors. Licensee MDPI, Basel, Switzerland. This article is an open access article distributed under the terms and conditions of the Creative Commons Attribution (CC BY) license (http://creativecommons.org/licenses/by/4.0/).
Share and Cite
MDPI and ACS Style
Wang, C.; Chu, X.; Zhan, J.; Wang, P.; Zhang, F.; Xin, Z. Factors Contributing to Efficient Forest Production in the Region of the Three-North Shelter Forest Program, China. Sustainability 2020, 12, 302. https://doi.org/10.3390/su12010302
AMA Style
Wang C, Chu X, Zhan J, Wang P, Zhang F, Xin Z. Factors Contributing to Efficient Forest Production in the Region of the Three-North Shelter Forest Program, China. Sustainability. 2020; 12(1):302. https://doi.org/10.3390/su12010302
Chicago/Turabian StyleWang, Chao, Xi Chu, Jinyan Zhan, Pei Wang, Fan Zhang, and Zhongling Xin. 2020. "Factors Contributing to Efficient Forest Production in the Region of the Three-North Shelter Forest Program, China" Sustainability 12, no. 1: 302. https://doi.org/10.3390/su12010302
Note that from the first issue of 2016, this journal uses article numbers instead of page numbers. See further details here.