Adopting an Actor Analysis Framework to a Complex Technology Innovation Project: A Case Study of an Electric Road System

1
School of Engineering Sciences in Chemistry, Biotechnology and Health, KTH Royal Institute of Technology, 114 28 Stockholm, Sweden
2
School of Industrial Technology and Technology and Management, KTH Royal Institute of Technology, 114 28 Stockholm, Sweden
*
Author to whom correspondence should be addressed.
Sustainability 2020, 12(1), 313; https://doi.org/10.3390/su12010313
Submission received: 5 November 2019
/
Revised: 21 December 2019
/
Accepted: 26 December 2019
/
Published: 31 December 2019
(This article belongs to the Special Issue Decision Support Systems for Urban Logistics Planning: Multi-Stakeholder and Participative Approaches)
Abstract
:An electric road system (ERS) is a transportation solution that provides electricity for fully electric vehicles while in motion. This solution might contribute to sustainable transportation by overcoming range anxiety problems that fully electric vehicles, especially heavy vehicles, have encountered due to battery technology limitations. However, large-scale ERS implementations are challenging, both technically and socially. An ERS is not only an engineering project, but also a complex technology innovation system composed of multiple subsystems and stakeholders, which requires an interdisciplinary means of aligning relations, problems, and solutions. In the policy analysis domain, researchers have developed actor analysis methods to support policy making processes. Actor analysis methods can provide an analytical reflection in solving complex multi-actor policy making challenges that ERSs are also facing. To uncover the complexity of multiple subsystems and stakeholders involved in an ERS, this paper applied a method to align system characteristics with the stakeholders’ perceptions to understand multi-stakeholder contexts in complex technology innovation projects. Desk research was first conducted to summarise ERS characteristics. Then, the dynamic actor network analysis method framework was adopted to establish an action, factor, goal (AFG) list, which was revised by independent researchers. Next, the AFG list was used to collect the perceptions of the ERS stakeholders, expressed as AFG selections and causal links through stakeholder interviews. The resulting AFG list was iterated through two rounds of interviews and then validated in a Swedish ERS case workshop. The results from this methodology showed that the actor analysis method can not only be applied to policy analysis domains, but can also be applied to technology innovation complex systems, using the electric road system as a case study, to help uncover the ERS complexity from the concerns of stakeholders and to secure a pathway towards sustainable technology implementation.
1. Introduction
In recent years, many disruptive technologies have been introduced. While new technologies can benefit society in various ways, social adaptation and user acceptance are challenging. These challenges are usually analysed through system-level analysis methods involving different stakeholders. Actor analysis methods seek to understand complex linkages and interactions between subsystems and stakeholders.
Sweden has established a nation-wide policy plan to achieve a fossil-free vehicle fleet by 2045 [1]. Electric vehicles (EV) have been adopted as a potential solution to achieve an environmentally sustainable transport system in accordance with the Kyoto Protocol [2]. Replacing a majority of internal combustion engines (ICEs) with EVs will result in a significant reduction in CO2 emissions in the road transportation section [3]. However, the bottleneck in EV implementation is the limitation of current energy storage technology, most notably the energy density of the battery, charging time, and battery life-cycle [4]. An electric road system (ERS) is defined as a transportation system where vehicles receive dynamic power transfer while in motion [5]. In addition to a positive effect on the emissions of greenhouse gas (GHG) to the local environment, ERSs may solve the battery capacity problem and associated range anxiety issue. An ERS solution for heavy-duty trucks significantly reduces the energy consumption and can have a competitive life-cycle cost when compared with diesel trucks [6]. In order to encourage the future implementation of ERSs and achieve a sustainable transportation system in the long-term, the authors selected an ERS project as a case study to uncover the complexity and stakeholder influences at the early stage of such a project.
ERSs comprise several sub-systems including technology systems (vehicle and infrastructure), operational systems (operators and customers), payment systems, communication systems, energy systems, production system, and maintenance systems [5]. Mostly, each system and each stakeholder focuses on their individual needs and tasks, often with insufficient communication across the different sub-systems. As for other systems of systems, complexity in the interrelation between sub-systems and stakeholder integration is a challenge. An analysis is needed to clarify the subsystems’ characteristics and map the ERS stakeholders’ perceptions with the sub-system elements. Stakeholder involvement also contributes to defined drivers of organisations’ sustainable development [7].
This paper mainly addresses the following question: To what extent is the actor network analysis method applicable to complex technology innovation projects? Under what circumstances can such a methodological approach contribute to revealing the stakeholders’ concerns and complex challenges of an early-stage ERS? To answer these questions, the authors performed a system-level analysis to illustrate and generalize the system features of current ERS projects into the action, factor, and goal list, which stakeholders can use to describe their perceptions of ERS. First, top-down desk research was conducted to specify the structure of the ERS subsystems and stakeholder groups. Second, version 1.0 of the action, factor, and goal (AFG) list was summarised according to the ERS subsystem structure and revised by researchers from research institutes and universities who had background knowledge of ERS and had worked in the transportation research domain. Third, the AFG list was validated in a Swedish ERS case with the real stakeholders involved. Two cases were discussed in this study: the first was an EU ERS case, which was used in the desk research process to establish the AFG list version 1.0, and the second was a Swedish ERS case that was used to test the method and validate the result. In this study, enablers of achieving a sustainable environment in the ERS project were also captured such as energy and environmental concerns.
The rest of this paper is organized as follows. Section 2 discusses related research works in system analysis, stakeholder theory, and actor network analysis. Section 3 introduces the methodology and system architecture of the ERS. Section 4 illustrates the details of the Swedish ERS case study. In Section 5, the research questions are answered and discussed. Section 6 conclude the paper with future directions.
2. Literature Review
In this section, the authors summarise the results of a semi-systematic literature review [8] and give an interdisciplinary overview of the system engineering methods and system analysis, actor analysis, and stakeholder theory using snowballing techniques. The authors utilized the following search engines: Web of Science Core Collection, ACM Digital Library, and JSTOR, using the keywords: system engineering, stakeholder analysis, and actor network analysis literature between 2005–2019. The full search criteria and the complete results are summarised in Table 1.
An analysis of the identified literature revealed that hardly any of the relevant studies in the transportation field used stakeholder and actor analysis. However, the review also showed that this analysis is very suitable for equally complex systems in other domains such as the space industry, business management, policy analysis, and energy and environment domains. Most of the literature in this study (41) included peer-reviewed papers, conference proceedings, and book chapters. The authors also included relevant PhD and master theses (3), project reports (9), and web pages (11) to reduce the elimination bias of search engines. This process helps to obtain a full understanding of the theories and identify how to implement the methods according to the ERS challenges.
The literature was categorised by: (a) System definition and appropriateness of system engineering methods and system analysis for solving problems in complex systems; (b) the system engineering and concepts adopted in the transportation system; (c) stakeholder identification, the stakeholder group alignment, and the stakeholder engagement influence in transportation projects; and (d) the dynamic actor network analysis methods as a tool to connect complex systems and stakeholder engagement.
From a general perspective, the system refers to a combination of a set of elements, principles of interaction, and changes among a defined boundary [16,17]. There are three main elements in the system: elements (characteristics), interconnections, and a function or purpose [16]. The complexity of the system is defined by two factors as mentioned by Hubert: the first is the number of disciplines and the second is the organisations involved in the system. The more engineering disciplines and organisations are involved, the more complex the system will be [17]. System engineering methods are frequently applied to solve complex system problems [18]. System engineering methods comprise of a set of mixed methods and processes that synthesise issues of a target system to understand how its components interact with its stakeholders, considering the goal of facilitating system integration and social acceptance such as system analysis [19]. Desk research is one approach used to investigate the state of knowledge in different cases for system analysis [20,21]. PESTEL analysis is a systematic tool that includes a comprehensive review of political factors, economic factors, social factors, technological factors, environmental factors, and legal factors from experts of a system [22] and can provide a macro level and environmental scanning of a project [23].
In the context of transportation, a system-of-systems (SoS) approach can be applied [24,25]. Delaurentis describes a SoS as follows: “A system-of-systems consists of multiple, heterogeneous, distributed, occasionally independently operating systems embedded in networks at multiple levels that evolve.” In the ERS case, systems and stakeholders are two entities that facilitate our understanding of ERS characteristics from the stakeholders’ perspective. System engineering methods can help to understand the stakeholder motivations and the system interactions [26]. Many studies have proposed theoretical frameworks to understanding stakeholder behaviour in a complex system to receive better success [27,28,29], and one of these means is the use of stakeholder theory.
Freeman first introduced stakeholder theory in the strategic management domain and defined stakeholders as “any group or individual who can affect or who is affected by the achievement of the organization’s objectives” [30], which focuses on the influence among stakeholders in subsystems. Stakeholders play an important role in interdisciplinary research [9,13]. A group of stakeholders serving similar functions is aligned in one stakeholder group. The identification of stakeholders in organisations and systems is a critical step in connecting independent, self-standing entities [31]. Stakeholder theory focuses on analysing stakeholder needs and aims to help researchers and decision-makers understand how stakeholders perceive real-world problems and what the interactions are among the stakeholders [32]. To uncover the interaction patterns, we first need to clarify who the stakeholders are [11]. Second, it is necessary to list their concerns and know how their concerns influence the system [12]. Knowing the stakes, goals, and actions of each stakeholder will help stakeholders uncover the complex relationships among subsystems and organisations [33]. Stakeholder engagement also provides a chance to involve the stakeholders’ concerns and values in transportation system design and decision-making processes [10,34,35]. In the Campania Regional Metro System project, stakeholders’ perceptions were collected in the transportation planning process [36,37]. For emerging technology projects, stakeholder engagement is widely adopted to learn how society views the system and what gaps exist [38,39]. Furthermore, stakeholder engagement will also encourage sustainable organization development in different aspects such as the environment, economy, and society [7]. It is helpful and necessary for stakeholders to engage a broad range of individuals including local politicians, media, residents, business owners, and national pressure groups due to the sensitivity of transportation strategy development [40]. Stakeholder requirements play a crucial role when the system reaches the implementation stage in society [41].
In the case of this ERS study, knowing the stakeholders’ concerns, what goals they set for themselves, and how they act to reach their goals can help uncover interactions, similarities, and conflicts among the stakeholders. Actor analysis methods focus on analysing the actors’ interactions in the policy analysis domain, which provides a chance to understand system complexity from the actor perspective [14]. There are many models in the actor analysis domain with a focus on different aspects of the policy analysis process: the network aspect, the actor perception aspect, and the resources and objectives aspect [33]. The cogitative mapping approach is one of the models using stakeholder perceptions to identify conflicts and solve potential problems in a complex system [42]. Bots created the dynamic actor-network analysis (DANA) method by using the mapping structure, which includes the action, factor, and goal to collect the individual actor’s perception to uncover potential conflicts, overlaps, and solutions [32]. An actor is defined as an action unit in the policy analysis, which is equal to a stakeholder in stakeholder theory in this study. Hermans adopted the DANA method in water resource management cases for experts to analyse the different influence of stakeholders and supported water policy development [15,42]. Stakeholder perception maps are composed of the actions they take, factors they care about, goals they want to reach (AFG), and causal influences between the AFG elements. In this case, the perception map can help decision-makers to understand and analyse complex policy problems from each actor’s point of view [43]. In this study, the actor analysis method DANA, which can provide a systematic approach by adopting stakeholder perceptions to analyse potential multi-stakeholder challenges and provide strategic solutions in complex systems, was selected.
3. Research Method and Approach
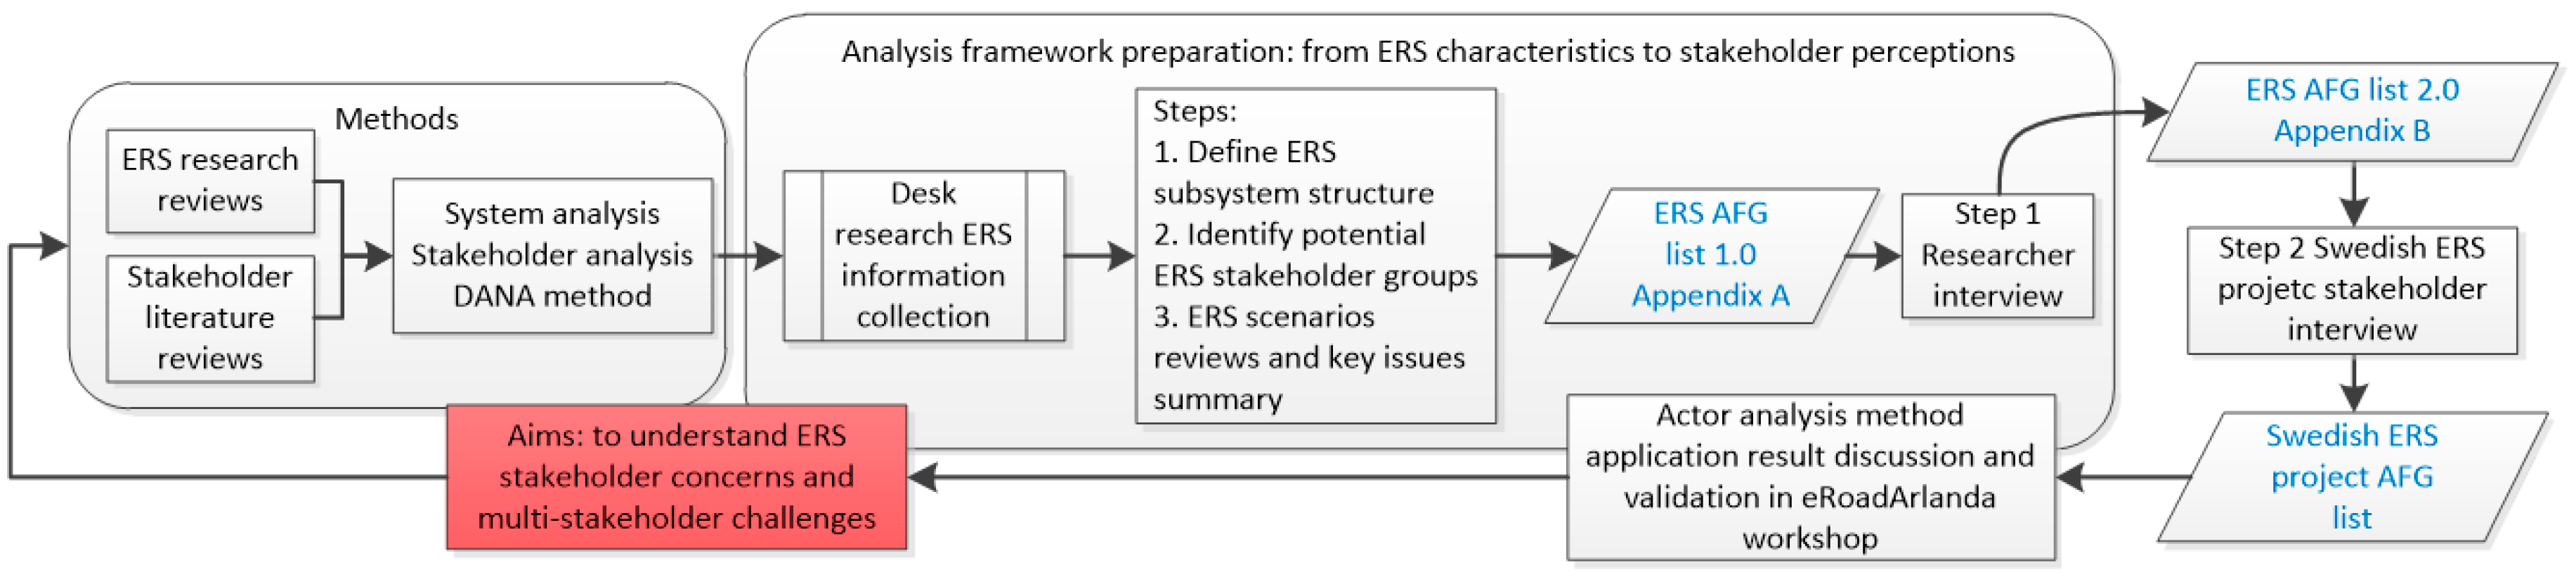
ERSs face challenges from the variety and uncertainty of multi-stakeholders involved in the project. To select methods for analysis, researchers need to clarify the analysis purpose and available resource [33]. To analyse challenges in a multi-stakeholder complex system, it is necessary to know the boundaries of the systems and which stakeholders are involved. The process flow is shown in Figure 1. Based on the interdisciplinary problems, limited publications, and multi-stakeholder challenges ERS is facing, the actor analysis method DANA was selected to present the stakeholders’ concerns. Upon this, the desk research of ERS projects was conducted.
To understand subsystems, stakeholder groups, and potential ERS implementation scenarios, the system characteristics were summarised from the discussed ERS scenarios as the basis of the AFG list version 1.0. Then, a test round interview was conducted with researchers using AFG list version 1.0 and then the list was revised to version 2.0. Afterwards, a second round of interviews was conducted with Swedish ERS stakeholders. A validation discussion was also organised with the interviewees to reflect on how the diagram interview method helped them as stakeholders to think systematically and identify similarities and conflicts.
3.1. ERS Desk Research Information Collection
In order to synthesize the state of knowledge and unravel technological details of ongoing ERS projects, the desk research was conducted in this section. The authors utilized online resources, project reports. and involved experts and researchers to revise the findings.
3.1.1. ERS State-of-the-Art
Electric road systems (ERSs) refer to the electrification of road infrastructure and first appeared in 1882 as trolleybuses in an urban area in Germany [44]. Trolleybuses can provide a pleasant travel experience for passengers and have a low cost of maintenance for operators, but have limitations in terms of operational flexibility and road arrangement [45], and thus in the 21st century, the relevance of trolleybuses for personal transport has diminished. However, considering the environmental impact, the recognition of more flexible EVs is rapidly growing once again, but battery capacity is one of the main bottlenecks for their wide implementation, especially when it comes to heavy vehicles. ERS solutions can overcome the battery capacity problem, since they provide electricity for fully electric vehicles in motion, and therefore have attracted more public attention since 2008 [46,47]. Andersson and Edfeldt described an ERS as “an ERS vehicle with drive technology, an inverter, and an electric motor that can transform the external continuous electricity supply into the battery and mechanical energy for propulsion” [48]. In summary, an ERS is an interdisciplinary system that not only concerns the on-road charging technologies and EVs, but also the other subsystems’ components.
The inauguration of the ERS demo projects started worldwide in 2013. Although the number and the scale of the demo projects were limited, the idea of ERS solutions attracted the attention of the public [49,50]. Figure 2 shows ongoing ERS demo projects in Korea, the USA, and Sweden. In Korea, two OLEV (On-Line Electric Vehicle) buses in Gumi provide local residents with a public transport service between Gumi and In-dong using inductive dynamic charging [51]. In the U.S., the first electric highway launched near the ports of Los Angeles to reduce greenhouse gas emissions using overhead conductive dynamic charging [52]. In Sweden, ERS projects E16 and eRoadArlanda were launched in 2016 and 2018 with overhead and underground conductive dynamic charging [52,53,54]. The EU’s 7th framework project named FABRIC (Feasibility analysis and development of on-road charging solutions for future electric vehicles) ran from 2014 to 2018 to study the technological feasibility, economic viability, and social-environmental sustainability of on road charging technology [55]. Compared to the trolleybus experience, ongoing ERS projects not only consider technology maturity challenges, but also the stakeholders’ concerns and influences on the social environment [56,57]. In this study, we focused on a conductive dynamic charging solution and used the eRoadArlanda project as the Swedish ERS case study.
3.1.2. ERS Subsystem Structure
To identify the subsystems in an ERS, several ERS project studies were reviewed to summarise the subsystem structure. Håkan introduced five subsystems based on the knowledge of three kinds of ERS solutions: railway solutions, overhead-line solutions, and wireless solutions [57]. The five subsystems were road operation system, power transfer system, road system, energy system, and vehicle system, as depicted in Figure 3. In each subsystem, functionalities were also divided into minor systems. In the FABRIC ERS project, experts defined nine high-level ERS architectural subsystems first based on a general function of the ICT (Information and Communications Technology) solutions to support prototype demonstration, as listed in Table 2:
From the information above, we know that different functional subsystems in the ERS are the foundation of future implementation. In the ERS demonstration stage, the focus was on the system functionality and technology, while social systems and different stakeholder concerns were put for later consideration. Afterwards, Tongur discussed the importance of socio-technical factors in the early phase of technology transitions [61]. In this study, the authors defined six subsystems in ERS to include all stakeholders: an operation system, regulation system, energy and environment system, technology system, road system, and social system in the structure, as shown in Figure 4. This structure not only covers the technological and functional subsystems, but also the social subsystems. This framework also facilitated the stakeholder groups and the AFG list structure in the following sections.
3.1.3. ERS Stakeholder Groups
An ERS involves many stakeholders from different domains. The stakeholder requirements were collected through interviews and web-based questionnaires to discuss the stakeholder alignments in the FABRIC project [62]. Considering the ERS subsystems’ function and stakeholders’ responsibilities, there were six stakeholder groups in the study. Different stakeholder groups were marked in different colours, as shown in Figure 5. The blue figure represents the technology industry (car manufacturers/OEMs, automotive suppliers, vehicle inspection company, standardisation authorities, and charging technology providers) and technology providers that belong to the technology subsystem. The grey figure represents the infrastructure providers (road construction company and roadside infrastructure provider). The green figure represents the energy industry and environmental authority stakeholders (energy suppliers, smart metering OEMs, smart grid authorities and environmental authorities). The orange figure represents the operators (ERS operators, traffic control centres, ERS service providers, etc.). The yellow figure represents the rest of society, which comprises ERS users and non-users. The pink figure represents governments and authorities (local authorities, road administration, or statutory authorities). This colour code also applies to the AFG list classification in Section 4.
3.2. ERS Characteristics Summary of the AFG List Version 1.0
According to the system definition and identified stakeholder groups, version 1.0 of the AFG list was generated by summarising the subsystem functions and potential stakeholder roles. In this section, the authors conducted system analysis reviews at two levels: a macro level review using FABRIC PESTEL analysis for ten scenarios, and a micro-level review considering the potential operation processes and maintenance processes. This review provided a holistic picture for understanding the ERS characteristics from both the macro-level of different scenarios and the micro-level of the different processes.
3.2.1. Macro-Level System Analysis
The PESTEL analysis in FABRIC was conducted at the early stage of ERS projects without large scale implementation accompanying various uncertainties. The scenarios analysis was conducted to introduce ten potential ERS scenarios to limit the uncertainties and to discuss the ERS feasibility according to each scenario. Four dimensions were discussed to uncover the potential ERS scenarios: the vehicle category dimension, ERS implementation dimension, operation distance dimension, and operation situation dimension. The factors discussed in the PESTEL analysis were on a holistic level, which included the political, economic, social, technological, environmental, and legal factors that affect the feasibility of an ERS. The PESTEL analysis result was reviewed by the FABRIC project consortium group with experts from different countries. The descriptions of the ten scenarios are listed in Table 3. Combined with the different implementation scenarios, the authors summarised the possible key issues that stakeholders were facing. The summary of the key issues also follows the six subsystems structure as mentioned in Section 3.1.2.
From the FABRIC PESTEL analysis of 10 ERS scenarios, there are four further feasible scenarios highlighted in green in Table 3 that concern all present situations and future implementation requirements: short-haul national freight corridors, long-haul national freight corridors, metropolitan deployment for buses, and international freight corridors [63]. Among the four scenarios, the short-haul national freight corridor scenario is the most feasible scenario due to its national scale, and the high regional logistics demand a maximizing system capability. Therefore, in this paper, the short-haul freight corridor Swedish eRoadArlanda case was used for testing and validation in Section 4.
The result of the summarised key items shown in Table 4 covers the potential problems in the operation process in different scenarios: the standardisation, regulation, and related legal problems, the energy and related environmental issues, the technical feasibility and safety issues, the road infrastructure issues, system interoperability, and society feedback. These key issues are outlined for authors to develop AFG list version 1.0 in Section 3.3.
3.2.2. Micro-Level Process Analysis
In the section below, the designed operation processes and maintenance processes are discussed to introduce further system attributes and stakeholder groups to develop the AFG list.
• ERS operation service process design
As shown in Figure 6, there are three processes in the subsystems when a user accesses the ERS service in the future. The first process is that a user sends a service request from the user system, and then the second process is that the ERS control system receives the user’s request and starts the third process, where the control system forwards the user request to the roadside system. The main stakeholder groups involved in this process are users, operators, and service suppliers.
• ERS maintenance process
The maintenance process focuses on the technical requirements of each subsystem, which include the maintenance of roads, maintenance of electricity supply infrastructures, maintenance of vehicles and batteries, and maintenance of ERS vehicle control systems. The stakeholders included in this process are the vehicle industry, vehicle maintenance companies, road construction, and charging infrastructure maintenance companies. In the next section, more information was collected through face-to-face interviews with ERS stakeholders.
3.3. From ERS Characteristics to AFG List
In order to map the ERS stakeholders’ concerns with the sub-system element in the interviews, the AFG list was summarised based on the ERS characteristics. The AFG list was generated by combining the existing literature, the six stakeholder group categories as shown in Figure 5, and the system key issues as outlined in Section 3.2 to identify the potential ERS stakeholders’ actions, factors, and goals as the AFG list version 1.0. To obtain a holistic picture of the potential ERS scenarios, the systematic feasibility study of potential ERS scenarios in the FABRIC project [63] was used as the secondary data for summarising AFG list version 1.0. Three to nine potential sub-stakeholder groups served different roles in different scenarios. How each stakeholder acted within the same group or with other stakeholders, what they cared about, and what they wanted to achieve when involved in the ERS project was summarised into AFG list version 1.0.
Combining the ERS subsystem and stakeholder group structure, the key issues for ERS implementation were summarised from the macro and micro level operation processes. The authors summarised the AFG list version 1.0 as shown in Table A1 (Appendix A). There were fifty selections of factors, seventeen selections of actions, and seventeen selections of goals from the technology, energy and environment, operation, regulation and society, and road infrastructure domains. To test the diagram interview method and the content of AFG list version 1.0, the first round of interviews was conducted with researchers working in ERS-related domains.
Test Round Interview with Researchers
The selection of interviewees is the foundation to ensure the quality of the interview results and the study. Twelve interviewees were involved from Swedish research institutes and universities and had background knowledge of the ERS, worked in the transportation research domain, were capable of communicating, and were willing to participate. The reason for involving researchers in the test round of the interviews was to check the acceptability of the AFG list. Researchers were involved to test the perception diagram method, the content of AFG list version 1.0, and to update the content of the AFG list from literature induction to stakeholder interpretation. The interviewees were asked to select to be one of the ERS stakeholders listed in Figure 5 and asked to briefly explain the reason for their role selections. In the next step, the interviewees answered as if they were the selected stakeholder. The interview started with a brief introduction of how they functioned in the ERS project as a selected stakeholder. The selected stakeholder roles are shown in Table 5.
After the interviewees introduced the selected stakeholder role, the AFG list version 1.0 was shown to the interviewees. The interviewees were asked to use the action, factor, and goal elements on list version 1.0, or add more AFG elements if they found that something was missing, and then draw a diagram to describe their work in the ERS project. The “key element” factors, actions, and goals are shown in the diagram as a “node” and linked with the causal links to visualise their perceptions between every two elements. The stakeholder face-to-face interview results were collected in the diagram using AFG list version 1.0 updated from the interviewees to obtain AFG list version 2.0, which is attached in Table A2. There were forty-eight selections of factors, seventeen selections of actions, and twelve selections of goals in AFG list version 2.0. The implementation of the test round interviews showed that the AFG list and diagram interview could be applied to collect different stakeholders’ perceptions. The researchers’ AFG selection result also increased the applicability of the AFG list. The test interview results of AFG list version 2.0 was presented to real ERS stakeholders for interviews in the Swedish ERS case study in the following section.
4. A Case Study of the Swedish ERS Project
4.1. The Swedish ERS Project Introduction
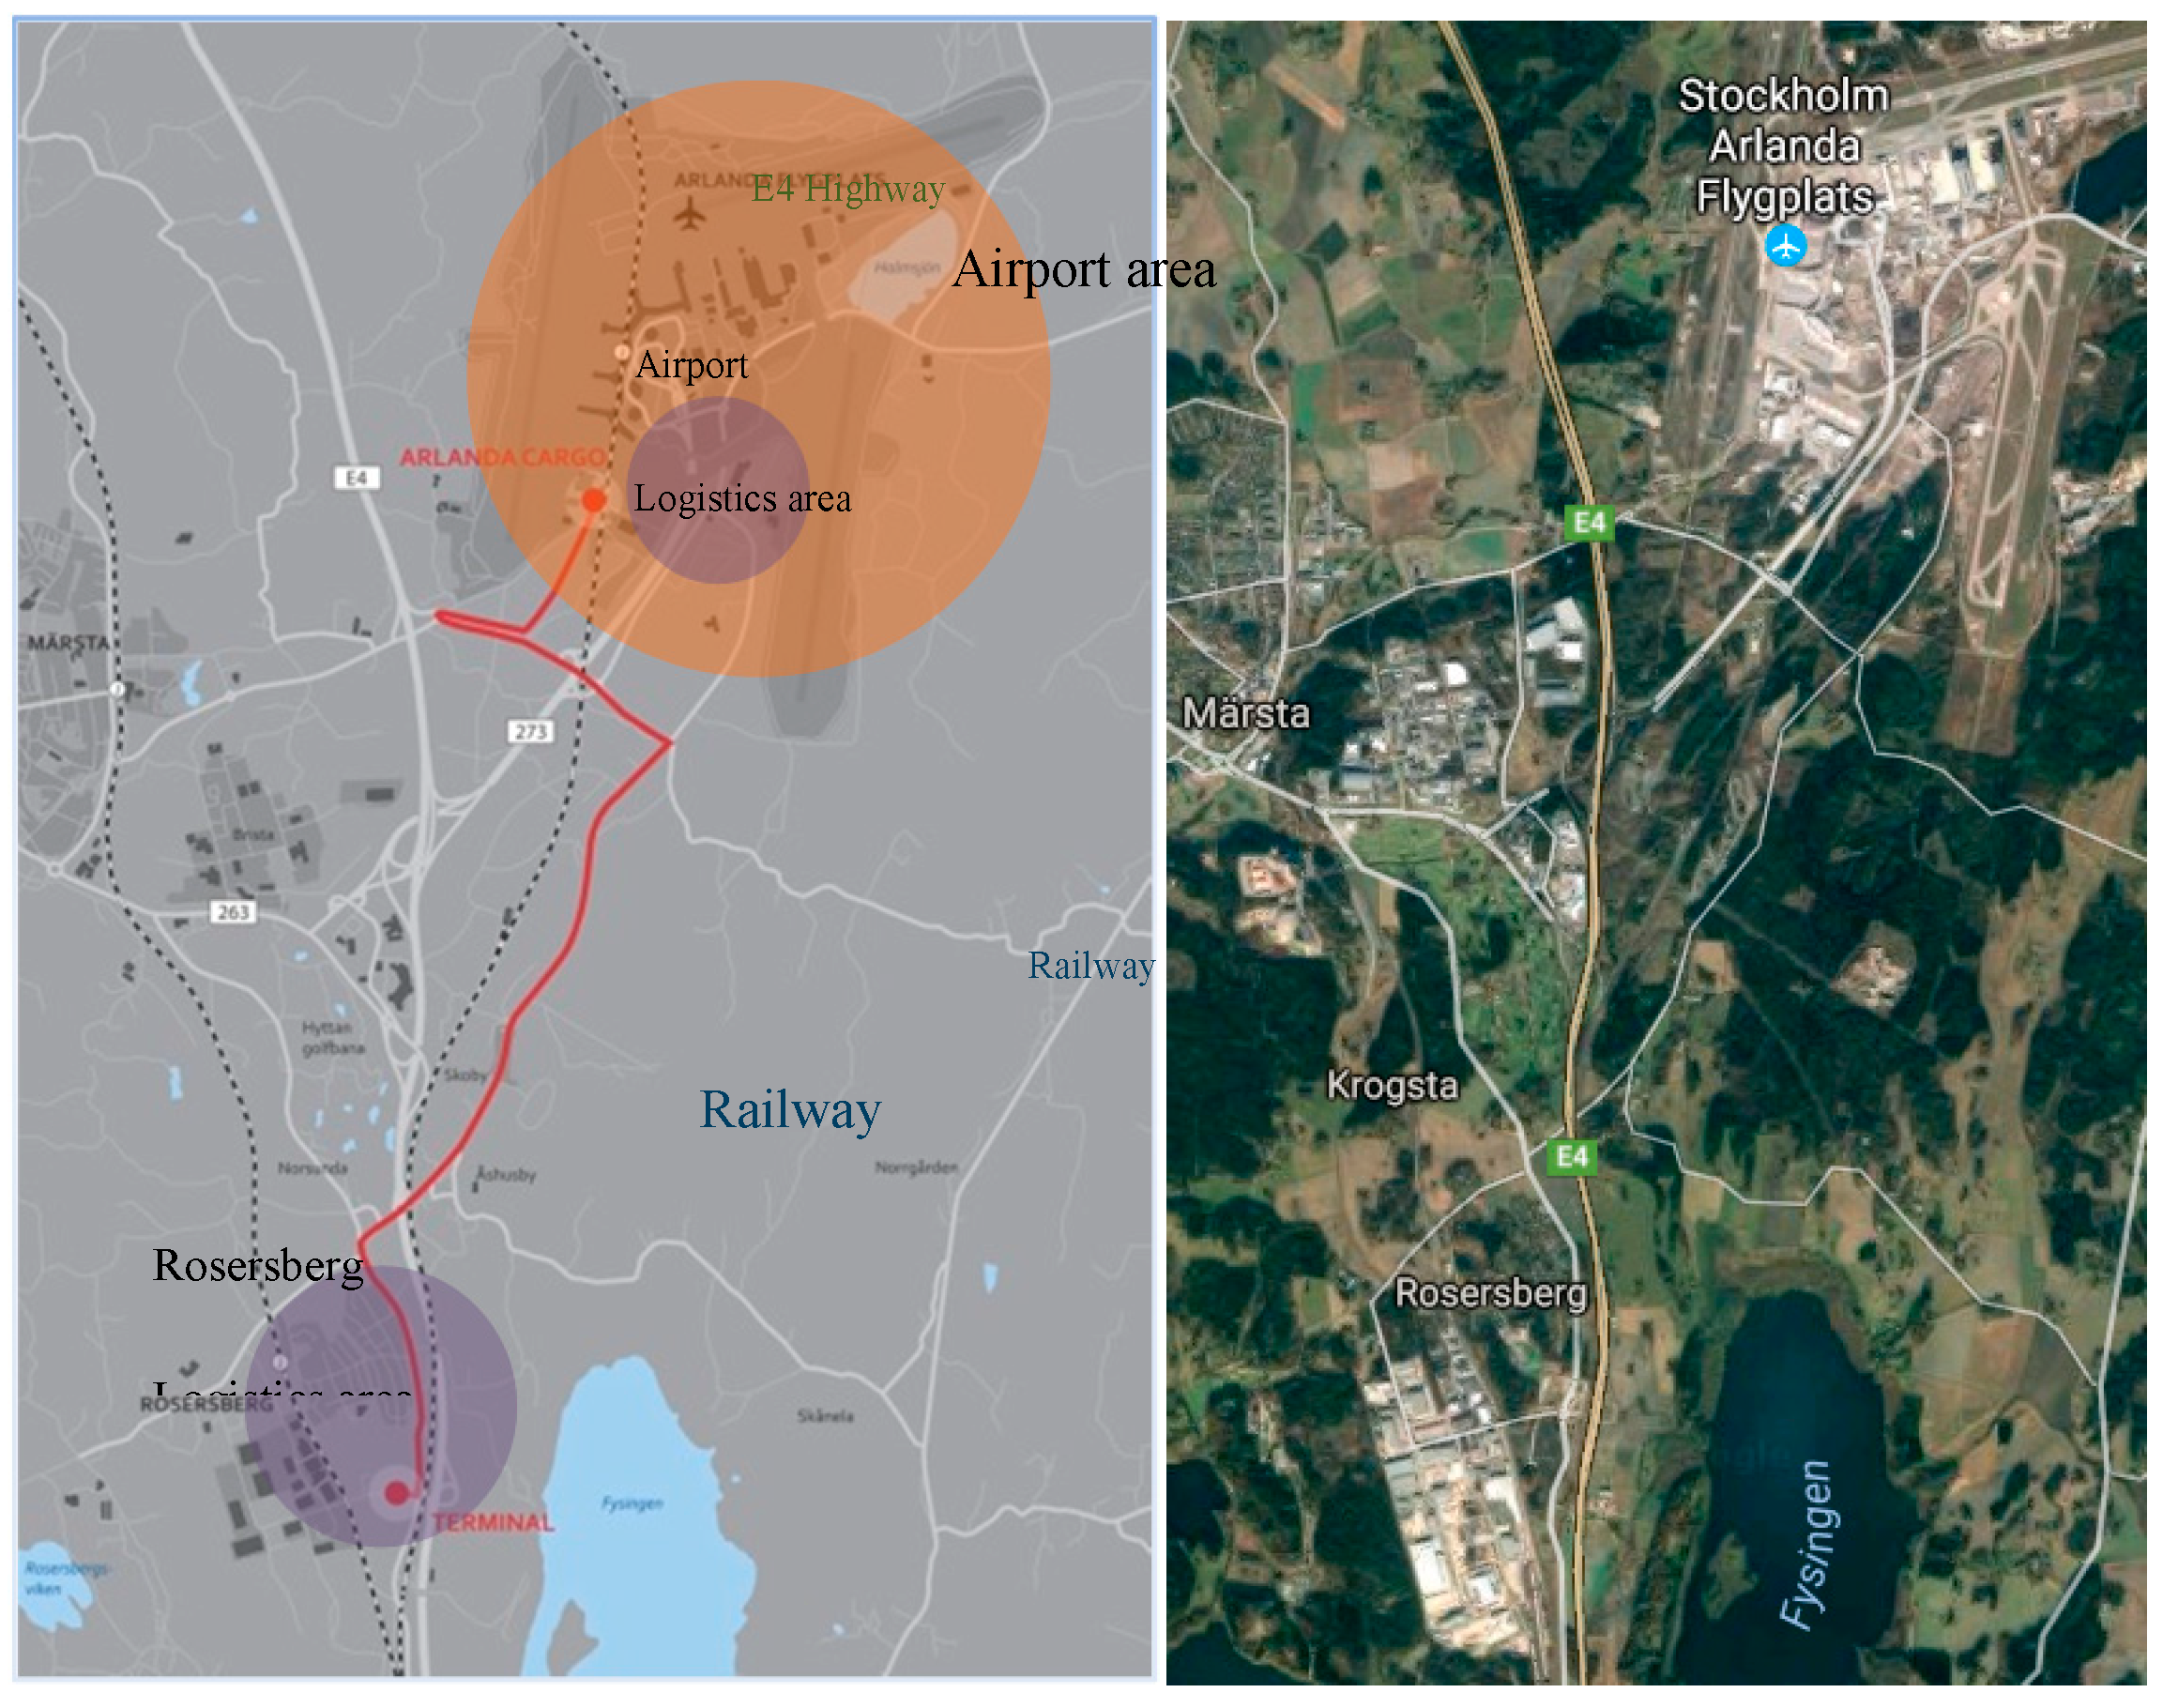
The idea of electrifying highways and lorries was proposed by a Swedish company, and a pre-study was initiated in 2009. During the process, different technologies were evaluated by a wide range of stakeholders [64]. The main goal of the Swedish ERS project is to develop a sustainable and environmentally friendly logistics transportation network. Implementing electric transportation in the Sigtuna region is just the first step in Sweden to achieving a long-haul nationwide transportation network powered by electricity. The electric road will cover a total distance of 10 km, as shown in Figure 7.
4.2. Stakeholders
There was a total of 12 participants from the Swedish ERS project that were classified into six different stakeholder groups. The twelve were confirmed by the project leaders as the key persons of each organisation with the relevant knowledge and represented their organizations in the project’s decision-making process. A brief introduction of each stakeholder is given in Table 6.
4.3. Stakeholder Interviews
During the interview process, participants were asked to introduce their professional background first, and then the interviewer posted the opening questions to start the interviews:
- What is your job responsibility in the ERS project?
- What do you think of the ERS project?
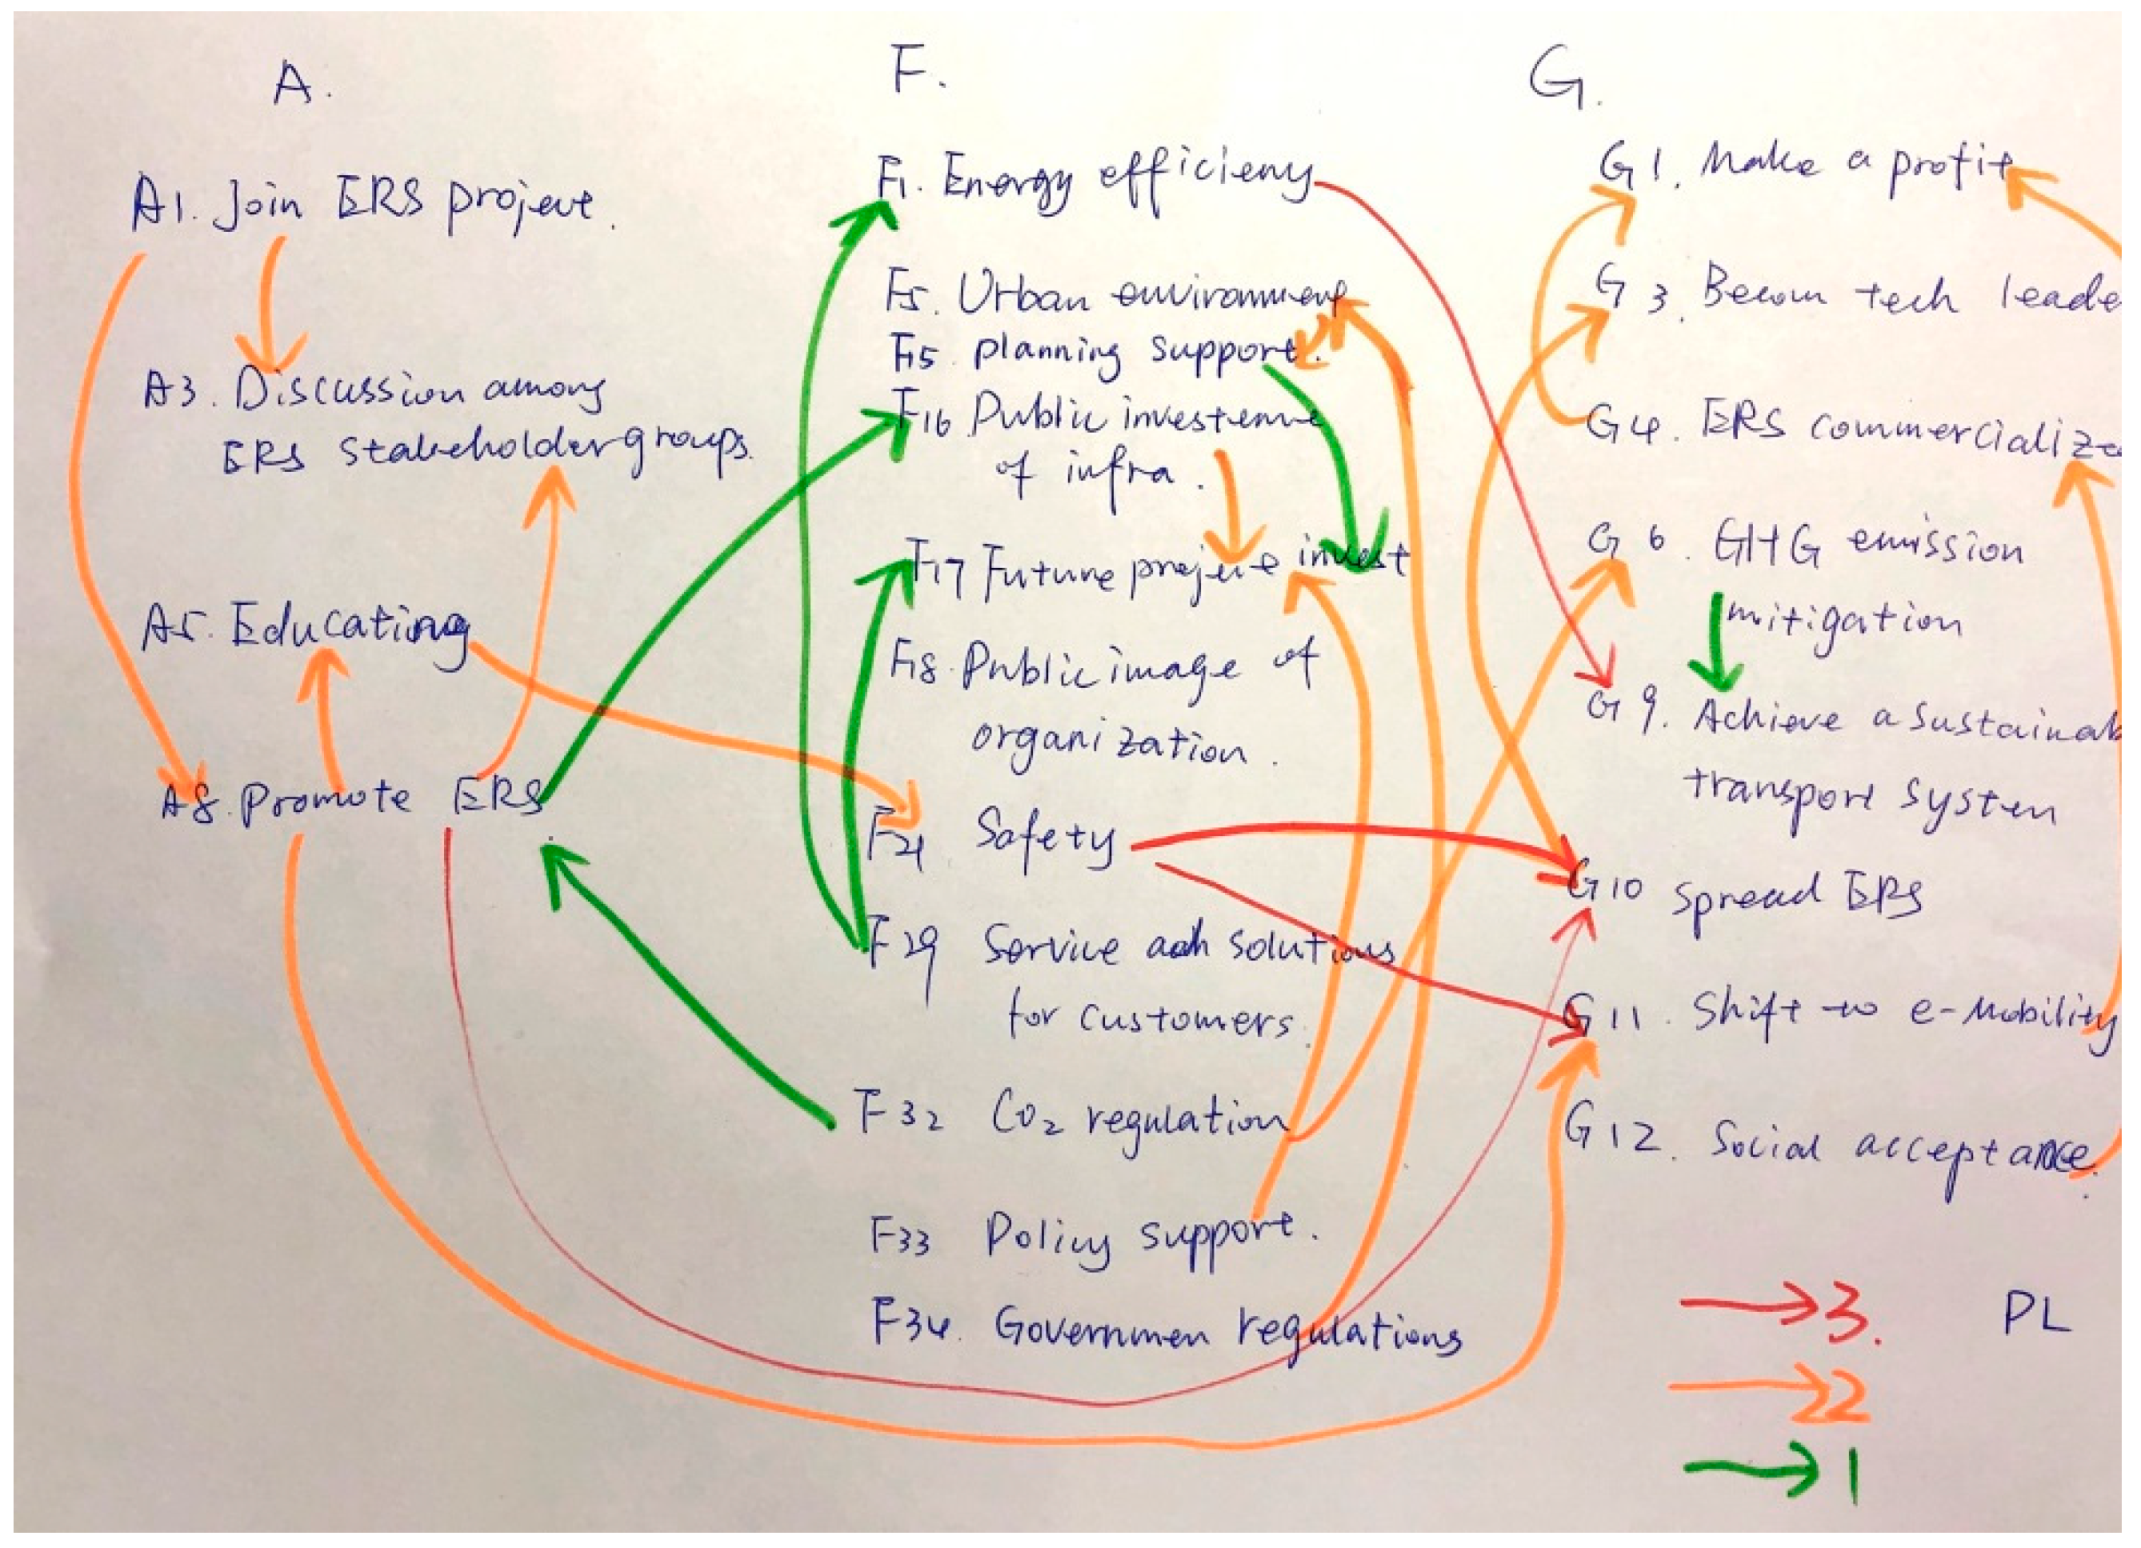
The purpose of the opening question is to allow the interviewees to feel comfortable and start sharing their opinions and concerns about the current ERS project. After the opening questions, the interviewers presented the interviewees with AFG list version 2.0 and explained to the interviewees how they could choose from or add-in more to the AFG list to describe their behaviours using actions, factors, and goals in the ERS project. Then, the interviewees were asked to use arrows to show the causal links between the actions, factors, and goals. Figure 8 shows one example of the perception diagram from the project leader, who had a holistic view of the project and the stakeholders. The results of the full interviews with different Swedish ERS project stakeholders are shown in Table A5.
The authors collected all of the stakeholders’ choices and listed them in Table A3. In the list, the action selections were composed of promoting the ERS solution (A1)–(A9) at that stage and the detailed implementation process (A10)–(A24) from different functional groups. All factor selections are detailed components of each ERS subsystem (energy and environment, road infrastructure, technology, regulation, operation, and society) or implementation and future operation processes. For the goal selections, stakeholders cared about the future business model and profit of the ERS operation, the influence of technology innovation, and the environmental effects of ERS.
4.4. Swedish ERS Project Validation Workshop
After the face-to-face information collection with twelve Swedish ERS project stakeholders from the consortium group, a workshop was held in one of the project meetings to bring all the Swedish ERS project stakeholders from the consortium group to discuss the process of the interview and to reflect on the AFG list and interview results. Eleven interviewees participated in the workshop apart from one researcher from the university who did not. This researcher was validated through a separate meeting after the validation workshop. The interview diagrams were printed out and handed to each stakeholder at the beginning of the workshop. Then, the authors introduced the interview process to all stakeholders, especially to the stakeholders who had not participated in the interview, and the author explained the diagram results to the audience. The following questions were proposed for discussion to all stakeholders during the workshop:
- Does the diagram result reflect the organisation’s current work and concerns about conducting the ERS demo project?
- How do you feel about using the AFG list to describe the stakeholders’ concerns about the ERS project?
- What did you learn from the diagram results?
Although the sample size was small and only comprised one single, national case study, the interviews covered all stakeholder groups involved in the ERS. The infrastructure company and the user groups had more than one representative in the consortium meeting. For the first question, the stakeholders either agreed with the diagrams they presented in the interviews or the interviewees explained their perception diagrams within their groups. Even so, only representatives from the infrastructure company had representatives with two different functions (project CEO and construction managers) in the project, and all participated in the interviews individually. More specifically, the diagram of the CEO was different from the construction managers’ diagram as they needed to have a holistic view of the project and consider the long-term development of the ERS project such as to involve more stakeholders and to achieve profitable growth. Construction managers were more concerned about the challenges of the facility installation and maintenance, as shown in Table A5. Two construction managers agreed with each other’s results on the factors and goals selections, while being slightly different in the action selections. The second construction manager updated the previous construction manager with two more actions: “Discussion among different ERS stakeholder groups” and “Attract more stakeholders to reduce ERS cost” to the selections. Both construction managers agreed with the causal links and the structure of their diagrams.
For the first questions proposed in the discussion, the eleven stakeholders indicated that the perception diagrams summarised their current work processes and concerns about the different aspects of ERS. Furthermore, they were interested in knowing how others described their actions, factors, and goals in the project, as shown in the printed diagrams. The AFG list should be updated according to the project process to reflect the stakeholders’ current concerns. The stakeholders found that the AFG list and the perception diagram they drew helped them to think more holistic than only focusing on individual and technological tasks, which could ease/support the ERS adoption process. Three stakeholders (technology provider and users) also mentioned that they needed the authors to help them understand the structure of the perception diagram at the beginning, and then they could start to describe their functions and concerns in the ERS project using the AFG list and the diagram. The researcher who did not participate in the validation meeting gained access to the interview results as well as was asked the same questions after the validation workshop. The researcher first scanned the diagrams and indicated the perception maps summarized the different stakeholders’ current working processes and concerns. This information from the perception map was interesting and helpful for stakeholders to obtain a holistic view of the ERS characteristic and different stakeholder concerns, especially for the researcher who did not participate in each of the project meetings.
The stakeholders’ reflections on the diagram interviews are as follows: first, the AFG list and the perception diagrams can help the stakeholders review their responsibilities and interactions with other stakeholders in the ERS project both at a general and detailed level. This review provides the chance for different stakeholders to consider not only the individual tasks in their subsystems, but also what concerns other stakeholders have from a holistic perspective. Second, it brings an innovative method for engaging stakeholders in presenting their responsibilities and perspectives in a diagram structure that can show more information.
5. Discussion of AFG List Iterations
In this section, the authors compared the three versions of the AFG list and discussed the AFG list iteration process in this case study. The authors defined five kinds of changes in order to discuss stakeholder selection patterns in the iteration process: remaining selections from previous version, newly added selections compared with a previous version (marked with underline), modified selections from a previous version (marked with a double underline), shifted selections to other group (marked with italics), and removed selections from current version (background highlighted in grey colour). The left column is version 1.0, the middle column is version 2.0, and the right column is the Swedish ERS project version. In order to compare the iteration process, the remaining and modified selections were put in the same row across different versions, for example, the action “make demand prediction” remained through version 1.0, version 2.0, and the ERS project (see Table 7).
In the action iteration process, both versions 1.0 and 2.0 had seventeen action selections, while in the ERS version, eight additional actions were added by stakeholders in the testing stage, according to their project tasks. The selection “identify market requirements” shifted and was modified to a factor selection as “customer requirements” in the Swedish ERS version. The market requirements were a broad concept, which is one of the key action stakeholders would conduct to understand the market, as discussed in the literature [56,63]. At the testing stage, stakeholders would focus more specifically on customer requirements to improve the service and solutions for potential customers. The actions “manufacture ERS lorries” and “sell ERS lorries” related to lorry manufacturing and sales were not considered by both researchers and the ERS stakeholders at this stage. The standardisation issues are crucial for the large scale implementation of ERS technology, although this was not the action that both researchers and ERS stakeholders would consider conducting at the testing stage. The standardization issues were mentioned both in the goal and factor selections by researchers and stakeholders in the following section. The action “send bill” was too specific and too early in the testing stage. The action “distribute electricity” was removed by stakeholders since this was considered as a daily action of the energy distribution company and would not influence the ERS project testing. The action “discuss among different stakeholder groups” was modified from “council meeting to discuss policy and regulations” and “committee discussion” by researchers and retained by ERS stakeholders.
In the 2.0 version, the “charging lane access control” was shifted and modified to a Swedish ERS project factor selection as “ERS lane share for non-ERS vehicles” by the local government. The reason was that the local government considered the shareability of the road infrastructure would be crucial instead of the access control being one process in future ERS operation. The action “disseminate fossil fuel energy shortage and CO2 emission disadvantage” was mentioned by researchers, then removed by ERS stakeholders. The reason was that stakeholders already realized the disadvantages of using fossil fuels and kept the goal “independent from fossil fuels”, which contributes to achieving a sustainable transportation system in the long-term. The actions “educating consumers, businesses, workplaces, dealerships and municipalities” and “attract more companies to reduce ERS cost” were added by the researchers and kept by ERS stakeholders at the testing stage. The actions “improve ERS service” and “promote ERS solution” were introduced by researchers and kept by ERS stakeholders. The action “build different charging technology” was removed in the ERS case due to the underground conductive charging that was selected for testing.
In the Swedish ERS case version, the newly added actions “develop a solution to combine technology and the business model”, “acquire knowledge of ERS”, and “participated in ERS events” showed that the ERS stakeholders were considering following the customer and market requirements to improve services, and at the same time, promote ERS solutions at different events. These actions will keep the sustainable development of ERS according to different needs. The rest of the newly added actions show the detailed operation needed in the project testing stage.
In the goal iteration process shows in Table 8, the 1.0 version and Swedish ERS case had 16 goals selected, while 2.0 version had 12. In the 1.0 version, “interoperable networks” was removed considering the duplication of “integration with the transport system”. The goals “increase OEMs profits” and “smart demand response grid system” were not directly related to ERS testing and implementation and hence were removed in the interviews. The goals “adapt new business model” and “new eco-system” were modified to “integration of ERS value chain” by researchers to achieve “ERS commercialization” and “make a profit”. The goal “become a leader in technological advancement and innovation” was added by the researcher and kept by ERS stakeholders. To become the leader in the technology innovation project was one of the main reasons for both researchers and stakeholders to participate in the project. The goal “disseminate ERS technology” was added by the stakeholders to increase the reputation of the ERS solution. The stakeholder also mentioned that it was crucial to keep the environment consistent and not influence society during the ERS testing and future implementation. The goal to reduce GHG emissions was kept through all three versions, which shows that the involved stakeholders all aimed to reduce the road freight transportation environmental influence by ERS implementation. All efforts would contribute to achieving the social acceptance of ERS, while at the same time, achieving a more sustainable transport system.
The factor selection comparison is shown in Table A4. The factors list in version 1.0 followed the order of the six subsystems mentioned in Section 3. In the 2.0 version, researchers removed vehicle demand and supply factors due to these were more related to OEM (original equipment manufacturer) production. The cost/km and tax incentive factors were also removed by researchers due to the uncertainty of the service and solution at that stage, although the cost and tax aspects are crucial in the operation stage. In the Swedish ERS project, stakeholders removed the factors related to vehicle production and grid capacity, which were considered as external factors and would not influence ERS testing. The detailed fuel and cost-related factors were removed by stakeholders while the factors for customer requirements were added. The iteration results also showed that Swedish ERS stakeholders concentrated more on the requirements for project testing compared with the researchers who were more concerned with technology development and the whole ERS related systems.
The literature and reports used to summarise the ERS characteristics to establish the AFG list in this study were published between 2010–2016 when the ERS solution was at a very early testing stage without large scale implementation in the transportation system. The data collected from test interviews with researchers and the ERS stakeholder interviews were conducted in the same year within four consecutive months. In summary, the stakeholders had more specific concerns for the requirements in the testing stage, although researchers would consider more regarding technology development and the implementation issues. The iteration process of the AFG list also reflected that the main goal of both researchers and stakeholders was to promote the ERS solution to more potential stakeholders and society, to achieve sustainable profitable growth, and long-term development of ERS as well as achieve a sustainable transportation system.
6. Conclusions
This case study demonstrates the applicability of the proposed adoption of an actor network analysis framework in a complex technology innovation project using ERS cases. The following conclusions have been drawn:
The system analysis and actor network analysis method can help set up the structure of a complex technology innovation system. As shown in Section 3 and Section 4, a systematic alignment and summary of the ERS subsystems, characteristics, and stakeholder perceptions are the initial steps for analysing a complex technology innovation system. Successful integration and implementation of a technology innovation system in society must involve a variety of stakeholders. Dealing with a multi-stakeholder project is difficult due to heterogeneous discussions and a variety of requirements among different stakeholder groups. The representation of real stakeholders’ concerns in this method is also important. From the reflections of the Swedish ERS project stakeholders, the authors observed that the diagram structure gives different stakeholders the possibility of knowing what others are considering during different processes, and it can be applied to technology innovation projects. The actor network analysis method and the AFG list can provide a systematically structured tool for summarising complex system characteristics and engaging stakeholders in describing their behaviours, concerns, and goals in the project. The AFG list resulting from the stakeholders’ selection can also be used for future strategy discussions, which describes the stakeholders’ concerns using actions, factors, and goals. This method is an easy and fast way to capture multi-stakeholder complexity in a technology innovation system and can help stakeholders shorten the technology adoption process. From the AFG list iteration, we found that the ERS stakeholders were concerned from multi aspects such as safety, service, economy, environment, and social influence, not only at the current stage, but in the long-term, which contributes to sustainable ERS development. Singh et. al discussed that different aspects influence organizations’ sustainability, which was also shown in the interview results in our study. In order to solve complex challenges, researchers could apply the system-level analysis and the actor network analysis method to clarify different aspects, map stakeholder concerns and encourage more discussion. The system-level analysis, which aims to uncover complex challenges in the ERS, in return also provides the concerns for the sustainable development of ERS.
The composition of systems, stakeholders, and AFG list can be changed according to the project’s progress and stakeholders’ focus, which could be captured by applying the actor network analysis method at a different stage in a project or by involving different stakeholders to participate. According to project phases and implementation scales, the AFG list will also be revised by different stakeholders. In this paper, AFG list version 1.0 was summarised based on the analysis of system characteristics, structure, and stakeholder groups, which was at a static point from the EU ERS project and literature. The AFG list is iterated and enlarged through the involvement with researchers and stakeholders. Goals are what people want to achieve and accomplish over a defined period. Actions are the strategies and ways that people adopt now to achieve their goals. Goals are more stable as stakeholders are used to having long-term goals to achieve compared to actions that depend on the individual role. Factors are the concerns or requitals that stakeholders have when they participate in a project. The factors are stabilized due to the requites s and concerns, depending on the technology innovations, which take long times. From the comparison of researchers and ERS stakeholders involved in the interviews, the authors found that both the researchers and stakeholders would eliminate the external aspects or undefined aspects. The differences were that researchers would focus more on the technology development and the ERS eco-system impact while stakeholders considered more about the practical implementation and the social influence at a specific project stage. These patterns can be considered by researchers or stakeholders for the future implementation of the method. Furthermore, the size of the stakeholder groups and the complexity also depend on the scale of the scenarios and the phases of the project. The bigger the arrangement of the implementation scale, the more complex the stakeholder groups will be. Within one project, the number of stakeholders and subsystems will also accumulate as the project develops. By applying the actor network analysis method, the iterations of the technology project can be captured for sustainable ERS development, and the analysis will help to shorten the technology adoption process.
The challenges faced by a complex technology innovation project are related to not only technology research and development challenges, but also stakeholder acceptance social feasibility challenges along the whole lifecycle. This study adopted the actor network analysis method to a technology innovation complex system using ERS projects as the case study to uncover the complexity of ERS from a stakeholder point of view. The AFG list was established based on the system-level analysis of the EU ERS project, then validated in the Swedish ERS project. This study facilitates a summarized process of how to select and define stakeholders as well as the system AFG list in a complex technology innovation project. The interview results from the adoption of an actor network analysis method were validated through the ERS workshop. From the stakeholders’ reflections, the authors found that this method could give potential ERS stakeholders a holistic view to describe how they react when they are involved in an ERS project.
For an ERS project, it is difficult to set system boundaries in the initial stage due to the uncertainty of future ERS business models, operational models, relevant regulations, system interoperability, social acceptance, potential stakeholders, and more. As mentioned in the introduction, conductive ERS for trucks has lower GHG emissions and life-cycle cost when compared with diesel trucks. The implementation of ERS will contribute to achieving the CO2 reduction goals and in the long-term, in achieving a sustainable transportation system. Although ERS implementation is still at an early stage, understanding the system characteristics and structure is a good start to assist and shorten future ERS implementation processes. The novelty of this study was the adoption of an actor network analysis method to a complex technology innovation project. This study also showed that stakeholders were highly involved in the ERS project from diverse aspects. The participation and accumulated involvement of stakeholders will increase social acceptance and bring more collaboration to achieve a sustainable transportation solution.
There are several limitations to the study. First, the selection of the theories conducted by the authors might not be sufficiently comprehensive. Considering the multi-stakeholder complex challenges ERS faces, the combination of system engineering, stakeholder theory, and actor network analysis interdisciplinary implementation is necessary. An updated literature review would help to accumulate the search range and involve more literature to overcome the limitation of interdisciplinary publications. Second, although all stakeholders from the ERS project at the testing stage participated in the interviews, the sample was a bit small, which influenced the result of the AFG list selection. Involving more stakeholders in this process would enrich the dataset and reduce the influence of a single opinion.
In the next step, the authors will study the relation of the subsystem structure setup and the AFG selection results to uncover what aspects stakeholders are concerned with the most. One of the challenges that ERS is facing is that the composition of stakeholders changes when ERS is being implemented in the real world. Thus, the stakeholder analysis will help to align and find ERS potential stakeholders. Currently, involved ERS stakeholders are mainly from the consortium group in the inaugural stage, but still with a different level of interest, power, and knowledge. The analysis based on stakeholders’ perceptions cannot fully avoid cognitive differences, but could arouse discussions among ERS stakeholders, which encourages the sharing of opinions to reach consensus.
Author Contributions
Formatting this research article, conceptualization, Q.W. and S.M.; Methodology, Q.W., S.M. and J.B.H.; Interviews, Q.W.; Validation, Q.W.; Writing—original draft preparation, Q.W., S.M. and J.B.H.; Writing—review and editing, S.M. and J.B.H.; Supervision, S.M. and J.B.H. All authors have read and agreed to the published version of the manuscript.
Funding
Qiuchen Wang was funded by the CSC scholars funding; and Sebastiaan Meijer and Jannicke Baalsrud Hauge were funded by the EU FP7 FABRIC project, grant number 605405.
Acknowledgments
The authors would like to thank all of the experts and stakeholders involved in the Swedish ERS project for their invaluable insights and support throughout the research. We would like to thank anonymous reviewers for their helpful and detailed comments.
Conflicts of Interest
The authors declare no conflicts of interest.
Abbreviations
| ERS | Electric road system |
| FABRIC | The EU’s 7th framework project, which studies the technological feasibility, economic viability, and social-environmental sustainability of on-road charging technology, namely FABRIC |
| DANA | Dynamic actor network analysis method |
| AFG list | The action, factor, and goal list |
Appendix A

Table A1.
AFG list version 1.0.
| No. | Factors | Action | Goal | |
|---|---|---|---|---|
| Definition | ||||
| 1 | New business model | A new business model is needed for the automobile industry, the energy industry, and ERS service providers. | Identify market needs | Adapt the new business model |
| 2 | New job opportunities | A new market could introduce new job opportunities, especially in this multidisciplinary subject. | ||
| 3 | ERS vehicle demand | ERS demand and supply will influence ERS vehicle sales and ERS vehicle prices. | Manufacture ERS lorries | Adapt new eco-system |
| 4 | ERS vehicle supply | ERS demand and supply with influence ERS vehicle prices in the market. | Sell ERS lorries | Collaboration within the e-Mobility Value Chain |
| 5 | ERS vehicle price | Determined by demand, supply curve and market needs. | Make a profit | Increase OEMS profits |
| 6 | Resources price of ERS vehicle components | The raw material used in the ERS lorry production process. Resource prices will influence the final price of an ERS lorry. | ||
| 7 | Charging technology | Influences installation problems and cost, as well as user acceptance | Shift to e-Mobility | |
| 8 | Technology integrability | Cross-technology standardisation needs to be considered in ERS. | Propose draft standardisation | Disseminate ERS technology |
| 9 | ERS technology maturity | Will influence the standardisation process. | ||
| 10 | Fossil fuel energy | Fossil fuel energy is non-renewable energy and has more CO2 emissions than renewable energy. | Interoperable networks | |
| 11 | Renewable energy | It does not cause harm and has a minimal environmental impact. | GHG emission mitigation | |
| 12 | Fuel cost | High for fossil fuels and biomass sources; low for nuclear energy; zero for many renewables. Fuel costs can vary unpredictably over the life of the generating equipment due to political and other factors. | ||
| 13 | Electricity price | On the supply side, electricity prices are heavily influenced by fuel prices—for coal, gas, and oil—and the price of CO2 allowance. Electricity prices are usually highest for residential and commercial consumers because it costs more to distribute electricity to them. Industrial consumers use more electricity and can receive it at higher voltages, so it is more efficient and cost-effective to supply electricity to these customers. In some countries, prices are fully regulated by public service commissions, while other countries use a combination of unregulated prices (for generators) and regulated prices (for transmission and distribution). | Sell electricity | Consumer acceptance |
| 14 | Electricity demand | Rate of planed electricity consumption. ERS implementation will increase the demand for road electricity. | Generate electricity according to demand | Smart demand response grid system |
| 15 | Electricity supply | Rate of electricity from the grid. | Distribute electricity | |
| 16 | Peak load | The use of ERS might increase the peak load in the road system. | Make a demand prediction | |
| 17 | Grid capacity | Power flow will be influenced by the increase in electricity demand. This refers to the capacity of distribution system infrastructure. | ||
| 18 | GHG emissions | Greenhouse gas emissions might change according to the energy resource used to produce electricity. Some countries might have different regulations regarding CO2 allowance. | Stable electricity networks | |
| 19 | ERS road capacity | ERS road capacity must focus on ERS drivers. If ERS is an open system (wireless dynamic charging), other vehicle occupancy also needs to be considered. | ||
| 20 | Public infrastructure investment | Related to charging technology, material costs, labour costs and ERS range. | ||
| 21 | Installation requirements | It depends on charging technology, existing facility and topographical requirements. | ||
| 22 | Labour cost | Vary in different countries. | ||
| 23 | Material cost | It depends on ERS location and charging technology. | ||
| 24 | Maintenance requirements | It depends on ERS usage, charging technology, etc. | ||
| 25 | Existing facility | Influences the installation problems and infra investment. | Maintain ERS road | |
| 26 | Topography requirement | The topographical requirements depend on the specific charging technology and the implementation scenarios. | ||
| 27 | ERS infrastructure reliability | Influenced by weather, traffic condition, etc. ERS drivers prefer a more reliable infrastructure. | Infrastructure utility | |
| 28 | Weather conditions for infrastructure | Rain and snow can provide water for low-cost hydropower generation. Extreme temperatures can increase the demand for electricity, especially for cooling. Severe weather can also damage power lines and increase the cost of maintaining the electricity grid. | ||
| 29 | Future project investment | The future investment could depend on the initial investment and the profit made by ERS. | ||
| 30 | Sales tax exemptions /corporate subsidies | Municipalities may offer exemption from local option sales tax on construction materials or new machinery and equipment for new projects. | ||
| 31 | Government regulations | Other regulations according to the use of ERS, noise level, etc. | Committee discussion | Technology standardisation |
| 32 | CO2 regulations | Need for concerns regarding the regulations of each city. | Approve draft | Achieve a sustainable transport system |
| 33 | Policy support | This will help drive ERS development and social acceptance, such as a tax incentive programme. | Council meeting to discuss policy and regulations | |
| 34 | Tax incentive programs | One of the policies supports from the government. Incentives vary from one country or region to the next, depending on tax structure, cost of living, economy and other factors. This would help the automobile industry shift to a new market. | ||
| 35 | Inventory tax exemption | The government provides tax exemption so that the facility’s inventory is not taxed within a specified time frame. | Increase e-Mobility benefits | |
| 36 | User tax exemption | The government provides tax exemption so that the facility’s inventory is not taxed within a certain defined time frame. | Send bill | |
| 37 | Traffic flow | The road authority must collect traffic flow information and forward it to a traffic control centre. All traffic flow on the road system should be included. | Efficient transport system | |
| 38 | Traffic information | The traffic control centre will forward traffic information to road operators and the information will then be analysed and forwarded to a service provider and all drivers. | Recommend route information to lorry drivers | Integration with the transport system |
| 39 | ERS lorry driving route | The road operator will recommend the ERS route to ERS lorry drivers. | ||
| 40 | Travel route priority | ERS lorry drivers will have priority over other vehicles to use a specific ERS route. (if the charging technology is wireless dynamic charging). | Charging lane access control | |
| 41 | ERS lorry flow | The amount of on-road lorry charging will affect electricity demand. | ||
| 42 | Travel distance on ERS road | From origin to destination—how long the lorry has travelled on an ERS road. | Distribute goods | |
| 43 | Cost/km | Average total cost (all service fees) for ERS per km. | ||
| 44 | Charging time | How long an ERS lorry charges on an ERS road will depend on the charging technology. | ||
| 45 | Charging road range | Influences the choice of travel route and driver’s acceptance. | ||
| 46 | ERS driving distance | Influences the number of lorries using an ERS road. | ||
| 47 | Driving preference | Influences driver acceptance of ERS. | ||
| 48 | Priority route service | ERS lorry drivers will have priority over other vehicles to use a specific ERS route. (if the charging technology is wireless dynamic charging). | ||
| 49 | Safety | Influences the acceptance of ERS. | ||
| 50 | EMF pollution | Must be keeping under set limits in order to provide a safe environment. | ||
Table A2.
AFG list version 2.0.
| Action | Factors | Goal | |||||
|---|---|---|---|---|---|---|---|
| A1 | Spread fossil fuel energy shortage and disadvantage of CO2 emissions | F1 | New job opportunities | F21 | ERS technology maturity | G1 | Technology standardisation |
| A2 | Establish standards | F2 | Tax incentive | F22 | Government regulations | G2 | Integration of ERS value chain |
| A3 | Discussion among different stakeholder groups | F3 | New business model | F23 | CO2 regulation | G3 | Social acceptance |
| A4 | Educating consumers, businesses, workplaces, dealerships and municipalities | F4 | ERS lorry demand | F24 | Policy support | G4 | Collaboration within the e-Mobility value chain |
| A5 | Attract more companies to ERS | F5 | ERS lorry supply | F25 | Public infrastructure investment | G5 | Shift to e-Mobility |
| A6 | Improve the ERS service | F6 | Resources price of ERS vehicle components | F26 | Installation difficulties | G6 | GHG emission mitigation |
| A7 | Promote ERS solution | F7 | Sales tax exemptions /corporate subsidies | F27 | Charging technology | G7 | Independent on fossil fuels |
| A8 | Charging lane access control | F8 | Fossil fuel energy | F28 | Labour cost | G8 | Achieve a sustainable transport system |
| A9 | Build a different charging solution | F9 | Renewable Energy | F29 | Material cost | G9 | Efficient transport system |
| A10 | Sell the ERS service | F10 | Nuclear energy | F30 | Maintenance requirements | G10 | Interoperable transportation network |
| A11 | Buy the ERS service | F11 | Fuel cost | F31 | Existing facility | G11 | Become a leader in technological advancement and innovation |
| A12 | Sell electricity | F12 | Electricity price | F32 | Topography requirement | G12 | Stable electricity networks |
| A13 | Make a demand prediction | F13 | Electricity demand | F33 | Future project investment | Goal list end | |
| A14 | ERS road maintenance | F14 | Electricity supply | F34 | EMF pollution | F41 | ERS service demand |
| A15 | Generate electricity according to demand | F15 | Peak load | F35 | Traffic flow | F42 | ERS vehicle price |
| A16 | Distribute electricity | F16 | Grid capacity | F36 | Traffic information | F43 | Travel distance on ERS road |
| A17 | Recommend route information to vehicle drivers | F17 | Peak load | F37 | ERS lorry driving route | F44 | Charging time |
| Action list end | F18 | Urban environment | F38 | Travel route priority | F45 | Charging road range | |
| F19 | Energy efficiency | F39 | Weather conditions | F46 | Charging infra reliability | ||
| F48 | CO2 emission from ERS whole process | F20 | The public image of your organisation | F40 | ERS road capacity | F47 | Travel range capability |
Note: the dark grey is to notify the end of the version 1.0 and 2.0.
Table A3.
Swedish ERS project AFG list.
| Actions | Factors | Goals | |||||
|---|---|---|---|---|---|---|---|
| A1 | Join the ERS project | F1 | Energy efficiency | F18 | Future project investment | G1 | Make a profit |
| A2 | Learn knowledge related to ERS (reading and writing reports) | F2 | Renewable energy | F19 | The public image of your organisation | G2 | Have greater opportunities to discuss ERS topics |
| A3 | Crosstalk among different ERS stakeholder groups | F3 | Fossil fuel energy | F20 | Social influence | G3 | Become a leader in technological advancement and innovation |
| A4 | Participate in ERS events (conferences and seminars) | F4 | GHG emission | F21 | EMF pollution | G4 | ERS commercialisation |
| A5 | Educating consumers, businesses, workplaces, dealerships and municipalities | F5 | Urban environment | F22 | Safety | G5 | Environmental consistency |
| A6 | Attract more companies to reduce ERS cost | F6 | ERS infrastructure reliability | F23 | Attractiveness to companies and citizens | G6 | GHG emission mitigation |
| A7 | Improve the ERS service | F7 | ERS technology maturity | F24 | Customer requirements | G7 | Stable electricity networks |
| A8 | Promote ERS solution | F8 | Weather conditions for infrastructure | F25 | Traffic flow | G8 | Integration with the transport system |
| A9 | Organise ERS events | F9 | ERS vehicle capacity (logistics) | F26 | Charging time | G9 | Achieve a sustainable transport system |
| A10 | Develop a solution to combine technology and the business model | F10 | Installation requirements | F27 | ERS Driving distance | G10 | Disseminate ERS technology |
| A11 | Coordinate the project | F11 | Maintenance requirements | F28 | Driving experience | G11 | Shift to e-Mobility |
| A12 | Calculate timetable | F12 | Topographical requirements | F29 | ERS lane share for non-ERS vehicles | G12 | Social acceptance |
| A13 | Sell electricity | F13 | Knowledge of construction and maintenance | F30 | Services and solutions for customers | G13 | Determine system performance |
| A14 | Make a demand prediction | F14 | Standardisation (Infra or vehicle) | F31 | New business model | G14 | Green transport service provider |
| A15 | Build a test road | F15 | Regional planning | F32 | New job opportunities | G15 | Become transportation centre |
| A16 | Remove a test road | F16 | Public infrastructure investment | F33 | CO2 regulations | G16 | Independent from fossil fuels |
| A17 | Plan and order special equipment | F17 | Logistics park planning | F34 | Policy support | ||
| A18 | Allocate installation resources | Factor list end | Goals list end | ||||
| A19 | Transport goods | A21 | Logistics activity planning and cluster | A23 | Test and approve vehicle | A25 | Test maintenance solution |
| A20 | Set up test criteria | A22 | Cooperate with different stakeholder | A24 | Develop technology | ||
Note: the dark grey is to notify the end of the version 1.0 and 2.0.
Table A4.
Factor list comparison.
| Version 1.0 | Version 2.0 | Swedish ERS Project |
|---|---|---|
| ERS technology maturity | ERS technology maturity | ERS technology maturity |
| New job opportunities | New job opportunities | New job opportunities |
| New business model | New business model | New business model |
| GHG emission | GHG emission | GHG emission |
| Charging time | Charging time | Charging time |
| Traffic flow | Traffic flow | Traffic flow |
| ERS driving distance | ERS driving distance | ERS driving distance |
| Fossil fuel energy | Fossil fuel energy | Fossil fuel energy |
| Public infrastructure investment | Public infrastructure investment | Public infrastructure investment |
| Topography requirement | Topography requirement | Topography requirement |
| Installation requirements | Installation requirements | Installation requirements |
| Weather conditions for infrastructure | Weather conditions for infrastructure | Weather conditions for infrastructure |
| Future project investment | Future project investment | Future project investment |
| Maintenance requirements | Maintenance requirements | Maintenance requirements |
| CO2 regulation | CO2 regulation | CO2 regulation |
| Policy support | Policy support | Policy support |
| ERS infrastructure reliability | ERS infrastructure reliability | ERS infrastructure reliability |
| ERS vehicle demand | The public image of your organisation | The public image of your organisation |
| ERS vehicle supply | Energy efficiency | Energy efficiency |
| Safety | Urban environment | Safety |
| ERS vehicle price | ERS vehicle price | Urban environment |
| Resources price of ERS vehicle components | Resources price of ERS vehicle components | Standardization (Infra or vehicle) |
| Charging technology | Charging technology | ERS lane share for non-ERS vehicles |
| Renewable energy | Renewable Energy | Renewable Energy |
| Fuel cost | Nuclear energy | Planning support |
| Electricity price | Fuel cost | Attractiveness to companies and citizens |
| Electricity demand | Electricity price | Logistics park planning |
| Electricity supply | Electricity demand | Social influence |
| Peak load | Electricity supply | Services and solutions for customers |
| Grid capacity | Peak load | Customer requirements |
| ERS road capacity | Grid capacity | Driving experience |
| Labour cost | ERS road capacity | Knowledge of construction and maintenance |
| Material cost | Labour cost | ERS vehicle capacity (logistics) |
| Existing facility | Material cost | EMF pollution |
| Government regulations | Existing facility | |
| Sales tax exemptions/corporate subsidies | Government regulations | |
| Traffic information | Sales tax exemptions /corporate subsidies | |
| ERS lorry driving route | Traffic information | |
| Travel route priority | ERS lorry driving route | |
| Travel range capability | Travel route priority | |
| Cost/km | Travel road capability | |
| Charging road range | Charging road range | |
| EMF pollution | EMF pollution | |
| Priority route service | Charging time | |
| Technology integrability | ERS service demand | |
| Tax incentive program | CO2 emission from ERS whole process | |
| Inventory tax exemption | Material cost | |
| User tax exemption | Labour cost | |
| ERS lorry flow | ||
| Driving preference |
Table A5.
Swedish ERS project stakeholder interview diagrams.
| No. | Stakeholder Groups | Perception Diagrams |
|---|---|---|
| 1 | Operator |  |
| 2 | Authority and Government |  |
| 3 | Electricity supplier | 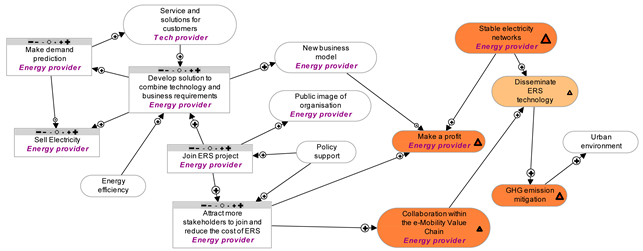 |
| 4 | Technology suppliers | 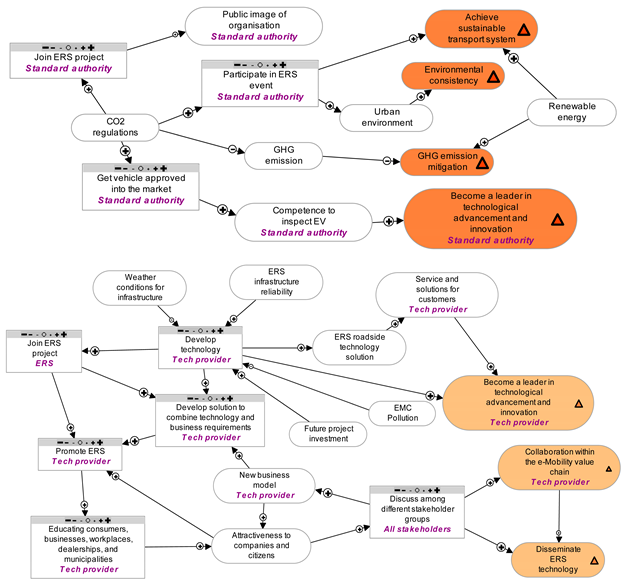 |
| 5 | Road Infrastructure supplier | 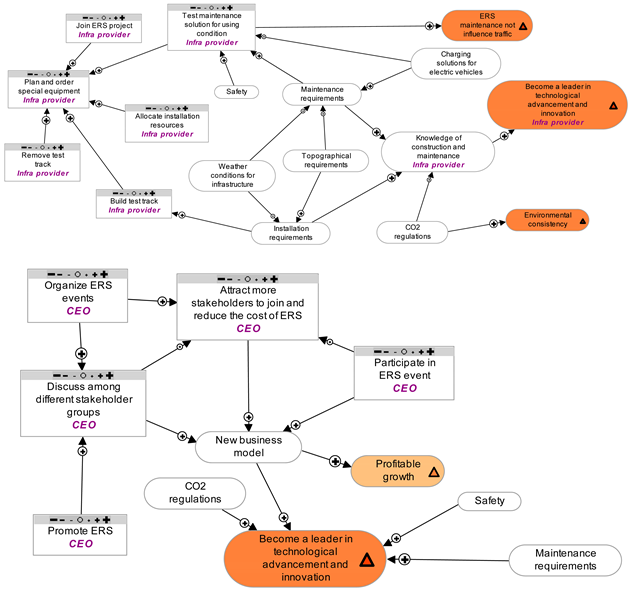 |
| 6 | ERS user | 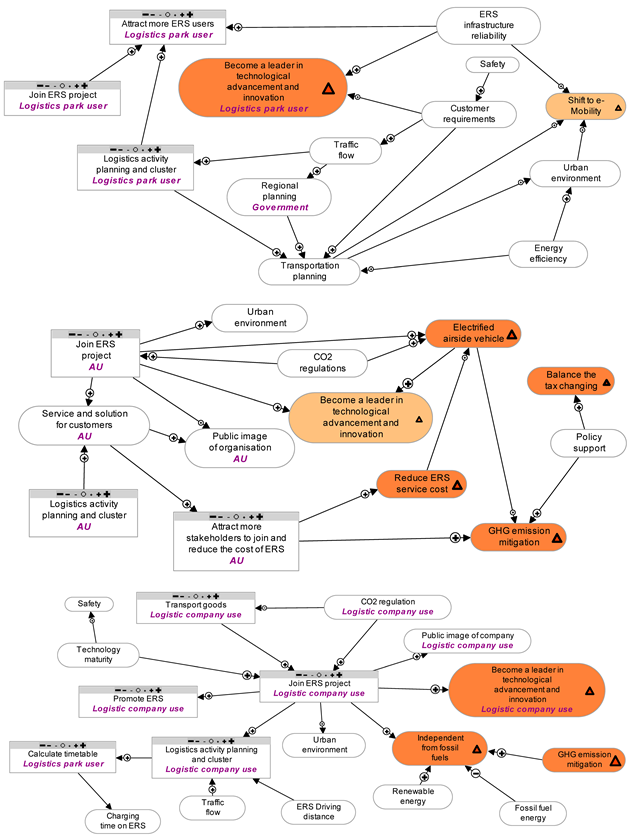 |
| Researcher |  |
References
- Axelsson, S. Fossil Free Sweden Initiative. 4176BC. Available online: http://fossilfritt-sverige.se/in-english/ (accessed on 18 April 2019).
- Ioannides, D.; Wall-Reinius, S. Sustainable Mobility in the Periphery: Are Electric Vehicles the Answer? Review of International Literature on Electric Vehicles and Ideas for Further Research; ETOUR: Stockholm, Sweden, 2015. [Google Scholar]
- Bludszuweit, H.; Spessa, E.; Venditti, M.; de Blas, J.; Papadimitratos, P. Report on Effect of up Scaling to Vehicle Fleet and Energy Grids; FABRIC: Athens, Greece, 2018. [Google Scholar]
- Zackrisson, M.; Jönsson, C.; Johannisson, W.; Fransson, K.; Posner, S.; Zenkert, D.; Lindbergh, G. Prospective Life Cycle Assessment of a Structural Battery. Sustainability 2019, 11, 5679. [Google Scholar] [CrossRef] [Green Version]
- Tongur, S. The Electric Road System. In Proceedings of the 2016 Asian Conference on Energy, Power and Transportation Electrification (ACEPT), Marina Bay Sands, Singapore, 25–27 October 2016; pp. 1–8. [Google Scholar]
- Mareev, I.; Sauer, D. Energy Consumption and Life Cycle Costs of Overhead Catenary Heavy-Duty Trucks for Long-Haul Transportation. Energies 2018, 11, 3446. [Google Scholar] [CrossRef] [Green Version]
- Singh, A.; Sushil; Kar, S.; Pamucar, D. Stakeholder Role for Developing a Conceptual Framework of Sustainability in Organization. Sustainability 2019, 11, 208. [Google Scholar] [CrossRef] [Green Version]
- Snyder, H. Literature review as a research methodology: An overview and guidelines. J. Bus. Res. 2019, 104, 333–339. [Google Scholar] [CrossRef]
- Cameron, B.G.; Seher, T.; Crawley, E.F. Goals for space exploration based on stakeholder value network considerations. Acta Astronaut. 2011, 68, 2088–2097. [Google Scholar] [CrossRef]
- Paddeu, D.; Parkhurst, G.; Fancello, G.; Fadda, P.; Ricci, M. Multi-stakeholder collaboration in urban freight consolidation schemes: Drivers and barriers to implementation. Transport 2018, 33, 913–929. [Google Scholar] [CrossRef] [Green Version]
- Xue, M.; Wu, H.; Chen, W.; Ng, W.S.; Goh, G.H. Identifying tourists from public transport commuters. In Proceedings of the ACM SIGKDD International Conference on Knowledge Discovery and Data Mining; Association for Computing Machinery, New York, NY, USA, 24–27 August 2014; pp. 1779–1788. [Google Scholar]
- Tompson, T.; Tomitsch, M. Understanding public transport design constraints by using mock-ups in stakeholder conversations. ACM Int. Conf. Proc. Ser. 2014, 2, 53–56. [Google Scholar]
- Moellenkamp, S.; Lamers, M.; Huesmann, C.; Rotter, S.; Pahl-Wostl, C.; Speil, K.; Pohl, W. Informal participatory platforms for adaptive management. Insights into niche-finding, collaborative design and outcomes from a participatory process in the Rhine basin. Ecol. Soc. 2010, 15, 41. [Google Scholar] [CrossRef] [Green Version]
- Neisser, F.M. “Riskscapes” and risk management-Review and synthesis of an actor-network theory approach Author(s). Source Risk Manag. 2014, 16, 88–120. [Google Scholar] [CrossRef]
- Hermans, L.M. Exploring the promise of actor analysis for environmental policy analysis: Lessons from four cases in water resources management. Ecol. Soc. 2008, 13, 13. [Google Scholar] [CrossRef] [Green Version]
- Arnold, R.D.; Wade, J.P. A definition of systems thinking: A systems approach. Procedia Comput. Sci. 2015, 44, 669–678. [Google Scholar] [CrossRef] [Green Version]
- Moser, H.A. Systems Engineering, Systems Thinking, and Learning: A Case Study in Space Industry; Springer: Berlin/Heidelberg, Germany, 2014. [Google Scholar]
- Buckle, P. Maturity Models for Systems Thinking. Systems 2018, 6, 23. [Google Scholar] [CrossRef] [Green Version]
- Fabrycky, W.J. Systems analysis: Its proper utilization within systems engineering education and practice. In Proceedings of the 122nd ASEE Annual Conference and Exposition, Seattle, WA, USA, 14–17 June 2015. [Google Scholar]
- Warth, J.; Von der Gracht, H.A.; Darkow, I.L. A dissent-based approach for multi-stakeholder scenario development—The future of electric drive vehicles. Technol. Forecast. Soc. Chang. 2013, 80, 566–583. [Google Scholar] [CrossRef]
- Jiang, R.; Kleer, R.; Piller, F.T. Predicting the future of additive manufacturing: A Delphi study on economic and societal implications of 3D printing for 2030. Technol. Forecast. Soc. Chang. 2017, 117, 84–97. [Google Scholar] [CrossRef]
- Song, J.; Sun, Y.; Jin, L. PESTEL analysis of the development of the waste-to-energy incineration industry in China. Renew. Sustain. Energy Rev. 2017, 80, 276–289. [Google Scholar] [CrossRef]
- Yüksel, I. Developing a Multi-Criteria Decision Making Model for PESTEL Analysis. Int. J. Bus. Manag. 2012, 7, 52–66. [Google Scholar] [CrossRef] [Green Version]
- James, M.P. Applying a System of Systems Approach for Improved Transportation. 2010. Available online: http://Journals.Openedition.Org/Sapiens (accessed on 18 April 2019).
- Axelsson, J.; Mats Lundin, M.; Löfstrand, S.; Ceder, U.; Svensk, P.-O. Systems-of-Systems for Smart Urban Mobility (SoSSUM); FFI: Stockholm, Sweden, 2017. [Google Scholar]
- Morales, M.; Diemer, A.; Morales, M.E.; Diemer, A. Industrial Symbiosis Dynamics, a Strategy to Accomplish Complex Analysis: The Dunkirk Case Study. Sustainability 2019, 11, 1971. [Google Scholar] [CrossRef] [Green Version]
- Torma, A.; Hatwágner, M.F.; Susniene, D.; Žostautiene, D.; Kóczy, L.T. Simulation of Causal Relations of Stakeholder Management System by Using Fuzzy Cognitive Map Approach—A Comparison of Hungarian and Lithuanian Attitudes. Procedia Comput. Sci. 2015, 65, 880–890. [Google Scholar] [CrossRef] [Green Version]
- Chinyio, E.A.; Akintoye, A. Practical approaches for engaging stakeholders: Findings from the UK. Constr. Manag. Econ. 2008, 26, 591–599. [Google Scholar] [CrossRef]
- Kardes, I.; Ozturk, A.; Cavusgil, S.T.; Cavusgil, E. Managing Global Megaprojects: Complexity and Risk Management. Int. Bus. Rev. 2013, 22, 905–917. [Google Scholar] [CrossRef]
- Freeman, R.E. Strategic Management: A stakeholder Approach; Cambridge University Press: Cambridge, UK, 1984; ISBN 0521151740. [Google Scholar]
- Varatharaju, V.M.; Mathur, B.L.; Udhayakumar, K. Current Regulated PWM Based Control for Four-Switch Three-Phase Brushless DC Motor Drives; IEEE: Bengaluru, India, 2011; Volume 6, pp. 1620–1626. [Google Scholar]
- Bots, P.W.G. Analyzing Actor Networks while Assuming “Frame Rationality”. In Proceedings of the Networks in Political Science (NIPS), Cambridge, MA, USA, 13–14 June 2008; pp. 1–18. [Google Scholar]
- Hermans, L.M.; Thissen, W.A.H. Actor analysis methods and their use for public policy analysts. Eur. J. Oper. Res. 2009, 196, 808–818. [Google Scholar] [CrossRef]
- Castelein, B.; van Duin, R.; Geerlings, H. Identifying dominant stakeholder perspectives on sustainability issues in reefer transportation. A Q-method study in the Port of Rotterdam. Sustainability 2019, 11, 3425. [Google Scholar] [CrossRef] [Green Version]
- Cascetta, E.; Pagliara, F. Public Engagement for Planning and Designing Transportation Systems. Procedia Soc. Behav. Sci. 2013, 87, 103–116. [Google Scholar] [CrossRef] [Green Version]
- Cascetta, E.; Cartenì, A.; Pagliara, F.; Montanino, M. A new look at planning and designing transportation systems: A decision-making model based on cognitive rationality, stakeholder engagement and quantitative methods. Transp. Policy 2015, 38, 27–39. [Google Scholar] [CrossRef]
- Cascetta, E.; Pagliara, F. Integrated railways-based policies: The Regional Metro System (RMS) project of Naples and Campania. Transp. Policy 2008, 15, 81–93. [Google Scholar] [CrossRef]
- Polydoropoulou, A.; Pagoni, I.; Tsirimpa, A. Ready for Mobility as a Service? Insights from stakeholders and end-users. Travel Behav. Soc. 2018. [Google Scholar] [CrossRef]
- Pettigrew, S.; Cronin, S.L. Stakeholder views on the social issues relating to the introduction of autonomous vehicles. Transp. Policy 2019, 81, 64–67. [Google Scholar] [CrossRef]
- Grützner, F.; Deakin, J.; Rens, W.; El-Mogharbel, N.; Marshall Graves, J.A. The Monotreme Genome: A Patchwork of Reptile, Mammal and Unique Features? CBPA 2003, 136, 867–881. [Google Scholar] [CrossRef]
- Tu, J.-C.; Yang, C. Key Factors Influencing Consumers’ Purchase of Electric Vehicles. Sustainability 2019, 11, 3863. [Google Scholar] [CrossRef] [Green Version]
- Hermans, L.M. Actor Analysis for Water Resources Management—Putting the Promise into Practice. Ph.D. Thesis, University of Delft of Technology, Delft, The Netherlands, 2005. [Google Scholar]
- Hermans, L.M.; Cunningham, S.W. Actor models for policy analysis. In International Series in Operations Research and Management Science; Springer: Berlin, Germany, 2013; Volume 179, pp. 185–213. ISBN 978-1-4614-4601-9. [Google Scholar]
- Chen, F.; Taylor, N.; Kringos, N. Electrification of roads: Opportunities and challenges. Appl. Energy 2015, 150, 109–119. [Google Scholar] [CrossRef]
- Brunton, L.J. Why Not the Trolleybus? 2000. Available online: https://digital-library.theiet.org/content/conferences/10.1049/ic_20000265 (accessed on 18 April 2019).
- Electric Road Systems—Zero Emissions. Stops Oil Dependency. Gamechanging Economy. 2008. Available online: https://elvag.se/en/hem.html (accessed on 18 April 2019).
- Viktoria Swedish ICT; KTH; Lund University; Scania CV; Volvo GTT; Alstom; Svenska Elvägar. Slide-in Electric Road System; Rise: Gothenburg, Sweden, 2013. [Google Scholar]
- Andersson, S.; Edfeldt, S. Electric Road Systems for Trucks; KTH School of Industrial Engineering and Management: Stockholm, Sweden, 2013. [Google Scholar]
- Whitlock, R. Wireless Energy Transfer Strips for Electric Vehicles and Buses. 2016. Available online: https://interestingengineering.com/wireless-energy-transfer-strips-for-electric-vehicles-and-buses (accessed on 18 April 2019).
- World’s First Electrified Public Road Opens in Sweden. 2018. Available online: https://www.thelocal.se/20180413/worlds-first-electric-road-opens-in-sweden (accessed on 18 April 2019).
- Yoon, L. KAIST’s Wireless Online Electric Vehicle, OLEV, Runs Inner City Roads. 2013. Available online: https://www.eurekalert.org/pub_releases/2013-08/tkai-kwo080513.php (accessed on 18 April 2019).
- Roether, J. First Electric Highway in U.S. Unveiled Near Ports of L.A. and Long Beach. Available online: https://energized.edison.com/stories/first-electric-highway-in-u-s-unveiled-near-ports-of-l-a-and-long-beach (accessed on 18 April 2019).
- The World’s First Electric Road on the E16. 2015. Available online: https://www.regiongavleborg.se/regional-utveckling/samhallsplanering-och-infrastruktur/elvag/ (accessed on 18 April 2019).
- The Technology—eRoadArlanda. Available online: http://eroadarlanda.com/the-technology/ (accessed on 18 April 2019).
- FABRIC Project. Available online: https://www.fabric-project.eu/index.php?option=com_k2&view=itemlist&layout=category&task=category&id=14&Itemid=204%0Ahttp://www.fabric-project.eu/ (accessed on 18 April 2019).
- Tongur, S.; Engwall, M. The business model dilemma of technology shifts. Technovation 2014, 34, 525–535. [Google Scholar] [CrossRef]
- Sundelin, H.; Gustavsson, M.G.H.; Tongur, S. The maturity of electric road systems. In Proceedings of the 2016 International Conference on Electrical Systems for Aircraft, Railway, Ship Propulsion and Road Vehicles and International Transportation Electrification Conference (ESARS-ITEC 2016), Toulouse, France, 2–4 November 2016. [Google Scholar]
- South Korea Tests “Electric Road” for Public Buses. Available online: https://www.straitstimes.com/asia/south-korea-tests-electric-road-for-public-buses (accessed on 18 April 2019).
- eRoadArlanda. Available online: https://eroadarlanda.com/ (accessed on 18 April 2019).
- Damousis, Y.; Amditis, A.; Winder, A.; Belloti, F.; Aniss, H.; Bianconi, M.P. ICT Functional Architecture and Specifications; FABRIC: Athens, Greece, 2014. [Google Scholar]
- Tongur, S. Preparing for Takeoff Analyzing the Development of Electric Road Systems from a Business Model Perspective; KTH Royal Institute of Technology: Stockholm, Sweden, 2018. [Google Scholar]
- Winder, S.A.; Damousis, Y.; Theodoropoulos, T.; Maria, P.B.; Pastorino, S.; Bellotti, F.; Oussama. User Needs, System Concept and Requirements for ICT Solutions; FABRIC: Athens, Greece, 2014. [Google Scholar]
- Baalsrud Hauge, J.; Shreenath, V.; Meijer, S.; Bias, J.D.; Spessa, E.; Wang, Q.; Curto, M.; Marmiroli, B.; Venditti, M. Feasibility Study on Societal Perspectives Towards on Road Charging and Set of Current Data Regarding Societal Dimension; FABRIC: Athens, Greece, 2015. [Google Scholar]
- Tongur, S. Exploring Business Models and Discontinuous Innovation: The Transition Towards the Electric Road System (ERS); KTH Royal Institute of Technology: Stockholm, Sweden, 2013. [Google Scholar]
Figure 1.
Process flow of the ERS study.

Figure 2.
ERS demo projects worldwide. (a) Korean OLEV bus in Gumi [58]. (b) eRoadArlanda [59]. (c) E16 Elväg project [53]. (d) U.S. electric highway truck [52]. (e) FABRIC project dynamic inductive and conductive charging technology [55].
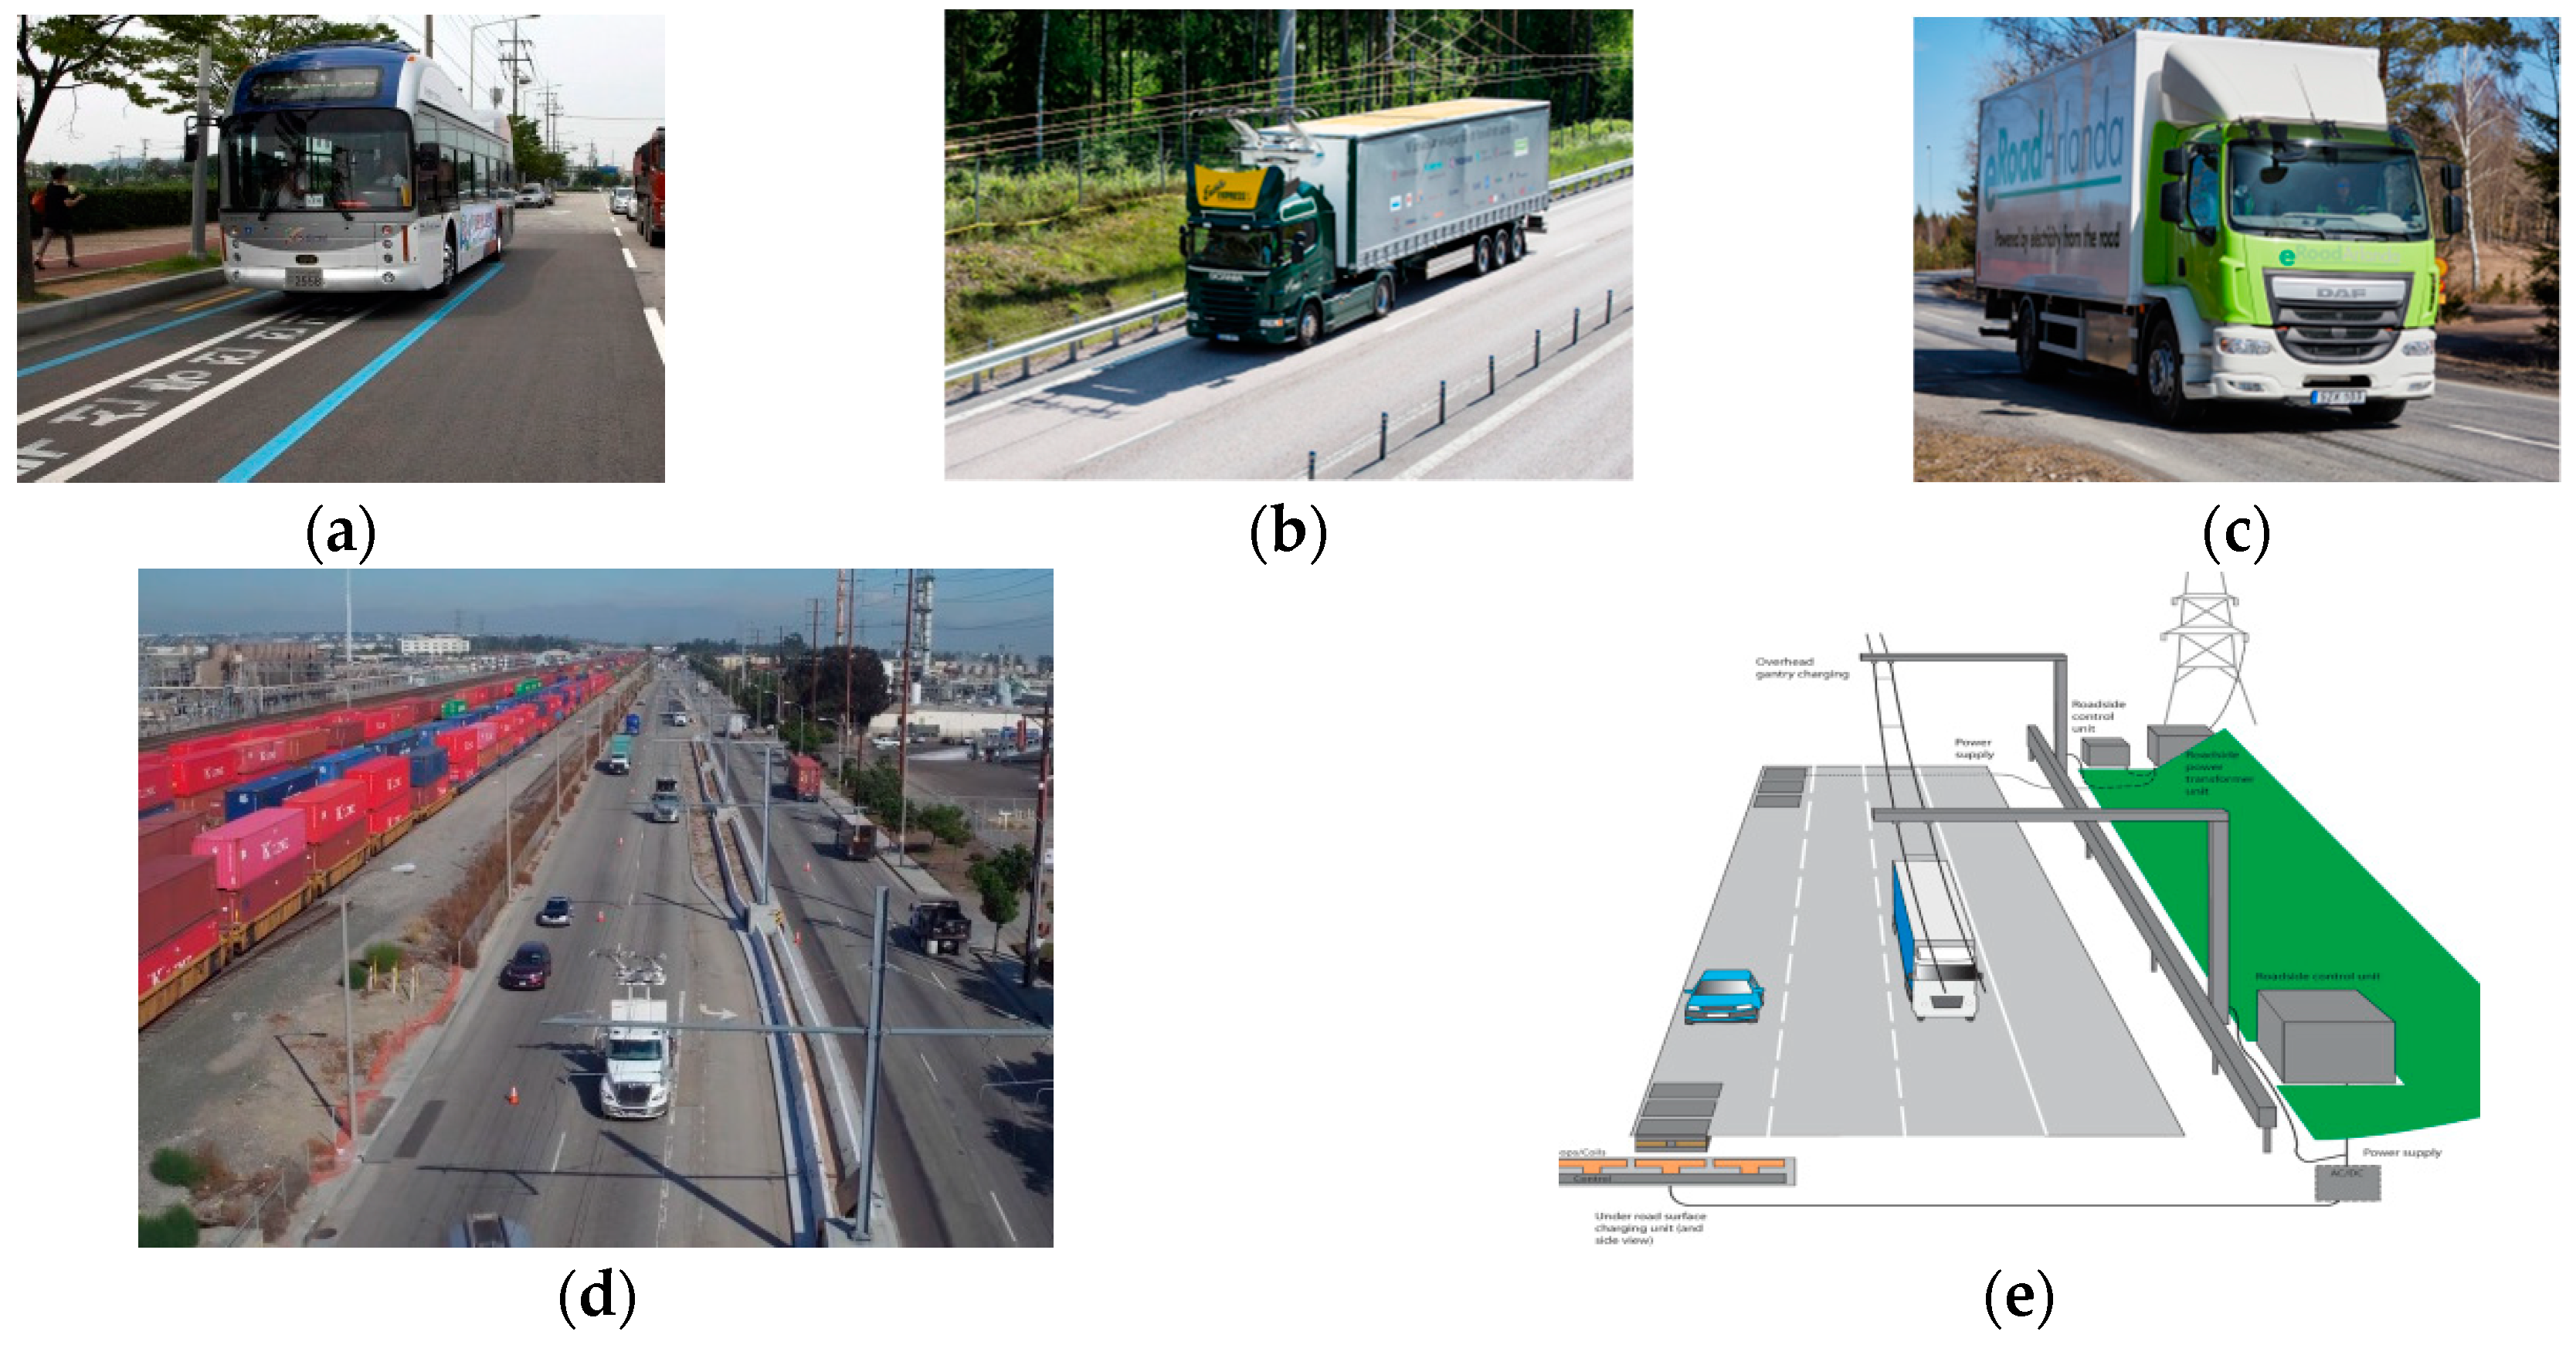
Figure 3.
Five subsystems in an ERS [57].
Figure 3.
Five subsystems in an ERS [57].
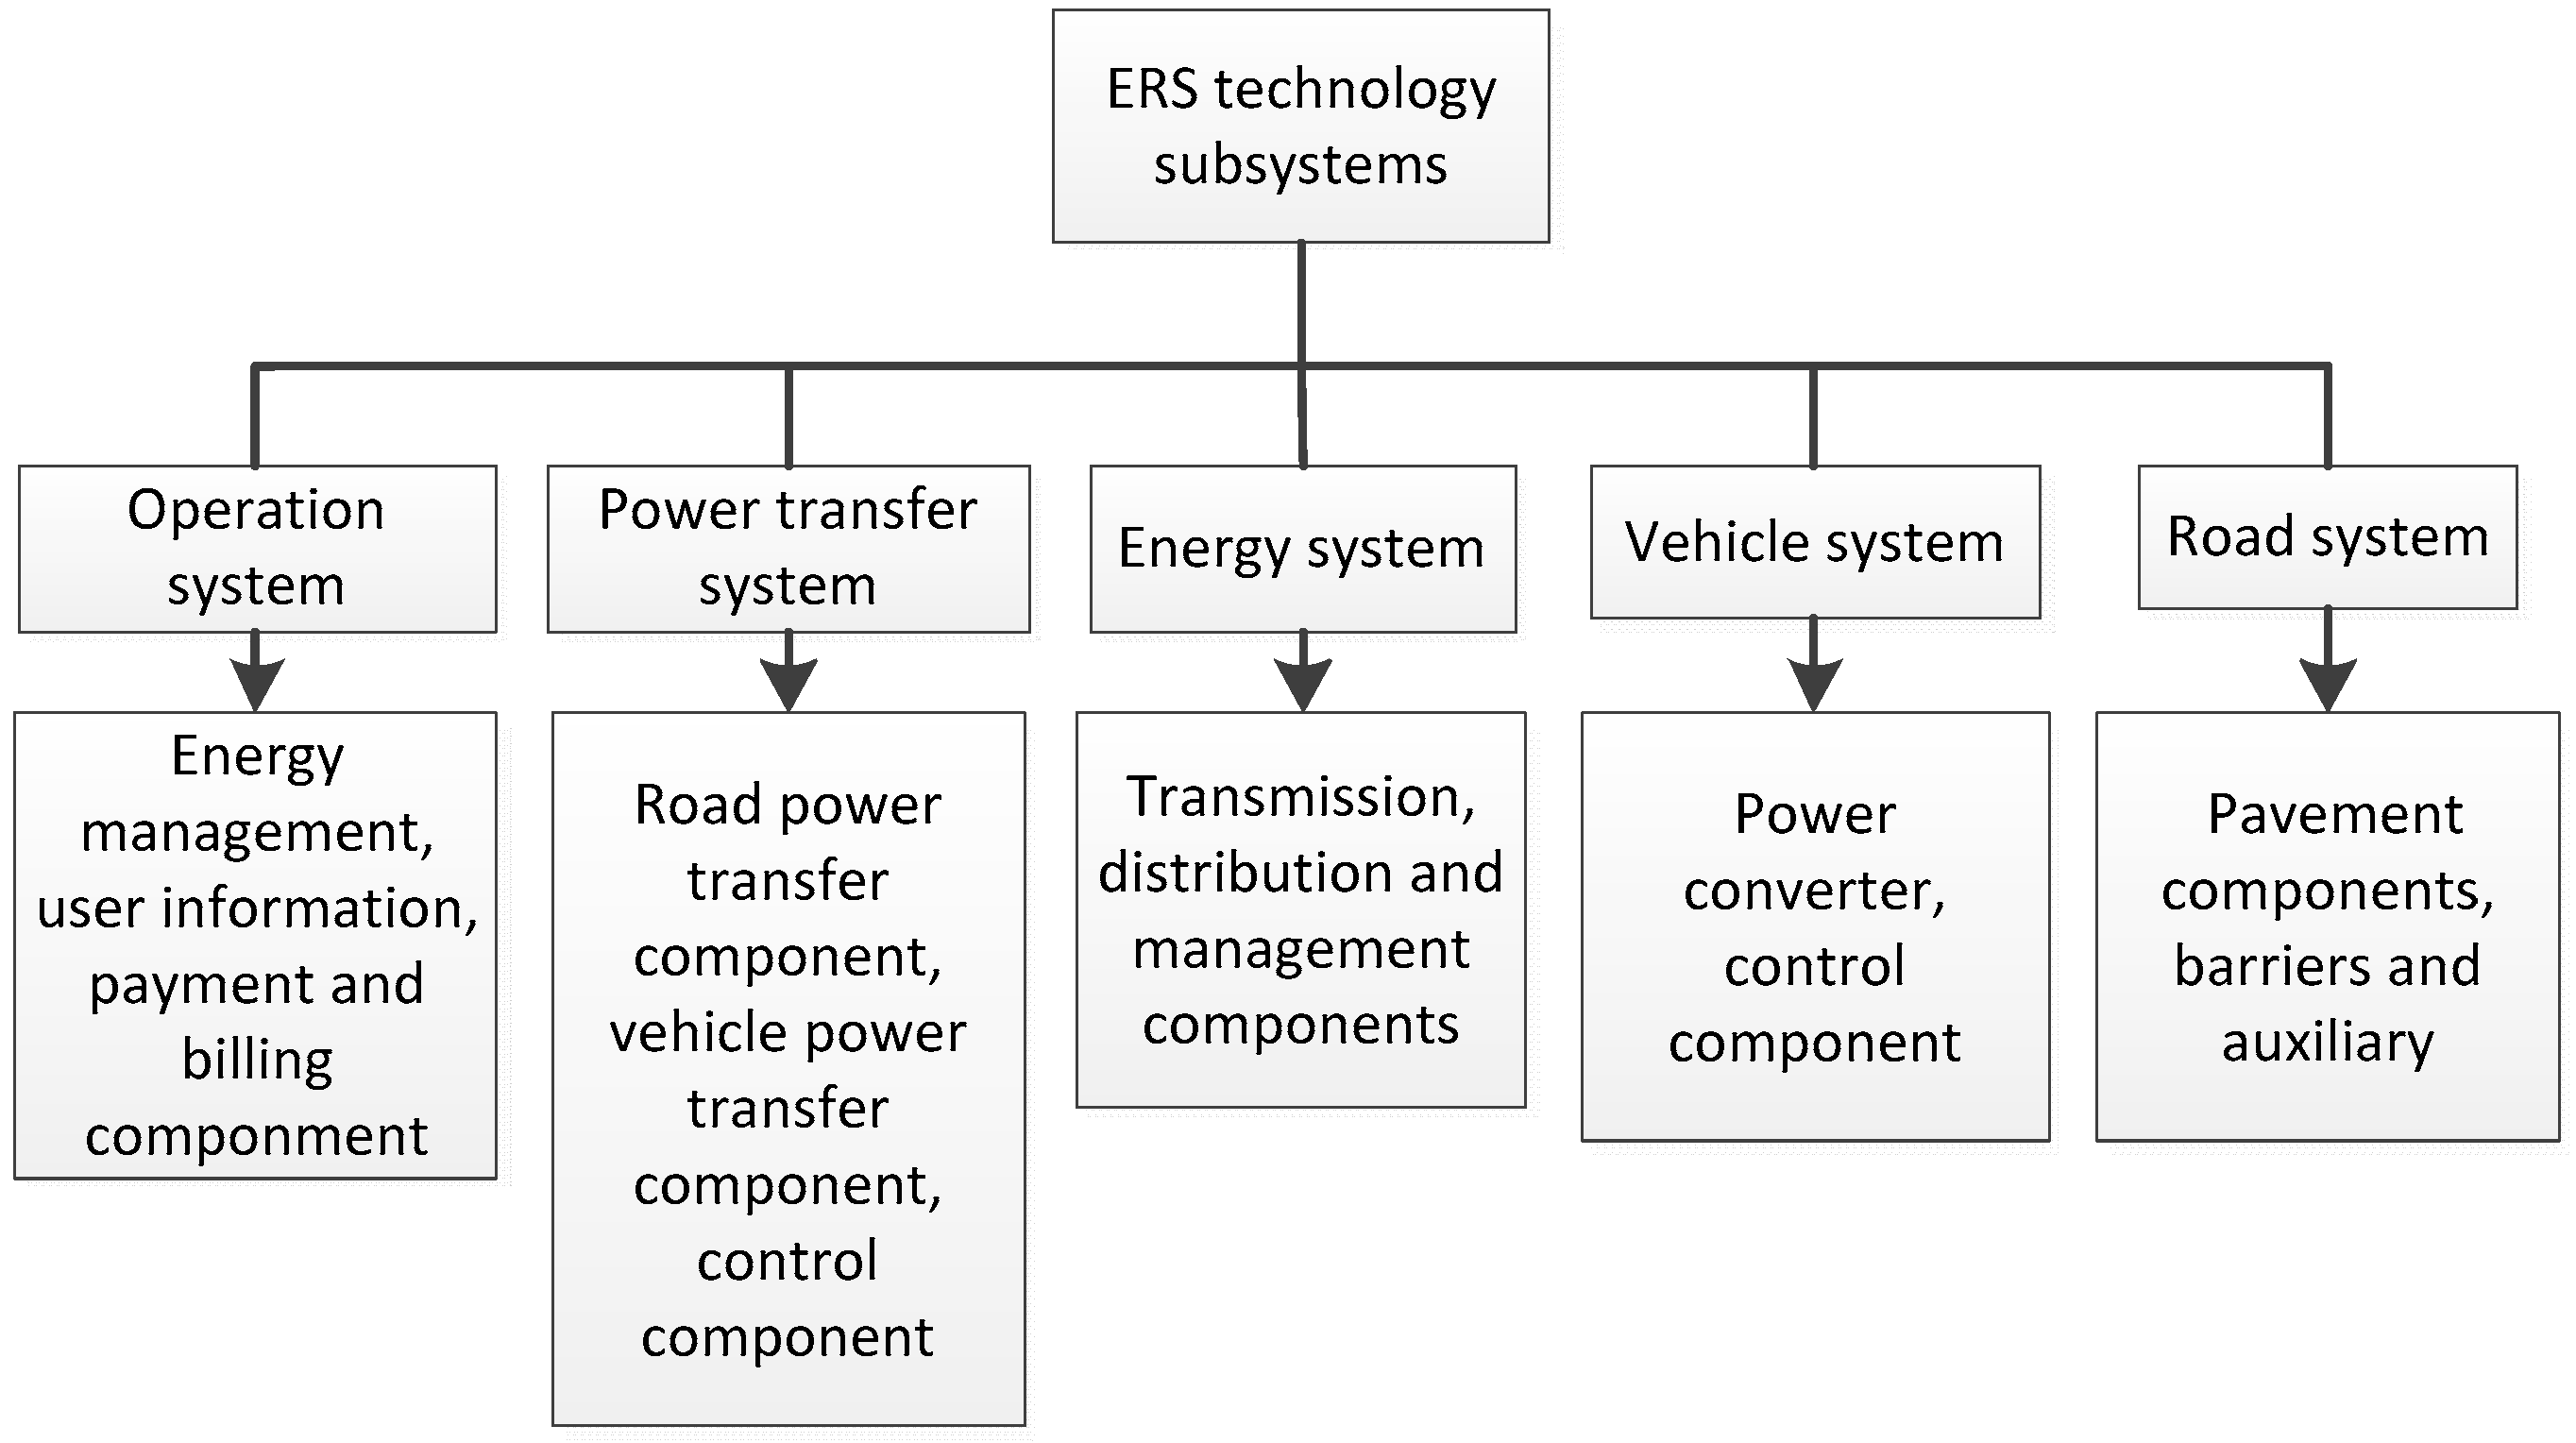
Figure 4.
ERS six subsystems structure.

Figure 5.
ERS stakeholders’ alignment.
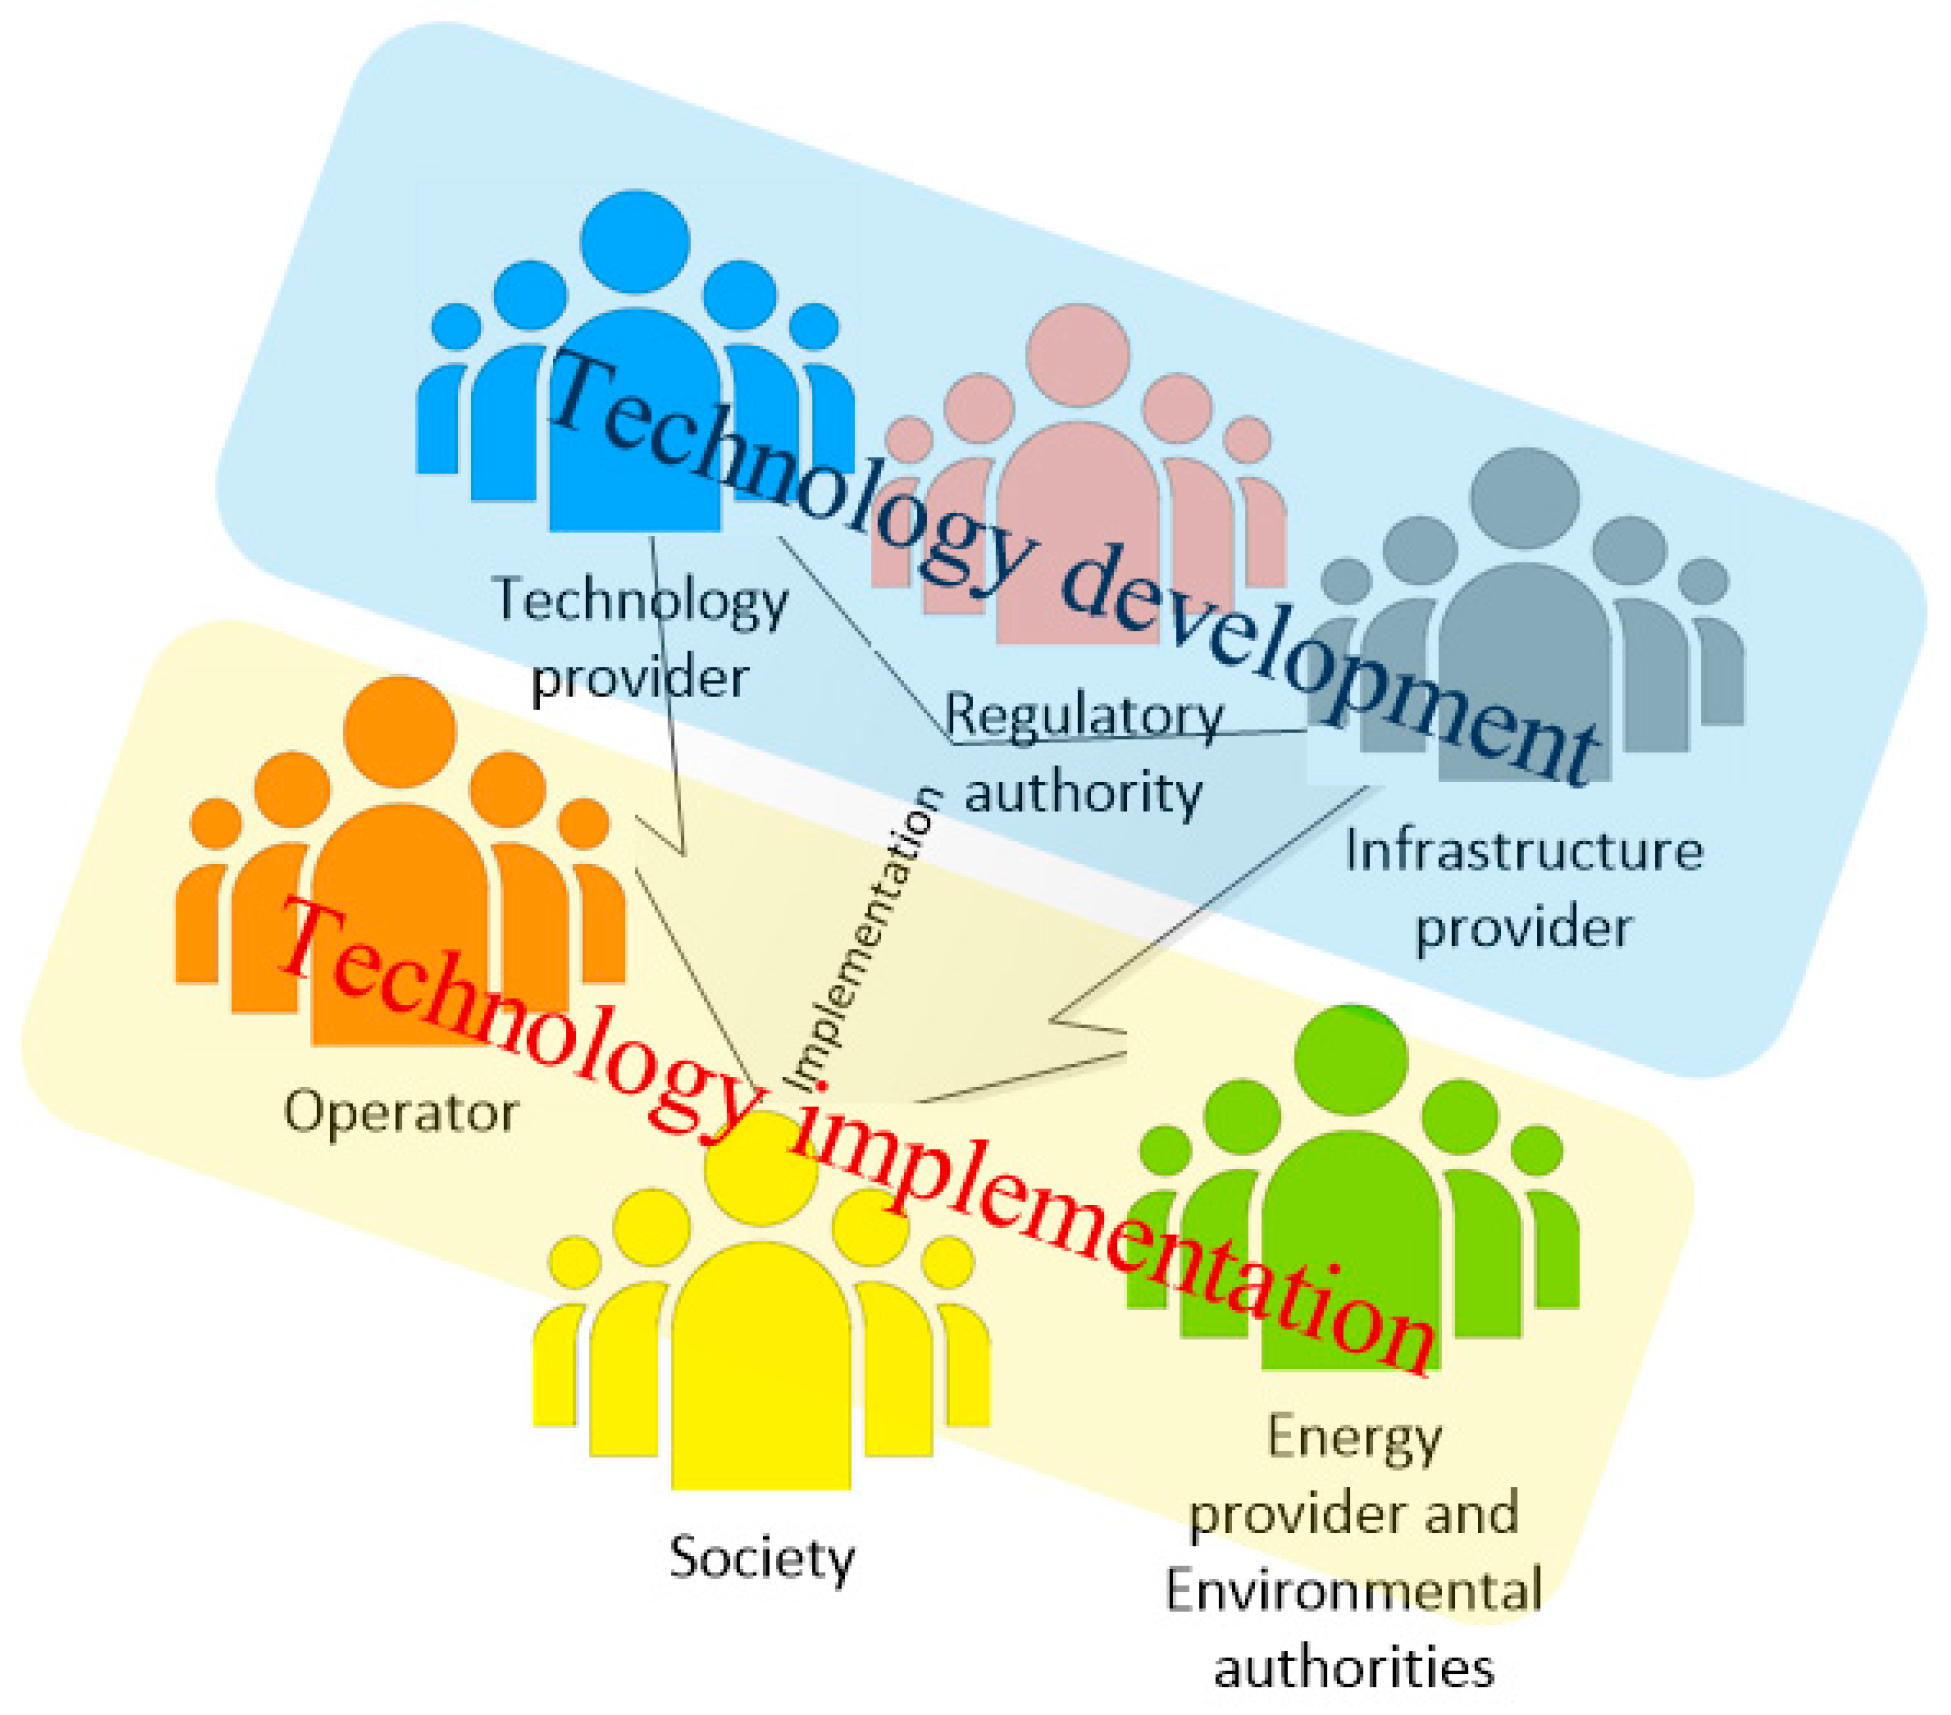
Figure 6.
The ERS operation process and system components design [63].
Figure 6.
The ERS operation process and system components design [63].
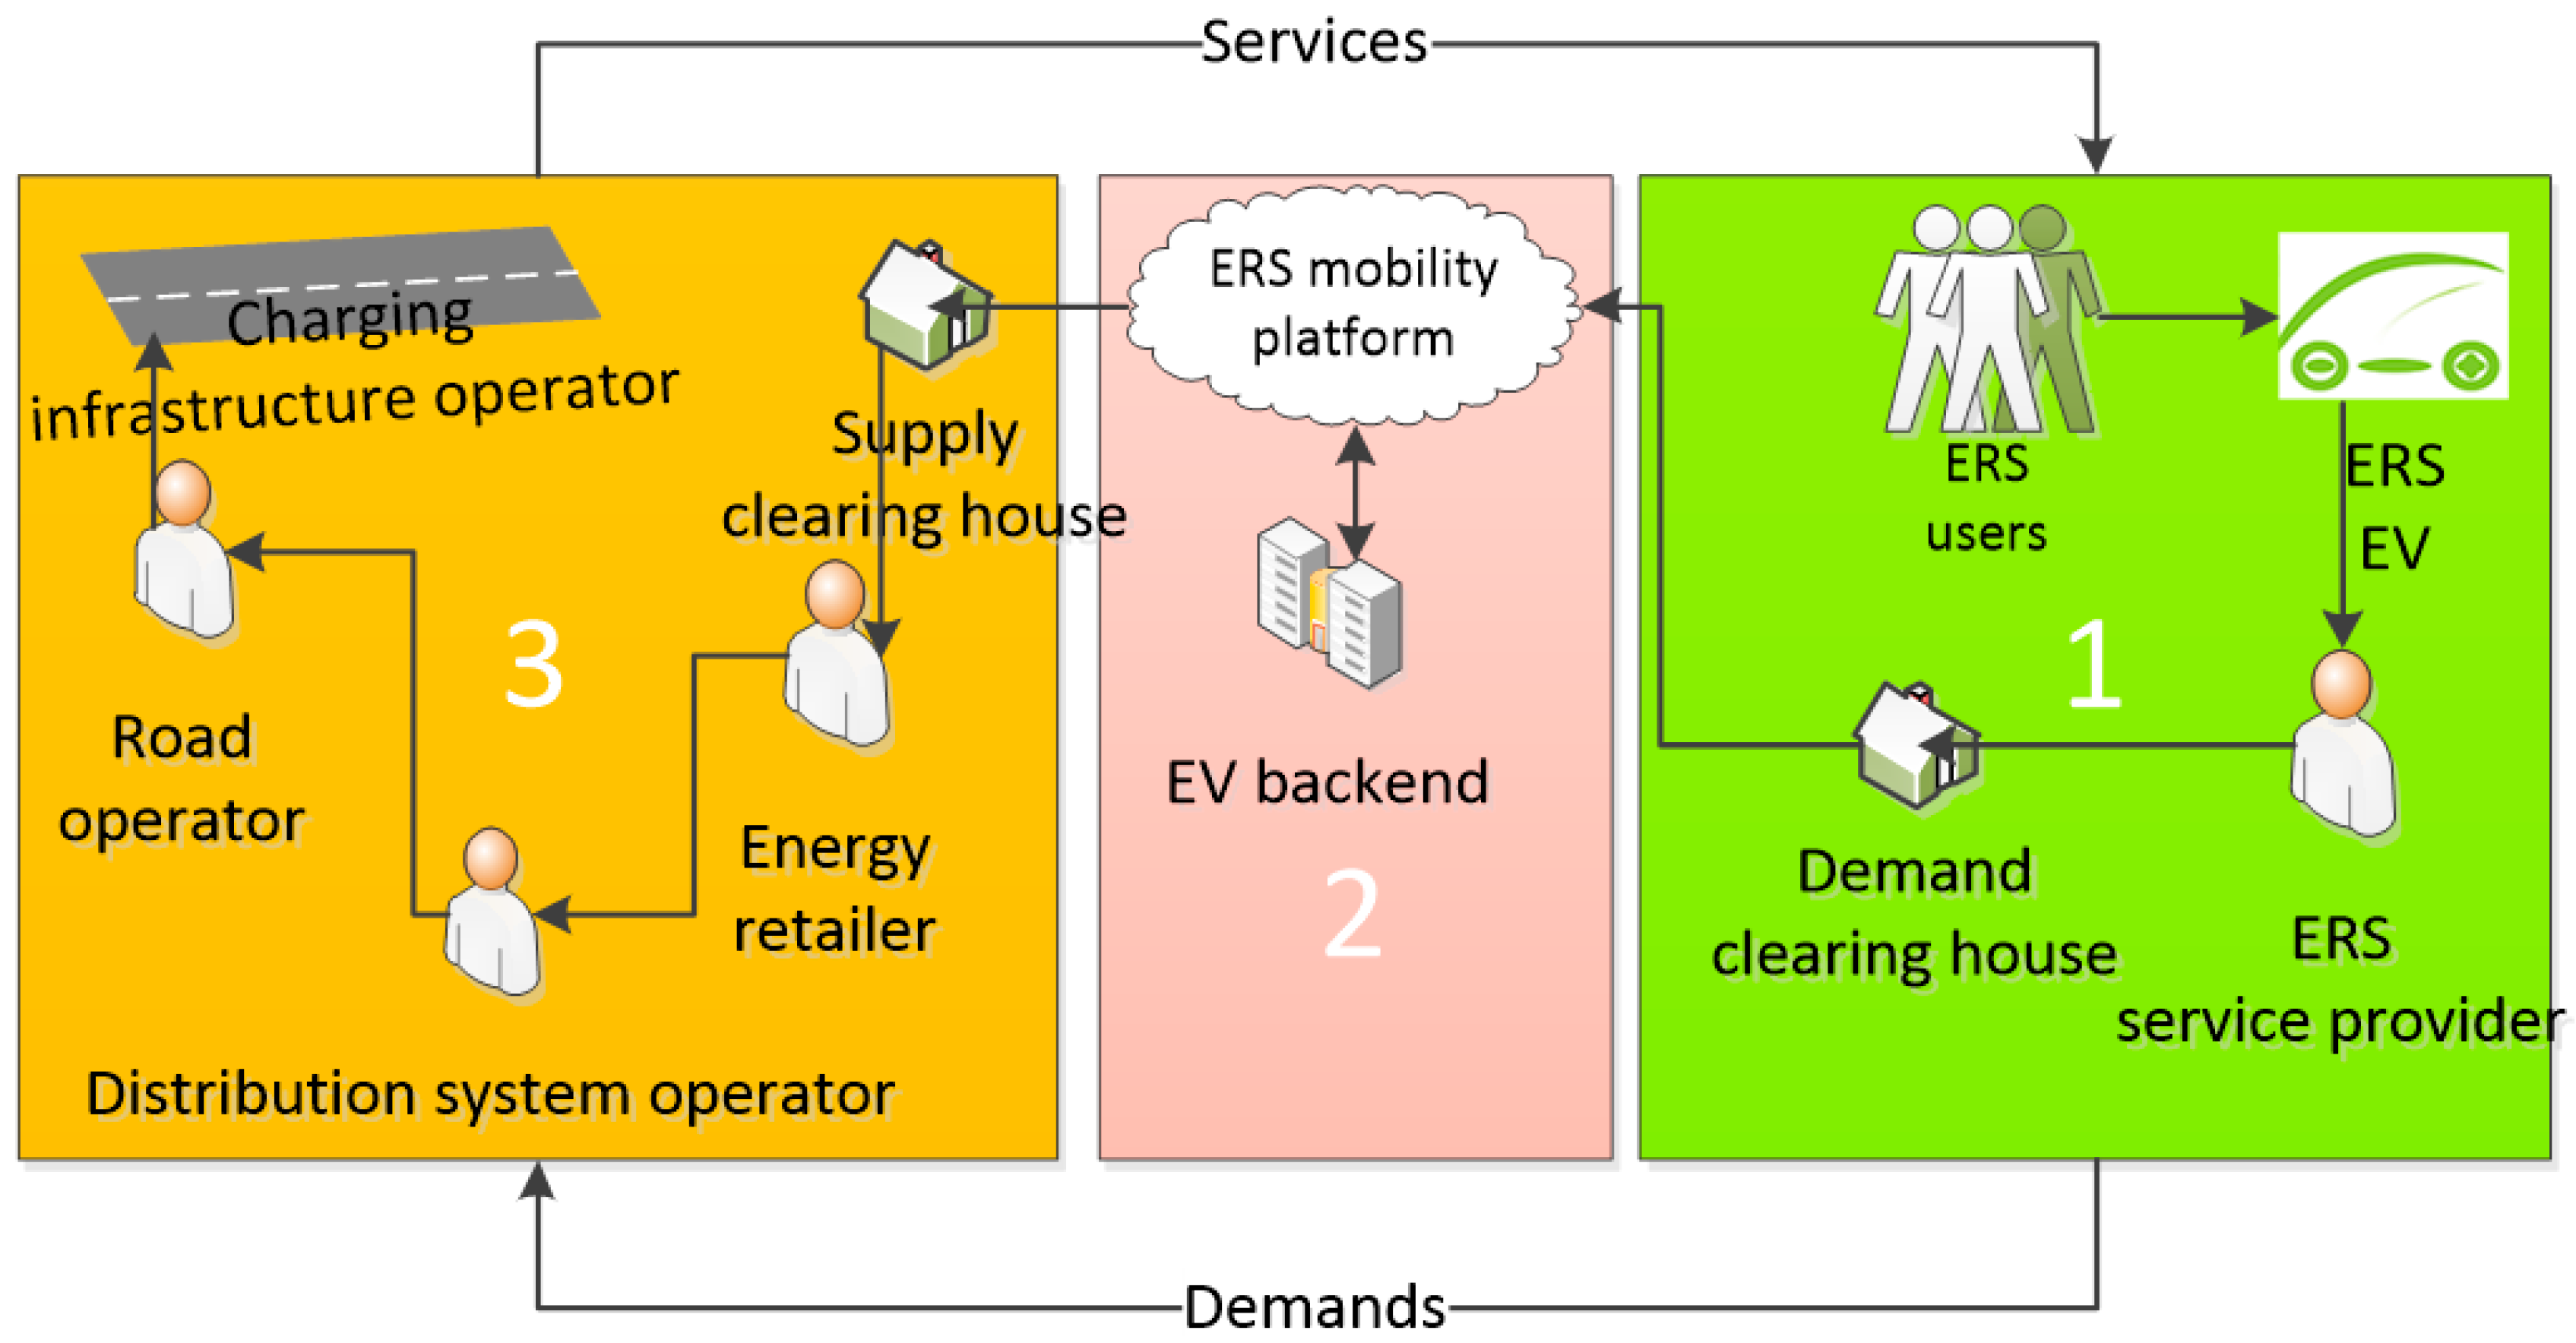
Figure 7.
Multi-transport modes and the Swedish ERS project.
Figure 8.
Example of stakeholder interview results in the Swedish ERS case.
Table 1.
Results of the literature review.
| Search Engines | Searching Criteria | Results | Used in This Study | Reasons | Articles |
|---|---|---|---|---|---|
| Web of Science Core | TOPIC: (transportation) AND TOPIC: (stakeholder analysis) Refined by: TOPIC: (actor analysis) Timespan: 2005–2019. Indexes: SCI-EXPANDED, SSCI, CPCI-S, CPCI-SSH, ESCI. | 8 | 2 | Involved and discussed the stakeholders’ function in complex system | [9,10] |
| ACM Digital Library | ACM full text collection matches any of the following words or phrases: system engineering actor network analysis, matches all the following words or phrases: transportation stakeholder, on or after 2005 | 66 | 2 | Identified and collected stakeholders’ concerns in complex system | [11,12] |
| JSTOR | ((ti:(stakeholder) AND (transportation)) AND (actor)); (ab:(actor network analysis)) | 8+81 | 3 | Discussed stakeholders influence and the implementation of actor network analysis method | [13,14,15] |
| KTH library and Google | Project reports, scientific publications, web pages using snowballing techniques (key words: electric vehicle, electric road system, battery, system thinking, PESTE analysis, stakeholder analysis, actor network analysis, Timespan: 2005–2019) | Keep iteration and select following the methodology of this study | 57 | Introduced the state of art of ERS projects, system engineering, system analysis, desk research and actor network analysis method implementation | The reset of the references |
Table 2.
FABRIC high-level functional subsystems [60].
Table 2.
FABRIC high-level functional subsystems [60].
| Functional Subsystems | Description |
|---|---|
| 1. On-Board Unit (OBU) | A machine installed inside the EV that will host the FABRIC applications and provide in-vehicle end-user access to FABRIC services. OBU will be able to communicate with the vehicle ECU and collect vehicle and battery information via the CAN bus. |
| 2. EV backend (EVB) | A machine that will be the main EV access point of the FABRIC system. It will host a database that will contain the data of the EVs and their users, EV characteristics, and billing information. |
| 3. FABRIC electric mobility platform (FEMP) | This machine will be the core of the system and act as an information coordination system. It will host all interfaces with the external actors and route the information received to the appropriate recipients. |
| 4. Charging infrastructure operator (CIO) | A machine that controls the charging infrastructure (charging pads), monitors the charging process, and transmits aggregated information to EVB and FEMP. It includes communication hardware (e.g., Wi-Fi, UMTS, etc.), application tools, and energy provision equipment for power transfer. The backend operator oversees managing and operating, at the same time monitoring all functionalities. It also provides services to assist the EV charging process such as authentication, authorisation, accounting, monitoring of power transfer, etc. |
| 5. Charging infrastructure (CI) | A machine includes EV supply equipment at the roadside for Wireless Power Transfer (WPT) to EVs. This includes EV supply equipment at roadside for Wireless Power Transfer (WPT) to EVs. |
| 6. Roadside unit (RSU) | A machine that can transmit information to EVs in its vicinity. It can also gather information from EVs and forward it to the CI. It contains the hardware, software, and antennas necessary for short-range V2I communications. |
| 7. Distribution System Operator (DSO) | This concerns the provision of energy and its pricing, managed by the DSO, which interfaces with the FEMP and the CIO. |
| 8. Energy Retailer (ER) | Supplies the power via the DSO, using the CI. Also interfaces with the FEMP regarding energy pricing/payment. |
| 9. Road Operator (RO) | Provide traffic and weather information to the FEMP. In a scenario where the RO also operates the CI, this would be merged with the CIO and would also perform access control and enforcement functions (if needed, i.e., in a closed access system). |
Table 3.
The description of the 10 ERS implementation scenarios [63].
Table 3.
The description of the 10 ERS implementation scenarios [63].
| Scenarios | Description |
|---|---|
| 1. Metropolitan deployment for heavy-duty vehicles | A scenario in which the major arteries used by heavy vehicles for freight (lorries above 3.5 tons) will use dynamic charging as their source of energy. Other sources of energy and batteries are required outside the metropolitan region and for the major arteries. |
| 2. Metropolitan development for buses | Buses in regular service will be charged continuously along most of the path. |
| 3. Metropolitan deployment for general light vehicles | Deployment of dynamic charging in special locations accessible to delivery vehicles to charge while on duty. Charging strips are a dynamic alternative to static charging. |
| 4. Metropolitan deployment for service vehicles/taxi’s | Deployment of dynamic charging in special locations accessible to service vehicles (municipality, waste, etc.) and taxis to charge while on duty. Charging strips are a dynamic alternative to static charging. |
| 5. International freight corridors | Electrification of the major international road corridors (European highways) between metropolitan hubs or a harbour and inland metropolitans for heavy freight vehicles. |
| 6. Long-haul national freight corridors | Electrification of the major road corridors between metropolitan hubs or a harbour and inland metropolitans for heavy freight vehicles. |
| 7. Short-haul national freight corridors | Deployment of special charging solution for a heavy-traffic section with traffic going back and forth. |
| 8. National deployment for general light vehicles | A nationwide deployment along all major arteries to allow general light vehicles (under 3.5 tons) to be charged while driving, and to reach their destination using a very small battery or alternative fuel source. |
| 9. International deployment for general light vehicles | Europe-wide availability of compatible on-the-road charging solutions for seamless, cross-border, dynamic charging for light-duty vehicles |
| 10. International deployment for all vehicle classes | Europe-wide availability of compatible on the road charging solutions for seamless, cross-border, dynamic charging for all classes of vehicles. |
Table 4.
Key issues for ERS implementation summarised.
| Key Issues in Six Subsystems | Operation | Vehicle load capacity, logistics requirement (for freight vehicle), passenger flow (for buses), traffic flow, charging time, headway (for buses), operation and control model, business model, safety, security, reliability, efficiency, data security. |
| Regulation | Standardization, legal terms. | |
| Energy | GHG mitigation, grid influence, efficiency. | |
| Technology | EMC (Electromagnetic compatibility) and EMF (Electromagnetic field) issues, heating, weather influence. | |
| Road | ERS road range, charging infrastructure interoperability (for international scenarios). | |
| Social | City (or international) system interoperability, traffic disruption interference, driving behaviour, comfort, system performance, cultural acceptance, and feedback. |
Table 5.
Test interview stakeholder summary.
| First-Round Interview: Researchers’ Test Interview | ||||||
|---|---|---|---|---|---|---|
| Stakeholder groups | Operator | Government | Electricity supplier | Technology suppliers | Road Infrastructure supplier | Society |
| 12 answers | 3 | 2 | 1 | 3 | 1 | 2 |
Table 6.
Summary of the Swedish ERS project interview stakeholders.
| No. | Stakeholder | Description | 12 Answers |
|---|---|---|---|
| 1 | Operator | The operator contributes to transport knowledge and dealing with issues related to the development and clearance of the electric road vehicle. | 1 |
| 2 | Authority and Government | Stakeholders in this group are a project leader or local government. The project leader in this project is to hold together different stakeholders and to move the project forward. Local government helps to test and support future implementation. | 2 |
| 3 | Electricity supplier | This stakeholder is the retailer of electricity and heat and producers of electricity and heat and to provide competence in electricity distribution. | 1 |
| 4 | Technology suppliers | This stakeholder provides vehicles that also fulfil the inspection authority requirements. The stakeholder also provides technology and collects unique competencies throughout the development of ERS technology and implementation of the project. | 2 |
| 5 | Road infrastructure supplier | These stakeholders contribute to the project with knowledge of safe installation work focused on construction related to the road infrastructure and the project financial control. | 2 |
| 6 | ERS user | Stakeholders who buy the ERS service in the ERS solution | 3 |
| Researcher | Stakeholders who work from universities and research institutes and discuss the scientific feasibility. | 1 |
Table 7.
Action list comparison.
| Version 1.0 | Version 2.0 | Swedish ERS Project |
|---|---|---|
| Committee discussion | Discuss among different stakeholder groups | Discuss among different ERS stakeholder groups |
| Make demand prediction | Make a demand prediction | Make a demand prediction |
| Sell electricity | Sell Electricity | Sell electricity |
| Charging lane access control | Charging lane access control | Join the ERS project |
| Test maintenance solution | Test maintenance solution | Test maintenance solution |
| Distribute electricity | Distribute electricity | Cooperate with different stakeholder |
| Generate electricity according to demand | Generate electricity according to demand | |
| Recommend route information to lorry drivers | Recommend route information to vehicle drivers | Calculate timetable |
| Council meeting to discuss policy and regulations | Disseminate fossil fuel energy shortage and CO2 emission disadvantage | Organise ERS events |
| Transport goods | Educating consumers, businesses, workplaces, dealerships and municipalities | Educating consumers, businesses, workplaces, dealerships and municipalities |
| Identify market requirements | Attract more companies to ERS cost | Attract more companies to reduce ERS cost |
| Make a profit | Improve ERS Service | Improve ERS service |
| Manufacture ERS lorries | Promote ERS solution | Promote ERS solution |
| Propose draft standardisation | Build different charging solution | Transport goods |
| Approve standardisation | Sell the ERS service | Develop a solution to combine technology and the business model |
| Send bill | Buy the ERS service | Build a test road |
| Sell ERS lorries | Establish standards | Remove test road |
| Version 1.0 and Version 2.0 end | Plan and order special equipment | |
| Acquire knowledge of ERS (reading and writing reports) | Allocate installation resources | Set up test criteria |
| Logistics activity planning and cluster | Test and approve vehicle | Develop technology |
| Coordinate the project | Participate in ERS events (conferences and seminars) | |
Note: the dark grey is to notify the end of the version 1.0 and 2.0.
Table 8.
Goal list comparison.
| Version 1.0 Goal | Version 2.0 Goal | Swedish ERS Project Goal |
|---|---|---|
| Shift to e-Mobility | Shift to e-Mobility | Shift to e-Mobility |
| Consumer acceptance | Social acceptance | Social acceptance |
| Integration with the transport system | Integration with the transport system | Integration with the transport system |
| Collaboration within the e-Mobility Value Chain | Collaboration within the e-Mobility Value Chain | ERS commercialization |
| Achieve a sustainable transport system | Achieve a sustainable transport system | Achieve a sustainable transport system |
| GHG emission mitigation | GHG emission mitigation | GHG emission mitigation |
| Increase e-Mobility benefits | Integration of ERS value chain | Make a profit |
| Technology standardize | Technology standardized | Disseminate ERS technology |
| Efficient transport system | Efficient transport system | Determine system performance |
| Interoperable networks | Independent from fossil fuels | Independent from fossil fuels |
| Infrastructure utility | Infrastructure utility | Become transportation centre |
| Stable electricity networks | Stable electricity networks | |
| Adapt the new business model | Become a leader in technological advancement and innovation | Become a leader in technological advancement and innovation |
| Adapt new eco-system | Green transport service provider | |
| Increase OEMs profits | Have greater opportunities to discuss ERS topics | |
| Smart demand response grid system | Environmental consistency |
© 2019 by the authors. Licensee MDPI, Basel, Switzerland. This article is an open access article distributed under the terms and conditions of the Creative Commons Attribution (CC BY) license (http://creativecommons.org/licenses/by/4.0/).
Share and Cite
MDPI and ACS Style
Wang, Q.; Hauge, J.B.; Meijer, S. Adopting an Actor Analysis Framework to a Complex Technology Innovation Project: A Case Study of an Electric Road System. Sustainability 2020, 12, 313. https://doi.org/10.3390/su12010313
AMA Style
Wang Q, Hauge JB, Meijer S. Adopting an Actor Analysis Framework to a Complex Technology Innovation Project: A Case Study of an Electric Road System. Sustainability. 2020; 12(1):313. https://doi.org/10.3390/su12010313
Chicago/Turabian StyleWang, Qiuchen, Jannicke Baalsrud Hauge, and Sebastiaan Meijer. 2020. "Adopting an Actor Analysis Framework to a Complex Technology Innovation Project: A Case Study of an Electric Road System" Sustainability 12, no. 1: 313. https://doi.org/10.3390/su12010313
Note that from the first issue of 2016, this journal uses article numbers instead of page numbers. See further details here.