Wearable Sensor Data-Driven Walkability Assessment for Elderly People

Department of Architectural Engineering, Dankook University, Yongin-si 16890, Korea
Sustainability 2020, 12(10), 4041; https://doi.org/10.3390/su12104041
Submission received: 3 March 2020
/
Revised: 12 May 2020
/
Accepted: 13 May 2020
/
Published: 14 May 2020
Abstract
:Active living improves the lives and social networks of the elderly. In terms of active living, walkability is an essential element in the daily life of the elderly. To support active living, it is important to create an age-friendly environment. Considering that the elderly carry out a large part of their activities by walking, a good walkable environment is one of the most important elements of an age-friendly environment. Existing studies have involved surveys of experts, audit tools, and questionnaires. However, despite their merits, current methods of measuring walkability remain limited as they do not include the actual walking activity of the elderly. Therefore, the purpose of this study is to investigate the possibility of using a wearable sensor to measure the walking of the elderly quantitatively, and to compare different walking environments based on data collected from their actual walking. To accomplish this, experiments were conducted in four types of environments with 30 elderly subjects. During the experiments, the subjects were asked to attach a smartphone that includes an inertial measurement unit (IMU). The IMU sensor collected the body movement using tri-axial accelerations. The collected data were used to calculate walkability by investigating how constant a subject’s walking pattern is. The consistency of pattern can be regarded as gait stability that can be quantitatively measured via the maximum Lyapunov exponent (MaxLE—a metric used for measuring the stability of human body during locomotion. As a result of the experiment, it was found that the stability of walking of elderly people differs according to the walking environment, which means that by investigating the stability the current conditions of a specific walking environment can be inferred. This result helps improve the active life of the elderly by providing opportunities for continuous diagnosis of the walking environment.
1. Introduction
Rapid aging is expected to be one of the key factors that changes Korean society in the 21st century. With the development of health technology, improved nutrition, and improved income levels, the average life expectancy increased to 81.4 in 2012 from 61.9 in 1970 and will reach 89.4 years in 2040 [1]. Aging is acceptable as a natural phenomenon, but the biggest problem is that our society is not adequately prepared to accept this process.
Aging of the population has emerged as a threat to government welfare policies and economic growth, but several developed countries are starting to take an interest in the active living of the elderly (e.g., the EU’s view of the silver economy and healthy aging in the US). The active lives of the elderly play a role in enhancing the personal quality of life, including physical and mental health, life satisfaction, and psychological stability [2,3], and provide social support to the elderly community [4,5]. How to enable the elderly to live actively as members of society is an important policy task in an aging society, and an age-friendly environment is needed for their active social activities and participation. According to the World Health Organization (WHO) [6], an elderly-friendly environment denotes an environment that can provide appropriate services to the elderly. The services that are most directly applicable to the elderly involve creating an age-friendly living environment that supports their daily lives. In fact, most of the daily life activities of the elderly, such as sports, consumer life, and social activities, take place in the neighborhood, and these activities are mainly realized through walking activities. Therefore, to support the active lives of the elderly, it is a prerequisite to create an elderly-friendly walking environment. To create an elderly-friendly pedestrian environment, it is first necessary to measure the extent to which the pedestrian environment is convenient or comfortable for the elderly. The pedestrian facilities and environment are then maintained or improved based on the evaluation results.
Based on these studies, various methods for measuring or evaluating pedestrian environments have been developed, which can be divided into subjective and objective methods. First, the subjective method is a self-reported method (a user of an actual walking environment directly records a questionnaire). A representative method is the Neighborhood Environment Walkability Scale (NEWS) developed by Cerin et al. [7]. Such a method can be regarded as a user-centered approach in that the pedestrian can evaluate the pedestrian environment. However, the subjective judgment and the physical and cognitive characteristics of the survey subjects are likely to be involved in the survey response.
The objective method mainly measures the walking environment using a validated audit tool. The subjects of the measurement are mainly educated researchers who directly observe and record the walking environment based on the validated evaluation tools. Various evaluation tools have been developed to measure the walking environment. The representative tools for measuring the walking environment or pedestrians’ convenience are the Systematic Pedestrian and Cycling Environmental Scan (Spaces) [8], Pedestrian Environmental Data Scan (PEDS) [9], and Active Neighborhood Checklist (ANC) [10]. Although these tools present the possibility of evaluating a large portion of the environment, it takes considerable time and budget to conduct several surveys for covering up a large portion of the urban environment. Considering that the walking environment is a facility for providing comfortable walking for pedestrians, it is important that pedestrians who use this environment participate in the evaluation of walkability [11]. Recently, based on the development of wearables and smart devices (e.g., smartphone, smart band, and smart insole), the People Centric Sensing technology, which can infer different data (e.g., sound, location, acceleration, and angular velocity) through human behavior patterns and interactions in daily living, has been developed [12]. For example, it is used for the occurrence of social events [13], people’s health [14], and social interactions [15]. While human-centered sensing technology is being used in a variety of ways to improve urban life, many studies are still focused on human behavior or interactions between people. In other words, there is a lack of research that deduces information through the interaction between people and the external environment.
Studies inferring the external environment through the user’s reaction have been conducted to find potholes through the shaking of vehicles [16] or to identify hazards through the physical reactions of the workers on a construction site [17]. Among the studies inferring the external environment through the user’s reaction, the research works related to the walking environment are as follows. Joo and Oh [18] measured cyclability through bicycles, and Mourcou et al. [19] measured the walking environment for wheelchair users. A study applying the actual pedestrians’ behaviors has been conducted to identify sidewalk defects through the bodily reactions of pedestrians [11].
Based on existing research, the following implications can be derived. Considering that a stable and convenient walking environment in a living area has an important effect on the daily walking activities of the elderly, pedestrian walking patterns or reactions can be expected to play a role in inferring the convenience of the walking environment [11]. In the case of walking, body stability changes continuously as walking locomotion and affects from external environment [11]. In this study, walking stability denotes how constant the variability of body stability is, which is calculated by tri-axial acceleration using inertial measurement unit (IMU) attached to a participant’s lower back. This stability can be also regarded as how constant the gait pattern of a pedestrian is since a gait pattern affects the movement of a pedestrian’s lower back. For example, if a pedestrian is walking along a well-managed road without any obstacles like a paved walkway in a sound park, their walking cycle may be constant. In contrast, if a pedestrian is walking along a road mixed with passing cars and pedestrians, their walking cycle may be inconsistent since they should react to the changes of walking environments by changing or adapting their gait. In this regard, a pedestrian’s walking stability is higher when there is less disturbance of walking as a constant walking cycle is repeated. As several studies have used an IMU sensor for measuring this [11], this study measures the actual walking of elderly pedestrians through an inertial measurement unit (IMU) sensor embedded into a smartphone and analyzes the measured values to distinguish various walking environments. The purpose of this study is to examine the feasibility of a method that compares the physical responses of the elderly during walking in various environments and analyzes the differences between them. To achieve this goal, this study was conducted as follows. First, the efforts related to existing pedestrian environment analysis methods were examined. Second, the implications of this study were reviewed by analyzing studies related to external environment evaluation based on actual pedestrian behavior using wearable sensors. Based on the literature review, an experiment was designed to achieve the purpose of this study, and 30 elderly people over 65 years old were recruited to conduct experiments and collect data. Finally, the collected data were analyzed to measure walkability quantitatively.
2. Experiment Design
2.1. Research Hypothesis
Existing studies have focused on finding local points (e.g., cracks, holes, and vertical separation of sidewalks) that need improvement within the walking environment [11,20]. Although finding the points that need improvement in a walking environment (a road) is important, it is necessary to evaluate the walking environment of each section because it is a space that provides connectivity in the elderly’s daily life. Thus, this study selects several test sites, collects the response of the elderly to various walking environments through wearable sensors, and verifies whether each walking environment can be quantitatively classified based on the collected data. Based on this, the following hypothesis is established and tested.
Hypothesis 1 (H1).
Different walking environments—with or without disturbances that can cause changes of walking patterns such as mixed traffic road and illegal parking—can be distinguished by the elderly’s walking patterns and reactions.
2.2. Experiment Site Selection
To conduct the experiment, the following four types of test sites were selected; the length of each site was approximately 250 m, and their location and outline are shown in Figure 1.
The four test sites were selected based on the common walking environment used by the elderly in close proximity to their living environment. In detail, the pedestrian walkway in the park (Site 1) was selected because the walking environment was excellent. The subjects were mainly walking or exercising in the park. In addition, the walkway mixed road (Site 3) is a passage from a crowded residential area to a subway station. With the illegal parking and traffic, passing cars are not separated from pedestrians (no sidewalk). Thus, this site is judged to be an environment where elderly people usually feel uncomfortable. There are no significant differences between the two pedestrian roads (Sites 2 and 4), but there is a difference in illegal parking on sidewalks (Site 4). The four test sites were selected to determine whether the walking environments could be distinguished by using the elderly’s walking behaviors. In other words, if the difference of each test site can be distinguished through wearable sensing data, the method of this study may be applicable to other walking environments. In addition, all the sites are almost flat, which means that there is very little difference between the heights. Flat ground can exclude the influence of the shape of the ground and minimize the effects of physical (musculoskeletal) differences among the elderly subjects. The four test sites are located at a short distance from each other so that the effects of movement and atmospheric fatigue may be minimized while continuously performing the test.
2.3. Participants
To conduct an experiment, a total of 30 elderly participants (14 males and 16 females) were recruited. The participants were required to be capable of walking alone without any inconvenience. According to a previous study [21], the conditions for recruiting experiment subjects for elderly gait evaluation were as follows: (1) being able to walk without a walking assist device and a stick, (2) not taking drugs that affect the balance of the body, and (3) no cardiovascular disease. To follow the conditions suggested from the previous study [21], the recruitment was conducted with members of athletic clubs (senior gate ball clubs) who were judged to have sufficient athletic ability. In addition to athletic ability, the recruited participants did not have any problems with their vision. All participants had normal vision and mobility, indicating that they could participate in the experiment without any assistance. The details of the participants are presented in Table 1.
2.4. Experimental Procedure
To collect the data of the experiment, the experimental equipment was worn as shown in Figure 1b. First, a smartphone (model: Samsung Galaxy 8) was worn at the back of the waist height and was fixed using a fitness belt to minimize the movement of the smartphone caused by walking. Since a smartphone includes an IMU sensor (including a tri-axial accelerometer), after putting on the equipment, each subject walked Sites 1–4 once. To minimize the effects of fatigue due to walking, the order of sites was randomly determined by a lottery. In addition, the experiment was conducted with a 10-min break (rest time) between the four experiments (Sites 1–4). After the experiment, the walking convenience of each site was evaluated by participants through a nine-point scale (subjective rating). The evaluation was conducted after each experiment of a participant and the question was “How comfortable are you walking on this site?” The reason why a nine-point scale is used in this study is to more clearly make the distinction of each site. Since there are four sites, a five-point scale (typical Likert scale) may make participants choose the same score. To avoid this, this study provides detailed selections (nine-point scale).
2.5. Method for Calculating Dynamic Stability using MaxLE
Considering a scene when we walk under a stable condition without any external environment changes (e.g., walking in the controlled laboratory), our walking stability may be constant. Conversely, our walking stability may be inconsistent while walking under uncomfortable conditions (e.g., walking along a street with garbage, obstacles, and not well-managed surfaces). Several studies have indicated that human gait stability is affected by external environment conditions [11,22,23,24]. Thus, it may be valuable to measure the gait stability in a specific environment for investigating walkability. The stability of human walking can be measured from a temporal analysis of multi-dimensional variability of tri-axial accelerations [25]. The kinetic disturbance in a walking trajectory is a continuous process, and thus, attenuation of the multi-dimensional variability is continuously presented [26]. Considering the dynamic nature and continuity of human locomotion in walking scenes, it is important for measurements of the kinematic variability to incorporate time-dependent kinematics [27]. The kinematic variability—often represented as dynamic stability—can be determined based on the maximum Lyapunov exponent (MaxLE), [26,28,29]. MaxLE indicates the sensitivity of changes in consecutive strides (or steps) to minuscule kinematic disturbances [28,30]. MaxLE can quantify the mean logarithmic rate of divergence of a time-series dataset and offer a measure that can express how a human locomotor system responds to small perturbations [26]. Thus, MaxLE could indicate the level of kinematic disturbance caused by the built environment on the continuous walking patterns of pedestrians, including the elderly.
In other words, MaxLE is a quantitative measure of how much change there is in consecutive strides. Therefore, when walking is repeated in perfectly uniform cycles (higher walking stability), the value is close to zero, and when the walking pattern is irregular (lower walking stability), a larger value is obtained. There are two methods for measuring MaxLE: the Rosenstein [30] and Wolf algorithms [31]. In this study, we will use the Rosenstein algorithm, which is more commonly used in pedestrian studies [32]. The process of measuring dynamic stability for walkability using MaxLE is presented in Figure 2. As shown in Figure 2a, the acceleration data obtained through the IMU sensor attached to a subject’s lower back is first plotted and the initial ten strides (walking cycles) are selected [33]. Then, the data are reconstructed to create an appropriate state space for 10 strides over time (Figure 2b). Based on the reconstructed state space, the value of is computed to determine the MaxLE value, as shown in Figure 2c.
To calculate MaxLE, it is required first to reconstruct a state space with sufficient dimensions. Given that the recorded time-series data, x(n), are one-dimensional column vectors, a method creating an appropriate n-dimensional state space is needed to accurately determine the dynamic perturbations to the ideal gait cycle. A typical method of creating an n-dimensional state space from scalar data is the method of delays [34]. Using the method of delays, an n-dimensional state space Y is constructed using Equation (1).
where x(t) is the coordinates in the phase space, T is the time delay, and de is an embedding dimension.
The successive reconstruction of the state space is determined by the time delay T in Equation (1) [30]. In this study, the time delay was determined by selecting the first local minimum of the average mutual information (AMI), which evaluates the amount of information (total number of data) between two datasets over a range of time delays [35]. According to the AMI, the selected time delay was that when the time in the mutual information function reached its first minimum value [30,36].
The number of embedding dimensions, de in Equation (1), is calculated to unfold the dynamics of the system in an appropriate state space. An inappropriate number of embedding dimensions may result in a projection of the dynamics of the system that has orbital crossing in the state space that is caused by false neighbors [36,37]. The number of embedding dimensions is chosen based on the global false nearest neighbor method [38]. This method incrementally increases de until there is no orbital crossing—the number of false nearest neighbors approaches zero. The embedding dimension in this study was determined based on false nearest neighbors [36].
After determining the embedding dimension as n = 5, a value that was considered appropriate, as suggested in the study of England and Granata [26], we could finally reconstruct an appropriate state space, Y(t). Based on Y(t), we can investigate whether the data converge exponentially. To do this, the difference between the nearest neighbors should be calculated as expressed in Equation (2).
where D0 is the average displacement between trajectories at t = 0, and dt is the average Euclidean distance between the initially neighboring trajectories times, t.
In Equation (2), we can find the remaining variables except . Therefore, to find , the logarithm of both sides of Equation (2) can be expressed as Equation (3).
In Equation (3), the largest value of , MaxLE, can be determined by the largest slope of the logarithm of the average divergence in the reconstructed state space, as shown in Figure 2c. In this study, the data from the first ten strides on each window were used to measure the MaxLE value. The walkability (MaxLE) of each participant on a specific site was calculated by the average of 20 windows (ten windows located before and after the center, respectively). As the MaxLE value indicates the degree of variability in observed patterns, a lower value of MaxLE indicates higher walking stability (maintaining constant gait patterns).
3. Results
The experiment was carried out according to the experimental procedure presented in the previous section, and the following two aspects are mainly described. First, it is investigated whether the walkability of the four experiment sites can be distinguished by the MaxLE values measured by using an IMU sensor. Second, the relationship between walkability measured by MaxLE and the perceived walkability (subjective rating) is examined.
3.1. MaxLE-Based Walkability Measurement
In this study, the method for calculating a MaxLE value is employed. However, as the length of each experimental site is approximately 250 m, a single MaxLE value measured through ten walking cycles does not indicate the walkability of each experimental site. Therefore, the total walking of individual subjects is divided into ten walking cycle units (ten strides) to obtain the MaxLE value. In the analysis phase, the window size is determined as the length of ten strides for measuring Max LE. If the average step length of the elderly is 50 cm (the average stride length is 1 m), approximately 25 MaxLE values (25 windows) can be obtained in the length of 250 m (one experiment site). A total of 20 MaxLE values are obtained from the median section, as shown in Figure 3.
Figure 4 shows an example of walking data collected from four experimental sites. In the case of Site 1 (Figure 4a), Site 2 (Figure 4b), and Site 4 (Figure 4d), the walking patterns are continuous without significant change. In contrast, in the area marked with a red box in Site 3 (Figure 4c), the walking pattern is different from that shown in the initial sample (x-axis 1–1000 samples). At this point (red box in Figure 4c), the subject was walking along the mixed road and avoiding a two-wheeled vehicle and a small car, as shown in Figure 4e. For the avoidance, the consistency of the walking pattern of the subject was lower than that of other sites.
The effects of the walking environment can be found more clearly in the results of calculating MaxLE of the subjects, and the results are presented in Table 2. In Table 2, the average MaxLE value of each site was the highest (1.659) at Site 3 and the lowest (0.908) at Site 1 (urethane pavement walkway in the park). In addition, in the case of Site 2 (1.166) and Site 4 (1.275), both places have separate lanes and a sidewalk, so there is less than 10% of difference compared to the difference between the MaxLE values of Site 1 and Site 3. However, in the case of the test Site 4, there are numerous sections where the pedestrian path (sidewalk) becomes narrow because of illegal parking on the sidewalk.
Examining the individual subjects, the highest MaxLE value is generally found in Site 3, and then the value decreases in the order of Sites 4, 2, and 1. Except for Male 07 and Female 15 (MaxLE in Site 4 was higher than that in Site 2), the 28 elderly subjects show the same trend. A notable point can be found at individual MaxLE values focusing on Site 1 and Site 3. During the experiment, the MaxLE value is approximately 1.6 times higher for seven subjects who participated in a two-wheeled or car-free environment (no car-passing during experiment). In addition, when a two-wheeled vehicle or a vehicle passes during the experiment, the MaxLE values of Site 3 tend to be about twice as large as those of Site 1.
3.2. Walkability Measured by Subjective Rating
After walking in each site, each subject was asked to assess the walkability—how comfortable the site was for walking—on a 1–9 scale, with 1 meaning “not comfortable at all” and 9 indicating “the most comfortable” walking environment. The subjective rating results are listed in Table 3. Looking at the mean of the subjective rating at each site, the results show a similar trend with the measured value based on MaxLE. Site 3 is the lowest at 2.67, and the values increase in the order of Site 4, Site 2, and Site 1. Even if analyzed by individual, most sites are evaluated in the same order. However, some aspects were given the same scores in Sites 2 and 4. This may be caused by the difficulty to distinguish different aspects in similar sites.
3.3. Analysis of the MaxLE and Subjective Rating in the View of Walkability
In this section, two measurements (MaxLE and subjective rating) are analyzed based on the results from the experiments conducted in the study. First, it is investigated whether MaxLE values can distinguish each site (walking environment). To do this, a t-test is conducted to classify the collected MaxLE values for each site. With a total of 30 subjects and 20 MaxLE values per person in each site, one site can be regarded as a set of 600 MaxLE values. A total of six t-tests were conducted by paired comparison for each site. For the t-test, the Durbin–Watson test on 600 data (MaxLE values) for each site was first conducted to confirm that there was no autocorrelation (the Durbin–Watson statistics of the four sites were between 1.998 and 2.092). In the test, all p-values were less than 0.001. This means that each site has a different MaxLE value, which means that the MaxLE value may distinguish different walking environments.
Although the MaxLE values can distinguish different walking environments, this may not guarantee that the MaxLE values represent the walking convenience. Therefore, this study examines the relationship between MaxLE values and subjective rating results for each test site. First, the Pearson correlation coefficient was obtained to analyze the correlation between MaxLE (Table 2) and the subjective rating (Table 3). The Pearson correlation coefficient was calculated as −0.520 (p < 0.001). The coefficient value was negative because the lower the value of MaxLE, the higher the walking stability. Further, the higher the value of the subjective rating, the more comfortable the subject was. The correlation analysis result shows that the MaxLE value has a high correlation with the walkability assessed by the actual pedestrians’ bodily responses. Considering that MaxLE is a measure of walking stability, walkability can also be inferred from MaxLE values.
4. Discussion
The previous section demonstrates that MaxLE can be used to measure walkability of different walking environments by utilizing elderly people’s bodily responses. This section will provide further discussions regarding (1) the meaning of incorporating actual users in walkability measurement, (2) limitations and future research, and (3) potential use of our proposed method in urban environment management.
4.1. The Meanings of Incorporating Actual Users in Walkability Measurement
Our proposed method is not aimed at replacing existing methods or concepts of current walkability measurement methods. The term “walkability” includes various sets of concepts, such as population density, land-use mix, access to recreational facilities, street patterns, sidewalk coverage, vehicular traffic, crime, and others (e.g., built environment design, public transit, and slope) [39]. All these mentioned concepts affect neighboring walkability. As a vision of an additional supportive tool, the suggested method and its results can improve the richness in the analysis of a built environment and its walkability by incorporating the actual users’ behaviors. Incorporating the actual users’ behaviors into the walkability measurement can have additional benefits for current vision-based methods such as detecting potholes or cracked bricks. Current vision-based methods are effective as cracks and potholes are detected after images are analyzed by machine learning or artificial intelligence (AI). Despite their effectiveness, the vision-based methods do not estimate how actual users respond to the detected cracks and potholes because the methods are developed based on how cracks and potholes are determined by existing regulations [40]. Therefore, our proposed method can fill the gap between current walkability measurement and incorporation of actual users’ behaviors. Moreover, the elderly’s behaviors on walkways can be used to provide an additional method in current walkability measurement.
4.2. Limitations and Future Research
This study explores the feasibility of employing a physiological sensing for measuring walkability. Even though the outcomes supported the feasibility of the suggested method, there may be several difficulties that limit its direct application in the real world. In this study, the IMU sensor embedded in a smartphone was attached to a participant’s lower back. Attachment of the sensor to any participant’s lower back is not feasible in actual use. As an alternative, it may be possible to carry a smartphone in a side pocket of tight trousers (jeans), similar to the procedure in a previous study [11]. However, the elderly who participated in this study usually wore loose pants. Thus, there is considerable noise in the data from smartphone shaking in such pockets. Thus, a future study should deal with this problem by applying filtering methods. In addition, there is a clear need for further investigation of other factors affecting walkability, such as population density and land-use mix. Our experiment solely focused on the disturbances of a specific road or walkways. However, it is obvious that other factors should be incorporated in the walkability measurement as a pedestrian’s bodily responses are affected by not only a specific road condition but also the surrounding built environments [41]. In a future study, the diverse factors affecting walkability will be further investigated.
4.3. Envisioning the Use of the Suggested Method in Urban Environment Management
The current walkability measurement is usually conducted by trained inspectors from governmental agencies. Despite the importance of an age-friendly environment, the intervals between inspections are generally long owing to staffing and budget limitations. Thus, the current practice does not adapt well to changes in the walking environment. Further, the trained inspectors are usually not seniors, thus, they may have difficulties in investigating the suitability of a walking environment for the elderly. In contrast to the current practice, the approach suggested herein measures walkability based on the bodily responses of participating elderly pedestrians. Whenever a participating elderly pedestrian walks along a street, the street is continuously evaluated. Furthermore, collective data from several elderly pedestrians can continuously measure and compare various streets. Based on the outcomes of this study, the author envisions that a human’s daily activities will be used to continuously monitor our urban environment. A good example of crowdsourced data collection for walkability improvement is Project Sidewalk [42]. Although Project Sidewalk is intended for wheelchair users and uses a vision-based approach with Google Street View, the crowdsourced data collection approach of the study motivates the potential use of this study. Considering the high use of smartphones across all generations including the elderly, our proposed method can be applied to monitor and assess walkability from a viewpoint of crowdsourced sensing. To introduce the concept of Project Sidewalk into this study, a tool that can collect and transmit data is needed. Human behaviors are continuously collected and monitored through sensors such as those in a smartphone. Then, the collected data are analyzed, and the information about the urban environment that needs improvement is delivered to relevant organizations. Based on this, related organizations improve the environment. To do this, a sensor is required to collect and transmit citizen data. To meet these requirements, a smartphone was selected to collect the walking behavior data of the subjects in this study. The reasons for using a smartphone among various wearable devices are as follows. First, the smartphone can collect information on the walking behavior of the subject using an IMU. Second, most smartphones have the ability to specify the location on the device itself. In particular, as walking is mainly performed in external activities, the position of the subject can be specified through the global positioning system (GPS) of the smartphone. Lastly, as smartphones can transmit and receive data, expanding the field of monitoring of the urban environment in the future is possible.
5. Conclusions
An age-friendly environment is essential for elderly people to be active members of society. Among the various elements that make up an age-friendly environment, the walking environment is one of the most closely related to daily life. To create an elderly-friendly walking environment, it is necessary to measure whether the walking environment is suitable for the elderly. Although various efforts have been made to measure the walking environment, the conventional measuring method has the disadvantage that the physical response of the actual user is not sufficiently reflected.
Therefore, the purpose of this study is to investigate whether the walking environment can be evaluated based on the actual pedestrian behavior using wearable sensors. For this purpose, four different walking environments and 30 elderly people over 65 years were recruited. In the experiment, data related to the walking activities of pedestrians were collected through a smartphone attached to the waist. Based on this data, MaxLE values were calculated to represent the walking stability. The collective MaxLE values of the individual subjects showed that they could distinguish different walking environments, and they also showed a high correlation with the subjective ratings of the elderly participants in the actual experiments. This shows that MaxLE can be applied to measure walking convenience.
However, considering that only four walking environments were measured in this study as the test objects, it would be necessary to further verify these results through experiments in various walking environments. Although this study confirms the possibility of distinguishing the pedestrian walking environments on a street level, it does not confirm the possibility of identifying a point (e.g., cracked bricks or holes on the sidewalk) where improvements are needed. As the next stage of this study, a smartphone-based system will be developed to enhance the applicability of the suggested approach to real-world applications.
Funding
This research was supported by the Basic Science Research Program through the National Research Foundation of Korea (NRF) funded by the Ministry of Education (NRF- 2018R1D1A1B07048638).
Conflicts of Interest
Data generated or analyzed during the study are available from the corresponding author by request. The author declares no conflict of interest.
References
- Park, J.; Lee, S.; Yoo, S.H.; Jun, K.; Yeom, J.; Sung, M.; Son, I.; Lee, H.Y.; Suh, J.; Choi, H.; et al. The Socioeconomic Impact of Low Fertility and Population Aging on Family Structure; Korea Institute for Health and Social Affairs: Seoul, Korea, 2017. [Google Scholar]
- Mancini, J.A.; Orthner, D.K. Leisure time, activities, preferences, and competence: Implications for the morale of older adults. J. Appl. Gerontol. 1982, 1, 95–103. [Google Scholar] [CrossRef]
- Riddick, C.C. Leisure satisfaction precursors. J. Leis. Res. 1986, 18, 259–265. [Google Scholar] [CrossRef]
- Kelly, J.R. Activity and Aging: Staying Involved in Later Life; Sage Publications Newbury Park: Thousand Oaks, CA, USA, 1993. [Google Scholar]
- Kelly, J.R. Freedom to Be: A New Sociology of Leisure; Routledge: Abingdon, UK, 2019. [Google Scholar]
- WHO. Age-Friendly Environments. Available online: http://www.who.int/ageing/age-friendly-environments/en/ (accessed on 25 February 2020).
- Cerin, E.; Saelens, B.E.; Sallis, J.F.; Frank, L.D. Neighborhood environment walkability scale: Validity and development of a short form. Med. Sci. Sports Exerc. 2006, 38, 1682–1691. [Google Scholar] [CrossRef] [Green Version]
- Systematic Pedestrian and Cycling Environmental Scan (SPACES) Instrument. Available online: https://www.midss.org/content/systematic-pedestrian-and-cycling-environmental-scan-spaces-instrument (accessed on 3 March 2020).
- Clifton, K.J.; Smith, A.D.L.; Rodriguez, D. The development and testing of an audit for the pedestrian environment. Landsc. Urban Plan. 2007, 80, 95–110. [Google Scholar] [CrossRef]
- Hoehner, C.M.; Ivy, A.; Ramirez, L.K.B.; Handy, S.; Brownson, R.C. Active neighborhood checklist: A user-friendly and reliable tool for assessing activity friendliness. Am. J. Health Promot. 2007, 21, 534–537. [Google Scholar] [CrossRef]
- Kim, H.; Ahn, C.R.; Yang, K. A people-centric sensing approach to detecting sidewalk defects. Adv. Eng. Inform. 2016, 30, 660–671. [Google Scholar] [CrossRef] [Green Version]
- Campbell, A.T.; Eisenman, S.B.; Lane, N.D.; Miluzzo, E.; Peterson, R.A.; Lu, H.; Zheng, X.; Musolesi, M.; Fodor, K.; Ahn, G.-S.; et al. The rise of people-centric sensing. IEEE Internet Comput. 2008, 12, 12–21. [Google Scholar] [CrossRef]
- Lu, H.; Pan, W.; Lane, N.D.; Choudhury, T.; Campbell, A.T. SoundSense: Scalable sound sensing for people-centric applications on mobile phones. In Proceedings of the 7th International Conference on Mobile Systems, Applications, and Services, Krakow, Poland, 22 June 2009; pp. 165–178. [Google Scholar]
- Hussain, A.; Wenbi, R.; da Silva, A.L.; Nadher, M.; Mudhish, M. Health and emergency-care platform for the elderly and disabled people in the Smart City. J. Syst. Softw. 2015, 110, 253–263. [Google Scholar] [CrossRef]
- Sofia, R.; Firdose, S.; Lopes, L.A.; Moreira, W.; Mendes, P. NSense: A people-centric, non-intrusive opportunistic sensing tool for contextualizing nearness. In Proceedings of the 2016 IEEE 18th International Conference on e-Health Networking, Applications and Services (Healthcom), Munich, Germany, 14–17 September 2016; pp. 1–6. [Google Scholar]
- Mednis, A.; Strazdins, G.; Zviedris, R.; Kanonirs, G.; Selavo, L. Real time pothole detection using android smartphones with accelerometers. In Proceedings of the 2011 International Conference on Distributed Computing in Sensor Systems and Workshops (DCOSS), Barcelona, Spain, 27–28 June 2011; pp. 1–6. [Google Scholar]
- Kim, H.; Ahn, C.R.; Yang, K. Identifying safety hazards using collective bodily responses of workers. J. Constr. Eng. Manag. 2017, 143, 04016090. [Google Scholar] [CrossRef]
- Joo, S.; Oh, C. A novel method to monitor bicycling environments. Transp. Res. Part A Policy Pract. 2013, 54, 1–13. [Google Scholar] [CrossRef]
- Mourcou, Q.; Fleury, A.; Dupuy, P.; Diot, B.; Franco, C.; Vuillerme, N. Wegoto: A smartphone-based approach to assess and improve accessibility for wheelchair users. In Proceedings of the 2013 35th Annual International Conference of the IEEE Engineering in Medicine and Biology Society (EMBC), Osaka, Japan, 3–7 July 2013; pp. 1194–1197. [Google Scholar]
- Ai, C.; Tsai, Y. Automated sidewalk assessment method for americans with disabilities act compliance using three-dimensional mobile lidar. Transp. Res. Rec. 2016, 2542, 25–32. [Google Scholar] [CrossRef]
- Kim, J.-H. Reliability and validity of gait assessment tools for elderly person. J. Korean Phys. Ther. 2009, 21, 41–48. [Google Scholar]
- Noland, R.B.; Park, H.; Von Hagen, L.A.; Chatman, D.G. A mode choice analysis of school trips in New Jersey. J. Transp. Land Use 2014, 7, 111–133. [Google Scholar] [CrossRef]
- Park, H.; Noland, R.B.; Lachapelle, U. Active school trips: Associations with caregiver walking frequency. Transp. Policy 2013, 29, 23–28. [Google Scholar] [CrossRef]
- Bisadi, M.; Kim, H.; Ahn, C.R.; Nam, Y. Effects of physical disorders in neighborhoods on pedestrians’ physiological responses. In Proceedings of the Computing in Civil Engineering 2017: Information Modeling and Data Analytics, Seattle, WA, USA, 25–27 June 2017; pp. 183–190. [Google Scholar]
- Buzzi, U.H.; Stergiou, N.; Kurz, M.J.; Hageman, P.A.; Heidel, J. Nonlinear dynamics indicates aging affects variability during gait. Clin. Biomech. 2003, 18, 435–443. [Google Scholar] [CrossRef]
- England, S.A.; Granata, K.P. The influence of gait speed on local dynamic stability of walking. Gait Posture 2007, 25, 172–178. [Google Scholar] [CrossRef] [PubMed] [Green Version]
- Leipholz, H. Stability Theory: An Introduction to the Stability of Dynamic Systems and Rigid Bodies; Springer: Berlin/Heidelberg, Germany, 2013. [Google Scholar]
- Jebelli, H.; Ahn, C.R.; Stentz, T.L. Fall risk analysis of construction workers using inertial measurement units: Validating the usefulness of the postural stability metrics in construction. Saf. Sci. 2016, 84, 161–170. [Google Scholar] [CrossRef]
- Jebelli, H.; Ahn, C.R.; Stentz, T.L. The validation of gait-stability metrics to assess construction workers’ fall risk. In Proceedings of the International Conference on Computing in Civil and Building Engineering, Orlando, FL, USA, 23–25 June 2014; pp. 997–1004. [Google Scholar]
- Rosenstein, M.T.; Collins, J.J.; De Luca, C.J. A practical method for calculating largest Lyapunov exponents from small data sets. Phys. Nonlinear Phenom. 1993, 65, 117–134. [Google Scholar] [CrossRef]
- Wolf, A.; Swift, J.B.; Swinney, H.L.; Vastano, J.A. Determining Lyapunov exponents from a time series. Phys. Nonlinear Phenom. 1985, 16, 285–317. [Google Scholar] [CrossRef] [Green Version]
- Mehdizadeh, S. The largest Lyapunov exponent of gait in young and elderly individuals: A systematic review. Gait Posture 2018, 60, 241–250. [Google Scholar] [CrossRef] [PubMed]
- Bisi, M.C.; Riva, F.; Stagni, R. Measures of gait stability: Performance on adults and toddlers at the beginning of independent walking. J. Neuroeng. Rehabil. 2014, 11, 131. [Google Scholar] [CrossRef] [PubMed] [Green Version]
- Kugiumtzis, D.; Christophersen, N.D. State Space Reconstruction: Method of Delays vs Singular Spectrum Approach; University of Oslo: Oslo, Norway, 1997. [Google Scholar]
- Dingwell, J.B.; Cusumano, J.P. Nonlinear time series analysis of normal and pathological human walking. Chaos Interdiscip. J. Nonlinear Sci. 2000, 10, 848–863. [Google Scholar] [CrossRef] [PubMed]
- Abarbanel, H.D.; Kennel, M.B. Local false nearest neighbors and dynamical dimensions from observed chaotic data. Phys. Rev. E 1993, 47, 3057. [Google Scholar] [CrossRef] [PubMed]
- Kantz, H.; Schreiber, T. Nonlinear Time Series Analysis; Cambridge University Press: Cambridge, UK, 2004; Volume 7. [Google Scholar]
- Rosenstein, M.T.; Collins, J.J.; De Luca, C.J. Reconstruction expansion as a geometry-based framework for choosing proper delay times. Phys. Sect. D 1994, 73, 82–98. [Google Scholar] [CrossRef]
- Weiss, R.L.; Maantay, J.A.; Fahs, M. Promoting active urban aging: A measurement approach to neighborhood walkability for older adults. Cities Environ. 2010, 3, 12. [Google Scholar] [CrossRef]
- Cheng, H.D.; Shi, X.J.; Glazier, C. Real-time image thresholding based on sample space reduction and interpolation approach. J. Comput. Civ. Eng. 2003, 17, 264–272. [Google Scholar] [CrossRef]
- Kim, J.; Ahn, C.R.; Nam, Y. The influence of built environment features on crowdsourced physiological responses of pedestrians in neighborhoods. Comput. Environ. Urban Syst. 2019, 75, 161–169. [Google Scholar] [CrossRef]
- Saha, M.; Saugstad, M.; Maddali, H.T.; Zeng, A.; Holland, R.; Bower, S.; Dash, A.; Chen, S.; Li, A.; Hara, K.; et al. Project sidewalk: A web-based crowdsourcing tool for collecting sidewalk accessibility data at scale. In Proceedings of the 2019 CHI Conference on Human Factors in Computing Systems, Glasgow, UK, 4–9 May 2019; pp. 1–14. [Google Scholar]
Figure 1.
Overview of Experiment: (a) experiment sites; and (b) example of an equipped subject. Note: (Site 1) pedestrian walkway in the park: urethane pavement; (Site 2) sidewalk (1): no illegal parking; (Site 3) mixed traffic road: no sidewalk with illegal parking; (Site 4) sidewalk (2): illegal parking (on sidewalk).
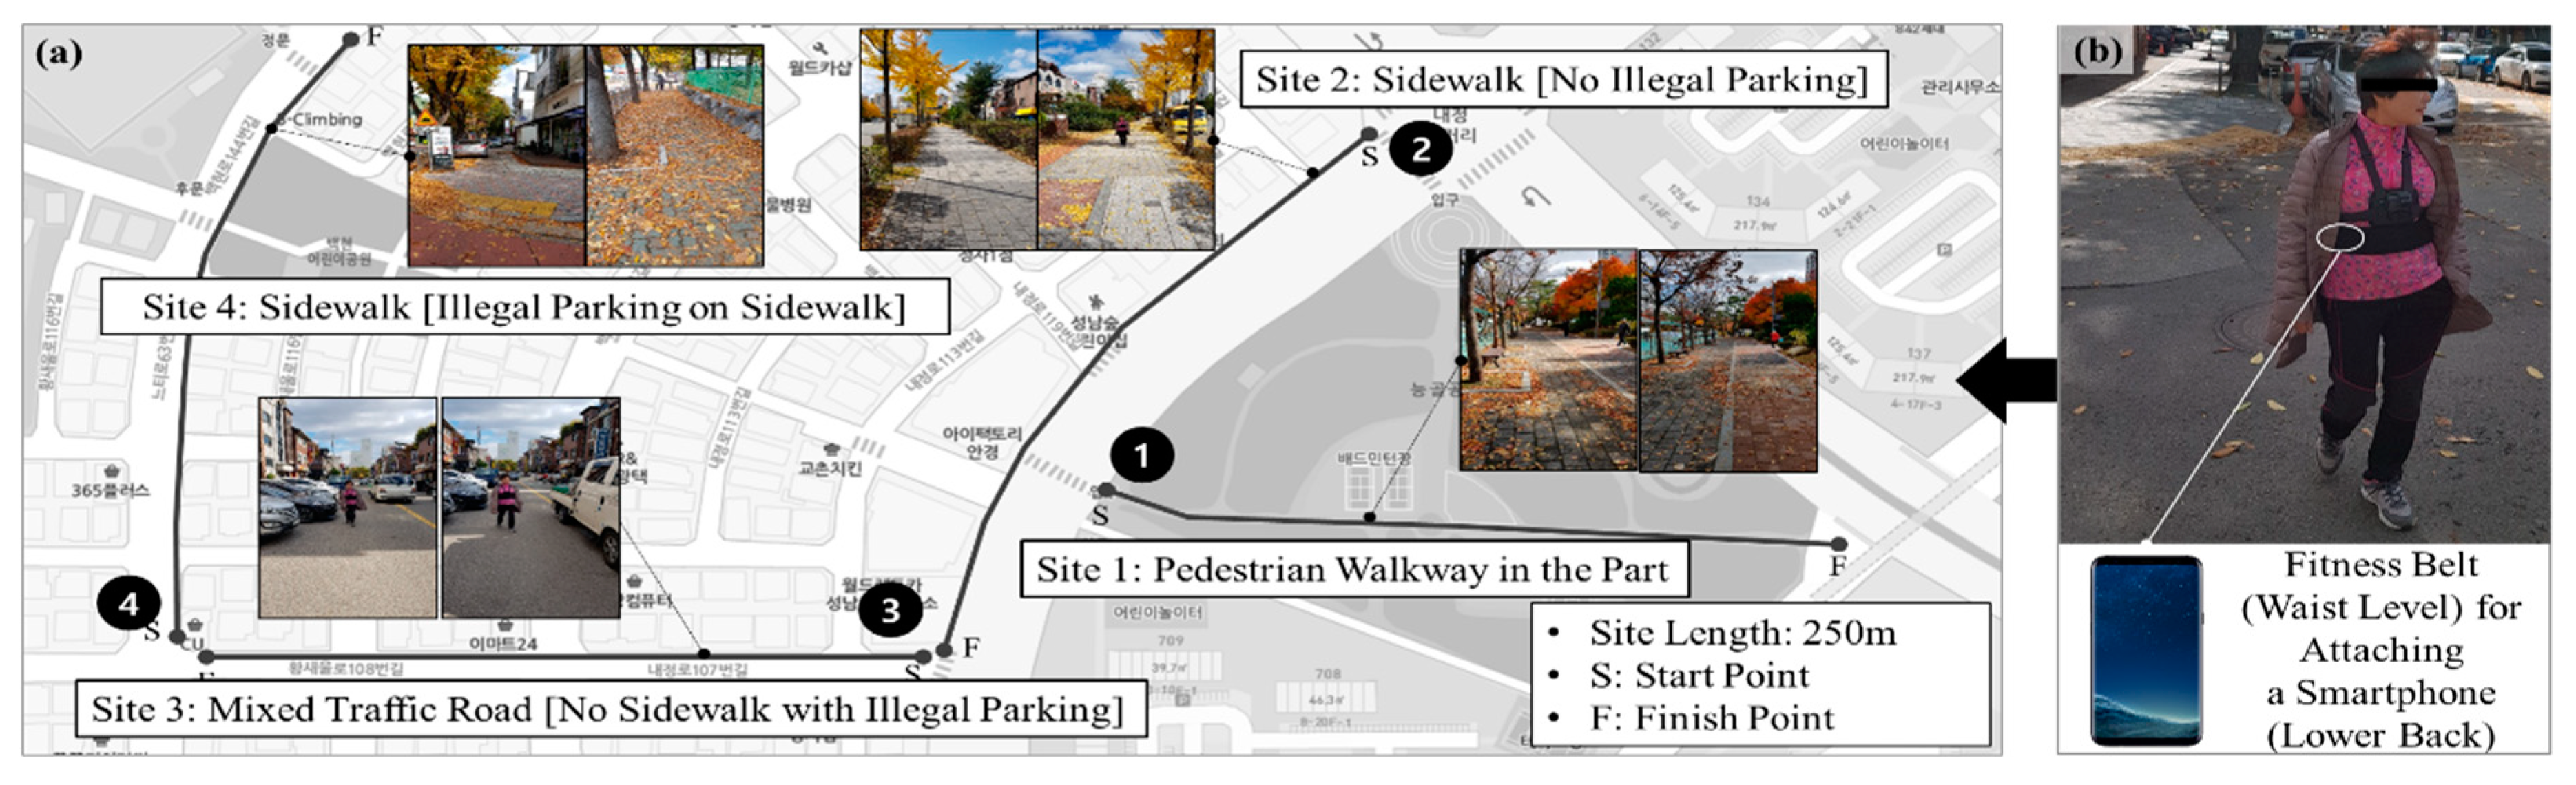
Figure 2.
MaxLE calculation process: (a) detection of gait cycle; (b) calculating an embedding dimension, and (c) calculating MaxLE.
Figure 2.
MaxLE calculation process: (a) detection of gait cycle; (b) calculating an embedding dimension, and (c) calculating MaxLE.

Figure 3.
Process of measuring MaxLE of a specific experimental site.
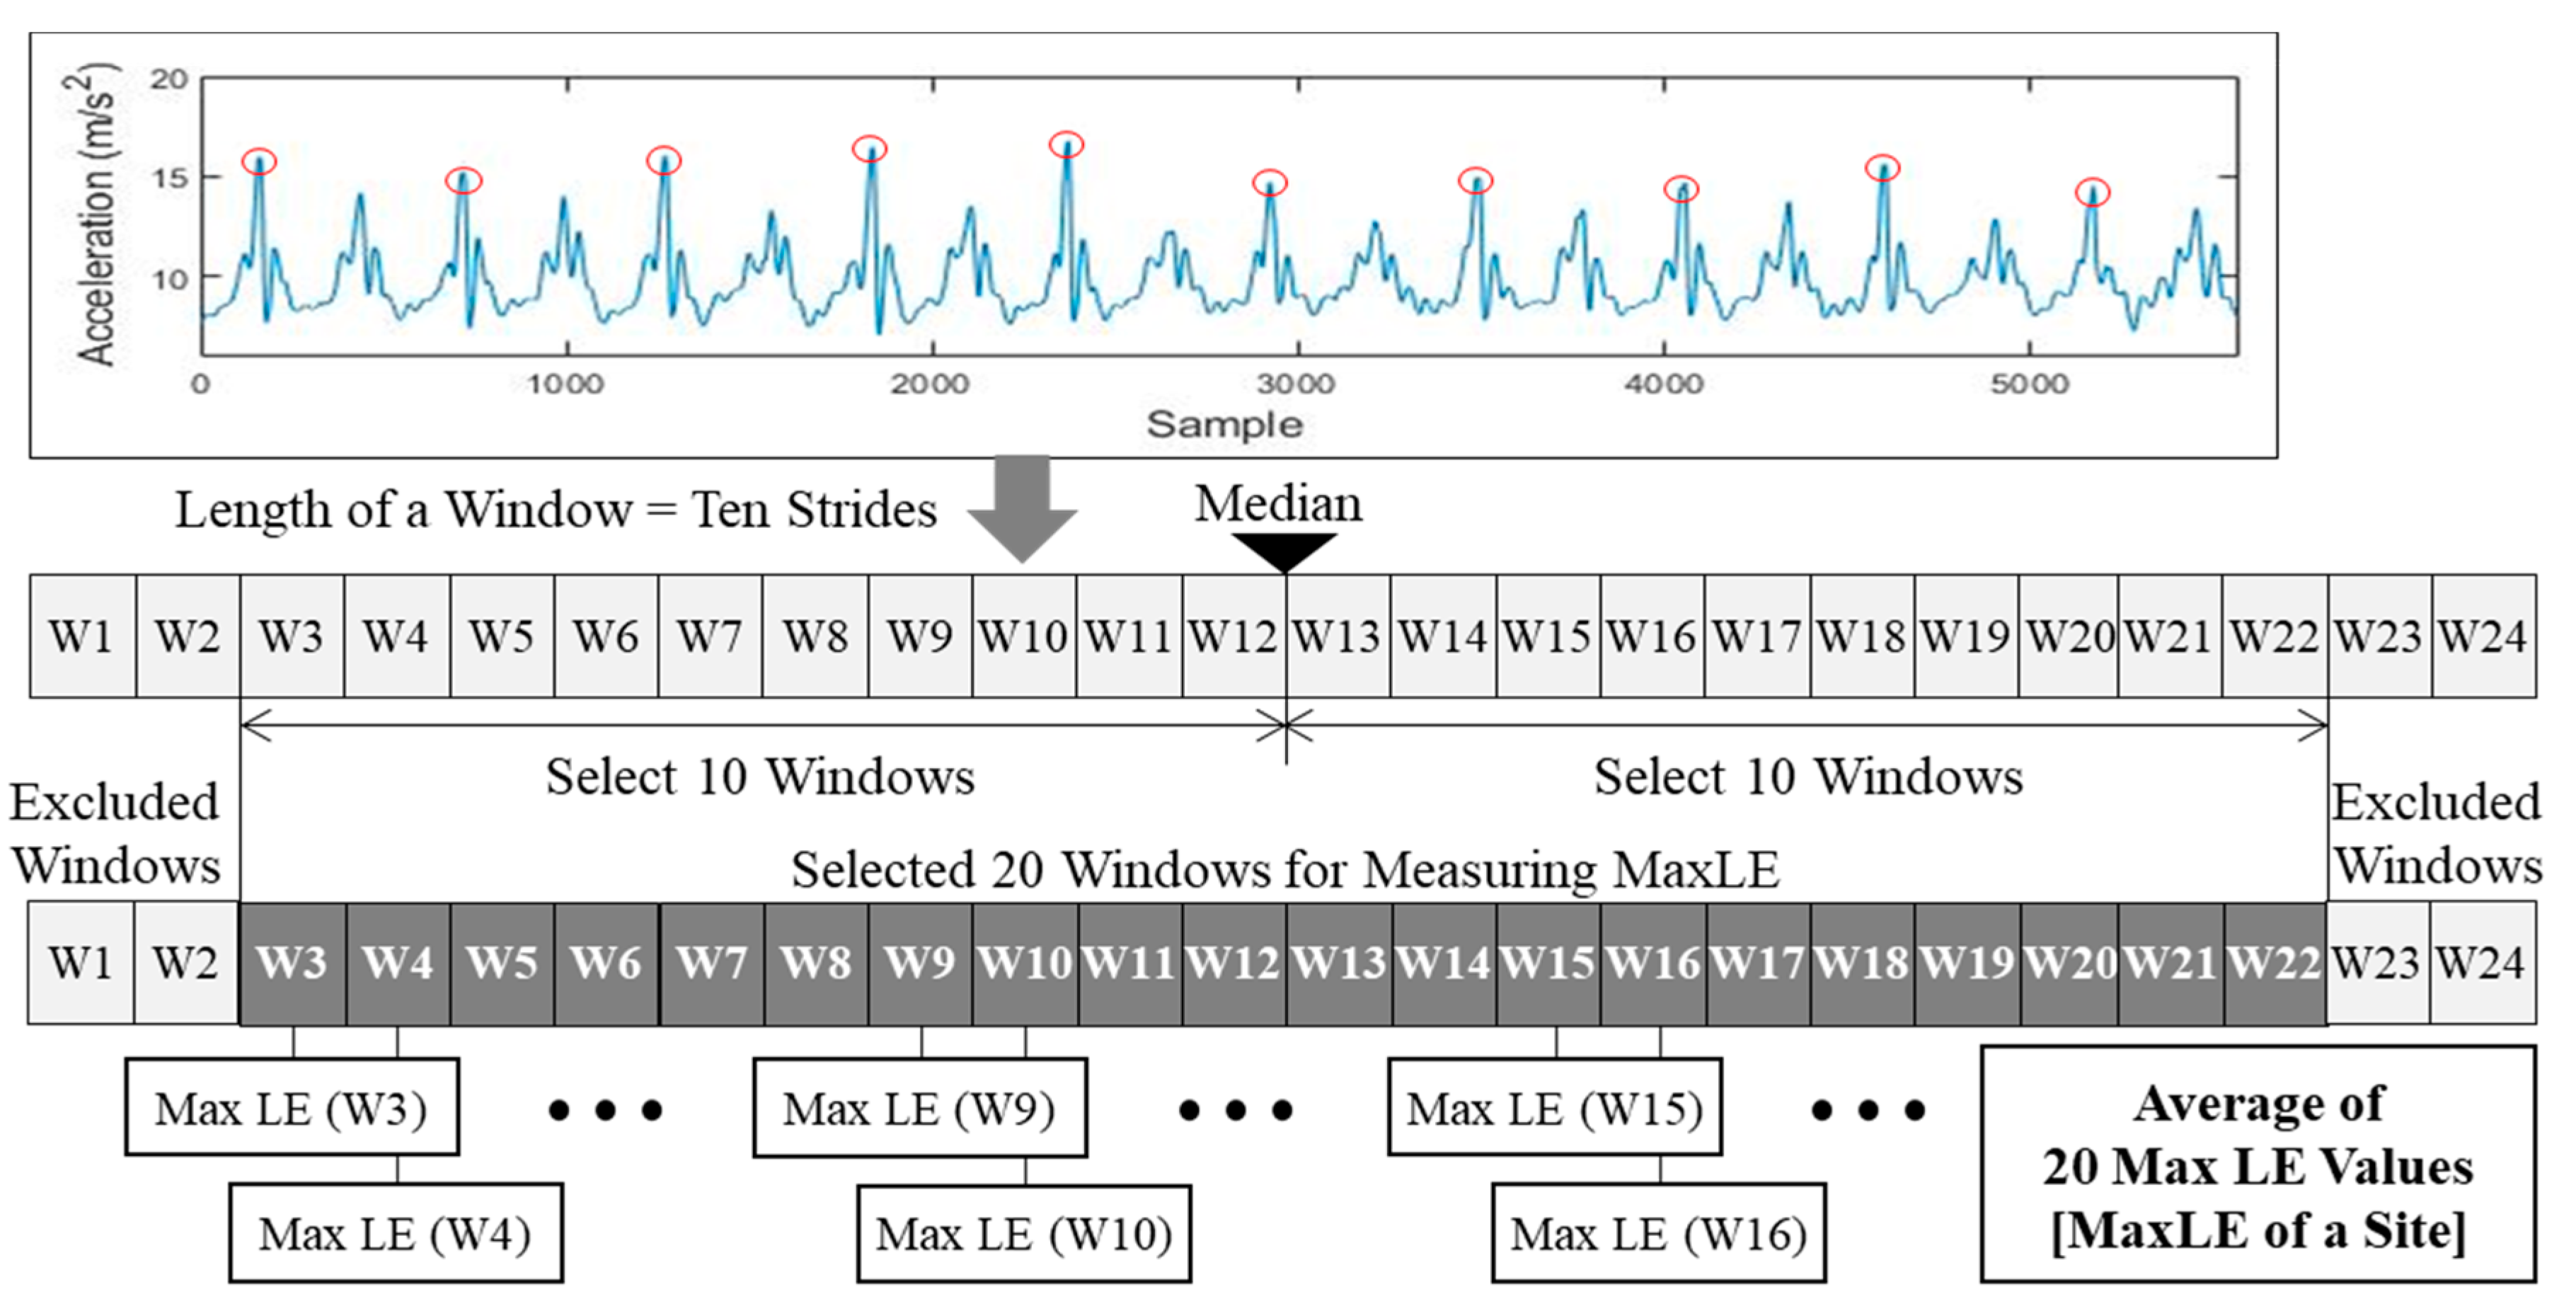
Figure 4.
Gait data collected from IMU: (a) gait data on Site 1; (b) gait data on Site 2; (c) gait data on Site 3; (d) gait data on Site 4, and (e) scenes of abnormal gait cycles (car passing).
Figure 4.
Gait data collected from IMU: (a) gait data on Site 1; (b) gait data on Site 2; (c) gait data on Site 3; (d) gait data on Site 4, and (e) scenes of abnormal gait cycles (car passing).


Table 1.
Participant information.
| Information | Male (14 Persons) | Female (16 Persons) | |
|---|---|---|---|
| Height (cm) | Mean (SD) | 167.71 (6.12) | 154.56 (5.92) |
| Weight (kg) | Mean (SD) | 68.14 (5.85) | 64.25 (8.25) |
| Shoe Size (mm) | Mean (SD) | 250.71(10.33) | 226.88 (8.27) |
| Age (years) | Mean (SD) | 69.71 (4.68) | 68.06 (2.56) |
Table 2.
MaxLE values of the elderly by sites.
| Subject | MaxLEs on Site 1 | MaxLEs on Site 2 | MaxLEs on Site 3 | MaxLEs on Site 4 | ||||
|---|---|---|---|---|---|---|---|---|
| Mean | SD | Mean | SD | Mean | SD | Mean | SD | |
| Male 01 | 1.137 | 0.012 | 1.442 | 0.019 | 2.332 | 0.158 | 1.691 | 0.015 |
| Male 02 | 1.393 | 0.017 | 1.677 | 0.018 | 2.471 | 0.177 | 1.935 | 0.016 |
| Male 03 | 1.279 | 0.017 | 1.586 | 0.020 | 2.375 | 0.138 | 1.723 | 0.017 |
| Male 04 | 0.863 | 0.011 | 1.197 | 0.014 | 1.538 | 0.103 | 1.280 | 0.015 |
| Male 05 | 0.777 | 0.010 | 0.967 | 0.008 | 1.626 | 0.121 | 1.114 | 0.009 |
| Male 06 | 0.618 | 0.007 | 0.793 | 0.009 | 1.169 | 0.084 | 0.847 | 0.010 |
| Male 07 | 0.842 | 0.010 | 1.095 | 0.010 | 1.387 * | 0.096 | 1.093 | 0.013 |
| Male 08 | 1.169 | 0.014 | 1.630 | 0.018 | 2.134 | 0.128 | 1.727 | 0.021 |
| Male 09 | 0.783 | 0.009 | 0.948 | 0.011 | 1.303 * | 0.098 | 1.099 | 0.012 |
| Male 10 | 0.693 | 0.008 | 0.864 | 0.009 | 1.146* | 0.085 | 1.003 | 0.011 |
| Male 11 | 0.998 | 0.013 | 1.337 | 0.006 | 1.747 | 0.0012 | 1.477 | 0.009 |
| Male 12 | 1.181 | 0.009 | 1.547 | 0.011 | 1.783 * | 0.007 | 1.724 | 0.008 |
| Male 13 | 1.245 | 0.012 | 1.619 | 0.012 | 1.980 | 0.010 | 1.656 | 0.010 |
| Male 14 | 1.566 | 0.022 | 1.989 | 0.020 | 2.772 | 0.183 | 2.036 | 0.016 |
| Female 01 | 0.863 | 0.011 | 1.065 | 0.012 | 1.751 | 0.112 | 1.278 | 0.013 |
| Female 02 | 0.975 | 0.009 | 1.219 | 0.014 | 1.886 | 0.129 | 1.346 | 0.016 |
| Female 03 | 0.995 | 0.008 | 1.332 | 0.014 | 1.627 * | 0.112 | 1.473 | 0.015 |
| Female 04 | 0.863 | 0.011 | 1.065 | 0.012 | 1.751 | 0.112 | 1.278 | 0.013 |
| Female 05 | 0.689 | 0.008 | 0.923 | 0.009 | 1.323 | 0.096 | 1.031 | 0.011 |
| Female 06 | 0.659 | 0.007 | 0.812 | 0.007 | 1.306 | 0.088 | 0.876 | 0.009 |
| Female 07 | 0.728 | 0.007 | 1.005 | 0.010 | 1.200 * | 0.096 | 1.060 | 0.012 |
| Female 08 | 0.975 | 0.012 | 1.187 | 0.014 | 1.617 * | 0.127 | 1.275 | 0.017 |
| Female 09 | 0.890 | 0.010 | 1.179 | 0.014 | 1.679 | 0.113 | 1.225 | 0.016 |
| Female 10 | 0.679 | 0.007 | 0.840 | 0.010 | 1.247 | 0.081 | 0.898 | 0.010 |
| Female 11 | 0.672 | 0.007 | 0.825 | 0.011 | 1.392 | 0.092 | 0.951 | 0.011 |
| Female 12 | 0.869 | 0.010 | 1.149 | 0.009 | 1.583 | 0.100 | 1.199 | 0.012 |
| Female 13 | 0.745 | 0.007 | 0.954 | 0.008 | 1.899 | 0.014 | 1.110 | 0.014 |
| Female 14 | 0.677 | 0.010 | 0.934 | 0.012 | 0.995 * | 0.016 | 0.948 | 0.012 |
| Female 15 | 0.552 | 0.013 | 0.756 | 0.009 | 0.99 | 0.009 | 0.723 | 0.018 |
| Female 16 | 0.857 | 0.011 | 1.054 | 0.013 | 1.748 | 0.015 | 1.166 | 0.009 |
| Mean | 0.908 | 1.116 | 1.659 | 1.275 | ||||
* No car-passing during experiment.
Table 3.
Subjective rating by sites.
| Subject | Subjective Rating on Site 1 | Subjective Rating on Site 2 | Subjective Rating on Site 3 | Subjective Rating on Site 4 | Mean |
|---|---|---|---|---|---|
| Male 01 | 9 | 6 | 2 | 5 | 5.50 |
| Male 02 | 9 | 7 | 4 | 6 | 6.50 |
| Male 03 | 9 | 5 | 3 | 5 | 5.50 |
| Male 04 | 9 | 8 | 4 | 5 | 6.50 |
| Male 05 | 9 | 6 | 2 | 3 | 5.00 |
| Male 06 | 7 | 5 | 1 | 4 | 4.25 |
| Male 07 | 8 | 5 | 1 | 3 | 4.25 |
| Male 08 | 9 | 5 | 5 | 3 | 5.50 |
| Male 09 | 7 | 6 | 2 | 6 | 5.25 |
| Male 10 | 7 | 5 | 4 | 6 | 5.50 |
| Male 11 | 8 | 7 | 1 | 6 | 6.25 |
| Male 12 | 7 | 6 | 1 | 5 | 5.75 |
| Male 13 | 9 | 7 | 2 | 6 | 6.75 |
| Male 14 | 9 | 6 | 2 | 6 | 6.5 |
| Female 01 | 9 | 7 | 3 | 5 | 6.00 |
| Female 02 | 9 | 7 | 2 | 6 | 6.00 |
| Female 03 | 8 | 6 | 3 | 5 | 5.50 |
| Female 04 | 8 | 7 | 1 | 4 | 5.00 |
| Female 05 | 9 | 5 | 1 | 4 | 4.75 |
| Female 06 | 7 | 5 | 4 | 5 | 5.25 |
| Female 07 | 7 | 6 | 5 | 6 | 6.00 |
| Female 08 | 9 | 8 | 4 | 6 | 6.75 |
| Female 09 | 8 | 6 | 3 | 5 | 5.50 |
| Female 10 | 9 | 6 | 4 | 5 | 6.00 |
| Female 11 | 9 | 7 | 2 | 5 | 5.75 |
| Female 12 | 9 | 8 | 2 | 4 | 5.75 |
| Female 13 | 9 | 7 | 4 | 4 | 6.00 |
| Female 14 | 9 | 7 | 3 | 5 | 6.00 |
| Female 15 | 8 | 7 | 3 | 6 | 6.00 |
| Female 16 | 9 | 8 | 2 | 6 | 6.25 |
| Mean | 8.40 | 6.37 | 2.67 | 5.00 | 5.72 |
© 2020 by the author. Licensee MDPI, Basel, Switzerland. This article is an open access article distributed under the terms and conditions of the Creative Commons Attribution (CC BY) license (http://creativecommons.org/licenses/by/4.0/).
Share and Cite
MDPI and ACS Style
Kim, H. Wearable Sensor Data-Driven Walkability Assessment for Elderly People. Sustainability 2020, 12, 4041. https://doi.org/10.3390/su12104041
AMA Style
Kim H. Wearable Sensor Data-Driven Walkability Assessment for Elderly People. Sustainability. 2020; 12(10):4041. https://doi.org/10.3390/su12104041
Chicago/Turabian StyleKim, Hyunsoo. 2020. "Wearable Sensor Data-Driven Walkability Assessment for Elderly People" Sustainability 12, no. 10: 4041. https://doi.org/10.3390/su12104041
Note that from the first issue of 2016, this journal uses article numbers instead of page numbers. See further details here.