Article

A Joint Stochastic/Deterministic Process with Multi-Objective Decision Making Risk-Assessment Framework for Sustainable Constructions Engineering Projects—A Case Study

by
Panagiotis K. Marhavilas
1,*,
Michael G. Tegas
2,
Georgios K. Koulinas
1 and
Dimitrios E. Koulouriotis
1
1
Department of Production and Management Engineering, Democritus-University of Thrace, Vasil. Sofias 1 St., 67132 Xanthi, Greece
2
Department of Engineering Project Management, Faculty of Science & Technology, Hellenic Open University, Parodos Aristotelous 18 St., 26335 Patra, Greece
*
Author to whom correspondence should be addressed.
Sustainability 2020, 12(10), 4280; https://doi.org/10.3390/su12104280
Submission received: 29 April 2020 / Revised: 20 May 2020 / Accepted: 21 May 2020 / Published: 23 May 2020

Abstract

:
This study, on the one hand, develops a newfangled risk assessment and analysis (RAA) methodological approach (the MCDM-STO/DET one) for sustainable engineering projects by the amalgamation of a multicriteria decision-making (MCDM) process with the joint-collaboration of a deterministic (DET) and a stochastic (STO) process. On the other hand, proceeds to the application of MCDM-STO/DET at the workplaces of the Greek construction sector and also of the fixed-telecommunications technical projects of OTE SA (that is, the Greek Telecommunications Organization S.A.) by means of real accident data coming from two official State databases, namely of “SEPE” (Labor Inspectorate, Hellenic Ministry of Employment) and of “IKA” (Social Insurance Institution, Hellenic Ministry of Health), all the way through the period of the years2009–2016.Consequently, the article’s objectives are the following: (i) The implementation and execution of the joint MCDM-STO/DET framework, and (ii) to make known that the proposed MCDM-STO/DET algorithm can be a precious method for safety managers (and/or decision-makers) to ameliorate occupational safety and health (OSH) and to endorse the sustainable operation of technical or engineering projects as well. Mainly, we mingle two different configurations of the MCDM method, initially the Analytical Hierarchy-Process (the typical-AHP), and afterwards the Fuzzy-Extended AHP (the FEAHP) one, along with the Proportional Risk Assessment Technique (PRAT) and the analysis of Time-Series Processes (TSP), and finally with the Fault-Tree Analysis (FTA).

1. Introduction

Taking into consideration that one of the intentions of “sustainable engineering” is to create structures that validate evolution without jeopardizing the natural environment’s quality, and also the coming generations’ capability to meet their own necessities, modern engineering tactics concentrate (among other options) on the systems’ design/operation in a manner that admits the sustainable usage of resources. Thus, decision-making processes have to be enhanced by techniques and methods which permit the decision-makers to use a broad variety of sustainable alternatives.
The protection of the employees’ health and safety in the workplace is a universally vital aspect, in parallel with the effort of enhancing the productivity and upgrading the sustainable development of a firm. Moreover, the World Health Organization (WHO) defines the sustainable development as a policy “to meet the needs of today’s global population without adversely affecting its health and the environment and without destroying (or endangering) the global resource base, and thus without jeopardizing the ability of the coming generations to meet their needs” [1,2,3].
Occupational accidents, on the one hand, have a significant impact upon human body-integrity, and affect the employees, business operation, and overall the sustainability performance of firms, and on the other hand, generate high expenses for the social health and insurance system of any country, and demote the society’s sustainability. Each corporation is progressively more concerned with the improvement of sustainability and occupational safety and health (OSH) performance, and this is attained by controlling OSH risks, in accordance with their OSH policy, and in the context of applying risk assessment and analysis (RAA) techniques and the state’s legislation. Besides, the Occupational Safety & Health Administration (OSHA) recognizes that actions to ensure occupational safety and health can be incorporated into sustainability efforts and take advantage of the dynamics of sustainability to make companies’ workplaces safer and healthier [3,4,5].
In this sense, the conception of sustainability is used as a frame to categorize existing and/or develop new OSH standards (e.g., ISO 45001, OSHAS 18001, etc.), and also to generate multitudinous efficacious and modern RAA techniques [5].
In general, the variety of RAA assessment methods is such that there are numerous proper approaches for most occasions, and plentiful studies build up hybrid models merging separate techniques. For example, RAA techniques are classified, on the one hand, into quantitative/qualitative/hybrid techniques, and on the other side, into deterministic and stochastic ones.
However, the examination of the scientific literature with reference to RAA methodologies unveils that every technique presents specific limitations or restrictions in its applicability to miscellaneous accidents, and consequently a separate (or solitary) technique: (i) Can’t generate either a realistic risk prediction model or a sufficient RAA process in the worksites, and (ii) can’t achieve the optimum risk-assessment result in the workplaces, but on the other hand, future prospects must focus: (i) On the joint estimation/forecasting process, and (ii) on the parallel utilization of a deterministic approach with a stochastic one [6,7,8,9,10].
The above topics constitute the research context of this study, and consequently, its foremost contribution is the under mentioned:(i) The implementation of an alternative RAA methodological framework for upgrading the OSH’s situation and sustainability of engineering projects by the combination of a multicriteria decision-making (MCDM) process with the joint collaboration of a stochastic (STO) and a deterministic (DET) process, and (ii) the application of it on the worksites of the Greek construction sector and of fixed-telecommunications technical projects of OTE SA (the Greek Telecommunications Organization SA), by means of real accident data.
The paper is organized into the subsequent sections: (1) Introduction, (2) literature survey, (3) development of the suggested methodological framework, (4) application of the new method on the constructions and telecom sector and analysis of their results, and (5) discussion of the main points and conclusions.

2. Literature Survey

Plenty of research studies have been conducted in copious construction industries contributing to the scientific field of OSH by revealing the features (advantages and disadvantages) and also presenting the implementation of numerous RAA techniques. Below, we conduct a survey of the scientific literature concerning RAA techniques, which are used in the OSH field along with the constructions sector, and which are concentrated, on the other hand, on several deterministic (DET), stochastic (STO), and MCDM processes (like PRAT, FTA, TSP, AHP, FEAHP, etc.), that have been incorporated in the newly proposed integrated-method. More explicitly, our study develops a novel method which incorporates three different types of techniques (DET, STO, and MCDM), so the presented literature survey covers these three special classes of techniques.
On the whole, RAA techniques are categorized into three significant groups (e.g., quantitative/qualitative/hybrid techniques) whereas another methodical categorization comprises the deterministic and the stochastic approaches [8,9,10,11,12,13,14,15,16,17].
More specifically, Marhavilas et al. (2011) [8], based on the literature’s examination, determined the dominant RAA methods, and categorized them into three principal classes, i.e., the qualitative, the quantitative, and the hybrid (semi-quantitative or qualitative–quantitative) methods, wherein the first ones are grounded mainly on the safety-managers’ capability, the second ones express the risk by a mathematical relation in conjunction with real accident data recorded in a workplace, and finally, the third ones are characterized by a high complexity due to their ad-hoc feature. A plethora of other works confirm the results of this study, and also the importance of its classification, like the articles of (i) da Costa et al. (2020) [18], Gul and Celik (2018) [19], AriamuthuVenkidasalapathy et al. (2018) [20], Ozkan and Uluta (2017) [21] (for quantitative RAA), (ii) Athar et al. (2019) [22], Sanmiquel-Pera et al. (2019) [23], Domínguez et al. (2019) [24] (for qualitative RAA), and (iii) Kharzi et al. (2020) [25], Cinar and Cebi (2020) [26], Mutlu et al. (2019) [27], Bora et al., (2019) [28], Kamsu-Foguem and Tiako (2017) [29], Zheng et al. (2017) [30], Mentes and Ozen (2015) [31] (for hybrid RAA).
One of the most practical and skillful numerical formula for evaluating the quantified risk (R) at workplaces is the proportional risk-assessment DET-technique (PRAT) which takes into consideration the severity (S) of a harm (i.e., the potential consequences of an accident), the occurrence likelihood (P) i.e., the probability factor of that harm, and the exposure factor [32,33,34,35,36,37]. This concept becomes operational, and hence many studies, like the papers of Gul and Celik (2018), Gul et al. (2018), Kokangül et al. (2017), Marhavilas (2015), Marhavilas et al. (2011b), Marhavilas and Koulouriotis (2008) [19,38,39,40,41,42] combined exposure-factors with likelihood-factors to arrive at the frequency (F), and to evaluate, on the one hand, the risk by
R = P S F
and consequently, unsafe OSH situations at worksites by means of exposure, which estimates the hazard’s occurrence frequency.
Continuing on, fault-tree analysis (FTA) and event-tree analysis (ETA) are, according to Marhavilas et al. (2014a, 2014b) [43,44], well known DET-methods and valuable analytic tools worldwide, which have been used successfully by reliability experts in failure-analysis and for the reliability and safety of complex technical-systems, and also of OSH-systems. Nowadays, many studies continue incorporating FTAs/ETAs in OSH RAA, like: (i) The work of Mutlu et al. (2019) [27], which depicts a OSH RAA approach in the textile industry by integrating FTA with Failure-Mode and Effect-Analysis (FMEA) and BIFPET, (ii) the articles of Babaei et al. (2018) [45] and Yasli and Bolat (2018) [46], which include FTA in fuzzy OSH RAA methods, (iii) the paper of Gul and Ak (2018) [47], which illustrates the collaboration of MCDM with FTA, (iv) the work of Fuentes-Bargues et al. (2017) [48], which combines Hazard and Operability (HAZOP) and FTA in risk analysis of fuel storage-terminals, and (v) the paper of Marhavilas et al. (2014a) [43], which physically embody FTA in DET OSH-RAA techniques.
Over and above that, the stochastic (STO) processes, like the Time-Series Processes (TSP), Markov-chains, etc., play an important role in the recognition of potential hazardous sources and also in the methodologies of accident analysis, RAA, prediction and modeling, and additionally their contribution in the analysis of accident tendency, and to the forecasting of the safety’s situation based on the real accident observations and/or data, is vital [7,17,49,50,51,52,53].
Moreover, there are many studies, in the relative scientific literature, that develop MCDM methods by hybridizing existing, very popular approaches, to improve results in risk assessments. Zheng et al. (2012) [54] employed a variation of fuzzy Analytical Hierarchy-Process (AHP) which uses trapezoidal fuzzy numbers, for risk evaluation under hot and humid environment conditions, and Fattahi and Khalilzadeh (2018) [55] introduced a framework for assessing risks in steel industry using Failure-Mode and Effect-Analysis (FMEA), fuzzy AHP, and Fuzzy Multi-Objective Optimization on the basis of Ratio Analysis (MULTIMOORA) methods. In the study of Mete (2019) [56], a hybrid fuzzy analytical hierarchy process and data envelopment analysis-based framework were proposed for managing uncertainty, while assessing risks in pipeline construction projects. Recently, Oturakci (2019) [57] introduced a novel fuzzy sets and Analytical Hierarchy Process based approach for environmental risks evaluation, while Yucesan and Kahraman (2019) [58] applied the Pythagorean fuzzy analytical hierarchy process method for assisting a team of experts to evaluate risks in hydroelectric power plants. In the study of Boral et al. (2020) [59], a new approach was developed which combines the Fuzzy Analytical Hierarchy Process with the modified FMAIRCA (Fuzzy Multi-Attribute Ideal Real Comparative Analysis) in order to improve the disadvantages of the FMEA technique, used for proactive risk assessment.
It is worth mentioning that there are numerous other published papers, pertaining to OSH management systems and to RAA techniques, and focusing on construction sites. Therefore, Marhavilas (2009, 2015) [40,60], Ardeshir et al. (2014) [61], Anil Kumar et al. (2015) [62], Marhavilas and Vrountas (2018) [63], and Koulinas et al. (2019a; 2019b) [3,64] presented the implementation of various OSH RAA techniques at workplaces of the constructions section.

3. The Suggested Methodological Framework

Figure 1 displays the flow sheet of the suggested RAA generic algorithmic framework, which couples a multicriteria decision-making (MCDM) process with both a stochastic (STO) and a deterministic (DET) process. More especially, we join the MCDM-AHP/Fuzzy-Extended AHP (FEAHP) techniques with the DET-PRAT and DET-FTA processes, and also with the STO-TSP method.
Consistent with this diagram, the real sequential data A(t) (for instance accident data) recorded at any workplace can be utilized firstly in the phase of hazard-identification, and subsequently in the DET-PRAT process for quantitatively calculating the risk as a function of time R(t). Moreover, the DET-TSP process can be applied in parallel with DET-PRAT process in order to achieve a joint-evaluation of their results. Particularly, when the time-series data A(t) are sufficient (according to Nyquist-Shannon’s sampling-theorem) with reference to a specific time-period, the generated by PRAT time-series R(t) could make-up inputs for TSP, which means they could be analyzed by miscellaneous substantial methods (like the moving-average one, the seasonal-adjustment, the auto-regression, the function-fitting one, etc.), unveiling in many cases significant features for the time-series variation of R(t) and also for the company’s RAA situation (such as a long-term trend, a periodicity, etc.).
It is worth noting that the combination of PRAT and TSP techniques can give, by the calculation of risk (R), the essential information to safety-managers in order to (i) identify (taking into consideration the calculated risk level) the most important sources of danger at the companies’ worksites, and also (ii) to achieve a preliminary ranking of them. Thus, the resulted ranking (1st ranking) can be precious for evaluating the urgency of investing a restricted budget in specific measures in order to attain the highest OSH-protection with the lowest cost.
To continue, the next segment in the above referred flow sheet is the MCDM one, which represents the application of a multicriteria decision-making technique, like the AHP and/or the FEAHP one, for accomplishing the final ranking (2md ranking) in the sources of danger defined at worksites, in order to achieve the finest (optimum) distribution of an investment budget (i.e., with the minimum cost) to appropriate measures reaching the best OSH-protection.
Ultimately, the proposed RAA generic algorithmic framework is completed by the application of the FTA process in order to: (i) Graphically illustrate possible occurrences, which can result in adverse events (the “base-events”), (ii) relate their sequences, which could lead to a “top-event”, and (iii) to calculate the occurrence likelihood of the “top-event”. Therefore, the occurrence-probability of the top-event is calculated by using the following equations:
P ( i = 1 n B i ) = i = 1 n P ( B i ) i = 1 n 1 j = i + 1 n P ( B i B j ) + i = 1 n 2 j = i + 1 n 1 k = j + 1 n P ( B i B j B k ) + ( 1 ) n 1 P ( B 1 B 2 B n )
or
P ( i = 1 n B i ) = 1 i = 1 n [ 1 P ( B i ) ]
and
P ( i = 1 n B i ) = i = 1 n [ P ( B i ) ]
where Bi (i = 1, …, n) are the identified (by FTA) “base-events”, and taking into account that the first (or equivalently the second) relation is used when the output-event is logically-valid (according to Boolean algebra) if one of the input-events applies (i.e., fulfilling an OR-Gate logical-operation), while the third relation is used when the output-event is logically-valid only if all input-events apply (i.e., through an AND-Gate Boolean-function).

4. Application of the Suggested Methodological Framework on the Constructions Sector

We proceed to the application of the novel methodological framework on the worksites of the Greek construction-sector(C-S)and of fixed-telecommunications technical-projects of OTE SA (the Greek Telecommunications Organization SA), by using real accident data recorded in two official State data sources, namely of “SEPE” (Labor Inspectorate, Hellenic/Greek Ministry of Employment) and of “IKA” (Social Insurance Institution, Hellenic/Greek Ministry of Health) with reference to the years 2009–2016.
The hazard identification (for instance, by HAZOP) and the risk analysis of the sources of danger (or deviations) existing at the worksites of the Greek constructions section are unveiled in Table 1, which depicts the deviations according to the classification of ESAW (European Statistics on Accidents at Work) by EU (2013) [65]. More specifically, the column “c” illustrates the description of the various hazards (or deviations) determined by the usage of “SEPE” and “IKA” statistical databases, while columns “b” and “a” showing the ESAW codes of the deviations, and the general types of the deviations (1st level of categorization), respectively.

4.1. Application of the PRAT and TSP Processes

The application of PRAT process was achieved by having calculated the risk (with its implementation equation 1), regarding all the hazard sources of Table 1, and using accident data from the above referenced databases (“SEPE” and “IKA”) throughout the period of 2009–2016.
In Figure 2, we display time-variations of the magnitude of risk (R) calculated by the PRAT and by means of real data of “SEPE”, through the years 2009–2016, that concern the most important hazard-source (i.e., the one with the highest risk) at the workplaces of the construction-sector (C-S) and also of the fixed-telecommunications technical-projects of OTE SA, which has been proven to be the risk-source of “slipping—stumbling and falling—fall of persons” (i.e., with ES-C#50).
In Figure 3, we illustrate time-profiles of risk (R) calculated by the PRAT and via accident data of “IKA”, during the same period of 2009–2016, that regard the most significant hazard-source at the worksites of the C-S and of the technical-projects of OTE SA as well, which has been proven to be the risk-source of “Loss of control (total or partial) of machine, means of transport or handling equipment, hand-held tool, object, animal”(i.e., with ES-C#40).
It is worth noting that the analysis by the TSP process of the time-profiles of the magnitude of R, concerning the deviation with ESAW-code of ES-C#50, shows (by the blue triangular symbols in the graphs ‘a’ and ‘b’ of Figure 2) the existence of a periodic fluctuation with a periodicity (T1) that is equal to ~2 years. This seems to be a permanent feature in the “behavior” of the ES-C#50 deviation at the workplaces of the C-S and OTE SA, because apart from the “SEPE” database, this periodicity obviously exists in the graphs ‘a’ and ‘b’ of Figure 4, which illustrates the R(t) profiles of ES-C#50 that were recorded at the same workplaces, but grounded, on the other hand, on the data of the “IKA” database.
Moreover, the time-profiles of the risk-value R, concerning the deviation of ES-C#40, illustrate (by the blue triangular symbols in the graphs ‘a’ and ‘b’ of Figure 3) the appearance of a periodic fluctuation with a periodicity (T2) equal to ~4 yrs, and accordingly the presence of a harmonic of T1≅2years, i.e., equivalent to T1.
Hence, the presence of a dominant periodic-component (~2yrs) in the most significant hazard source (taking into account the risk-value R) constitutes a steady characteristic for the dynamic behavior of a working environment (or working system), like the workplaces of the C-S and/or of the OTE fixed-telecommunications technical-projects, relatively to OSH safety.
What is more, the time-domain analysis of the time-series of the ES-C#50 deviation shows in its time-profiles (according to Figure 2a, Figure 4a,b) the appearance of a trend factor (or slope) with a negative inclination in the curve of averaging i.e., the average risk-value decreases at the constructions-sector workplaces, during the years 2009–2016, and only the profile of ES-C#50 in drawing 2b, presents a positive inclination or a soft increase in the curve of the risk-average at the workplaces of OTE SA. Besides, the analysis of the time-variations of the ES-C#40 hazard-source displays in its profiles (according to Figure 3a,b and Figure 5b) the appearance of a tendency factor with a negative slope in the curve of averaging, which means the average risk-value decreases at the construction-sector workplaces, during the years 2009–2016, and only the profile of ES-C#40 in drawing Figure 5a indicates a positive slope or an enhancement in the curve of the risk-average.
In addition, the comparison between Figure 2a and Figure 5a, and also between Figure 2b and Figure 5b, reveals that the profile of the deviation ES-C#50 presents all over the period 2009–2016 higher risk-values R in comparison with deviation ES-C#40, confirming that the most significant hazard source at the worksites of the C-S and SA is the ES-C#50 one, according to the “SEPE” database, contributing in this way to the 1st ranking of deviations (as stated by Figure 1). On the other hand, the comparison between Figure 3a and Figure 4a, and also between 3b and 4b, discloses that the profile of deviation ES-C#40 shows in the course of the period 2009–2016 greater risk-values in comparison with deviation ES-C#50, confirming that the most significant hazard-source at the worksites of the C-S and OTE SA is the ES-C#40 one, according to the “IKA” database, contributing to the 1st ranking of Figure 1, as well.
We note that the other hazard-sources (i.e., with ES-C #10–#30, and #60–#99) of Table 1 present noticeably lower risk-values R compared to the ones of ES-C#40 and ES-C#50, so the resulted deviation-ranking is: (i) ES-C#40 and ES-C#50, consistent with the “IKA” database, and (ii) ES-C#50 and ES-C#40, according to the “SEPE” database. Consequently, a second and more trustworthy ranking (denoted as 2nd ranking in Figure 1) of the hazard-sources (like the one applied by a MCDM method) is essential, which could be utilized by the safety-responsible (or managers) in the procedure of prioritizing investments in OSH-prevention measures. Inevitably, in the next section, we show the application of the MCDM process.

4.2. Application of the Typical-AHP and the Fuzzy-Extended-AHP MCDM-Processes

The concept of the Typical Analytical Hierarchy Process (AHP): The Typical-AHP, introduced by Saaty (1990) [66], is one of the most popular multicriteria decision making methods. While applying the AHP, the problem under study is modeled as a hierarchy, and the local and global weights are calculated with respect to each criterion and/or sub-criterion as an alternative of the problem. The method takes as input the judgments of the decision maker via linguistic variables, transforms them to numerical values using a scale, and applies pairwise comparisons for extracting the ranking of factors according to their importance. The major advantage of the AHP method is its integrated function for estimating the decision maker’s consistency of judgments, which is a key characteristic for producing reliable results. In that manner, the consistency ratio (CR) is calculated to monitor if the decision maker has a consistent axiom system and is not making judgments “at random”. Note that a pairwise comparison matrix is considered as consistent if its CR index is less than or equal to 10%.
The concept of Fuzzy-Extended-AHP Process (FEAHP): In the present study, the Fuzzy Extended AHP (FEAHP) proposed by Chang (1996) [67] is used for taking account of the uncertainty of the decision maker’s judgments. The FEAHP is a popular extension of AHP because of its “ease of use” feature and of its proven efficiency. In our approach, the only prerequisite from the decision maker are the judgments, which are assigned to quantitative values using the scale proposed by Lamata (2004) [68] and illustrated in Table 2. The corresponding Triangular Fuzzy Number (TFN) value is illustrated in the last column. Note that the value of the standard Saaty’s scale [66] is highlighted in bold letters.
The process works as described by Chang (1996) [57], and accordingly, the output triangular fuzzy numbers are transformed into crisp numbers with the average value approach by Zimmermann (2001) [69] as the defuzzification process. Thus, for a triangular fuzzy number M = (l,m,u), the corresponding crisp number C as:
C ( M ) = ( l + m + u ) / 3
Application of the typical-AHP and FEAHP MCDM processes: The problem of assessing nine hazard factors with OSH impact at the workplaces of the C-S and OTE SA is modeled as a hierarchy, in which the goal is preventing safety, and the 1st level consists of nine hazard factors (as in Figure 6).
The numbers filled in the comparison matrix (Table 3) by the decision maker correspond to linguistic variables (Table 2) and express his preferences regarding the importance of hazards. As for the consistency of the judgments, the typical-AHP is employed first, and the consistency ratio (CR) is computed. In the present case, CR was found to be less than 0.1, meaning that the resulting weights are reliable, since the judgments of the decision maker are consistent.
The resulting rankings and weights computed by the typical-AHP and the fuzzy extended FEAHP for every hazard are illustrated in Table 4, with a descending order regarding their importance. Note that these results were extracted using the same decision maker’s judgments as shown in the pairwise comparison matrix of the Table 3.
As for the results of the typical-AHP calculations, the factors “slipping—stumbling and falling—fall of persons” (ES-C#50) and “loss of control (total or partial) of machine, means of transport, or handling equipment, hand-held tool, object, animal” (ES-C#40) are more important, since their weights are 31.51% and 22.63%, respectively. The next more important group includes the factor “breakage, bursting, splitting, slipping, fall, collapse of material agent” (ES-C#30) with a weight of 16.06%, and the (ES-C#10) “deviation due to electrical problems, explosion, fire” with a 10.04% score. Regarding the less important hazards, the sum of their weights is about 19.77% of the total risk, which is considered quite important. More specifically, this group of hazards includes the “body movement under or with physical stress (generally leading to an internal injury)” (ES-C#70), “body movement without any physical stress (generally leading to an external injury)” (ES-C#60), “deviation by overflow, overturn, leak, flow, vaporization, emission” (ES-C#20), and “shock, fright, violence, aggression, threat, presence” (ES-C#80), and “other deviations not listed above in this classification” (ES-C#99).
Applying the Fuzzy Extended AHP (FEAHP) to the judgments of Table 3 results in a similar hazards’ ranking, as illustrated in the last column of Table 4. But, notwithstanding this, the relative weights’ distance between the first deviation (with ES-C#50) and the second one (with ES-C#40) is very much reduced, meaning that the FEAHP describes the uncertainty of the expert’s choices, in a different manner than typical-AHP.
Additionally, it is observed that, except for the first ranked deviation of ES-C#50, which has clearly lower score than before, and the second deviation of ES-C#40, which has almost the same weight, all the other hazards’ weights are higher, and they are responsible for 53.29% of the total risk, instead of the total 45.86% calculated with typical-AHP.
Given the fact that these conclusions are extracted from a consistent pairwise comparison matrix and the importance of hazards is close to one another, it is preferable to use FEAHP instead of the typical-AHP under these circumstances, as stated by Chan et al. (2019) [70]. The use of FEAHP ensures that the proposed approach is more efficient since it handles better the judgments’ uncertainty, which can affect the health and safety of employees.

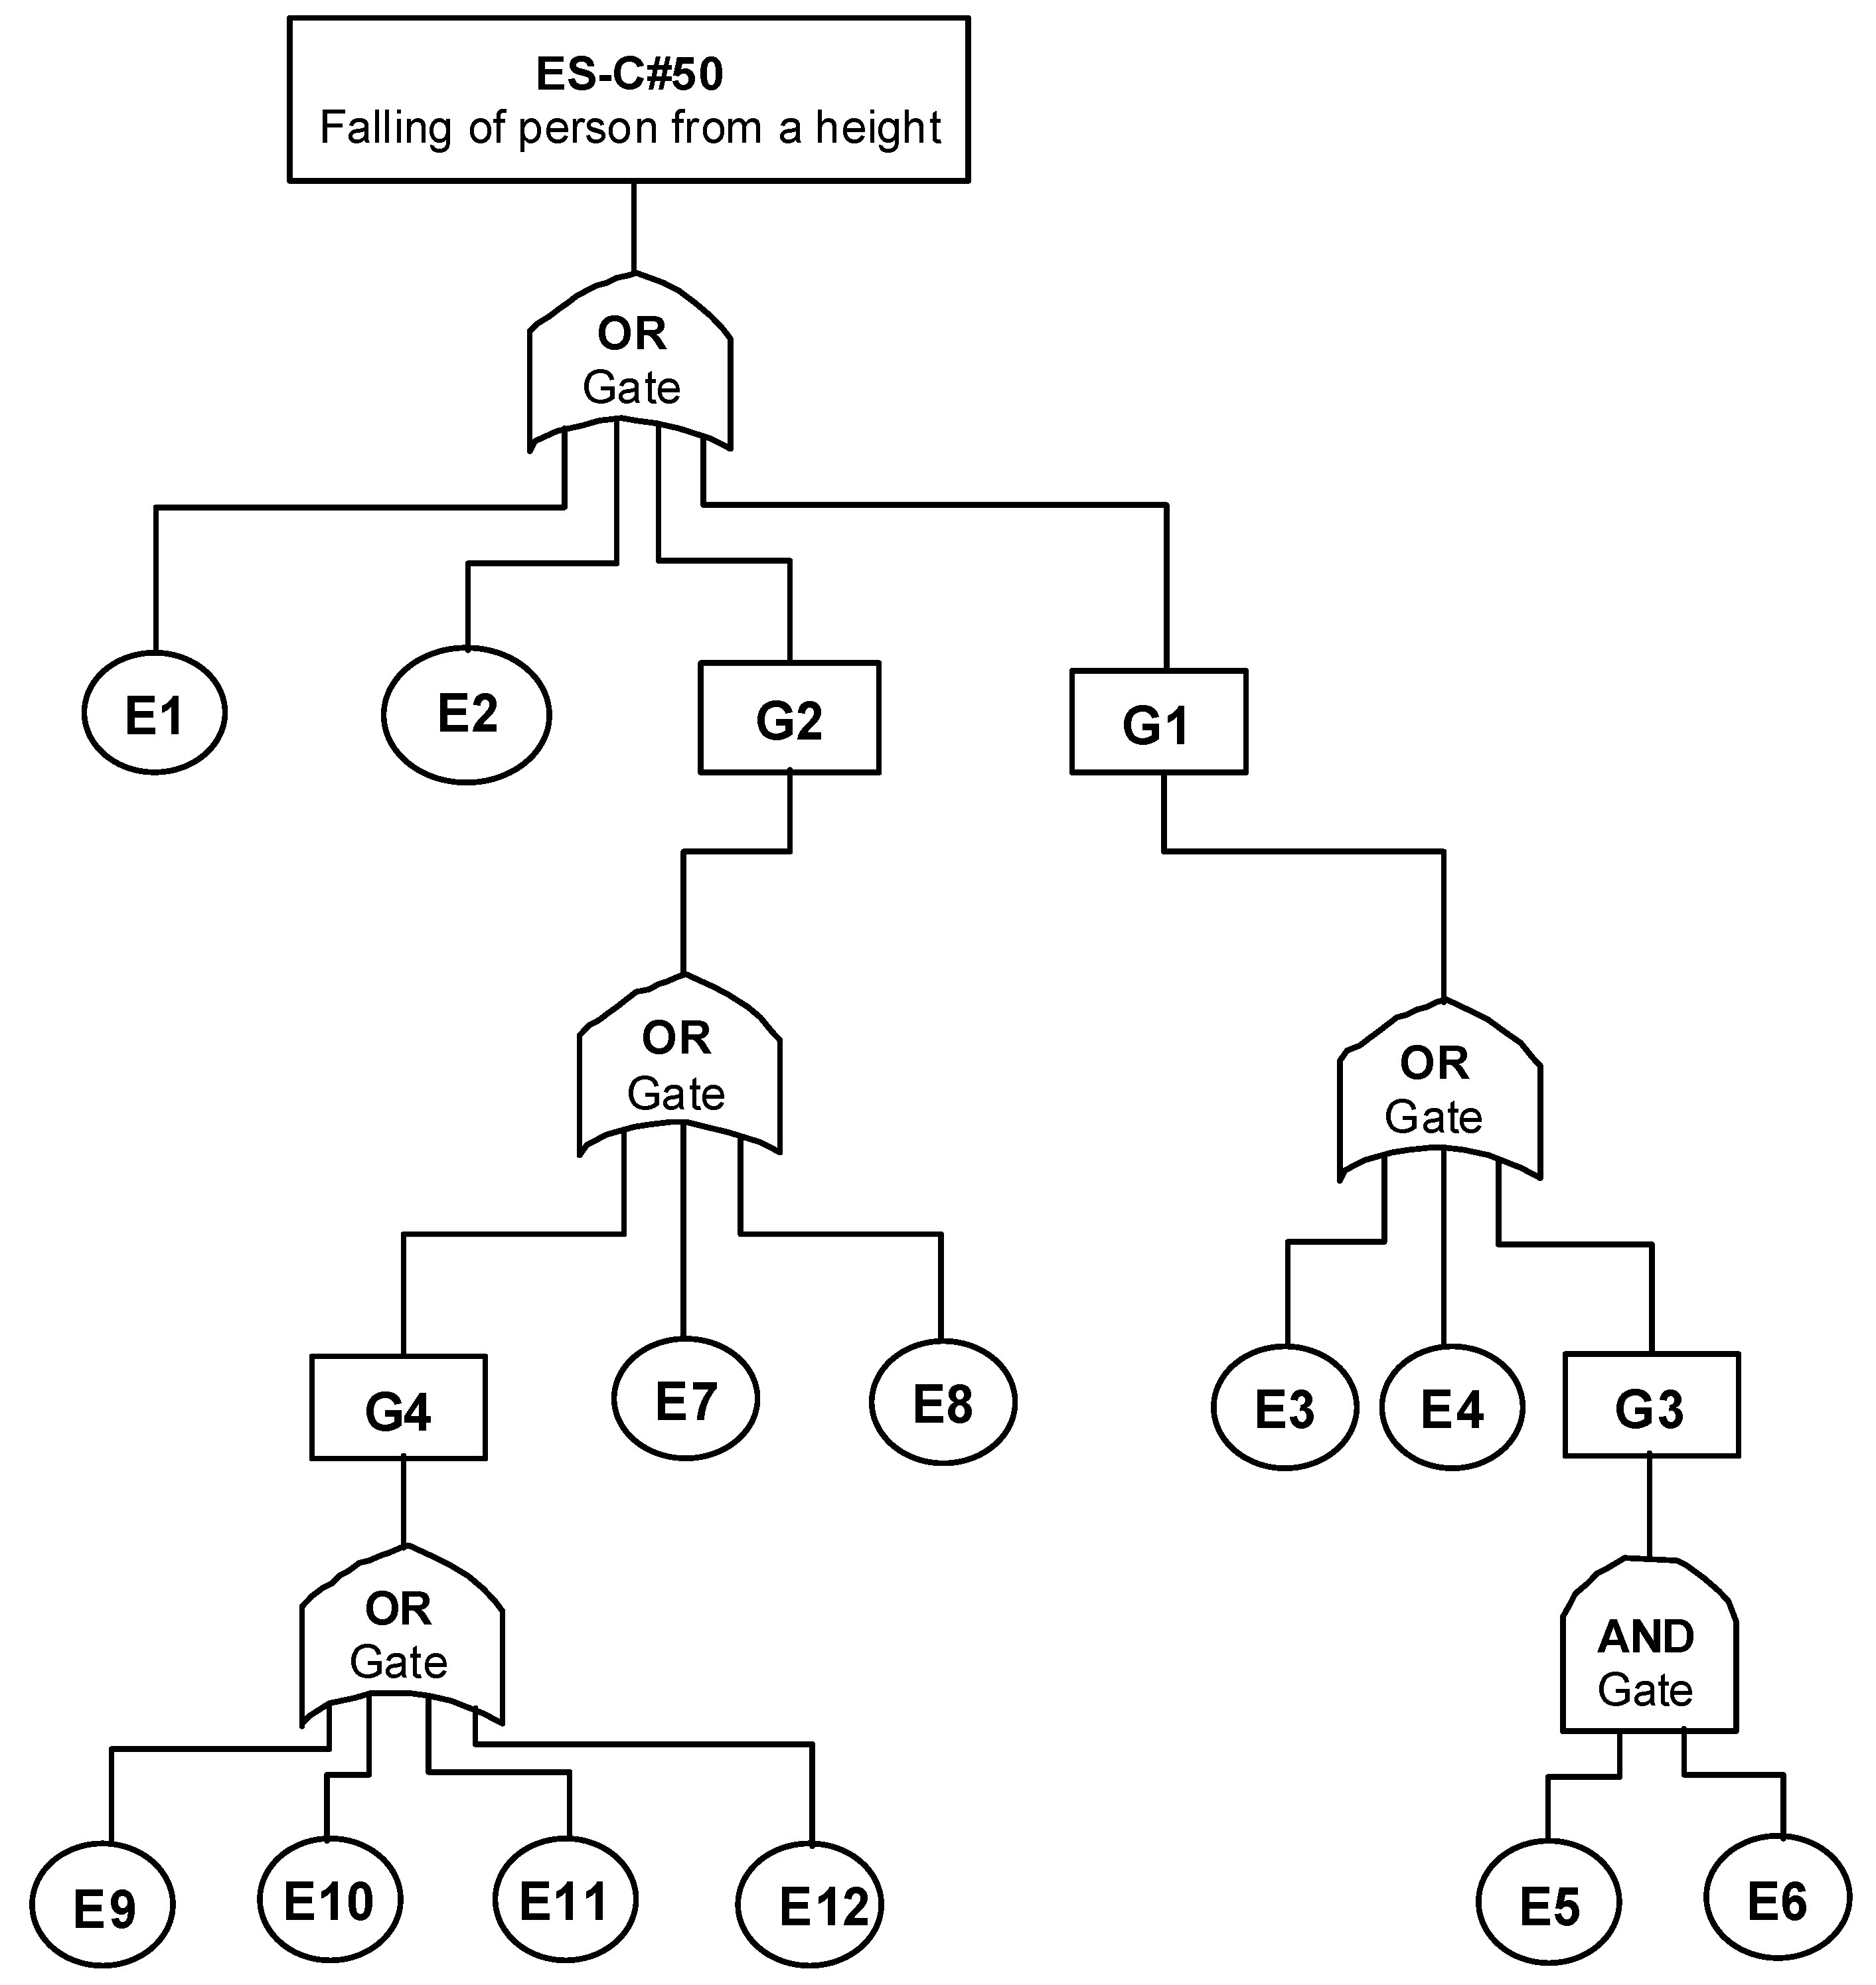
4.3. Application of the FTA Process

Taking into account the MCDM outcomes extracted (in Table 4) by the utilization of the typical-AHP and FEAHP, along with the result that the hazard-sources’ ranking unveiled as the most important deviation at the workplaces of the C-S and of OTE SA, the ES-C#50 one, while as the second-ordered deviation the ES-C#40 one, we complete the proposed RAA generic algorithmic framework by the application of the FTA process, as far as the ES-C#50 at the worksites of the fixed-telecommunications technical-projects of OTE SA is concerned: (i) For graphically illustrating the “base-events” and their sequences to the “top-event”, and (ii) for calculating the occurrence probability of the “top-event” (ES-C#50) of the most significant deviation.
Therefore, the resulting FTA drawing is illustrated in Figure 7, where the likelihood of the “top-event” ES-C#50 has been calculated to be P = 51.3% according to the estimated (by the safety manager) likelihoods of the “base-events” E1–E12 depicted in the Table 5 and the utilization of equations (2), (3), and (4) as well. The “intermediate events” G1–G4 (illustrated in Table 6) have also been inserted in this FTA graph. Particularly, the events G1, G2, and G4 constitute the outputs of three transitional OR-gates, while G3 comprises the output of an AND-gate.
To boot, the “minimal cut-sets” were determined according to the theory (e.g., [71]), and the fault-tree was first “translated” to its equivalent Boolean equations, and then, by the “top-down” method of replacement, the following Boolean expression (which also constitutes the “minimal cut-set” expression) for the “top-event” was exported:
T O P _ E V E N T = i = 1 4 E i + ( E 5 E 6 ) + j = 7 12 E j
Taking into consideration that (i) the probability of the “top-event” is greater than 50% (during the period of 2009–2016), and (ii) the work of Marhavilas and Koulouriotis (2012a) [9], we characterize the ES-C#50 deviation as a high-risky hazard source.

5. Discussion and Conclusions

The way that a technical project attains its sustainability goal is implemented by emphasizing, among other aspects, on sustainable living, for instance on the actualization of health, that includes among other things, the buildings’ and infrastructure technology [72,73]. What’s more, the OSHA accepts that actions to guarantee OSH can be involved in sustainability efforts and take advantage of the dynamics of sustainability to make each workplace safer and healthier [3,4].
Besides, the notion of sustainability is utilized as a frame to sort subsistent (or to grow new) OSH-standards, and also to develop novel and innovative OSH-RAA assessment techniques. Thus, a sizeable part of the scientific literature employs the topic of sustainability as a means for the evolution of OSH-RAA techniques [5]. In general, the diversity of OSH-RAA techniques is such that there are plenty of efficient approaches for most cases, and many studies build up hybrid models merging distinct RAA approaches.
In this sense, this article concentrates on: (i) The implementation of a new RAA methodological framework (the MCDM-STO/DET one) for sustainable engineering projects by the amalgamation of a multicriteria decision-making (MCDM) process with the joint-collaboration of a deterministic (DET) and a stochastic (STO) process, and (ii) the application of MCDM-STO/DET at the workplaces of the Greek construction sector and also of the fixed-telecommunications technical projects of OTE SA (that is the Greek Telecommunications Organization S.A.), by means of real accident data coming from two official State databases, namely of “SEPE” (Labor Inspectorate, Hellenic Ministry of Employment) and of “IKA” (Social Insurance Institution, Hellenic Ministry of Health), all the way through the years of 2009–2016.
Hence, the article’s objectives are next: (i) The presentation and execution of the joint MCDM-STO/DET framework at the workplaces of the Greek construction sector and also of the fixed-telecommunications technical projects of OTE SA, and (ii) to make known that the proposed MCDM-STO/DET scheme can be a precious method for safety managers (and/or decision-makers) to ameliorate OSH and also to support the sustainable operation of technical or engineering projects.
Mainly, we mingle two different configurations of the MCDM method, initially the typical AHP technique, and afterwards the fuzzy-extended AHP (FEAHP) one, along with the DET-PRAT and the STO-TSP methods, and finally with the DET-FTA one.
The results of the DET-PRAT utilization could be summarized on the subsequent topics:
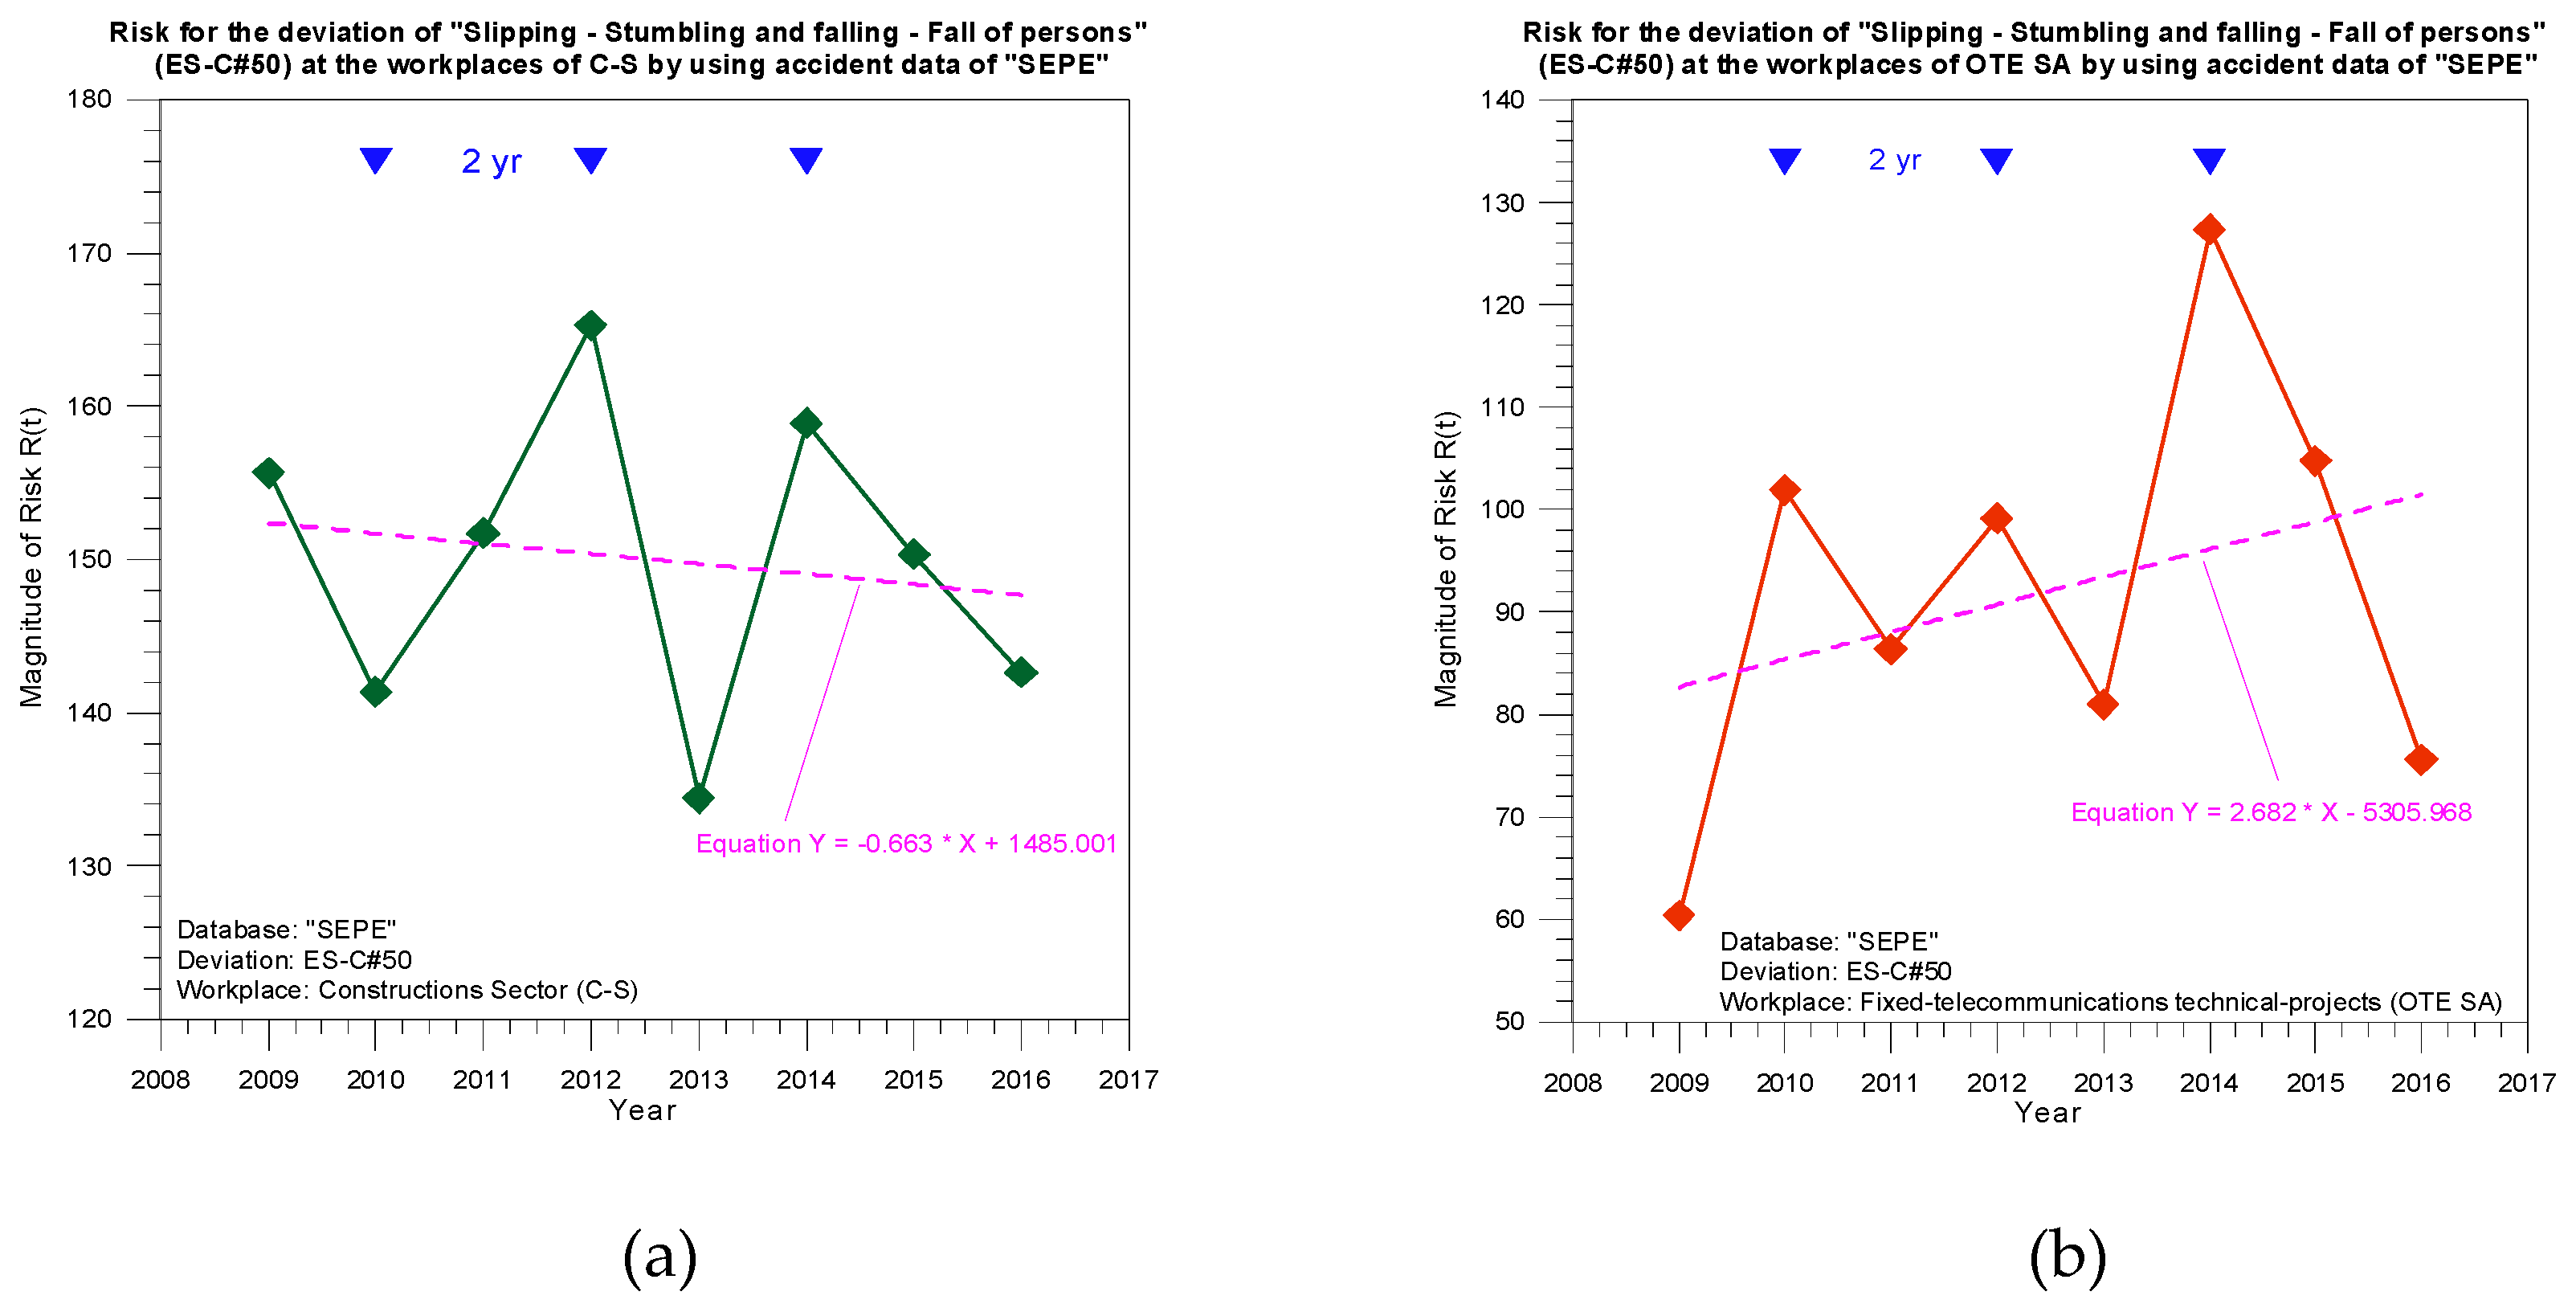
  • The most significant hazard-source at the worksites of the C-S and OTE SA is the ES-C#50 one, according to the “SEPE” database (during 2009–2016).
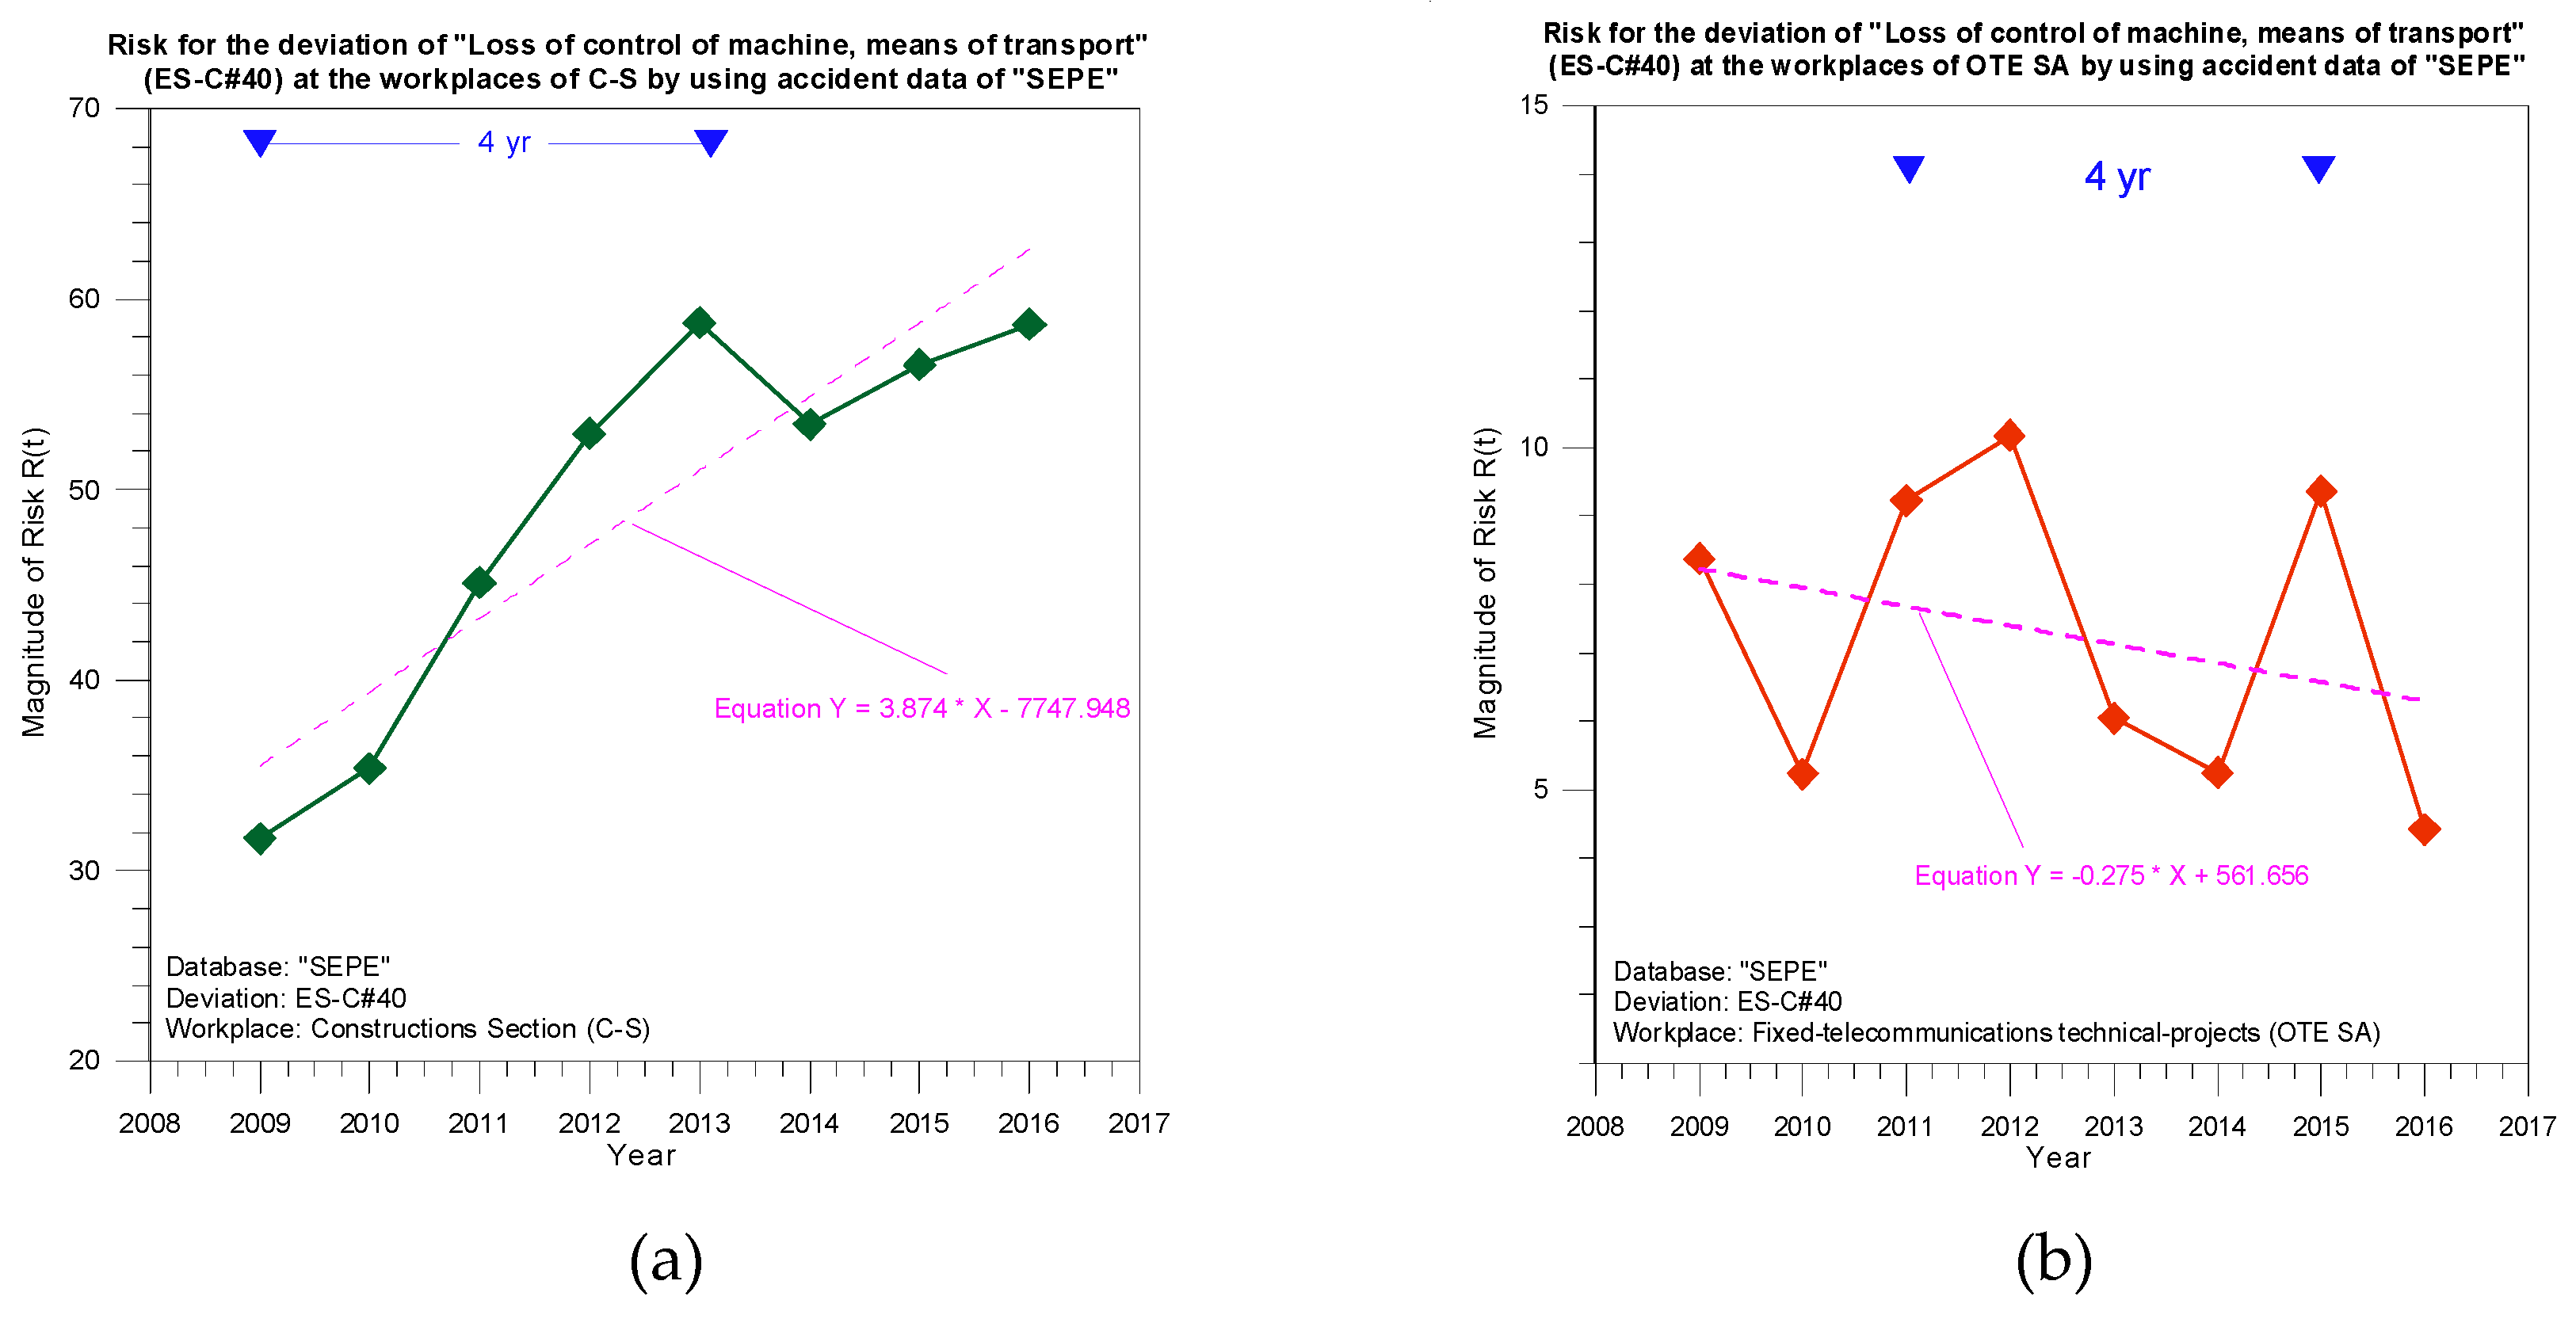
  • The most significant hazard-source at the worksites of the C-S and OTE SA is the ES-C#40 one, according to “IKA” database (during 2009–2016).
  • The resulting hazard-sources ranking based on the calculated risk-value R is, on the one hand: (i) ES-C#50 & ES-C#40, in accordance with the “SEPE” database, and on the other hand, (ii) ES-C#40 & ES-C#50, consistent with the “IKA” database.
  • The maximum value (through 2009–2016) of the magnitude R of the hazard sources, calculated by means of the “SEPE” and “IKA” databases, is about 200.0, that means compulsory measures must be taken earlier than 1.0 year, according to the work of Marhavilas and Koulouriotis (2012b) [10], in order to demote the chance of arising fatal accidents.
  • There are other considerable hazard sources which present a risk value higher than 100.0, and according to the work of Marhavilas and Koulouriotis (2012b) [10], long-term actions are necessary for the extinction of their possible dangers.
  • Besides, other hazard sources present a risk value smaller than 100.0, and according to the previous referenced paper [10], compulsory actions are not essential except for surveillance of the events.
The results of the DET-TSP application by the time-domain analysis of the time-series of accident data and risk values (R) could be summarized as follows:
  • The time-profiles of the ES-C#50 deviation show, in almost all cases, the appearance of a trend factor with a negative inclination in the curve of averaging i.e., the average risk-value decreases at the C-S workplaces (during 2009–2016).
  • Instead, the profile of ES-C#50 presents a positive inclination (or a soft increase) in the curve of the risk-average, only at the workplaces of OTE SA.
  • Besides, the analysis of the time-variations of the ES-C#40 hazard-source displays in its profiles the presence of a tendency factor with a negative slope in the curve of averaging, that means the average risk-value decreases at the workplaces of the C-S and OTE SA (during 2009–2016).
  • Instead, the profile of ES-C#40 indicates a positive slope (or an enhancement) in the curve of the risk-average, only at the workplaces of the C-S.
  • The analysis of the time-profiles of the magnitude R, concerning the ES-C#50, shows the existence of a periodic fluctuation with a periodicity of ~2 years, which seems to be a permanent feature in the “behavior” of the ES-C#50 deviation at the workplaces of the C-S and OTE SA, according the “SEPE” and “IKA” database.
  • Likewise, the time-profiles of R, concerning the deviation of ES-C#40, illustrate the appearance of a periodic fluctuation with a periodicity of ~4 years (i.e., a harmonic of ~2years).
In other words, the application of the DET-PRAT technique, along with the DET-TSP one, revealed (by the analysis of the time-profiles of the most significant hazard sources) two significant factors: (i) The presence of a dominant periodic-component (~2years), and (ii) the appearance of a trend factor in the magnitude of risk (R) with a decreasing tension (in almost all the cases), constituting (during 2009–2016) two permanent characteristics for the dynamic behavior of the working environment (or working system) at the workplaces of the C-S and also of the OTE fixed-telecommunications technical-projects, relative to OSH safety, and should be taken into consideration by any responsible (or manager, officer, etc.) for OSH issues, both at the business level and also at the State level.
Taking into consideration that the resulting rankings of the hazard-sources (at the workplaces of the C-S and of OTE SA) by using PRAT and the data of “SEPE” and “IKA” were dissimilar and/or contradictory, a second (final) and more trustworthy ranking of the hazard-sources was achieved by the application of a MCDM method (in its two different configurations, the typical-AHP and the FEAHP one) in order to attain the optimum distribution of an investment budget to appropriate measures reaching the best OSH-protection (i.e., in the procedure of prioritizing investments in OSH-prevention measures). The typical-AHP and the FEAHP were employed in the present study for assessing hazards with an efficient and “easy-to-use” multicriteria method and its fuzzy extension. The resulting rankings show: (i) The necessity of using the FEAHP in OSH applications, since it can better handle the uncertainty of the decision maker’s judgments, and (ii) that the most significant hazard-source is ES-C#50 (while as second, the ES-C#40 one).
Finally, we completed the suggested RAA algorithmic framework by the application of the DET-FTA process, as far as the most significant deviation ES-C#50 at the worksites of the fixed-telecommunications technical-projects of OTE SA is concerned, for illustrating the “base-events” and their sequences to the “top-event”, and for calculating the probability of the “top-event” (ES-C#50), which was P = 51.3% (i.e., a high-risk hazard source).
The partnership of PRAT with TSP technique can give, by the computation of risk (R), indispensable information to safety-managers in order to identify the most significant hazard-sources at the corporations’ worksites, and also to realize a preliminary ranking (1st ranking) of them. This ranking can be worthy in evaluating the urgency of investing a restricted budget in particular measures for attaining the highest OSH-protection with the minimal cost. Moreover, the next module in the suggested algorithmic framework is the MCDM one, which represents the application of a multicriteria decision-making technique, for accomplishing the final (definitive) ranking (2nd ranking) of the hazardous sources at the worksites, in order to achieve the finest (optimum) distribution of an investment budget (i.e., with the minimal cost) for appropriate measures for reaching the best OSH-protection. In addition, the FTA technique could also efficiently facilitate the aforementioned 1st and 2nd rankings.
It is worth mentioning that to facilitate the calculations, we could use the following integrated software packages: (i) The GRAPHER by Golden Software Inc, and the SPSS one by SPSS Inc, for achieving the TSP analysis, and (ii) the Fault-Tree+ one by ISOGRAPH Inc for the FTA analysis.
Besides, the results of the MCDM calculations, for both Typical-AHP and FEAHP, have been extracted using MS-Excel spreadsheets developed by one of the authors. Our results, calculated by the Typical-AHP, could be confirmed using the software available at http://fuzzymcdm.upol.cz/. This software applies the Typical-AHP (as presented by Saaty; 1990) [66], but it supports a different extension of AHP to fuzzy logic (as presented by Holeček and Talašová; 2016) [74] than the FEAHP performed in this study, i.e., calculations with FEAHP only include the application of the equations as described in the work of Chang (1996) [67]. Because of this, the results with this software might be slightly different.
The main limitations of using this approach are listed below:
  • The AHP theory tries to measure the relative importance of alternatives with respect to each criterion by using pairwise comparisons. In order to do pairwise comparisons, experts use a conversion scale with crisp values, for expressing their ideas. So, an important limitation of AHP is the usage of crisp values to reflect human thinking.
  • Another limitation is coming from CR, which is a verification of the rational judgment performed by the experts.
  • Moreover, an additional limitation concerns the pairwise comparisons of criteria, which are carried out by several experts with a required significant working-experience in occupational safety.
  • As a classic multicriteria decision support tool, AHP is a subjective process, and the resulting results, either rankings or weights, are dependent on the way that the judgments are imposed and the criteria are compared to the rest. In other words, another decision maker (or a group of experts) could make “different” judgments regarding the relative importance of each pair of criteria, resulting in different resulting weights for the criteria and/or different rankings. This drawback leads to the need for applying group-decision-making processes for merging different judgments.
  • Besides, when there are slight differences between the criteria’s weights, it is possible that the AHP could lead to the selection of a suboptimal alternative, instead of the optimal one. This phenomenon could be reduced by considering many criteria to be pairwise compared. A review of the AHP drawbacks can be found in the study of Whitaker (2007) [75].
This multiparty approach can assist safety risk managers by the prioritization of hazards, to reduce the impact of the most important risks. In addition, it could be used by risk managers to allocate more effectively the constrained budget and to reduce mortgage costs, and thus, for reserving extra funds for spending on safety measures, and to further reduce other risk factors’ impact. The main contribution of this study is the cooperative use of a proven efficient multicriteria decision-making method with a joint STO/DET one for identifying and prioritizing hazards.
Accordingly, as a future improvement, the FTA technique could be utilized for contributing more capably to the 1st and 2nd ranking of the hazard-sources, according to the configuration of Figure 8, which constitutes an alternative form of the proposed RAA framework (illustrated in Figure 1).
As a general conclusion, every RAA approach has specific limitations and/or restrictions in its applicability to miscellaneous accidents, and consequently, a separate technique can’t accomplish the optimum risk-assessment result at the workplaces. On the other hand, collaborative methodologies, like the suggested MCDM-STO/DET one, would be efficient for sustainable engineering projects. Thus, the novelty of this article is fulfilled through the suggested newfangled risk assessment and analysis (RAA) methodological approach by the amalgamation of a multicriteria decision-making (MCDM) process with the joint-collaboration of a deterministic (DET) and a stochastic (STO) process in order to upgrade OSH and to validate the sustainable operation of technical or engineering projects, as well.

Author Contributions

Conceptualization, P.K.M.; data curation, P.K.M., M.G.T., G.K.K.; formal analysis, P.K.M.; investigation, P.K.M.; methodology, P.K.M., DEK; writing—original draft, P.K.M., G.K.K.; writing—review and editing, P.K.M., G.K.K., D.E.K. All authors have read and agreed to the published version of the manuscript

Funding

This research received no external funding.

Conflicts of Interest

We declare no conflict of interest.

Abbreviations

AHPAnalytical Hierarchy-Process
C-SConstructions Sector
DETDeterministic process
ETAEvent Tree Analysis
ESAWEuropean Statistics on Accidents at Work
ES-CESAW-Code
FEAHPFuzzy Extended Analytical Hierarchy-Process
FMEAFailure Mode and Effect Analysis
FTAFault Tree Analysis
HAZOPHazard and Operability
IKASocial Insurance Institution, Hellenic/Greek Ministry of Health
MCDMMulti-Criteria Decision-Making
OSHAOccupational Safety & Health Administration
OSHOccupational Safety and Health
OTEOTE SA—the Greek Telecommunications Organization
PRATProportional Risk Assessment Technique
RARisk Assessment
RAARisk Analysis and Assessment
SEPELabor Inspectorate, Hellenic/Greek Ministry of Employment
STOStochastic process
TSPTime Series Processes
WHOWorld Health Organization

References

  1. WHO Global Strategy on Occupational Health for All: The Way to Health at Work. 1994. Available online: https://www.who.int/occupational_health/publications/globstrategy/en/index3.html (accessed on 5 April 2020).
  2. Boileau, P.-E. Sustainability and prevention in occupational health and safety. Ind. Health. 2016, 54, 293–295. [Google Scholar] [CrossRef] [Green Version]
  3. Koulinas, G.K.; Demesouka, O.E.; Marhavilas, P.K.; Vavatsikos, A.P.; Koulouriotis, D.E. Risk Assessment Using Fuzzy TOPSIS and PRAT for Sustainable Engineering Projects. Sustainability 2019, 11, 615. [Google Scholar] [CrossRef] [Green Version]
  4. OSHA Sustainability in the Workplace: A New Approach for Advancing Worker Safety and Health. 2016. Available online: https://www.osha.gov/sustainability/docs/OSHA_sustainability_paper.pdf (accessed on 5 April 2020).
  5. Marhavilas, P.K.; Koulouriotis, D.E.; Nikolaou, I.; Tsotoulidou, S. International Occupational Health and Safety Management-Systems Standards as a Frame for the Sustainability: Mapping the Territory. Sustainability 2018, 10, 3663. [Google Scholar] [CrossRef] [Green Version]
  6. Soares, C.G.; Teixeira, A.P. Risk assessment in maritime transportation. Reliab. Eng. Syst. Saf. 2001, 74, 299–309. [Google Scholar] [CrossRef]
  7. Zheng, X.; Liu, M. An overview of accident forecasting methodologies. J. Loss Prev. Process Ind. 2009, 22, 484–491. [Google Scholar] [CrossRef]
  8. Marhavilas, P.K.; Koulouriotis, D.E.; Gemeni, V. Risk Analysis and Assessment Methodologies in the Work Sites: On a Review, Classification and Comparative Study of the Scientific Literature of the Period 2000-2009. J. Loss Prev. Process Ind. 2011, 24, 477–523. [Google Scholar] [CrossRef]
  9. Marhavilas, P.K.; Koulouriotis, D.E. Developing a new alternative risk assessment framework in the work sites by including a stochastic and a deterministic process: A case study for the Greek Public Electric Power Provider. Saf. Sci. 2012, 50, 448–462. [Google Scholar] [CrossRef]
  10. Marhavilas, P.K.; Koulouriotis, D.E. A combined usage of stochastic and quantitative risk assessment methods in the worksites: Application on an electric power provider. Reliab. Eng. Syst. Saf. 2012, 97, 36–46. [Google Scholar] [CrossRef]
  11. Lassarre, S. Analysis of progress in road safety in ten European countries. Accid. Anal. Prev. 2001, 33, 743–751. [Google Scholar] [CrossRef]
  12. Reniers, G.L.L.; Dullaert, W.; Ale, B.J.M.; Soudan, K. The use of current risk analysis tools evaluated towards preventing external domino accidents. J. Loss Prev. Process Ind. 2005, 18, 119–126. [Google Scholar] [CrossRef]
  13. Verlinden, S.; Deconinck, G.; Coupé, B. Hybrid reliability model for nuclear reactor safety system. Reliab. Eng. Syst. Saf. 2012, 101, 35–47. [Google Scholar] [CrossRef]
  14. Whiteside, M.B.; Pinho, S.T.; Robinson, P. Stochastic failure modeling of unidirectional composite ply failure. Reliab. Eng. Syst. Saf. 2012, 108, 1–9. [Google Scholar] [CrossRef]
  15. Guikema, S.D.; Quiring, S.M. Hybrid data mining-regression for infrastructure risk assessment based on zero-inflated data. Reliab. Eng. Syst. Saf. 2012, 99, 178–182. [Google Scholar] [CrossRef]
  16. Stewart, M.G.; O’Connor, A. Probabilistic risk assessment and service life performance management of load bearing biomedical implants. Reliab. Eng. Syst. Saf. 2012, 108, 49–55. [Google Scholar] [CrossRef]
  17. Marhavilas, P.K.; Koulouriotis, D.E.; Spartalis, S.H. Harmonic Analysis of Occupational-Accident Time-Series as a Part of the Quantified Risk Evaluation in Worksites: Application on Electric Power Industry and Construction Sector. Reliab. Eng. Syst. Saf. Elsevier 2013, 112, 8–25. [Google Scholar] [CrossRef]
  18. Da Costa, M.A.B.; Brandão, A.L.T.; Santos, J.G.F.; Pinto, J.C.; Nele, M. Quantitative FTA using Monte Carlo analyses in a pharmaceutical plant. Eur. J. Pharm. Sci. 2020, 146, 105265. [Google Scholar] [CrossRef]
  19. Gul, M.; Celik, E. Fuzzy rule-based Fine–Kinney risk assessment approach for rail transportation systems. Hum. Ecol. Risk Assess. 2018, 24, 1786–1812. [Google Scholar] [CrossRef]
  20. AriamuthuVenkidasalapathy, J.; Mannan, M.S.; Kravaris, C. A quantitative approach for optimal alarm identification. J. Loss Prev. Process Ind. 2018, 55, 213–222. [Google Scholar] [CrossRef]
  21. Ozkan, N.F.; Uluta, B.H. A novel to approach to quantify the risk probabilities for a risk analysis methodology. Adv. Intell. Syst. Comput. 2017, 487, 341–347. [Google Scholar] [CrossRef]
  22. Athar, M.; Shariff, A.M.; Buang, A. A review of inherent assessment for sustainable process design. J. Clean. Prod. 2019, 233, 242–263. [Google Scholar] [CrossRef]
  23. Sanmiquel-Pera, L.; Bascompta, M.; Anticoi, H.F. Analysis of a historical accident in a Spanish coal mine. Int. J. Environ. Res. Public Health 2019, 16, 3615. [Google Scholar] [CrossRef] [PubMed] [Green Version]
  24. Domínguez, C.R.; Martínez, I.V.; Piñón Peña, P.M.; Rodríguez Ochoa, A. Analysis and evaluation of risks in underground mining using the decision matrix risk-assessment (DMRA) technique, in Guanajuato, Mexico. J. Sustain. Min. 2019, 18, 52–59. [Google Scholar] [CrossRef]
  25. Kharzi, R.; Chaib, R.; Verzea, I.; Akni, A. Safe and sustainable development in a hygiene and healthy company: Using the decision matrix risk assessment (DMRA) technique: A Case study. J. Min. Environ. 2020. [Google Scholar] [CrossRef]
  26. Cinar, U.; Cebi, S. A hybrid risk assessment method for mining sector based on QFD, fuzzy logic and AHP. Adv. Intell. Syst. Comput. 2020, 1029, 1198–1207. [Google Scholar] [CrossRef]
  27. Mutlu, N.G.; Altuntas, S. Risk analysis for occupational safety and health in the textile industry: Integration of FMEA, FTA, and BIFPET methods. Int. J. Ind. Ergon. 2019, 72, 222–240. [Google Scholar] [CrossRef]
  28. Bora, S.; Bhalerao, Y.; Goyal, A.; Niu, X.; Garg, A. Computation of safety design indexes of industry vehicle operators based on the reach angle, the distance from elbow to ground and the popliteal height. Int. J. Ind. Ergon. 2019, 71, 155–164. [Google Scholar] [CrossRef]
  29. Kamsu-Foguem, B.; Tiako, P. Risk information formalisation with graphs. Comput. Ind. 2017, 85, 58–69. [Google Scholar] [CrossRef] [Green Version]
  30. Zheng, X.-Z.; Wang, F.; Zhou, J.-L. A Hybrid Approach for Evaluating Faulty Behavior Risk of High-Risk Operations Using ANP and Evidence Theory. Math. Probl. Eng. 2017, 2017, 7908737. [Google Scholar] [CrossRef] [Green Version]
  31. Mentes, A.; Ozen, E. A hybrid risk analysis method for a yacht fuel system safety. Saf. Sci. 2015, 79, 94–104. [Google Scholar] [CrossRef]
  32. Fine, W.T.; Kinney, W.D. Mathematical evaluation for controlling hazards. J. Saf. Res. 1971, 3, 157–166. [Google Scholar]
  33. Hammer, R.W. Handbook of System and Products Safety; Prentice-Hall, Inc.: Englewood Cliffs, NJ, USA, 1972. [Google Scholar]
  34. Kinney, G.F.; Wiruth, A.D. Practical Risk Analysis for Safety Management; NTIS report number NWC-TP-5865; Naval Weapons Center: China Lake, CA, USA, 1976. [Google Scholar]
  35. Woodruff, J.M. Consequence and likelihood in risk estimation: A matter of balance in UK health and safety risk assessment practice. Saf. Sci. 2005, 43, 345–353. [Google Scholar] [CrossRef]
  36. Reniers, G.L.L.; Dullaert, W.; Ale, B.J.M.; Soudan, K. Developing an external domino prevention framework: Hazwim. J. Loss Prev. Process Ind. 2005, 18, 127–138. [Google Scholar] [CrossRef]
  37. Van der Hoeven, E.T. CE-Marking: Creating a model for applying the EMC, LVD, and Machinery Directive. MSc Thesis, University of Twente, School of Management and Governance, Enschede, The Netherlands, 2012. [Google Scholar]
  38. Gul, M.; Guven, B.; Guneri, A.F. A new Fine-Kinney-based risk assessment framework using FAHP-FVIKOR incorporation. J. Loss Prev. Process Ind. 2018, 53, 3–16. [Google Scholar] [CrossRef]
  39. Kokangül, A.; Polat, U.; Dağsuyu, C. A new approximation for risk assessment using the AHP and Fine Kinney methodologies. Saf. Sci. 2017, 91, 24–32. [Google Scholar] [CrossRef]
  40. Marhavilas, P.K. Risk Assessment Techniques in the Worksites of Occupational Health-Safety Systems with Emphasis on Industries and Constructions. Ph.D. Thesis, Department of Production and Management Engineering, Democritus University of Thrace, Xanthi, Greece, 2015. Available online: http://hdl.handle.net/10442/hedi/35612 (accessed on 10 April 2020).
  41. Marhavilas, P.K.; Koulouriotis, D.E.; Mitrakas, C. On the development of a new hybrid risk assessment process using occupational accidents data: Application on the Greek Public Electric Power Provider. J. Loss Prev. Process Ind. 2011, 24, 671–687. [Google Scholar] [CrossRef]
  42. Marhavilas, P.K.; Koulouriotis, D.E. A risk estimation methodological framework using quantitative assessment techniques and real accidents’ data: Application in an aluminum extrusion industry. J. Loss Prev. Process Ind. 2008, 21, 596–603. [Google Scholar] [CrossRef]
  43. Marhavilas, P.K.; Koulouriotis, D.E.; Mitrakas, C. Fault and Event-Tree techniques in occupational health-safety systems-Part I: Integrated risk-evaluation scheme. Environ. Eng. Manag. J. 2014, 13, 2097–2108. [Google Scholar] [CrossRef]
  44. Marhavilas, P.K.; Koulouriotis, D.E.; Mitrakas, C. Fault and Event-Tree techniques in occupational health-safety systems-Part II: Statistical analysis. Environ. Eng. Manag. J. 2014, 13, 2371–2386. [Google Scholar] [CrossRef]
  45. Babaei, M.; Roozbahani, A.; Shahdany, S.M.H. Risk Assessment of Agricultural Water Conveyance and Delivery Systems by Fuzzy Fault Tree Analysis Method. Water Resour. Manag. 2018, 32, 4079–4101. [Google Scholar] [CrossRef]
  46. Yasli, F.; Bolat, B. A risk analysis model for mining accidents using a fuzzy approach based on fault tree analysis. J. Enterp. Inf. Manag. 2018, 31, 577–594. [Google Scholar] [CrossRef] [Green Version]
  47. Gul, M.; Ak, M.F. A comparative outline for quantifying risk ratings in occupational health and safety risk assessment. J. Clean. Prod. 2018, 196, 653–664. [Google Scholar] [CrossRef]
  48. Fuentes-Bargues, J.L.; González-Cruz, M.C.; González-Gaya, C.; Baixauli-Pérez, M.P. Risk analysis of a fuel storage terminal using HAZOP and FTA. Int. J. Environ. Res. Public Health 2017, 14, 705. [Google Scholar] [CrossRef] [PubMed]
  49. Hanea, D.M.; Jagtman, H.M.; Ale, B.J.M. Analysis of the Schiphol Cell Complex fire using a Bayesian belief net based model. Reliab. Eng. Syst. Saf. 2012, 100, 115–124. [Google Scholar] [CrossRef]
  50. Lisnianski, A.; Elmakias, D.; Laredo, D.; Ben Haim, H. A multi-state Markov model for a short-term reliability analysis of a power generating unit. Reliab. Eng. Syst. Saf. 2012, 98, 1–6. [Google Scholar] [CrossRef]
  51. Khakzad, N.; Khan, F.; Amyotte, P. Risk-based design of process systems using discrete-time Bayesian networks. Reliab. Eng. Syst. Saf. 2013, 109, 5–17. [Google Scholar] [CrossRef]
  52. Wang, F.; Ding, L.Y.; Luo, H.B.; Love, P.E.D. Probabilistic risk assessment of tunneling-induced damage to existing properties. Expert Syst. Appl. 2014, 41, 951–961. [Google Scholar] [CrossRef]
  53. Biyikli, O.; Aydogan, E.K. A new model suggestion to estimate the probability value in occupational health and safety risk assessment. Appl. Math. Inf. Sci. 2016, 10, 663–671. [Google Scholar] [CrossRef]
  54. Zheng, G.; Zhu, N.; Tian, Z.; Chen, Y.; Sun, B. Application of a trapezoidal fuzzy AHP method for work safety evaluation and early warning rating of hot and humid environments. Saf. Sci. 2012, 50, 228–239. [Google Scholar] [CrossRef]
  55. Fattahi, R.; Khalilzadeh, M. Risk evaluation using a novel hybrid method based on FMEA, extended MULTIMOORA, and AHP methods under fuzzy environment. Saf. Sci. 2018, 102, 290–300. [Google Scholar] [CrossRef]
  56. Mete, S. Assessing occupational risks in pipeline construction using FMEA-based AHP-MOORA integrated approach under Pythagorean fuzzy environment. Hum. Ecol. Risk Assess. 2019, 25, 1645–1660. [Google Scholar] [CrossRef]
  57. Oturakci, M. A new fuzzy-based approach for environmental risk assessment. Hum. Ecol. Risk Assess. 2019, 25, 1718–1728. [Google Scholar] [CrossRef]
  58. Yucesan, M.; Kahraman, G. Risk evaluation and prevention in hydropower plant operations: A model based on Pythagorean fuzzy AHP. Energy Policy 2019, 126, 343–351. [Google Scholar] [CrossRef]
  59. Boral, S.; Howard, I.; Chaturvedi, S.K.; McKee, K.; Naikan VN, A. An integrated approach for fuzzy failure modes and effects analysis using fuzzy AHP and fuzzy MAIRCA. Eng. Fail. Anal. 2020, 108. [Google Scholar] [CrossRef]
  60. Marhavilas, P.K. Risk Estimation in the Greek Constructions’ Worksites by using a Quantitative Assessment Technique and Statistical Information of Occupational Accidents. J. Eng. Sci. Technol. Res. (JESTR) 2009, 2, 51–55. [Google Scholar] [CrossRef]
  61. Ardeshir, A.; Maknoon, R.; Rekab Islamizadeh, M.; Jahantab, Z. Safety risk assessment effective on occupational health in high-rise building construction projects with fuzzy approach. Iran Occup. Health 2014, 11, 82–95. [Google Scholar]
  62. Anil Kumar, C.N.; Sakthivel, M.; Elangovan, R.K.; Arularasu, M. Analysis of Material Handling Safety in Construction Sites and Countermeasures for Effective Enhancement. Sci. World J. 2015, 742084. [Google Scholar] [CrossRef] [PubMed] [Green Version]
  63. Marhavilas, P.K.; Vrountas, P.T. Risk Assessment in the Constructions Sector of EU Countries: Application of a Methodological Framework using Quantitative Techniques and Occupational Accidents’ Data throughout the period 1996–2011. J. Eng. Sci. Technol. Res. (JESTR) 2018, 11, 66–73. [Google Scholar] [CrossRef]
  64. Koulinas, G.K.; Marhavilas, P.K.; Demesouka, O.E.; Vavatsikos, A.P.; Koulouriotis, D.E. Risk Analysis and Assessment in the worksites using the Fuzzy-Analytical Hierarchy Process and a Quantitative Technique – A case study for the Greek Construction sector. Saf. Sci. 2019, 112, 96–104. [Google Scholar] [CrossRef]
  65. European Union (EU). European Statistics on Accidents at Work (ESAW)-Summary Methodology; EUROSTAT, European Commission: Luxembourg, 2013; ISBN 978-92-79-28419-9. [Google Scholar] [CrossRef]
  66. Saaty, T.L. How to make a decision: The analytic hierarchy process. Eur. J. Oper. Res. 1990, 48, 9–26. [Google Scholar] [CrossRef]
  67. Chang, D.-Y. Applications of the extent analysis method on fuzzy AHP. Eur. J. Oper. Res. 1996, 95, 649–655. [Google Scholar] [CrossRef]
  68. Lamata, M.T. Ranking of alternatives with ordered weighted averaging operators. Int. J. Intell. Syst. 2004, 19, 473–482. [Google Scholar] [CrossRef]
  69. Zimmermann, H.J. Fuzzy Set Theory—And Its Applications; Springer Science & Business Media: New York, NY, USA, 2001. [Google Scholar]
  70. Chan, H.K.; Sun, X.; Chung, S.-H. When should fuzzy analytic hierarchy process be used instead of analytic hierarchy process? Decis. Support Syst. 2019, 125. [Google Scholar] [CrossRef]
  71. Haasl, D.F.; Roberts, N.H.; Vesely, W.E.; Goldberg, F.F. Fault Tree Handbook; NUREG-0492, TRN: 82-003645; U.S. Nuclear Regulatory Commission: Washington, DC, USA, 1981; p. 20555. Available online: https://www.nrc.gov/docs/ML1007/ML100780465.pdf (accessed on 10 April 2020).
  72. ICST&D. International Conference on Sustainable Technology and Development. Shenzhen, China, 22–25 August 2020; Available online: https://www.elsevier.com/events/conferences/international-conference-on-sustainable-technology-and-development (accessed on 10 April 2020).
  73. Marhavilas, P.K.; Filippidis, M.; Koulinas, G.K.; Koulouriotis, D.E. A HAZOP with MCDM Based Risk-Assessment Approach: Focusing on the Deviations with Economic/Health/Environmental Impacts in a Process Industry. MDPI Sustainability, section: Sustainable Engineering and Science, Special Issue: Decision Support Systems and Knowledge Management for Sustainable Engineering. Sustainability 2020, 12, 993. [Google Scholar] [CrossRef] [Green Version]
  74. Holeček, P.; Talašová, J. A free software tool implementing the fuzzy AHP method. In Proceedings of the 34th International Conference on Mathematical Methods in Economics 2016, Liberec, Czech Republic, 6–9 September 2016; pp. 266–271, ISBN 978-80-7494-296-9. [Google Scholar]
  75. Whitaker, R. Criticisms of the Analytic Hierarchy Process: Why they often make no sense. Math. Comput. Modeling 2007, 46, 948–961. [Google Scholar] [CrossRef]
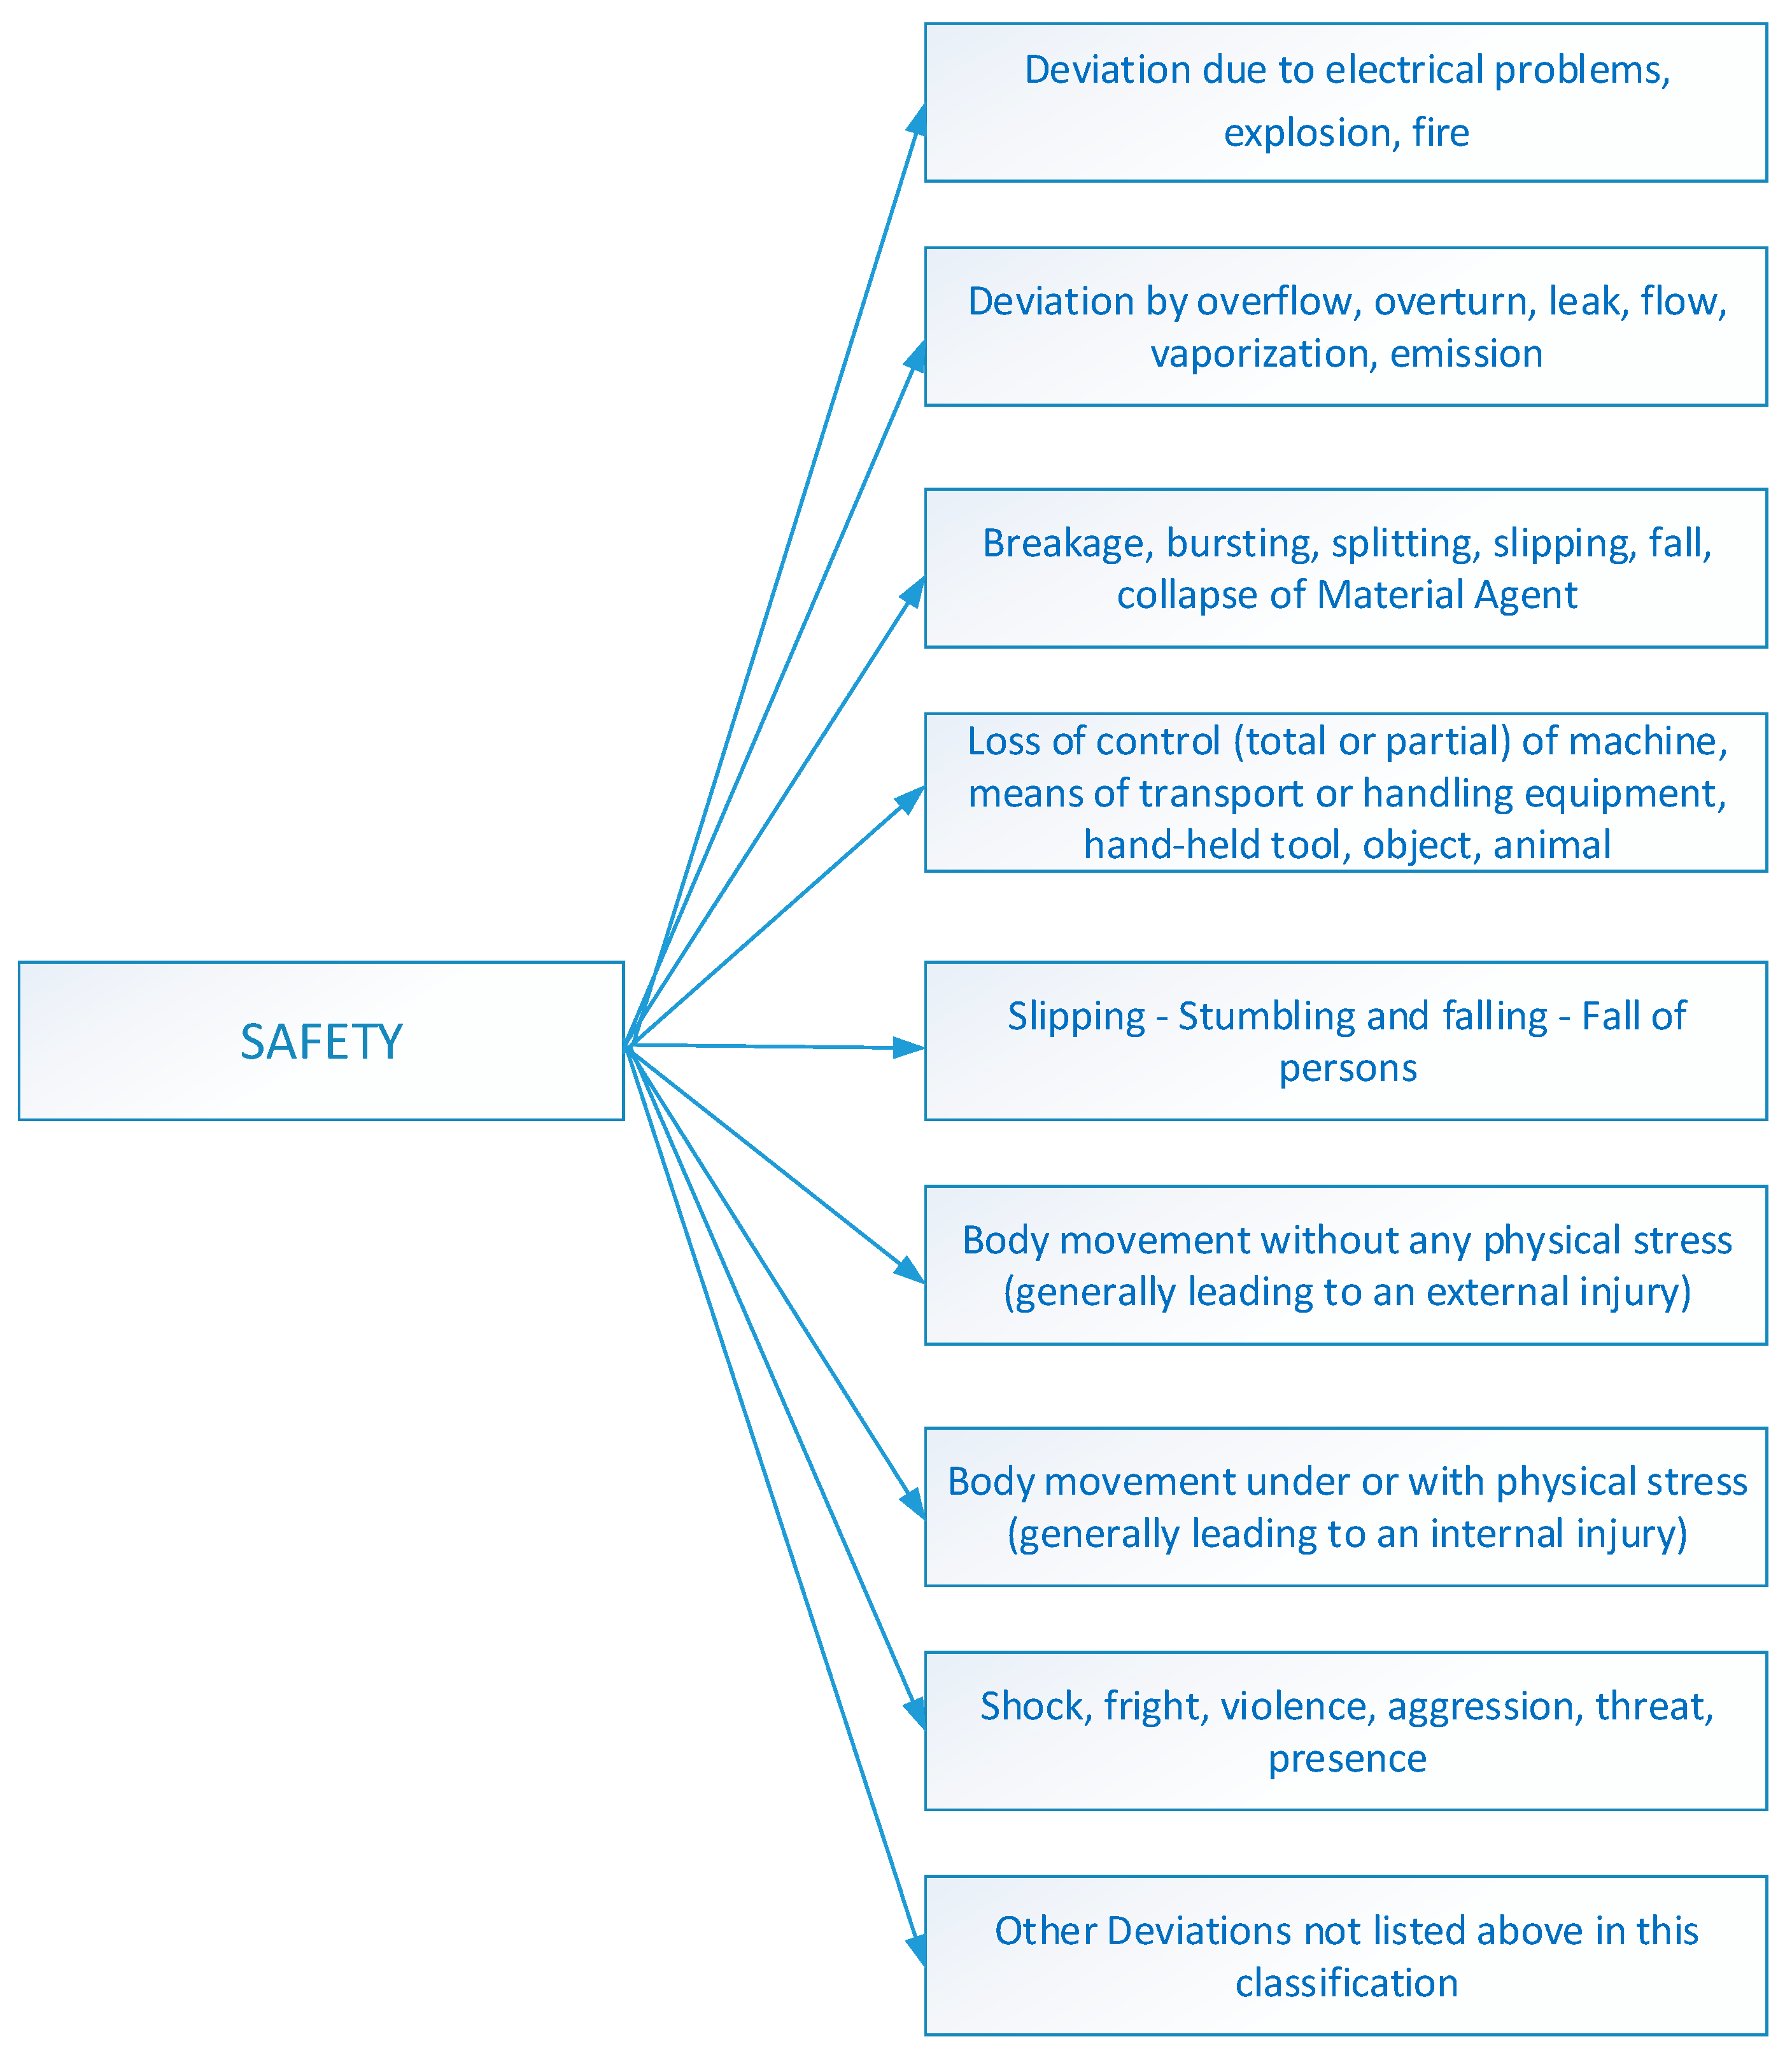
Figure 1. The joint stochastic/deterministic with multi criteria decision-making (MCDM) risk-assessment methodological framework.
Sustainability 12 04280 g001
Figure 2. Time-variations of the risk (R) calculated by proportional risk-assessment technique (PRAT) utilizing accident data of “SEPE”, during 2009–2016, and concerning the most considerable hazard-source of “slipping—stumbling and falling—fall of persons” (with ES-C#50) at the workplaces of the construction sector (C-S) (a) and also of OTE SA (b).
Sustainability 12 04280 g002
Figure 3. Time-variations of the risk (R) calculated by PRAT utilizing accident data of “IKA”, during 2009–2016, and concerning the most considerable hazard-source of “loss of control (total or partial) of machine, means of transport, or handling equipment, hand-held tool, object, animal” (with ES-C#40) at the workplaces of (a) the C-S and (b) OTE SA.
Sustainability 12 04280 g003
Figure 4. Time-profiles of the risk (R) calculated by PRAT utilizing accident data of “IKA”, during 2009–2016, and concerning the hazard-source of “slipping—stumbling and falling—fall of persons” (with ES-C#50) at the workplaces of the C-S (a) and also of OTE SA (b).
Sustainability 12 04280 g004
Figure 5. Time-variations of the risk (R) calculated by PRAT utilizing accident data of “SEPE”, during 2009–2016, and concerning the hazard-source of “loss of control (total or partial) of machine, means of transport, or handling equipment, hand-held tool, object, animal” (with ES-C#40) at the workplaces of (a) the C-S and (b) OTE SA.
Sustainability 12 04280 g005
Figure 6. The hierarchy used for calculating the weights.
Sustainability 12 04280 g006
Figure 7. The fault-tree analysis (FTA)Drawing, as far as the most significant hazards’ source of ES-C#50 at the worksites of the fixed-telecommunications technical-projects of OTE SA is concerned.
Sustainability 12 04280 g007
Figure 8. An alternative form of the proposed joint stochastic/deterministic/MCDM RAA methodological framework.
Sustainability 12 04280 g008
Table 1. The identified (throughout the period of2009–2016) deviations at the workplaces of the Greek constructions section (C-S) and of fixed-telecommunications technical-projects of OTE SA (the Greek Telecommunications Organization SA), in accordance with the classification of ESAW (European Statistics on Accidents at Work) by EU (2013) [65].
1st Level of Hazards
Type of Deviation
ESAW-Code
(ES-C)
2nd Level of Hazards
Description of Hazards (or Injuries)
(a)(b)(c)
Working Environment & Processes10Deviation due to electrical problems, explosion, fire
[e.g., (i) exposure to or contact with extreme temperature levels, (ii) exposure to or contact with electric current, etc.]
Working Environment & Processes20Deviation by overflow, overturn, leak, flow, vaporization, emission
(e.g., exposure to or contact with hazardous substances or radiation, etc.)
Working Environment & Processes30Breakage, bursting, splitting, slipping, fall, collapse of material agent
(e.g., slipping, collapse and being struck by falling objects)
Psychological/Human 40Loss of control (total or partial) of machine, means of transport or handling equipment, hand-held tool, object, animal
[e.g., (i) collision with an immobile object and falling against or being struck by moving objects, (ii) trapping, being crushed-inside or between objects, etc.]
Physical Activity50Slipping—stumbling and falling—fall of persons
[e.g., (i) falling of person from a height, (ii) falling of person-on the same level]
Physical Activity60Body movement without any physical stress (generally leading to an external injury)
Physical Activity70Body movement under or with physical stress (generally leading to an internal injury)
[e.g., physical strain—over-exertion]
Psychological/Human80Shock, fright, violence, aggression, threat, presence
Working Environment & Processes99Other deviations not listed above in this classification
Table 2. Linguistic variables and corresponding triangular fuzzy numbers (TFNs) by Lamata (2004) [68].
Importance of Factor i over Factor jFuzzy Number
Equal[1,1,1]
Equal to Moderate[1,2,3]
Moderate[2,3,4]
Moderate to Strong[3,4,5]
Strong[4,5,6]
Strong to Very Strong[5,6,7]
Very Strong[6,7,8]
Very Strong to Extremely[7,8,9]
Extremely[8,9,9]
Table 3. The judgments of the decision maker.
Safety
ESAW Codes
(ES-C#)
[10][20][30][40][50][60][70][80][99]
[10]151/31/41/53255
[20] 11/51/61/71/21/322
[30] 11/21/34366
[40] 11/25477
[50] 16588
[60] 11/233
[70] 144
[80] 12
[99] 1
Table 4. The results extracted by applying typical and fuzzy extended AHP (FEAHP).
Hazards’ Weights
(Typical-AHP)
Hazards’ Ranking
(Typical-AHP)
Hazards’ Weights (FEAHP)Hazards’ Ranking (FEAHP)
[10]10.04%[50]31.51%[10]12.59%[50]25.72%
[20]3.24%[40]22.63%[20]3.95%[40]20.99%
[30]16.06%[30]16.06%[30]16.67%[30]16.67%
[40]22.63%[10]10.04%[40]20.99%[10]12.59%
[50]31.51%[70]7.08%[50]25.72%[70]8.98%
[60]4.83%[60]4.83%[60]6.21%[60]6.21%
[70]7.08%[20]3.24%[70]8.98%[20]3.95%
[80]2.49%[80]2.49%[80]2.86%[80]2.86%
[99]2.13%[99]2.13%[99]2.03%[99]2.03%
Table 5. The estimated likelihoods of the “base-events” E1–E2 concerning the FTA graph of the most significant hazards’ source of ES-C#50 (“top-event”).
Base-EventsDescription of “Base-Events”Estimated Probability (P)
E1Improper use of tools/equipment20.0%
E2Strong winds1.0%
E3Slippery shoes0.1%
E4Worn seat belts5.0%
E5Lack of helmet10.0%
E6Contact of materials with the head10.0%
E7Pathological causes0.1%
E8Heat/cold0.1%
E9Overtime/repetitive work10.0%
E10Guard10.0%
E11Standing10.0%
E12Intense stress10.0%
Table 6. The “intermediate-events” G1–G4 concerning the FTA graph of the most significant hazards’ source of ES-C#50 (“top-event”).
Intermediate EventsDescription of “Intermediate-Events”Calculated Probability (P)
G1Improper use of personal protective or damaged equipment 6.0%
G2Loss of consciousness/concentration34.5%
G3Negligence1.0%
G4Fatigue34.4%

