An Exploration of Spatial and Social Inequalities of Urban Sports Facilities in Nanning City, China


1
School of Resources and Environment, Anqing Normal University, Anqing 246133, China
2
Key Laboratory of Environment Change and Resources Use in Beibu Gulf, Nanning Normal University, Nanning 530001, China
3
Department of Natural Sciences, Manchester Metropolitan University (MMU), Manchester M1 5GD, UK
4
Department of Sports and Health, Guangxi College for Preschool Education, Nanning 530003, China
5
Department of Management Science and Engineering, Guangxi University of Finance and Economics, Nanning 530003, China
*
Author to whom correspondence should be addressed.
Sustainability 2020, 12(11), 4353; https://doi.org/10.3390/su12114353
Submission received: 24 April 2020
/
Revised: 21 May 2020
/
Accepted: 22 May 2020
/
Published: 26 May 2020
(This article belongs to the Special Issue Accessibility, Public Space and Health)
Abstract
:Health and well-being have become important dimensions of urban sustainability, particularly in countries with rapid urbanization and aging populations. As such, providing opportunities for physical activity and exercise has become a priority in the planning and governance of Healthy City in these countries. Relatively little research has investigated the provision of sports facilities in developing countries. This paper seeks to address this gap by exploring the spatial and social inequality of sports facilities at the urban scale using Nanning City in South China as a case study. Spatial aggregate analyses, including an allocation index, accessibility, diversity, and geographically weighted regression, were applied to mixed data sets from primary and secondary sources from 2018. The results confirmed a strong inequality of sports facilities provision across the study area and between age groups. This study suggests that the reduction of inequality and the improvement of equity and social justice should consider the spatial and social matches between demand and supply, through increasing sports facilities investment intensity and road network density.
1. Introduction
Of the United Nations’ seventeen Sustainable Development Goals (SDG), the third calls on all countries to, “Ensure healthy lives and promote well-being for all at all ages”. Consequently, health and well-being have become an important dimension of urban sustainability, particularly in countries with aging populations. Numerous studies have confirmed the links between urban sustainability and health [1].
China has an ageing population with a high incidence of chronic diseases (e.g., stroke, high blood pressure, and diabetes) [2]. In 2016, the Chinese government launched Healthy China 2030—a national strategy to promote health through integral and holistic approaches [3]. The Healthy City initiative within the strategy sets out multiple goals in relation to the living environment, public services, finance, and technology, all of which need multi-level collaborations between government, community, and individuals [4]. A variety of cities and communities throughout China have proposed Healthy City 2030 local development strategies (including Healthy Beijing 2030 and Healthy Guangxi 2030) [5]. Rapid growth of local planning and governance policies and practice has occurred to implement these strategies.
The World Health Organization (WHO) advocates physical activity and exercise as one of the best methods of reducing health risks and promoting healthy lifestyles [6]. The provision of physical exercise in sports centers [7,8] presents a challenge in urban planning and governance: How to optimize the distribution and allocation of sports facilities and maintain spatial and social equity? China’s “Thirteenth Five-Year Plan for Sports Development” pointed out that the provision of sports facilities was insufficient, and its development was unbalanced [9].
A growing number of studies have investigated the spatial and social inequality of urban facilities [10,11]. This paper addresses a gap in the research, presenting an analysis of the spatial and social inequality of sports facilities at the urban scale in China.
After this introduction section, Section 2 presents an evolution of studies on inequality and equity of public service facilities. Section 3 describes the study area, data collection, and processing, and analytical methods. Section 4 presents the illustrative results of this empirical study. The final section summarizes the main findings and conclusions and also its contributions to urban sustainability.
2. Literature Review
Equity of public service distribution and allocation remains one of the core challenges of sustainable urban development [12]. Talen argued that spatial equity requires consideration of needs, fairness, and justice in the distribution of public service facilities [13]. Historically, studies into public service facilities have focused on equity and efficiency, irrespective of their different uses, varying contexts, and diverse analytical methods. The core perspective of these studies has evolved from “regional equality” to “spatial equity”, to “social justice” [14], as shown in Figure 1.
From World War II to the 1970s, the widely implemented welfare state system in developed countries made governments responsible for distributing public service facilities. The concept of “regional equality” became the key concern in policymaking during this period. The analyses of regional equality focused on the equality of public service allocation per capita [15] at the administrative district-scale but did not reflect people’s needs, the spatial distribution (location) of facilities, or the benefits of services. Harvey contended that policymaking regarding the spatial distribution of public service facilities should take “regional equality” into account as a measure of social value [16]. In 1968, Teitz highlighted efficiency and equity as two key factors influencing the distribution of urban public service facilities in his theory of urban public facility location [17]. Other influential factors, such as governmental resources, population distribution, residents’ political demands, individual choice behavior, policymakers’ ideology and consciousness, and institutional arrangements, have also been studied in the literature of this period [18]. The analytical methods used in these studies were mostly based on quantitative geography and behavioral geography [19], such as using a location allocation model to optimize the site selection of facilities and the spatial distribution of public service facilities [20]. Since then, a P-Median Model and a P-Centre Model have been developed to minimize the total trip distance from facilities and the farthest trip distance from facilities, respectively [21]. The Maximum Covering Location Problem proposed in 1974 was mainly used to optimize the distribution of a certain number of facilities through maximizing the number of residents covered by the facilities [19].
In the 1970s, the stagflation prevalent in the European and North American economies promoted the rise of Neo-liberalism and opposition to government intervention. The subsequent development of new public management theory advocated market access for public services. Some studies focused on the analysis of the distribution of costs and benefits in social space, based on the idea that spatial pattern reflects social internal contradictions and space is treated as a collection of social relations [22]. The spatial equity of public service facilities was re-examined according to the human-oriented service location theory [23]. Spatial equity studies during the 1970s typically measured spatial separation or spatial proximity between residents and public facilities. For example, the accessibility index was developed using GIS to measure the distance between residents and sports facilities or the cost spent accessing sports facilities [13]. The accessibility of numerous types of public service facilities has been studied, including playgrounds, schools, health care centers, and parks [13,24,25,26]. A range of analytical methods has been developed in GIS for this purpose [27]. The spatial allocation procedure was applied to improve equality simultaneously with upgrading accessibility to schools [28]. The multi-objective optimization and P-median model has been used to analyze the spatial allocation of hospitals [29,30]. A spatial interaction model has been used to analyze accessibility to health centers [31], and spatial autocorrelation has been used to analyze the potential accessibility and inequity of the spatial distribution of playgrounds [13].
In the late 1990s, the influence of neoliberalism on economic globalization and the growth of knowledge-based economies was increasingly criticized. As a consequence, the integration of government intervention with free-market forces began to rise, creating multiple suppliers of public service facilities and the multi-supply theory of public services, all influenced by regulation theory and the new public service theory. Social differentiation and its influential factors [32,33] were integrated into the analysis of public service facilities by highlighting the goal of social justice in service supply [34] and the needs of different groups [26], particularly those with different levels of income [35,36,37,38]. Studies showed that service facilities that engender a nimbyism response, such as hazardous waste facilities, waste transfer stations, funeral homes and sewage treatment plants are often located in low-income communities [39]. Conversely high-income groups [40], homeowners [41], mainstream ethnic groups [42], and people with high socioeconomic status [43] have good access to green space. All these spatial disparities have led to increasing social differentiation in the use of public service facilities [10,41,44,45]. Several studies in the late 1990s explored urban residents’ preference for using public service facilities from a sociological perspective, which advocates consideration of social justice in the distribution of public service facilities [46,47]. GIS methods, such as spatial multi-criteria evaluation, continue to be applied extensively in the analysis of spatial equity, together with questionnaire surveys, interviews, and fieldwork to capture residents’ preferences for services and attitudes about the quality of services [48,49,50].
The evolving focus of the studies mentioned above from spatial inequality, spatial equity to social justice reflects the growing consideration of urban sustainability in policymaking, which aims to balance the economic, social, and environmental goals associated with the planning and governance of public service facilities. These theories are rarely applied in developing countries due to inadequate availability of high-resolution data, e.g., attribute data of sports facilities at an urban scale. Methodologically, spatial analysis typically requires the analysis of accessibility, diversity of service facilities and social groups at spatial unit scale associated with public administration. In the case of Chinese urban studies, most studies on sports facilities have analyzed accessibility [51], the relationship between accessibility and frequency of use [52], impacts of facilities on physical exercise [53,54,55] and change of space demand [56]. These studies have not considered the disparity between administrative units or between age groups, so they have contributed less to local urban planning and governance decision-making processes. This study addresses these gaps by considering spatial diversity and heterogeneity across different age groups.
3. Materials and Methods
3.1. Study Area
This study was conducted in Nanning City (Figure 2), the capital of a less-developed province of Guangxi Zhuang Autonomous Region (GZAR). Widely recognized as a green and livable city, Nanning is situated in the southern part of this province in southern China and has a subtropical climate. This city, with its distinctive characteristics of urban growth and abundance of sports facilities, is being developed into a pilot “healthy city”. At present, there are still some issues in the distribution of sports facilities resources across the city, such as regional inequality, spatial inequity, and social injustice. These will be investigated in this paper in order to identify a more sustainable approach to urban development.
The 61 sub-district units (and townships/towns) under the jurisdiction of Nanning City were taken as the spatial units for this study because they are the primary administrative units in China where government policies are finally implemented. Moreover, they are usually taken as the basic statistical units for releasing demographic and economic statistical data, such as the national census survey. Generally speaking, townships and towns are located in the outer zone of Nanning City, while sub-district units are located in its central area.
3.2. Data Collection
The demographic data for this study were primarily taken from the latest national population census of China from 2010, which were released at sub-district (or street community) level. Some units (e.g., farms and Economic Development Zones) were merged into surrounding sub-district units during the revision of administrative units in recent years. Local population data were used to estimate demographic data in 2018. The total permanent population of Nanning City was 4,018,432, according to the 2010 census. The total population aged 65 and above is 1.177 million, according to the Statistical Yearbook of Nanning City in 2018 [57].
Sports facilities data (e.g., their address and other attributes including investment) were collected from statistical yearbooks published by Nanning Sports Bureau and Nanning Statistical Bureau, as well as relevant bulletins and government reports published by various district departments of Nanning. All the sports facilities have been classified by Nanning Sports Bureau into approximately 20 categories, based on the type of sports facility they provide (e.g., badminton). Data on the land use area and financial investment for each facility were also collated. The location data (e.g., longitudes and latitudes) of the sports facilities were captured manually from Google Maps and Baidu web services. Where facility location data were ambiguous, fieldwork was carried out to clarify the exact location. The spatial distribution of all sports facilities in Nanning City is shown in Figure 3. Open-air sports facilities, such as health trails and golf courses, were excluded from this study. The former (about 1000), which provide public health benefits, are the subject of a future study. Golf courses were omitted from this study because residents do not widely play golf due to its high membership fee. In total, there were 5,440 sports facilities across the urban area of Nanning City in 2017, covering a total area of 5,496,638 square meters. Transport and administrative boundary data were derived from 1:10,000 maps of Nanning City in 2017.
3.3. Methods
3.3.1. Regional Allocation
The coefficient of geographical association reflects the degree of coincidence of two geographical elements across space. A large coefficient of geographical association indicates a relatively consistent distribution of the two geographical elements, as shown in Equation (1) [58]:
where G denotes the coefficient of geographical association, Fi is the proportion of the first geographical element in the ith region, and Si is the proportion of the second geographical element in the ith region. The spatial match between population scale and sports facilities volumes was measured by an index of allocation, R, as shown in Equation (2):
where Ri represents the allocation value of the ith unit (sub-district in this case), Xi and Yi are the population and a total area of sports facilities within the ith unit, respectively. It is argued that spatial inequality is indicated by an allocation index greater than 0.3. The smaller the negative value of Ri, the better sports facilities are distributed across the region and vice versa.
3.3.2. Spatial Accessibility
Accessibility to each sports facility included in this study was calculated by using the cost distance analysis tool in ArcGIS. The vast majority of residents in Nanning City prefer to use electric bicycles for all daily activities, followed by walking. According to the empirical study [59], a questionnaire survey with the old age group in this city conducted in 2019 reports that more than 85% of this population aged 65 and above only do fast jogging and walking in nearby parks and local neighborhoods (e.g., health trials) and street dancing in open space. More than 95% of them complain about the poor provision of sports facilities suitable for them, in terms of quantity and diversity. A majority of seniors, particularly after their retirement (60 years old for males and 55 for females in China), devote their time to look after their grandchildren. Relatively, they have lower awareness of the health impacts of physical exercise and poorer level of financial accessibility to charged sports facilities and public transport than employed people. Consequently, their dominant mode of travel for physical exercise (walking, jogging, and dancing) is walking, normally within 10 min.. Only 2% of the population in this group take public transport for physical exercise. The compact urban form and sub-tropical weather of Nanning City are particularly suitable for using the electric bicycle for journeys <1 hour. The maximum speed limit for such mode of travel is set at 20 km/h in urban areas. Consequently, the cost value of all traffic corridors is set as 30. Walking is the only way to access sports facilities in areas without transport facilities, so its cost value is set at 150, and areas of water are defined as barriers. Firstly, the time distance from any point to the nearest sports facility was calculated. Secondly, all the sports facilities, which could be accessed from the centroid of the sub-district unit polygon within a defined cost or time distance (e.g., 20 min.), were aggregated by area. Thirdly, the ratio of each aggregated area to the total area of the sub-district unit was used as a measure of accessibility. The larger the ratio, the higher the accessibility to sports facilities within the sub-district unit.
3.3.3. Discrete Value, Coefficient of Variation and Diversity of Sports Facilities
The discrete value of the per capita area of all types of sports facilities in each sub-district (township or town) was defined as the difference between the ratio of per capita use of one-type sports facility in a particular sub-district (township or town) to that of all types of sports facilities in the whole study area and the mean value of the above ratios for all sub-districts (townships or towns), as shown in Equation (3):
where Dxi represents the discrete value of the variable (ratio of per capita use of one type of sports facility in the xth sub-district unit to all in the whole study area), Txi is the land use area of the ith type of sports facility in the ith sub-district unit, Px is the population within the same unit, Ti is the total land use area of ith type of sports facility, and P is the total population of the study area. The smaller Dxi is, the more equally distributed sports facilities are among the population.
The Coefficient of Variation (CV), a popular index to measure the dispersion [60], was used to measure the spatial balance between all types of sports facilities, as shown in Equation (4):
where CV refers to the coefficient of variation in sports facilities, Txi is the total land use area of the ith type of sports facility in the xth sub-district unit, Px is the total population in the xth unit, Ti is the total land use area of the ith type of sports facility and P is the total population in the study area. The larger the coefficient of variation is, the more unbalanced the distribution of sports facilities will be across the whole study area.
The above-mentioned coefficient of variation can be used to measure the overall spatial distribution of sports facilities but not their diversity. For this an ecological concept of species evenness, which measures the evenness of species population distribution in a community or biological environment [61], was used to measure how evenly different types of sports facilities (including all types and group types) were distributed within units, as shown in Equation (5):
where Vx denotes the evenness of the xth unit, reflecting diversity, i refers to a single type of sports facility; Pxi is the ratio of the land use area of the ith type of sports facility to the total area of all facilities across the spatial unit, and S is the total number of types of sports facilities in this study. The larger the index is, the more diverse the sports facilities in each unit will be. The distribution of sports facility diversity reflects the spatial availability degree of facility types across the study area.
3.3.4. GWR (Geographically Weighted Regression) Model
Fotheringham’s [62] Geographically Weighted Regression (GWR) model was used to analyze the spatial heterogeneity of the socio-economic factors influencing the accessibility and spatial allocation of sports facilities. GWR, which has become a popular method for exploring spatial non-stationarity, a form of spatial heterogeneity, uses observations from adjacent units to estimate local regression statistics, and the estimated parameters can be mapped across a study area. The GWR method is represented as follows:
where Yi refers to a dependent variable (in this study, either investment intensity or accessibility (20 min.)), Uiand Vi are the geographical coordinates of the ith unit centroid, Β0(Ui,Vi) is the constant term in the ith unit, Βk(Ui,Vi) is the kth regression coefficient (or parameter estimate) in the ith unit, P represents the number of independent variables, Xik is the kth independent variable and εi is the random error.
4. Results
4.1. Spatial Inequality of Sports Facilities
The allocation index defined in Equation (2) was used to reflect how well the distribution of all types of sports facilities matched the population distribution within each sub-district unit. The spatial distribution of the index across all 61 sub-district units is shown in Figure 4.
The sports facilities were distributed unevenly across the urban area, indicated by the large disparity in allocation index between the central, the middle, and the outer urban units. The distribution of sports facilities better matched the local population in the outer urban area than in the central urban area. Only in a few sub-districts in the central urban area with high population density were the sports facilities sufficiently distributed together with other urban health care services.
To understand the socio-economic process shaping the spatial disparity, the Pearson correlation coefficient between land areas and investment in sports facilities at the sub-district level was calculated. The Pearson correlation coefficient (0.939, p < 0.01) indicated that the uneven allocation of sports facilities was directly associated with the variations in investment intensity by the central government, regional government, Nanning city, counties (districts), enterprises and institutions (self-raised), social donations, and some other channels. The funds from Guangxi Autonomous Region government and county-level funds provided the leading investment.
4.2. Disparate Accessibility to Sports Facilities
As the majority of journeys to sports facilities by local residents are within 20 min. by electric bicycle, two different threshold times for calculating spatial accessibility to sports facilities were set at 10 and 20 min.. The results of the spatial accessibility analysis using cost-distance analysis are shown in Figure 5.
Accessibility to sports facilities within a 10- or 20-min. journey (Figure 5b,c) show very similar concentric spatial patterns in which accessibility decreases with distance from the city center. Most sub-districts have better access to sports facilities within a 20-min. journey than a 10-min. one. The outer urban areas have more inadequate accessibility within a 10- or 20-min. journey. Sub-districts with better accessibility have a denser network of local roads, as well as better connections to the provincial and national highway networks. It is assumed that the investment intensity in sports facilities might be determined by road density. This is tested in Section 4.3 and Section 4.4.
4.3. Diversity of Sports Facilities
Of the types of sports facilities classified by the Nanning Bureau of Sports, some, such as beach volleyball courts, shooting galleries, handball courts, and martial arts stadium is only used for professional training for national and international sports events. These facilities were not included in the analysis of diversity due to low accessibility by the public. Some facilities were merged into one category, e.g., badminton stadiums and fields were combined into a single badminton facility category. In total, 13 categories were used in the analysis of diversity.
Spatial patterns of discreteness calculated with Equation (3) for all 13 categories of sports facilities are shown in Figure 6. The variation coefficients of all 13 sports facilities are shown in Table 1.
There is a large disparity in the coefficient of variation between the 13 types of sports facilities (Table 1). The maximum value is 0.484 for swimming pools, and the minimum value is 0.081 for basketball courts. Other sports facilities show increasing values from table tennis, athletic tracks, badminton facilities, football fields, air volleyball/volleyball courts, outdoor gyms, gateball courts, tennis courts, indoor sports stadiums, to fitness centers. Basketball and table tennis courts are both equally well distributed, probably because these two sports are the most popular for all age groups and their investment and on-going costs are relatively low. Fitness centers and swimming pools are the most unequally distributed sports facilities. These two sports are season- or age-specific, the former more popular with young people in winter and the latter by children in summer. Both facilities are funded through high-fee membership systems so they might be more accessible in wealthier areas.
Figure 6 shows the distribution of some facilities (e.g., table tennis and basketball) is well balanced between the city center and the outer areas, however, most facilities have an unbalanced distribution with a higher concentration in the city center. The GASC released a national standard on the per capita construction area of sports facilities in urban communities in 2005 [63]. For example, the minimum construction area for table tennis and badminton should be 0.06 m2 and 0.032 m2 per capita, respectively. According to this standard, there are only 14 and 19 sub-districts and towns (out of 61 in total), respectively, which can meet the standard for table tennis (e.g., Liangqinq town) and badminton (e.g., Fujianyuan township). These figures indicate the spatial inequity in sports facilities provision according to the above-mentioned national standard because a majority of places are still short of facilities. As these two sports are the most popular ones in China so local governments need to promote diverse investments to reduce such inequity.
The diversity of sports facilities, as measured by a spatial evenness index (Equation (5)), is shown in Figure 7. Overall, diversity decreases with distance from the city center, demonstrating a concentric pattern. The units with the lowest diversity are townships in outer urban areas. This suggests the development of sports facilities is slower in suburban areas than in the city center. This inequality, in terms of diversity, has been influenced by the changes of administrative jurisdiction from rural to urban in the outer urban areas due to rapid urban growth in the last decade.
The 13 types of sports facilities were classified into three groups according to the dominant age of users: young and middle-aged, old aged, and all ages. For example, the sports facilities for the young and middle-aged group include football fields, fitness centers, basketball courts, volleyball courts, air volleyball fields, badminton facilities, and tennis courts. The sports facilities for the old aged group include outdoor gyms and gateball courts (as shown in Figure 8), and those for the all ages groups include stadiums and table tennis courts.
The diversity of sports facilities for each age group was calculated using Equation (5). The results, presented in Figure 9, indicate variations in the spatial and social equity between age groups. The facilities for the all age group are more evenly distributed than those for the other two age groups. The old aged group is provided with the least evenly distributed facilities. The areas, with the most evenly distributed facilities for the old aged group, are mainly located in the center urban, while the areas, with the same for the young and middle-aged group, are mainly located in the outer urban.
There have been significant statistics [64] showing the health outcomes of sports facilities distribution. For example, 90.8% of the population aged 65 and above in the central districts meet the required standard of physical fitness, which is higher than only 85.6% in the outlying districts. For the same age group, the prevalence of obesity and overweight in the outlying districts is higher by 1.1% and 0.3%, respectively, than that in the central districts. These statistics [64] clearly indicate that the old age group in the central districts has better health than that in the outlying districts. Another report [65] further confirmed that the old age group in the case study central districts of Qingxiu and Xingning has better performance in body shape, body functions and physical fitness than the group in the outlying district of Xixiangtang.
However, the spatial pattern is reversed for the group aged 15 to 65. Moreover, 91.6% of the population aged 15–65 in the central districts meet the required standard of physical fitness, which is lower than only 94.4% in the outlying districts. For the same group, the prevalence of obesity and overweight in the outlying districts is lower by 2.4% and 0.9%, respectively, than that in the central districts. These statistics [64] clearly indicate that the population aged 15–65 in the central districts have poorer health than those in the outlying districts. There are at least two reasons contributing to the disparity: (1) This age group usually has higher pressures of studying or working in the central districts than in the outlying districts, thereby, they have no time to do physical exercise, (2) table tennis and basketball, which are the most popular sports facilities for this age group in China, are more available in the outlying districts than in the central districts.
4.4. Geographical Weighted Regression (GWR) Analysis
Two sets of Ordinary Least Squares (OLS) and GWR models were developed using different sets of dependent and explanatory variables. In the first OLS/GWR models, accessibility (20 min.) was deployed as the dependent variable and the population in three age groups (under 15, 15–65 and over 65) as the three explanatory variables [66,67]. In the second OLS/GWR models, investment intensity was utilized as the dependent variable, and population density and road network density were used as the two explanatory variables. Both OLS and GWR models were run in ArcGIS 10.7. Adaptive bandwidth was selected for GWR calibration. The statistics (e.g., parameter estimates (PE) and t-statistics) from the OLS models and the GWR models are presented in Table 2 and Table 3, respectively.
In the first model of accessibility, where the three age groups were used as the explanatory variable, the GWR model outperformed the OLS model in terms of adjusted R2, AICc (Table 3). This indicates that the GWR model can better explain the variation of accessibility and has significantly reduced spatial dependence present in the data. The optimal bandwidth for the GWR model was 18, 30% of all units, indicating local spatial effects. The spatial distribution of the parameter estimates and corresponding t-statistic values for all three explanatory variables are shown in Figure 10. Only those units with significant contributions at 1% level (t-statistic >2.58) are mapped. All three age groups demonstrate a positive contribution to accessibility, but these contributions show strong spatial heterogeneity. The spatial pattern of parameter estimation for the 15–65 age group is markedly different from those of the other two age groups. The value of parameter estimates for the 15–65 age group gradually increases from the city center to its outer urban area, whereas the converse is true for the other two age groups, in particular the <15 age group, where the higher values are heavily concentrated in the city center. This indicates the provision of sports facilities is not well matched to the studying and working groups (aged 15–65), who need more physical exercise. In other words, the spatial distribution of sports facilities shows spatial and social inequality between different parts of the city and between age groups.
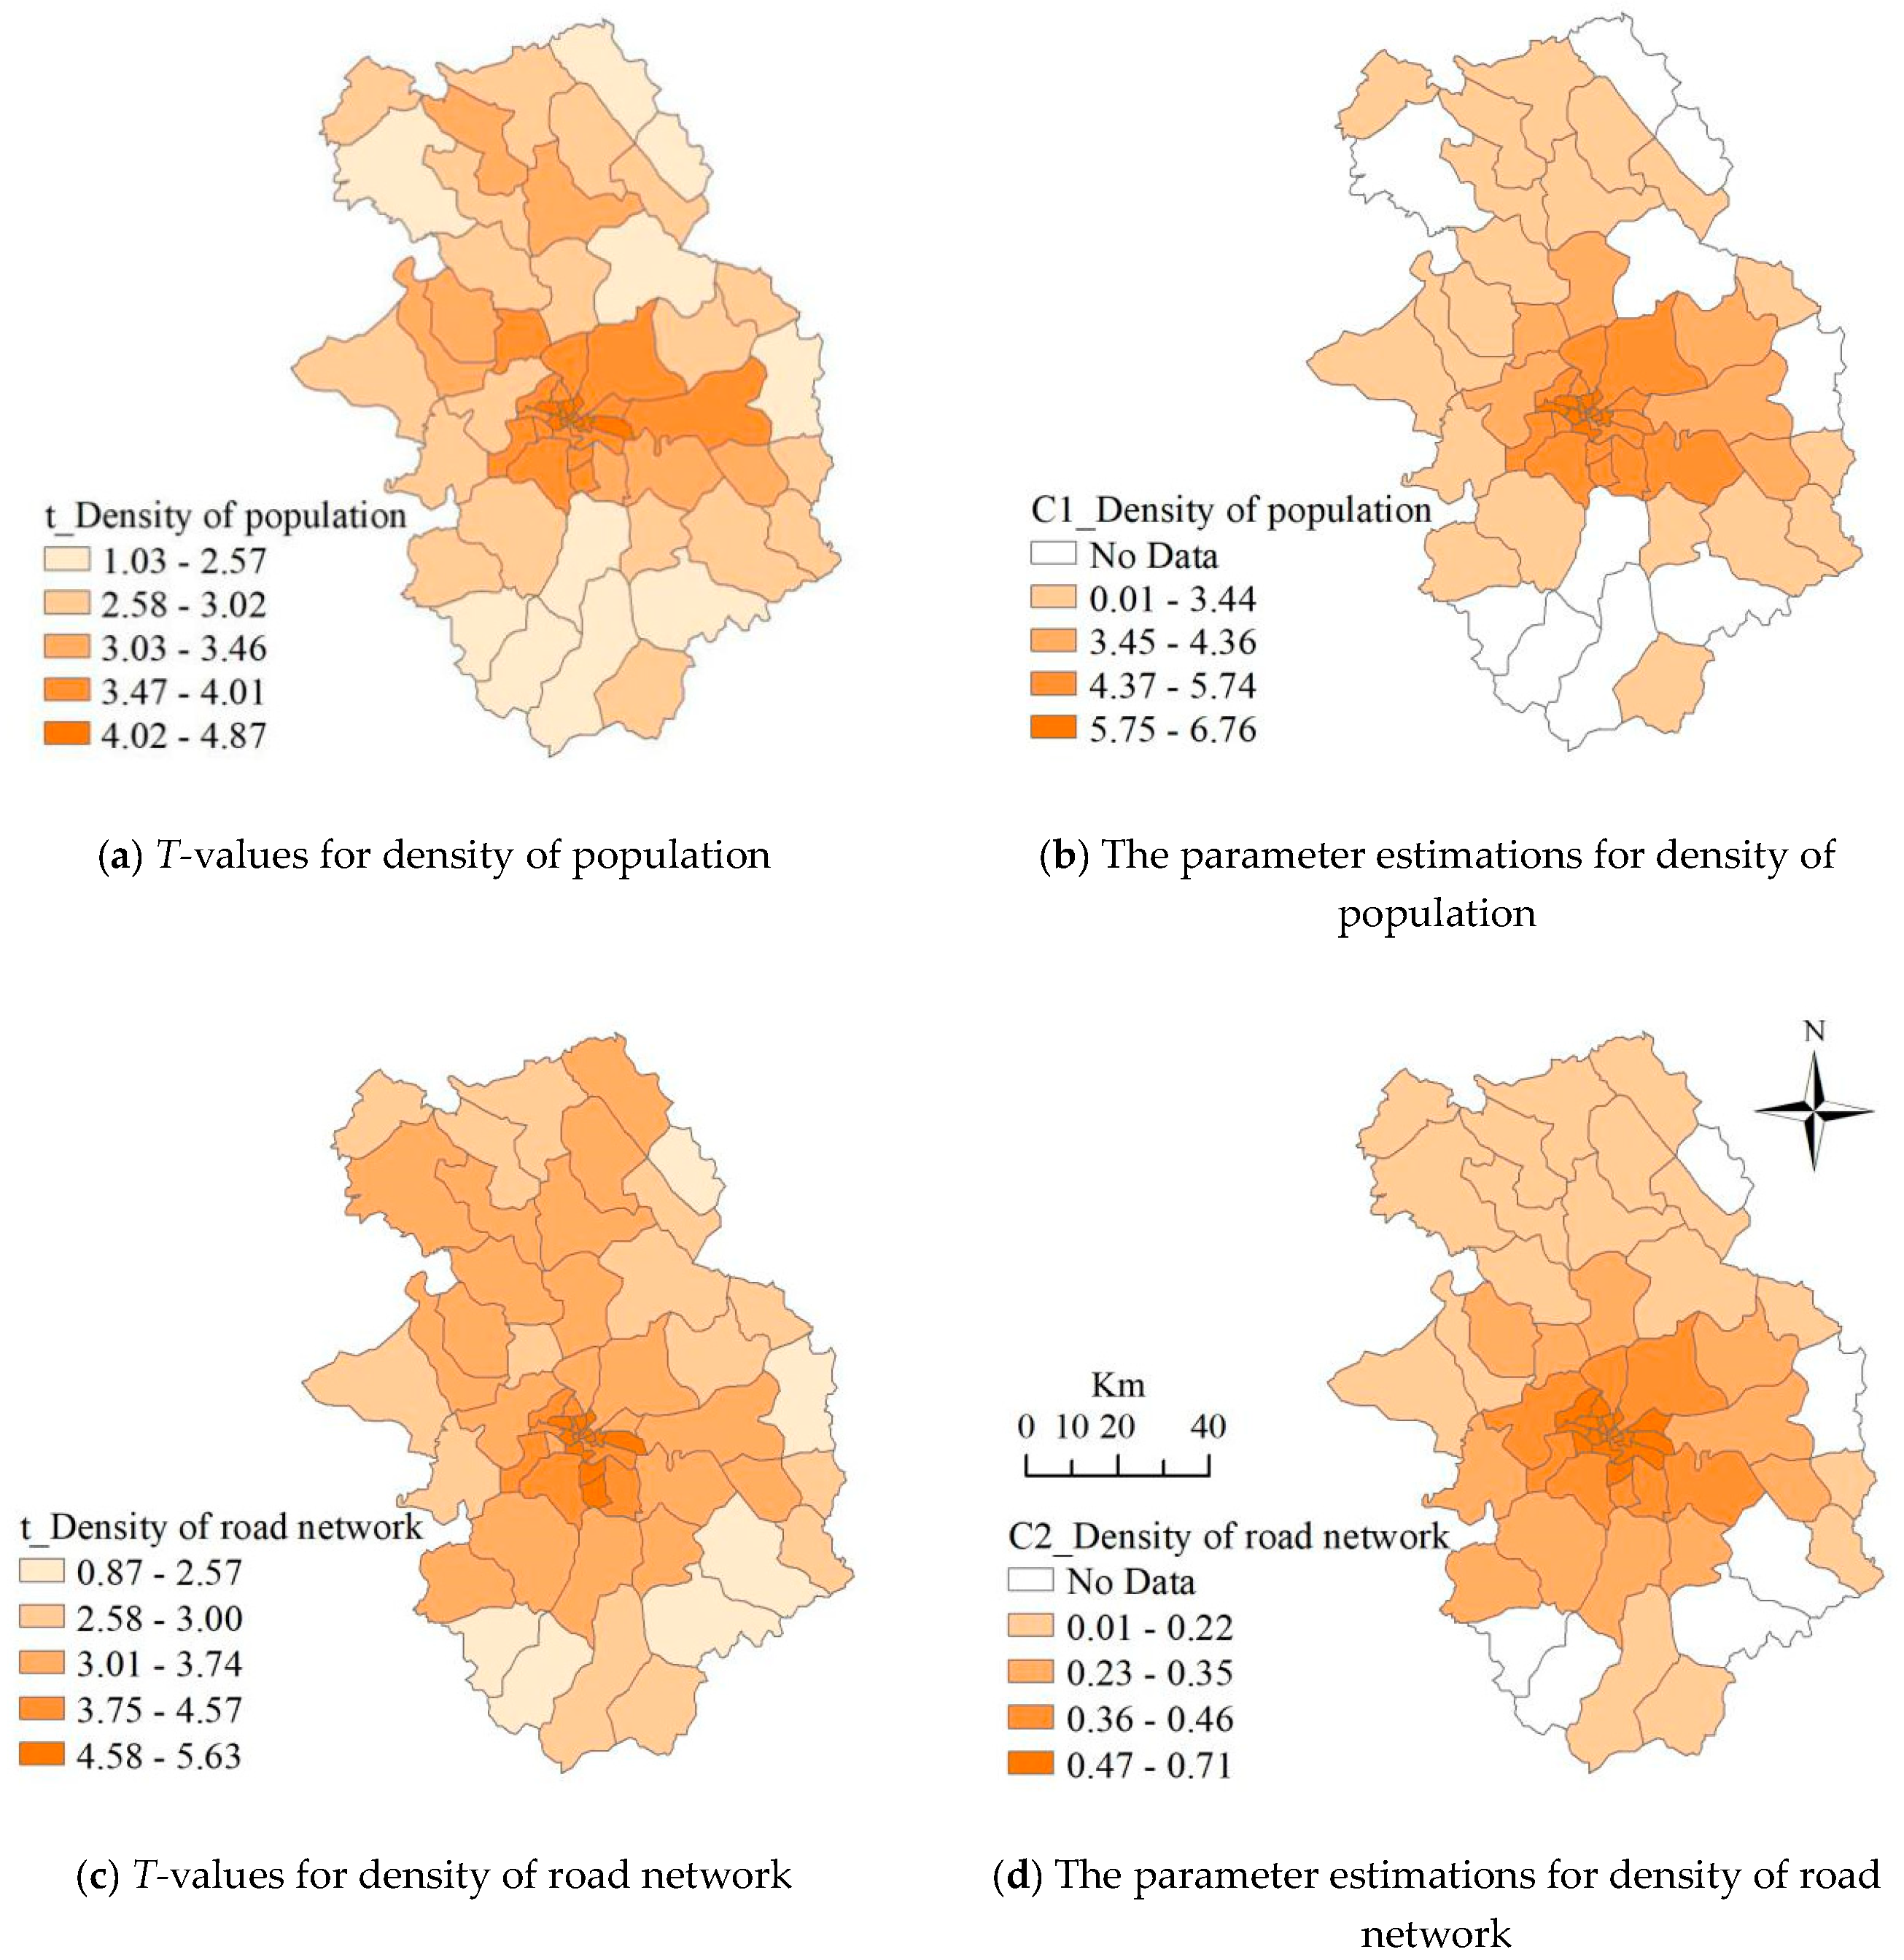
Of the two sports facilities investment intensity models, which used population/road network density as the explanatory variables, the GWR model markedly outperformed the OLS model, particularly in terms of adjusted R2 (0.85 compared with 0.76). The optimal bandwidth for the GWR model was 16, 28% of all units, indicating a strong local spatial effect. The distribution of parameter estimates and corresponding t-statistic values for the two explanatory variables are shown in Figure 11. As before, only units with statistically significant effects at a 1% significance level (t-statistic >2.58) are mapped. Both explanatory variables explained investment intensity and showed similar patterns of variability in which investment intensity decreases from the city center to the outer urban area. Road density has a significant influence on investment intensity in more sub-districts than population density. Investment intensity was not significantly explained (at a 1% significance level) by road density in six units or by population density in ten units. This suggests the strategy for investment in sports facilities is very much dependent on road density around the location of these facilities, as might be expected from an economic benefits perspective.
Due to the traditional roles of government intervention in public service facilities investment, the influence of market forces on the sport industry seems to be very limited in these third-tier cities across China, compared with the first-tier cities such as Beijing, Shanghai, and Guangzhou. The poor investment in sports facilities and road infrastructure, particularly in remote rural areas, contributes to a mixture of regional inequality, spatial inequity, and social injustice at the current stage of urbanization and population aging.
5. Conclusions
Inequality and equity are key elements of urban sustainability of concern to governments and academia. This paper has explored the inequality of sports facilities in Nanning City, China, from spatial and social perspectives. The regional inequality, accessibility disparity, and diversity of sports facilities, taking account of socioeconomic determinants, were calculated using several spatial indicators and a GWR modeling approach within ArcGIS.
The results indicate a strong spatial mismatch between the concentric distribution of sports facilities and population density, particularly in the central urban area. The central urban mismatch, caused by low-capacity facilities, and high population density, can be explained by the pattern of sports facility investment intensity. Accessibility to sports facilities decreases with distance from the city center. This spatial pattern is explained by high-density and wide distribution of sports facilities and high-level connectivity to a variety of road networks. The diversity of sports facilities varied between age groups. In particular, students and employees (15–65 age group) have less diverse facilities, which leads to social injustice and should be studied further in future work. The spatial inequality of sports facilities can be explained by the heterogeneous impacts of age structure, road network density, and population density. These findings have significant implications for local urban planning and governance.
At present, both the government and market forces play important roles in the investment and construction of sports facilities in Nanning City in the era of Healthy City development. It is suggested that more attention should be paid to regional inequality and spatial equity in the short term but to social justice in the long term. More investment in sports facilities should be provided to improve the per capita area of sports facilities in the outer urban zone. The road infrastructure in suburban towns and townships should be further developed to increase connectivity between these areas. The spatial diversity of sports facilities, particularly for less popular sports, should be increased and the distribution of various sports optimized. Comparatively more sports space should be planned for elderly people in the city center. The national standards mentioned above need to specify the per capita area of sports facilities for different age groups, in order to reduce the equity between them. There should be a bottom-up process for citizens to participate in the local community plan of sports facilities provision. This process facilitates the match between demand and supply at disaggregated levels.
This study also showed that the geographical pattern of sports facilities follows a concentric zone structure [68]. This might be caused by the compact form of this medium-sized city, which is less developed, compared with many other well-developed cities with polycentric urban forms, such as Beijing, Shanghai, and Guangzhou. With the rapid urban expansion, this city might be developed into a polycentric urban form. It would be interesting to explore the spatial process of sports facility development in the future.
The findings from this empirical study have many implications for the sustainable development of Chinese cities. The central government released an initiative—China’s National Fitness Program (2016-2020) in which one target is to achieve a 1.8 square meter area of sports facilities per capita by the end of 2020 [69]. However, this general indicator lacks meaningful social and spatial dimensions. As revealed by this empirical study, the reduction of inequality and the improvement of equity and social justice should consider the spatial and social matches between demand and supply (allocation, accessibility, and diversity of sports facilities between places and between age and social groups). To achieve these ambitions, some gated sports facilities, such as those within walled schools, should be opened to the public, particularly at night and summer (during school vacations). There should be a better balance between indoor and outdoor sports facilities to improve residents’ accessibility to physical exercise in bad weather. Many abandoned factories and warehouses could be renewed into sports centers with low-cost provisions. Functionally, diverse sports facilities useable in all seasons should match the age structure of the local population.
This study was limited by the spatial resolution of data available. Spatial analysis was carried out at the sub-district (townships/towns) unit scale as this corresponded with the available population data. In the future, urban community data (administered by residential committees)—the finest level of statistical unit in Chinese cities—should be developed for use in socioeconomic studies [70]. Many other countries have used very high-resolution units for national census surveys, such as the ‘output area’ unit used in several national surveys in the UK, which is a much smaller area than the urban community unit in China. The use of finer statistical units will improve the analysis of indicators, spatial inequality, and spatial heterogeneity in GWR modeling. This study supports prior recommendations [71] to develop China’s spatial data infrastructure for future quantitative urban studies. Sports facilities were classified into 13 categories and age groups into three categories in this study, but the classifications need more robust justification based on extensive surveys with a variety of age groups, which is recommended for future work. When such urban data infrastructure is improved, the measurement of accessibility to sports facilities should consider public transport, costing, and frequency in using sports facilities, spatial competitions and temporal availability.
Author Contributions
Conceptualization, J.S. and J.C.; methodology, J.S.; software, J.S.; validation, J.S. and J.C.; formal analysis, J.S.; investigation, W.H.; resources, W.H.; data curation, F.Z.; writing—original draft preparation, J.S.; writing—review and editing, J.C.; visualization, J.S.; supervision, J.C.; project administration, J.S.; funding acquisition, J.S. All authors have read and agreed to the published version of the manuscript.
Funding
This research was funded by the National Natural Science Foundation of China, grant numbers 41571140; 41871159; 41871137; the Program of Social Science Popularization in Anhui Province, China, grant number GZ18023; Planning Program of Philosophy and Social Science in Province, China, grant number AHSKY2018D17; Guangxi Natural Science Foundation, grant number 2017GXNSFBA198160.
Conflicts of Interest
The authors declare no conflict of interest.
References
- Swann, W.L.; Brixey, E.; Wohler, W. Linking local sustainability policies to health outcomes: An analysis of the urban sustainability-health nexus. J. Urban Aff. 2019, 41, 1–18. [Google Scholar] [CrossRef]
- Li, F.Z. Physical activity and health in the presence of China’s economic growth: Meeting the public health challenges of the aging population. J. Sport Health Sci. 2016, 5, 258–269. [Google Scholar] [CrossRef] [PubMed] [Green Version]
- Wu, S.; Luo, Y.; Qiu, X.; Bao, M. Building a healthy China by enhancing physical activity: Priorities, challenges, and strategies. J. Sport Health Sci. 2016, 6, 125–126. [Google Scholar] [CrossRef] [Green Version]
- Yang, J.; Siri, J.G.; Remais, J.V.; Cheng, Q.; Zhang, H.; Chan, K.K.Y.; Sun, Z.; Zhao, Y.; Cong, N.; Li, X.; et al. The Tsinghua–Lancet Commission on Healthy Cities in China: Unlocking the power of cities for a healthy China. Lancet 2018, 391, 2140–2184. [Google Scholar] [CrossRef] [Green Version]
- Zhang, C.; Gong, P. Healthy China: From words to actions. Lancet Public Health 2019, 4, e438–e439. [Google Scholar] [CrossRef] [Green Version]
- World Health Organization (WHO). Global Action Plan on Physical Activity 2018–2030: More Active People for a Healthier World; WHO: Geneva, Sweden, 2018. [Google Scholar]
- Shrestha, S.; Kestens, Y.; Thomas, F.; El Aarbaoui, T.; Chaix, B. Spatial access to sport facilities from the multiple places visited and sport practice: Assessing and correcting biases related to selective daily mobility. Soc. Sci. Med. 2019, 236, 112406. [Google Scholar] [CrossRef]
- Hoekman, R.; Breedveld, K.; Kraaykamp, G. A landscape of sport facilities in the Netherlands. Int. J. Sport Policy Politics 2015, 8, 305–320. [Google Scholar] [CrossRef]
- Zheng, J.; Chen, S.; Tan, T.-C.; Lau, P. Sport policy in China (Mainland). Int. J. Sport Policy Politics 2018, 10, 1–23. [Google Scholar] [CrossRef]
- Dadashpoor, H.; Rostami, F.; Alizadeh, B. Is inequality in the distribution of urban facilities inequitable? Exploring a method for identifying spatial inequity in an Iranian city. Cities 2016, 52, 159–172. [Google Scholar] [CrossRef]
- Zhang, L.; Zhou, T.; Mao, C. Does the Difference in Urban Public Facility Allocation Cause Spatial Inequality in Housing Prices? Evidence from Chongqing, China. Sustainability 2019, 11, 6096. [Google Scholar] [CrossRef] [Green Version]
- Jiang, H.Y.; Zhou, C.S.; Xiao, R.B. Spatial differentiation and social equity of public parks in Guangzhou. China City Plan. Rev. 2010, 34, 43–48. (In Chinese) [Google Scholar]
- Talen, E.; Anselin, L. Assessing Spatial Equity: An Evaluation of Measures of Accessibility to Public Playgrounds. Environ. Plan. A: Econ. Space 1998, 30, 595–613. [Google Scholar] [CrossRef] [Green Version]
- Yuan, Y.; Xu, J.; Wang, Z.-B. Spatial Equity Measure on Urban Ecological Space Layout Based on Accessibility of Socially Vulnerable Groups—A Case Study of Changting, China. Sustainability 2017, 9, 1552. [Google Scholar] [CrossRef] [Green Version]
- Rich, R.C. Neglected Issues in the Study of Urban Service Distributions: A Research Agenda. Urban Stud. 1979, 16, 143–156. [Google Scholar] [CrossRef]
- Harvey, D. Social Justice and the City; The University of Georgia Press: Georgia, GA, USA, 2009; pp. 22–49. [Google Scholar]
- Teitz, M.B. Toward a theory of urban public facility location. Pap. Reg. Sci. 1968, 21, 35–51. [Google Scholar] [CrossRef]
- Bigman, D.; Revelle, C. The Theory of Welfare Considerations in Public Facility Location Problems. Geogr. Anal. 2010, 10, 229–240. [Google Scholar] [CrossRef]
- Church, R.; Revelle, C. The maximal covering location problem. Pap. Reg. Sci. 1974, 32, 101–118. [Google Scholar] [CrossRef]
- Cooper, L. Location-Allocation Problems. Oper. Res. 1963, 11, 331–343. [Google Scholar] [CrossRef]
- Hakimi, S.L. Optimum Distribution of Switching Centers in a Communication Network and Some Related Graph Theoretic Problems. Oper. Res. 1965, 13, 462–475. [Google Scholar] [CrossRef]
- Cox, K.R.; Johnston, R.J. Conflict, Politics, and the Urban Scene; Martin’s Press: New York, NY, USA, 1982. [Google Scholar]
- Nelson, C.A.; Wolch, J.R. Intrametropolitan planning for community-based residential care: A goals programming approach. Socio-Economic Plan. Sci. 1985, 19, 205–212. [Google Scholar] [CrossRef]
- Pacione, M. Access to urban services—the case of secondary schools in Glasgow. Scott. Geogr. Mag. 1989, 105, 12–18. [Google Scholar] [CrossRef]
- Martin, D.; Williams, H.C.W.L. Market-area analysis and accessibility to primary health care centers. Environ. Plan. A 1992, 24, 1009–1019. [Google Scholar] [CrossRef]
- Scott, D.; Jackson, E.L. Factors that limit and strategies that might encourage people’s use of public parks. J. Park Recre. Admin. 1996, 14, 1–17. [Google Scholar]
- Dadashpoor, H.; Rostami, F. Measuring spatial proportionality between service availability, accessibility and mobility: Empirical evidence using spatial equity approach in Iran. J. Transp. Geogr. 2017, 65, 44–55. [Google Scholar] [CrossRef]
- Stern, E.; Michlis, M. Redefining high school catchment areas with varying effects of achievement equality. Appl. Geogr. 1986, 6, 297–308. [Google Scholar] [CrossRef]
- Zhang, W.; Cao, K.; Liu, S.; Huang, B. A multi-objective optimization approach for health-care facility location-allocation problems in highly developed cities such as Hong Kong. Comput. Environ. Urban Syst. 2016, 59, 220–230. [Google Scholar] [CrossRef]
- Song, Z.; Yan, T.; Ge, Y. Spatial Equilibrium Allocation of Urban Large Public General Hospitals Based on the Welfare Maximization Principle: A Case Study of Nanjing, China. Sustainability 2018, 10, 3024. [Google Scholar] [CrossRef] [Green Version]
- Mayaud, J.; Tran, M.; Pereira, R.H.; Nuttall, R. Future access to essential services in a growing smart city: The case of Surrey, British Columbia. Comput. Environ. Urban Syst. 2018, 73, 1–15. [Google Scholar] [CrossRef] [Green Version]
- Delafontaine, M.; Neutens, T.; Schwanen, T.; Van De Weghe, N. The impact of opening hours on the equity of individual space–time accessibility. Comput. Environ. Urban Syst. 2011, 35, 276–288. [Google Scholar] [CrossRef] [Green Version]
- Chen, T.; Hui, E.C.M.; Lang, W.; Tao, L. People, recreational facility and physical activity: New-type urbanization planning for the healthy communities in China. Habitat Int. 2016, 58, 12–22. [Google Scholar] [CrossRef]
- Cho., C.M. Study on Effects of Resident—Perceived Neighborhood Boundaries on Public Services Accessibility and its Relation to Utilization: Using Geographic Information System, Focusing on the case of public parks in Austin, Texas. Ph.D. Thesis, Texas A & M University, Texas, TX, USA, 2003. [Google Scholar]
- Chakraborty, N.M.; Montagu, M.; Wanderi, J.; Oduor, C. Who Serves the Poor? An Equity Analysis of Public and Private Providers of Family Planning and Child Health Services in Kenya. Front. Public Health 2019, 6, 1–10. [Google Scholar] [CrossRef] [PubMed] [Green Version]
- Panter, J.; Jones, A.; Hillsdon, M. Equity of access to physical activity facilities in an English city. Prev. Med. 2008, 46, 303–307. [Google Scholar] [CrossRef] [PubMed]
- Higgs, G.; Langford, M.; Norman, P. Accessibility to sport facilities in Wales: A GIS-based analysis of socio-economic variations in provision. Geoforum 2015, 62, 105–120. [Google Scholar] [CrossRef] [Green Version]
- Chen, W. Equity and medical security for the vulnerable. Chin. J. Health Policy 2011, 4, 4–5. (In Chinese) [Google Scholar]
- Pastor, M.; Morello-Frosch, R.; Sadd, J.L. Breathless: Schools, Air Toxics, and Environmental Justice in California. Policy Stud. J. 2006, 34, 337–362. [Google Scholar] [CrossRef] [Green Version]
- Giles -Corti, B.; Donovan, R.J. Socioeconomic status differences in recreational physical activity ratings and real and perceived access to a supportive physical environment. Preventive Med. 2002, 35, 601–611. [Google Scholar] [CrossRef]
- A Perkins, H.; Heynen, N.; Wilson, J. Inequitable access to urban reforestation: The impact of urban political economy on housing tenure and urban forests. Cities 2004, 21, 291–299. [Google Scholar] [CrossRef]
- Comber, A.; Brunsdon, C.; Green, E. Using a GIS-based network analysis to determine urban greenspace accessibility for different ethnic and religious groups. Landsc. Urban Plan. 2008, 86, 103–114. [Google Scholar] [CrossRef] [Green Version]
- Wolch, J.; Wilson, J.P.; Fehrenbach, J. Parks and Park Funding in Los Angeles: An Equity-Mapping Analysis. Urban Geogr. 2005, 26, 4–35. [Google Scholar] [CrossRef] [Green Version]
- Pereira, R.H. Transport legacy of mega-events and the redistribution of accessibility to urban destinations. Cities 2018, 81, 45–60. [Google Scholar] [CrossRef]
- Lang, W.; Radke, J.D.; Chen, T.; Chan, E.H. Will affordability policy transcend climate change? A new lens to re-examine equitable access to healthcare in the San Francisco Bay Area. Cities 2016, 58, 124–136. [Google Scholar] [CrossRef]
- Barbera, S.; Bevia, C. Locating public facilities by majority: Stability, consistency and group formation. Games Econ. Behav. 2006, 56, 185–200. [Google Scholar] [CrossRef] [Green Version]
- Griffin, P.M.; Scherrer, C.R.; Swann, J. Optimization of community health center locations and service offerings with statistical need estimation. IIE Trans. 2008, 40, 880–892. [Google Scholar] [CrossRef]
- Billaudeau, N.; Oppert, J.-M.; Simon, C.; Charreire, H.; Casey, R.; Salze, P.; Badariotti, D.; Banos, A.; Weber, C.; Chaix, B. Investigating disparities in spatial accessibility to and characteristics of sport facilities: Direction, strength, and spatial scale of associations with area income. Heal. Place 2011, 17, 114–121. [Google Scholar] [CrossRef] [PubMed]
- Ibes, D.C. A multi-dimensional classification and equity analysis of an urban park system: A novel methodology and case study application. Landsc. Urban Plan. 2015, 137, 122–137. [Google Scholar] [CrossRef]
- Hughey, S.M.; Walsemann, K.; Child, S.; Powers, A.; Reed, J.A.; Kaczynski, A.T. Using an environmental justice approach to examine the relationships between park availability and quality indicators, neighborhood disadvantage, and racial/ethnic composition. Landsc. Urban Plan. 2016, 148, 159–169. [Google Scholar] [CrossRef]
- Lamb, K.E.; Ferguson, N.; Wang, Y.; Ogilvie, D.; Ellaway, A. Distribution of physical activity facilities in Scotland by small area measures of deprivation and urbanicity. Int. J. Behav. Nutr. Phys. Act. 2010, 7, 76. [Google Scholar] [CrossRef] [Green Version]
- Macdonald, L. Associations between spatial access to physical activity facilities and frequency of physical activity; how do home and workplace neighbourhoods in West Central Scotland compare? Int. J. Health Geogr. 2019, 18, 2. [Google Scholar] [CrossRef]
- Kubota, A.; Matsushita, M.; Smith, B.J.; Sugiyama, T.; Arao, T. The impact of a new exercise facility on physical activity at the community level: A non-randomized panel study in Japan. BMC Public Health 2019, 19, 777. [Google Scholar] [CrossRef]
- I Halonen, J.; Stenholm, S.; Kivimaki, M.; Pentti, J.; Subramanian, S.; Kawachi, I.; Vahtera, J. Is change in availability of sports facilities associated with change in physical activity? A prospective cohort study. Prev. Med. 2015, 73, 10–14. [Google Scholar] [CrossRef]
- Han, E.J.; Kang, K.; Sohn, S.Y. Spatial association of public sports facilities with body mass index in Korea. Geospat. Health 2018, 13, 48–55. [Google Scholar] [CrossRef] [PubMed]
- Langford, M.; Higgs, G.; Radcliffe, J. The application of network-based GIS tools to investigate spatial variations in the provision of sporting facilities. Ann. Leis. Res. 2017, 21, 178–198. [Google Scholar] [CrossRef]
- Guangxi Nanning Municipal Bureau of Statistics. The Statistical Yearbook of Nanning City in 2018; Guangxi Nanning Municipal Bureau of Statistics: Nanning, China, 2018. (In Chinese) [Google Scholar]
- Alexander, J.W.; Gibson, L.J. Economic Geography; Prentice-Hall: Englewood Cliffs, NJ, USA, 1979. [Google Scholar]
- Mao, F. Analysis of factors influencing the physical exercise of elderly people in Nanning City. Think Tank Era 2019, 25, 138–142. (In Chinese) [Google Scholar]
- Niavis, S.; Vlontzos, G. Seeking for Convergence in the Agricultural Sector Performance under the Changes of Uruguay Round and 1992 CAP Reform. Sustainability 2019, 11, 4006. [Google Scholar] [CrossRef] [Green Version]
- Pielou, E. The measurement of diversity in different types of biological collections. J. Theor. Biol. 1966, 13, 131–144. [Google Scholar] [CrossRef]
- Fotheringham, A.S.; Charlton, M.; Brunsdon, C. Geographically Weighted Regression: A Natural Evolution of the Expansion Method for Spatial Data Analysis. Environ. Plan. A 1998, 30, 1905–1927. [Google Scholar] [CrossRef]
- The General Administration of Sport in China (GASC). Sports Facilities Construction Area Index at Urban Community Level; The General Administration of Sport in China: Beijing, China, 2005. (In Chinese) [Google Scholar]
- Nanning Bureau of Sports (NBS). Monitoring Report on Citizens’ Physical Activities and Health in Nanning city (2017); Nanning Bureau of Sports: Nanning, China, 2017. (In Chinese) [Google Scholar]
- Shi, X.C. Study on Physical Health Promotion of the Elderly in Nanning Urban Communities by Exercise Intervention; Guangxi University for Nationalities: Nanning, China, 2019. (In Chinese) [Google Scholar]
- Mo, Z.M. Research on Leisure Sports Behavior of Elders in Cities of Guangxi Zhuang Autonomous Region; Shanghai University of Sport: Shanghai, China, 2009. (In Chinese) [Google Scholar]
- Hu, Y.Y. Construction and Application of Evaluation Index System of Exercise and Fitness of Children and Youth in China; Shanghai University of Sport: Shanghai, China, 2017. (In Chinese) [Google Scholar]
- Thünen, J.H.V. Isolated Countries Have Relations with Agriculture and National Economy; The Commercial Press: Beijing, China, 1986. (In Chinese) [Google Scholar]
- The State Council of China. China’s National Fitness Program (2016–2020); The State Council of China: Beijing, China, 2016. (In Chinese) [Google Scholar]
- Wu, Q.Y.; Cheng, J.; Chen, G.; Hammel, D.J.; Wu, X. Socio-spatial differentiation and residential segregation in the Chinese city based on the 2000 community-level census data: A case study of the inner city of Nanjing. Cities 2014, 39, 109–119. [Google Scholar] [CrossRef]
- Cheng, J.; Turkstra, J.; Peng, M.; Du, N.; Ho, P. Urban land administration and planning in China: Opportunities and constraints of spatial data models. Land Use Policy 2006, 23, 604–616. [Google Scholar] [CrossRef]
Figure 1.
Evolution of studies on the equity of public service facilities.
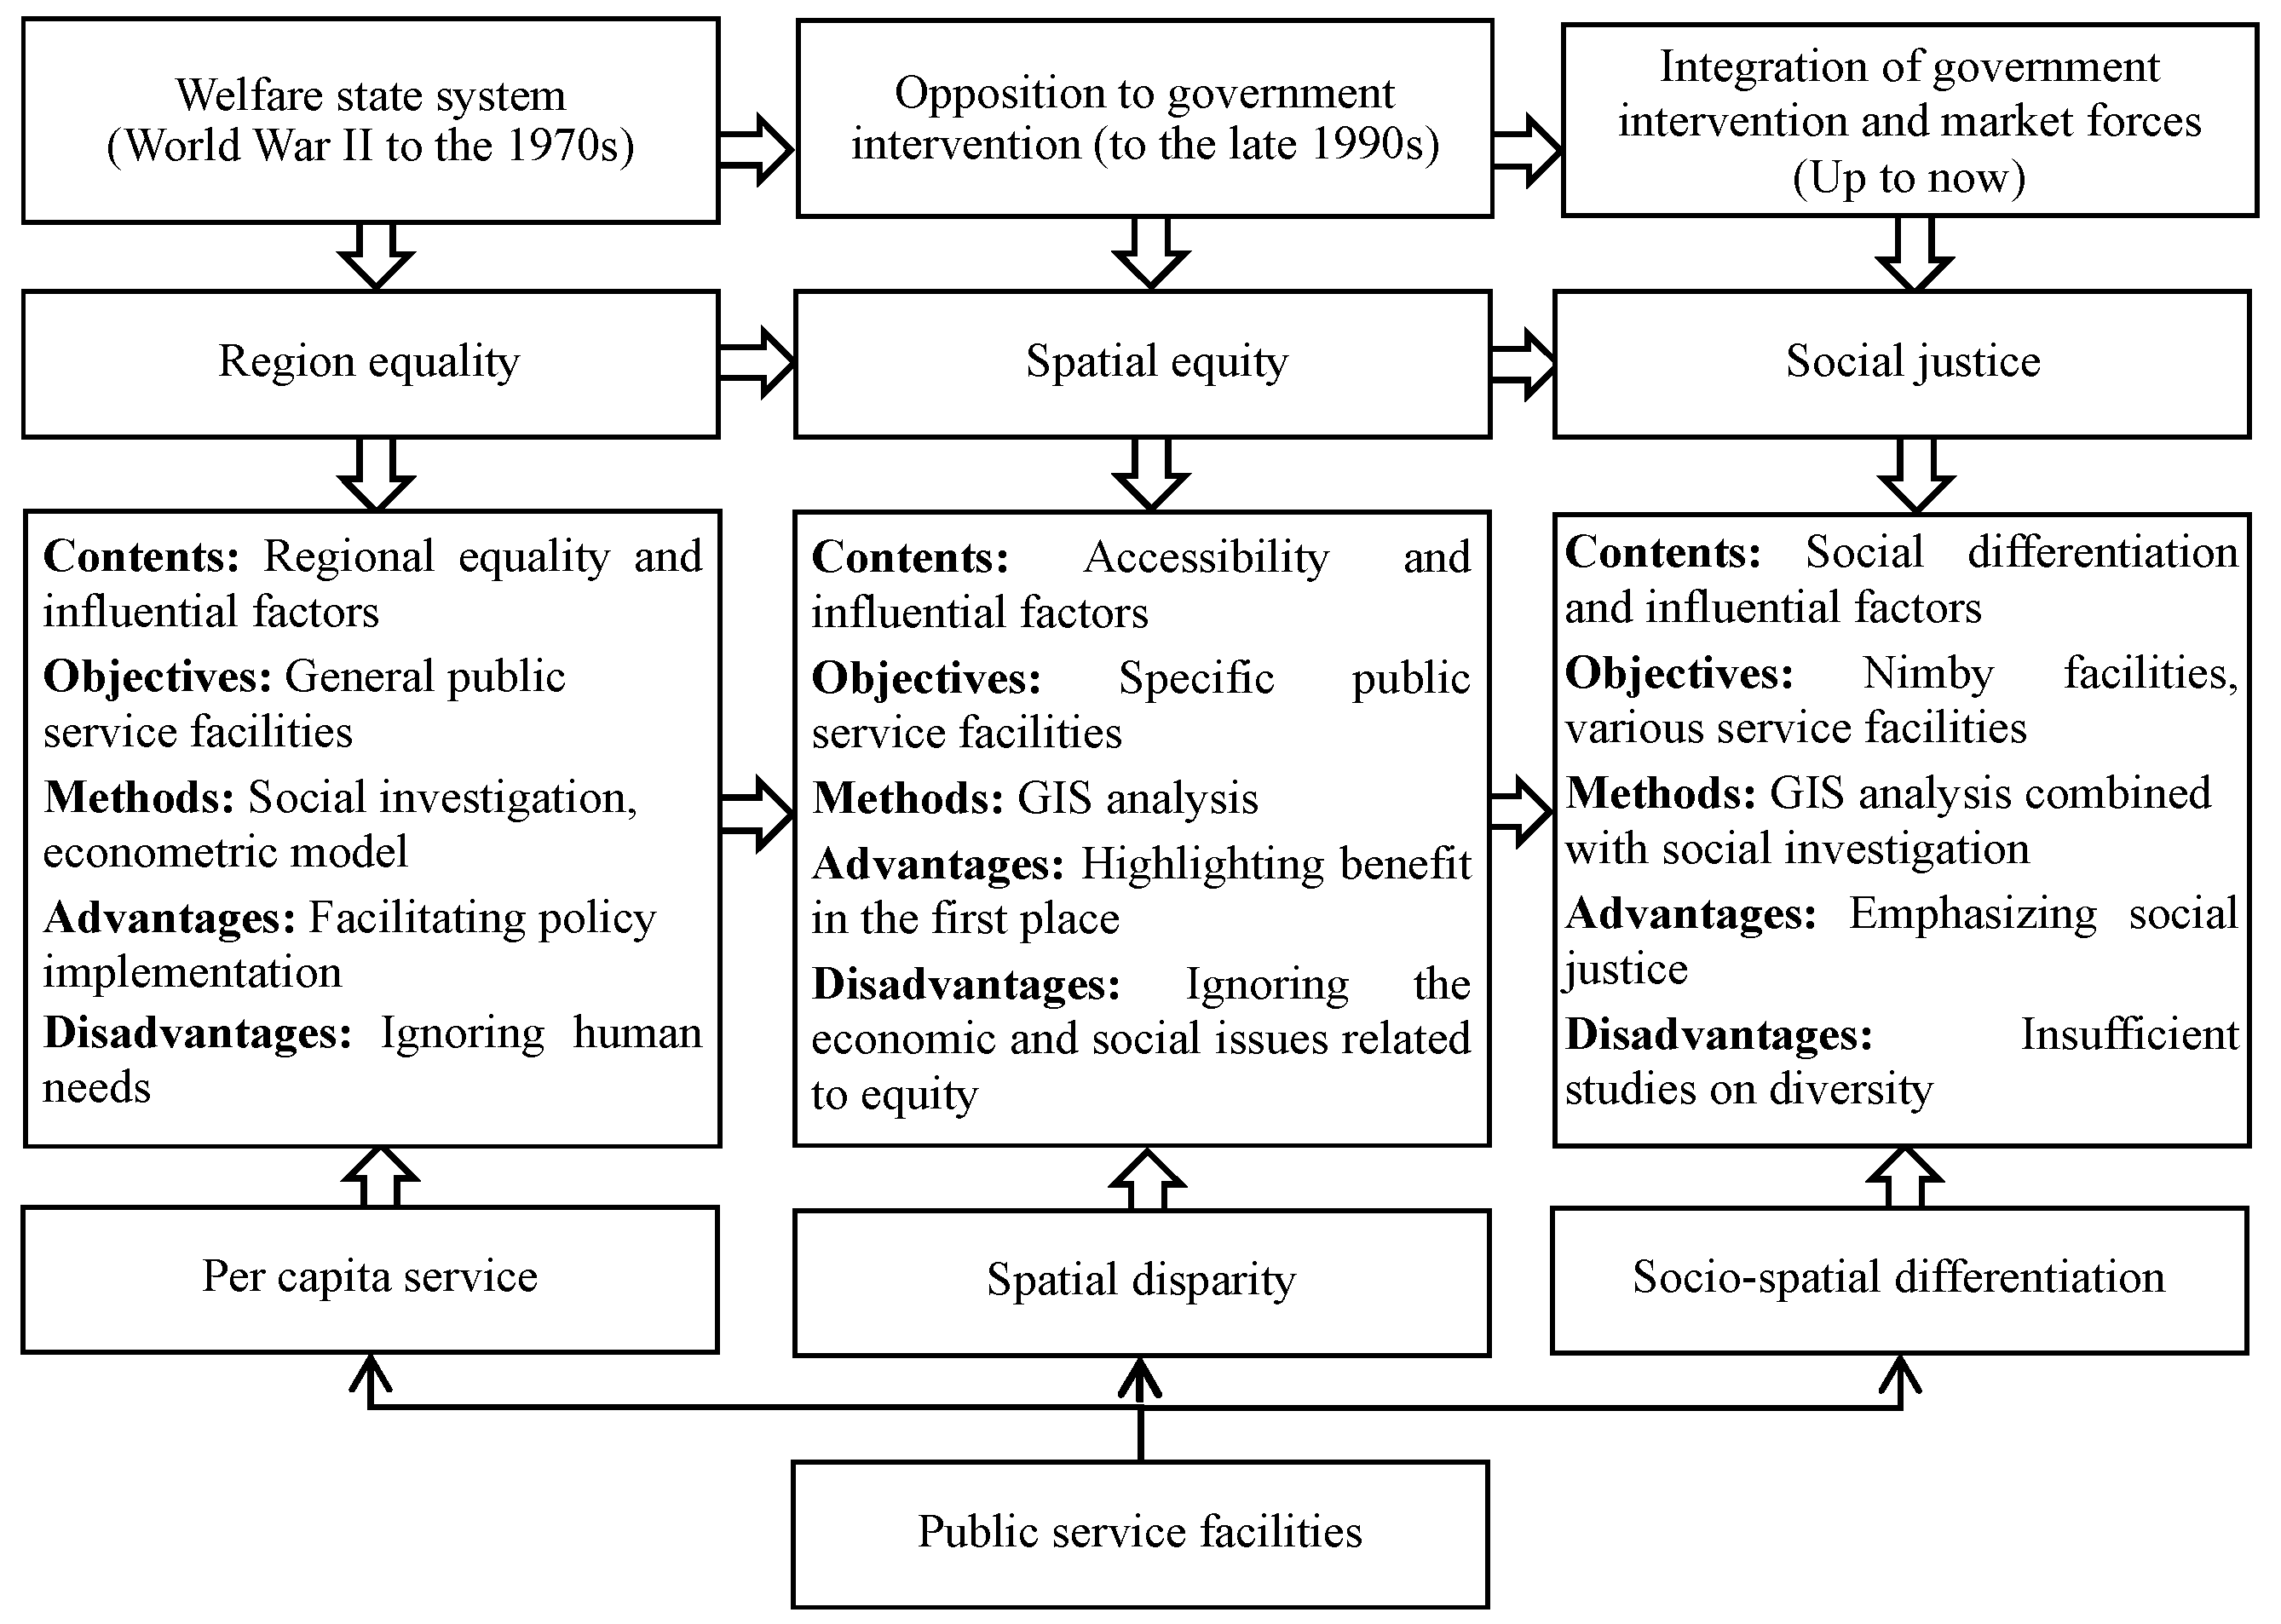
Figure 2.
Location of the Nanning City study area in Guangxi Province (left) and China (right).

Figure 3.
Distribution of sports facilities across the urban area of Nanning City.
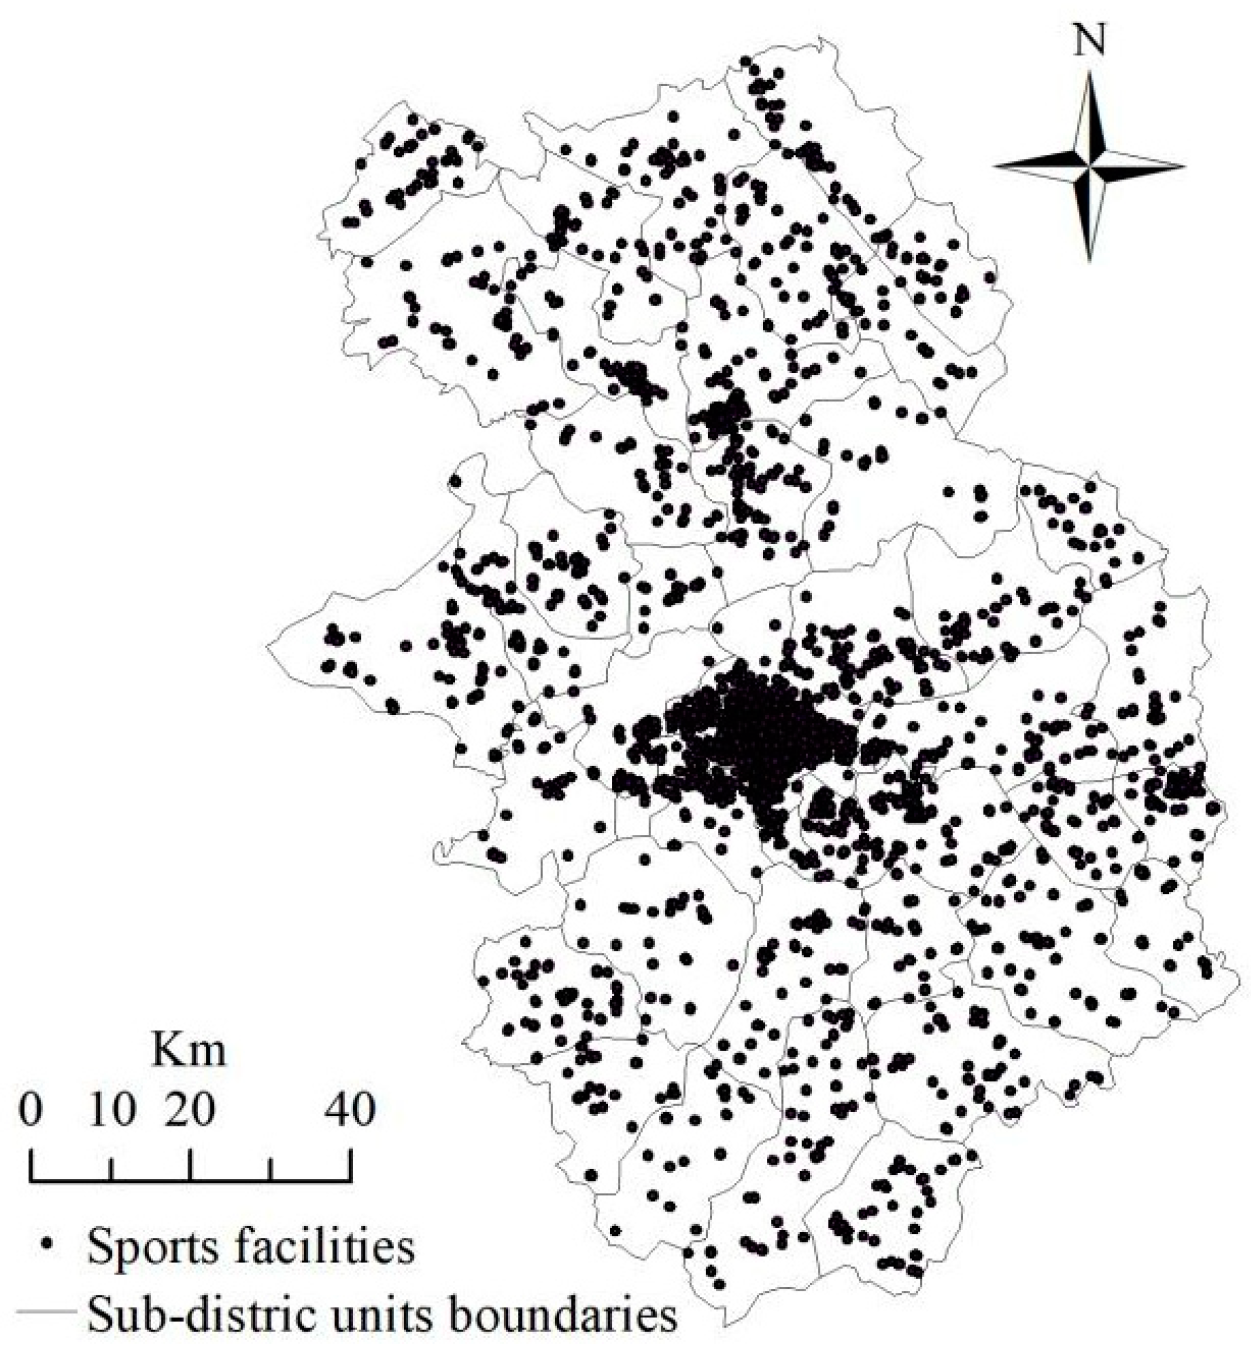
Figure 4.
Distribution of sports facilities in Nanning City as measured by the allocation index.
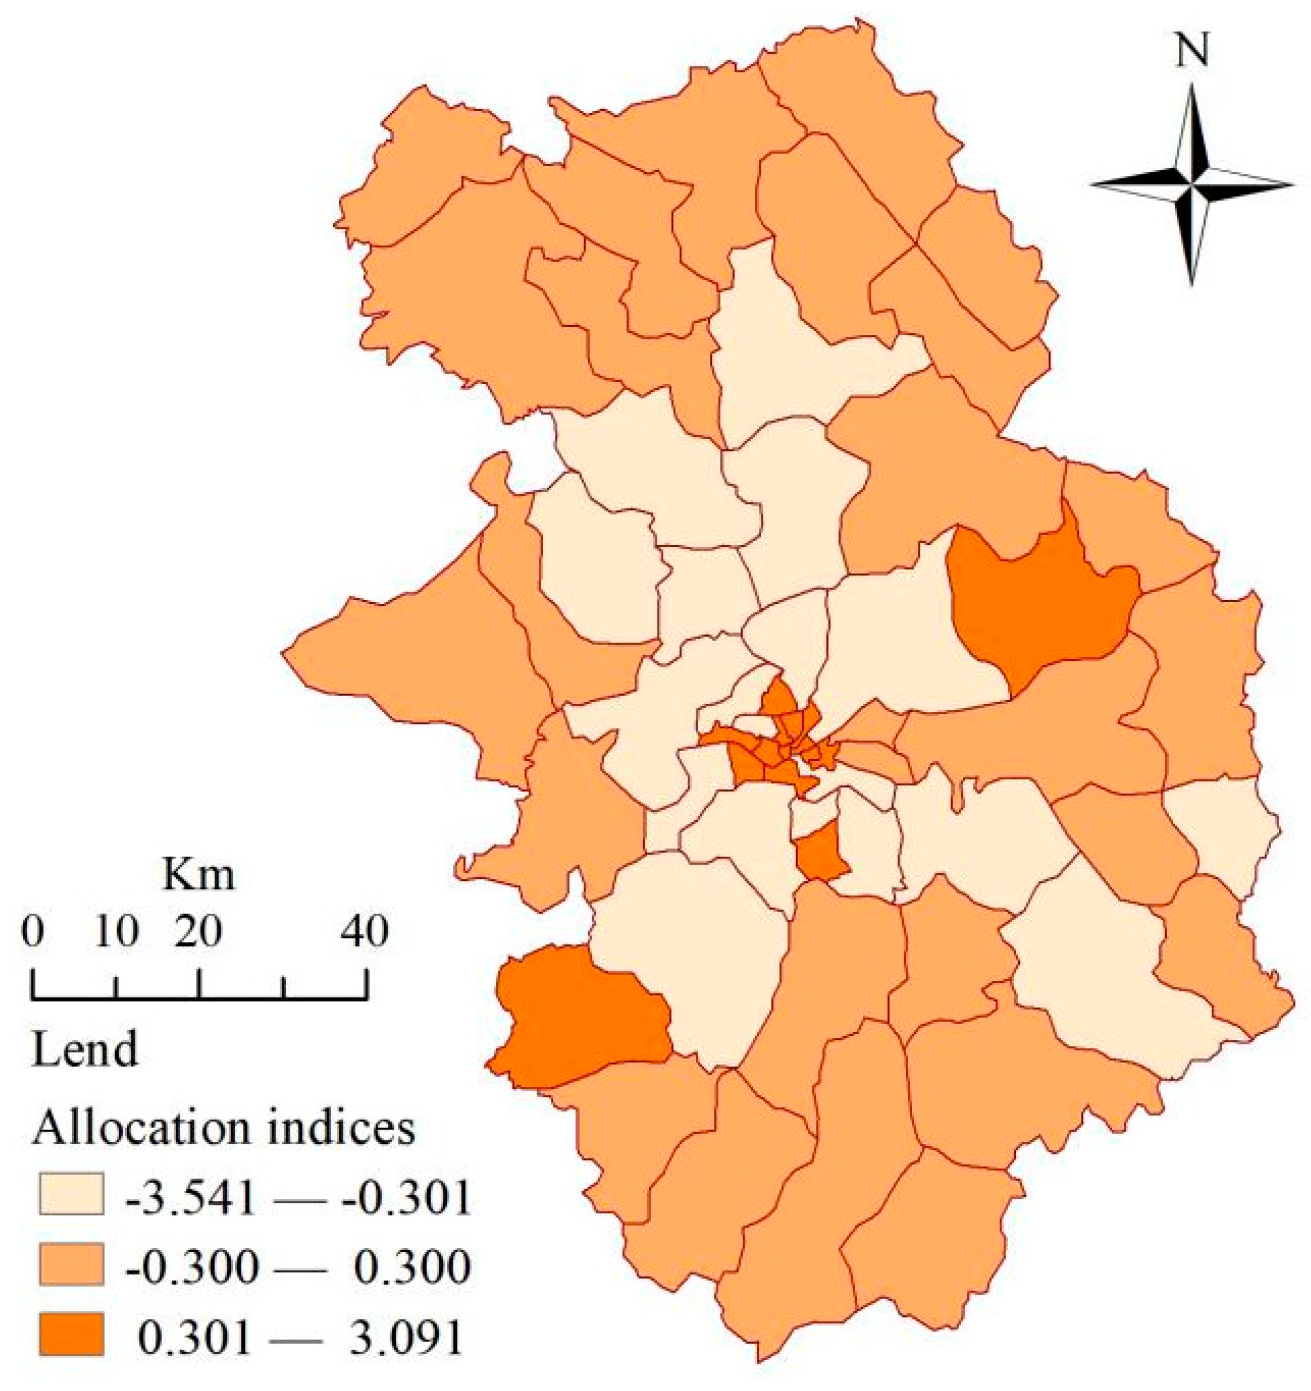
Figure 5.
Spatial accessibility to sports facilities in Nanning City: (a) Accessibility, (b) 10 min. and (c) 20 min..
Figure 5.
Spatial accessibility to sports facilities in Nanning City: (a) Accessibility, (b) 10 min. and (c) 20 min..
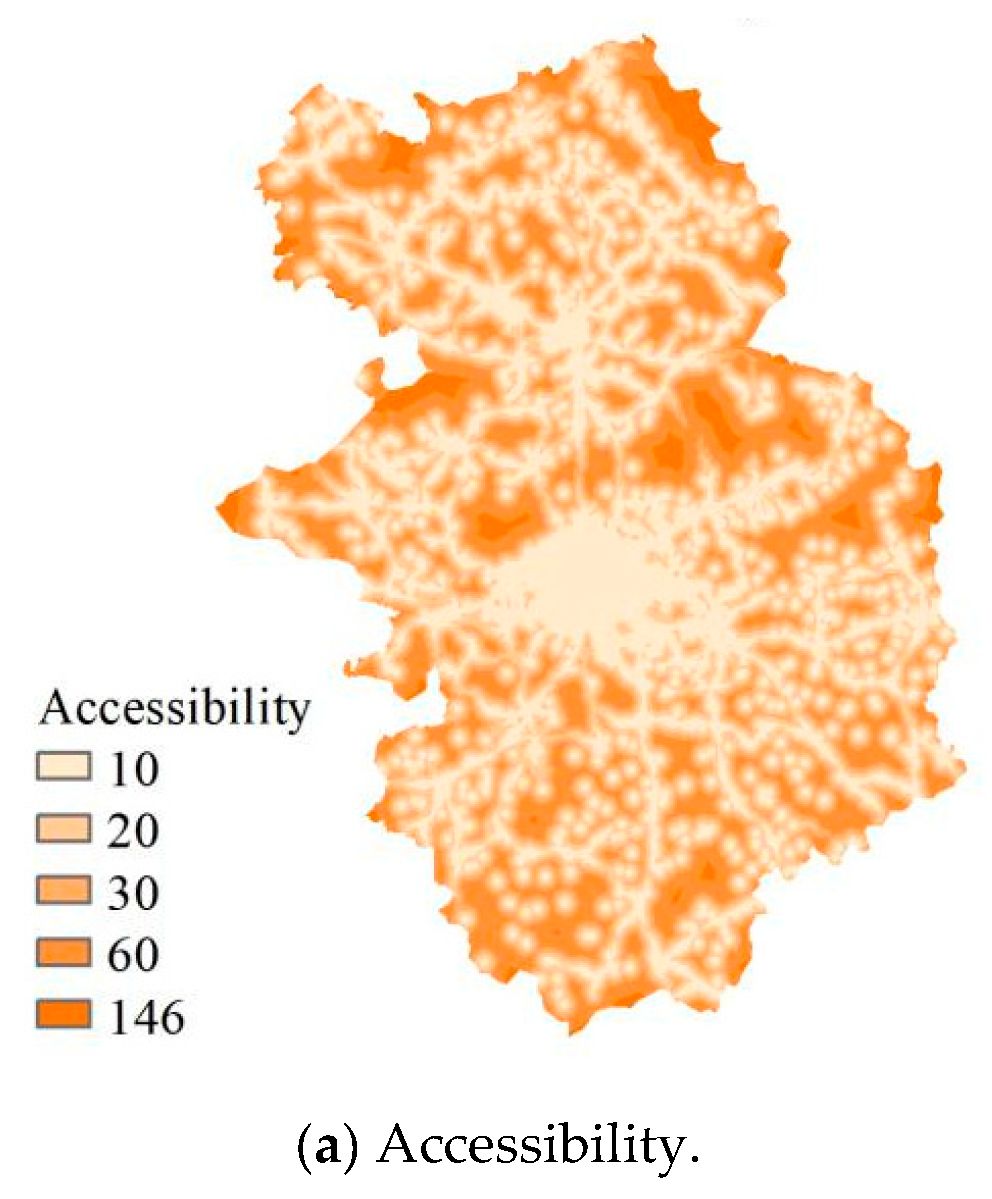
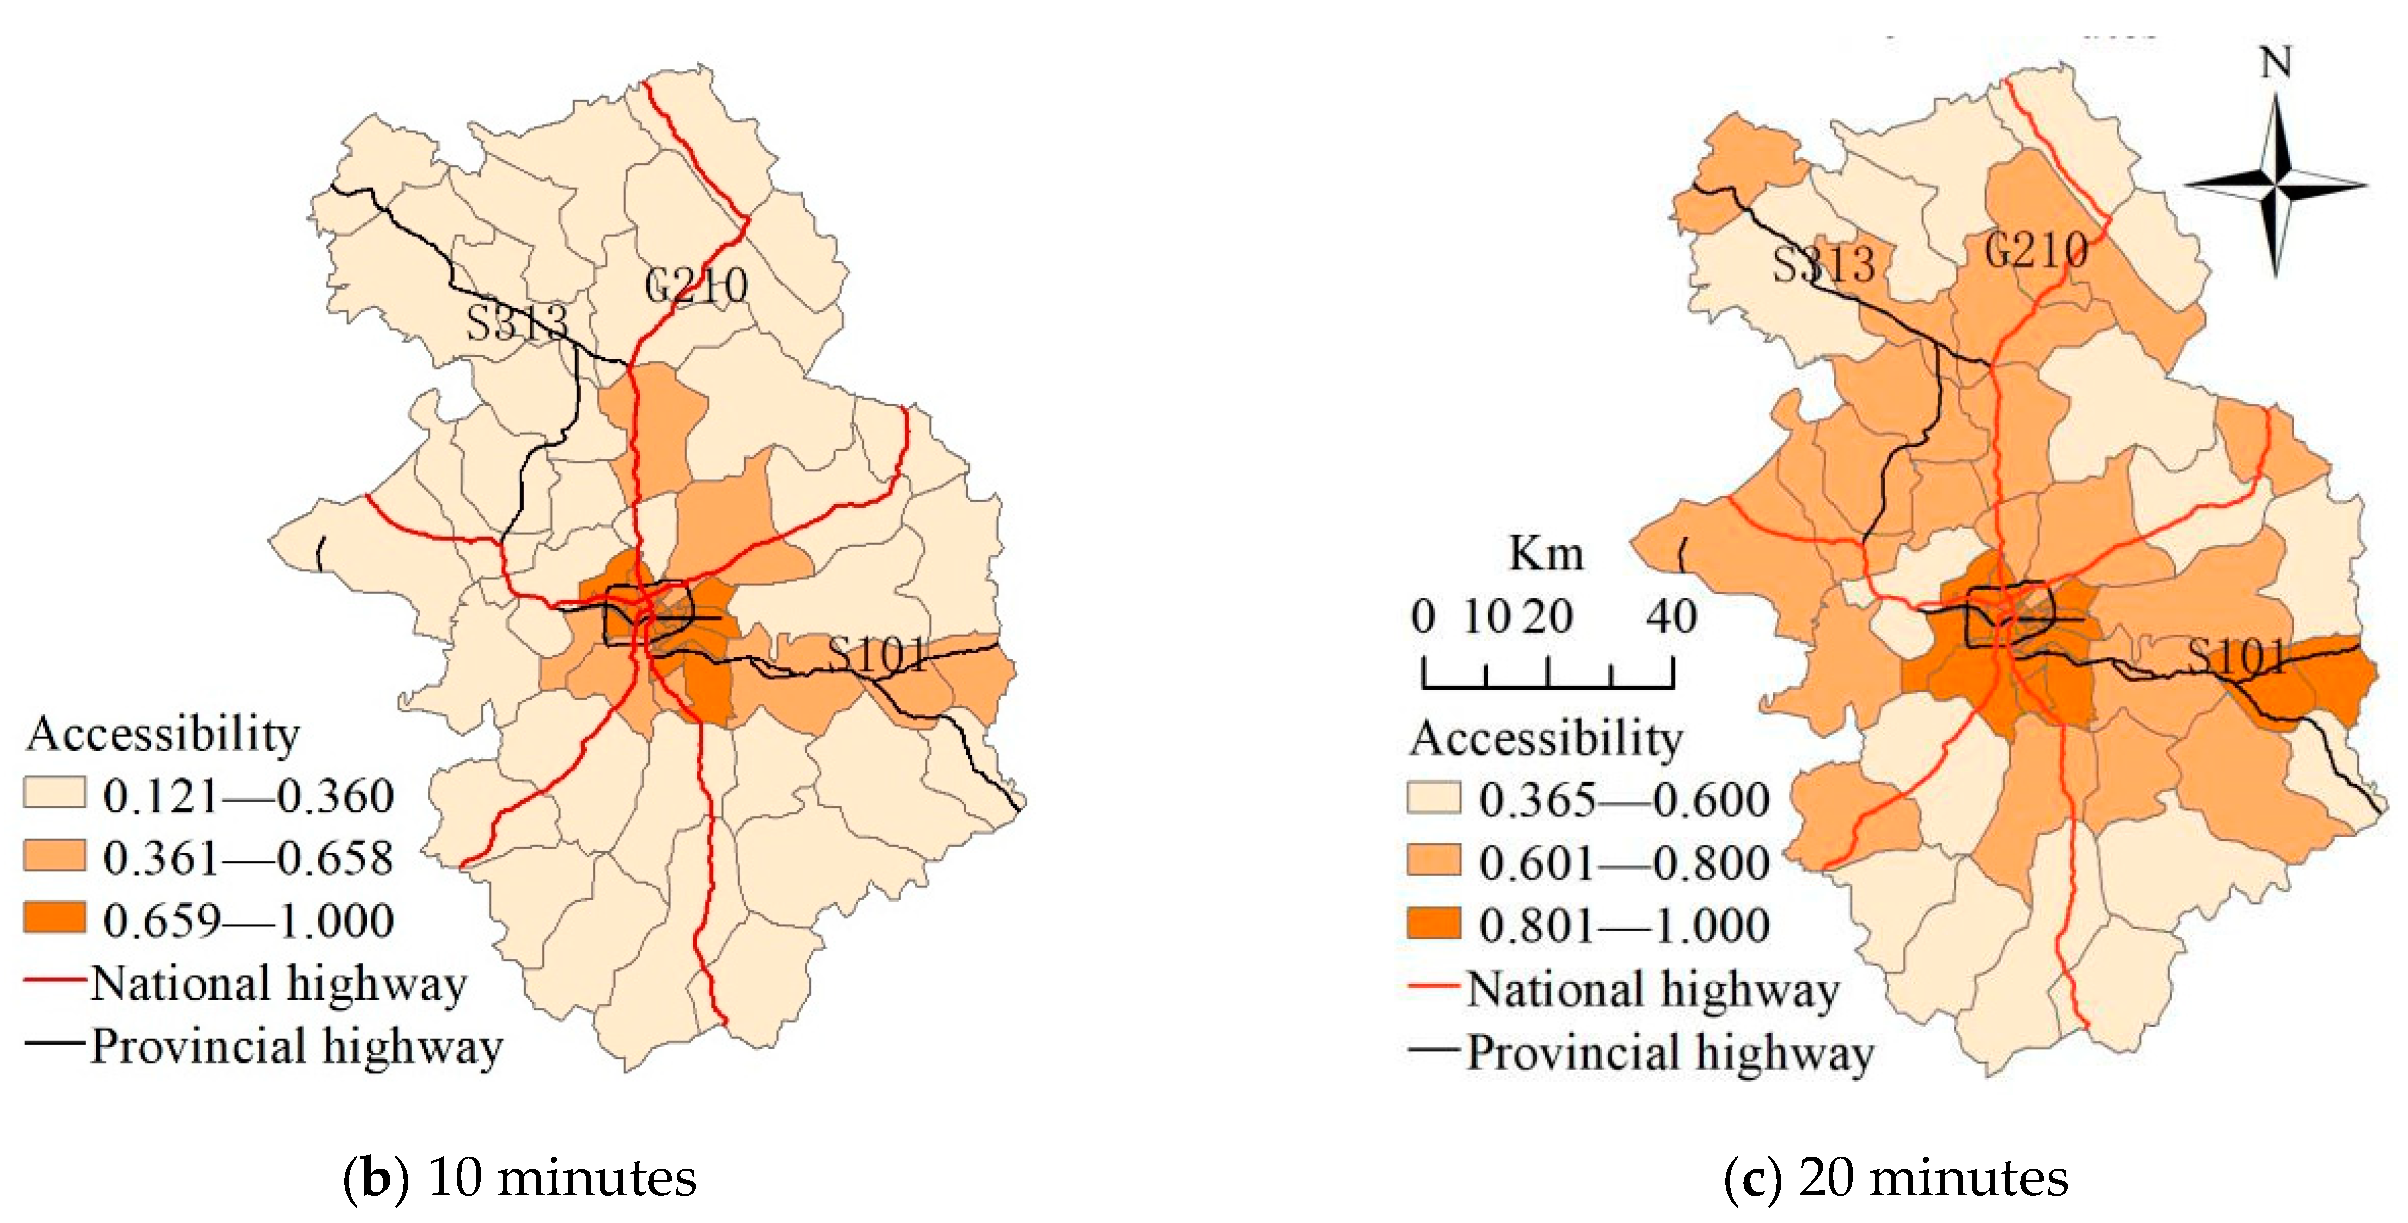
Figure 6.
Spatial discreteness of sports facilities distribution in Nanning City.
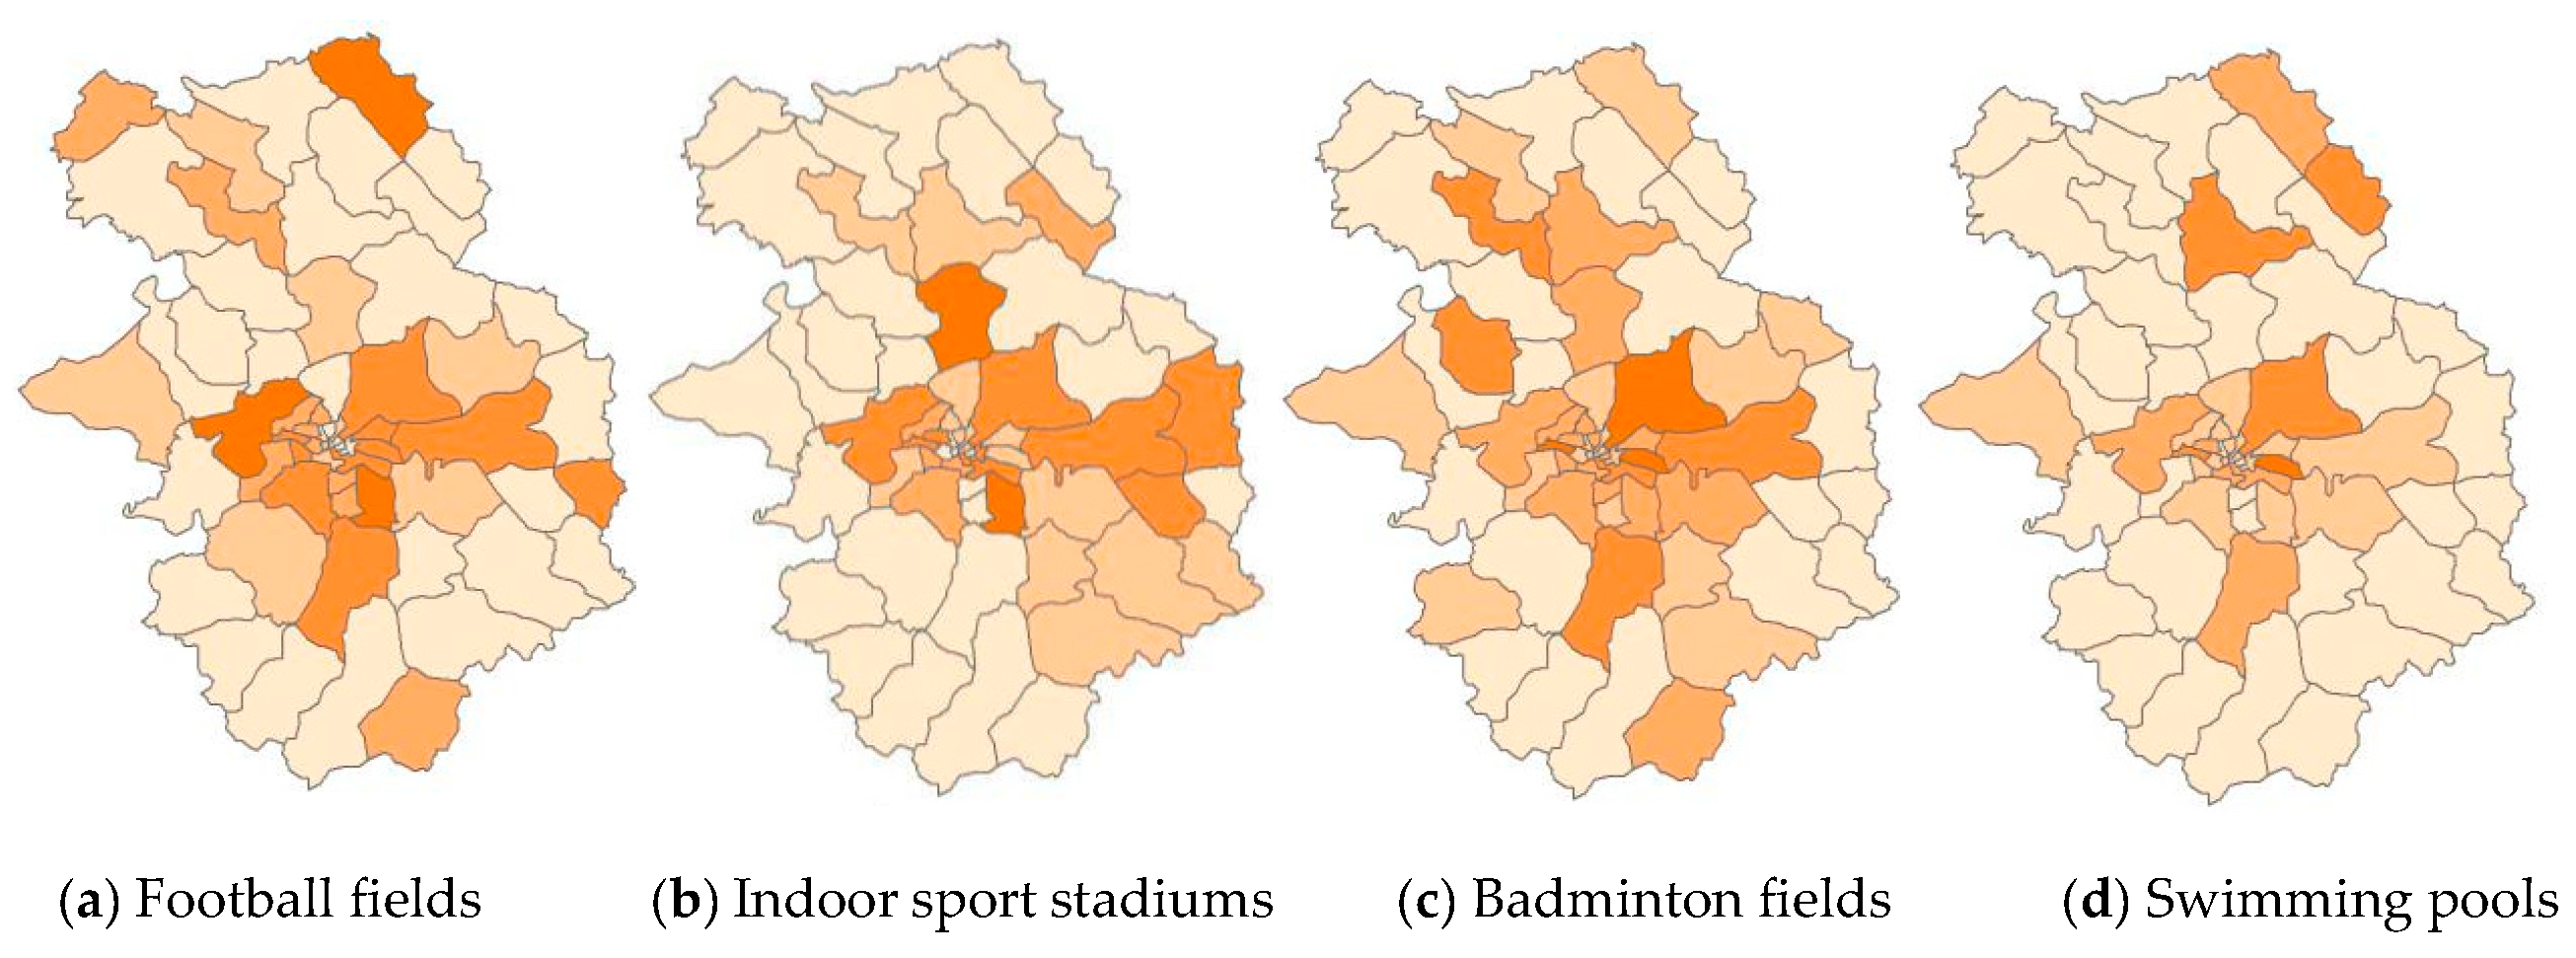

Figure 7.
Spatial evenness of sports facilities reflecting the diversity of sports facilities.
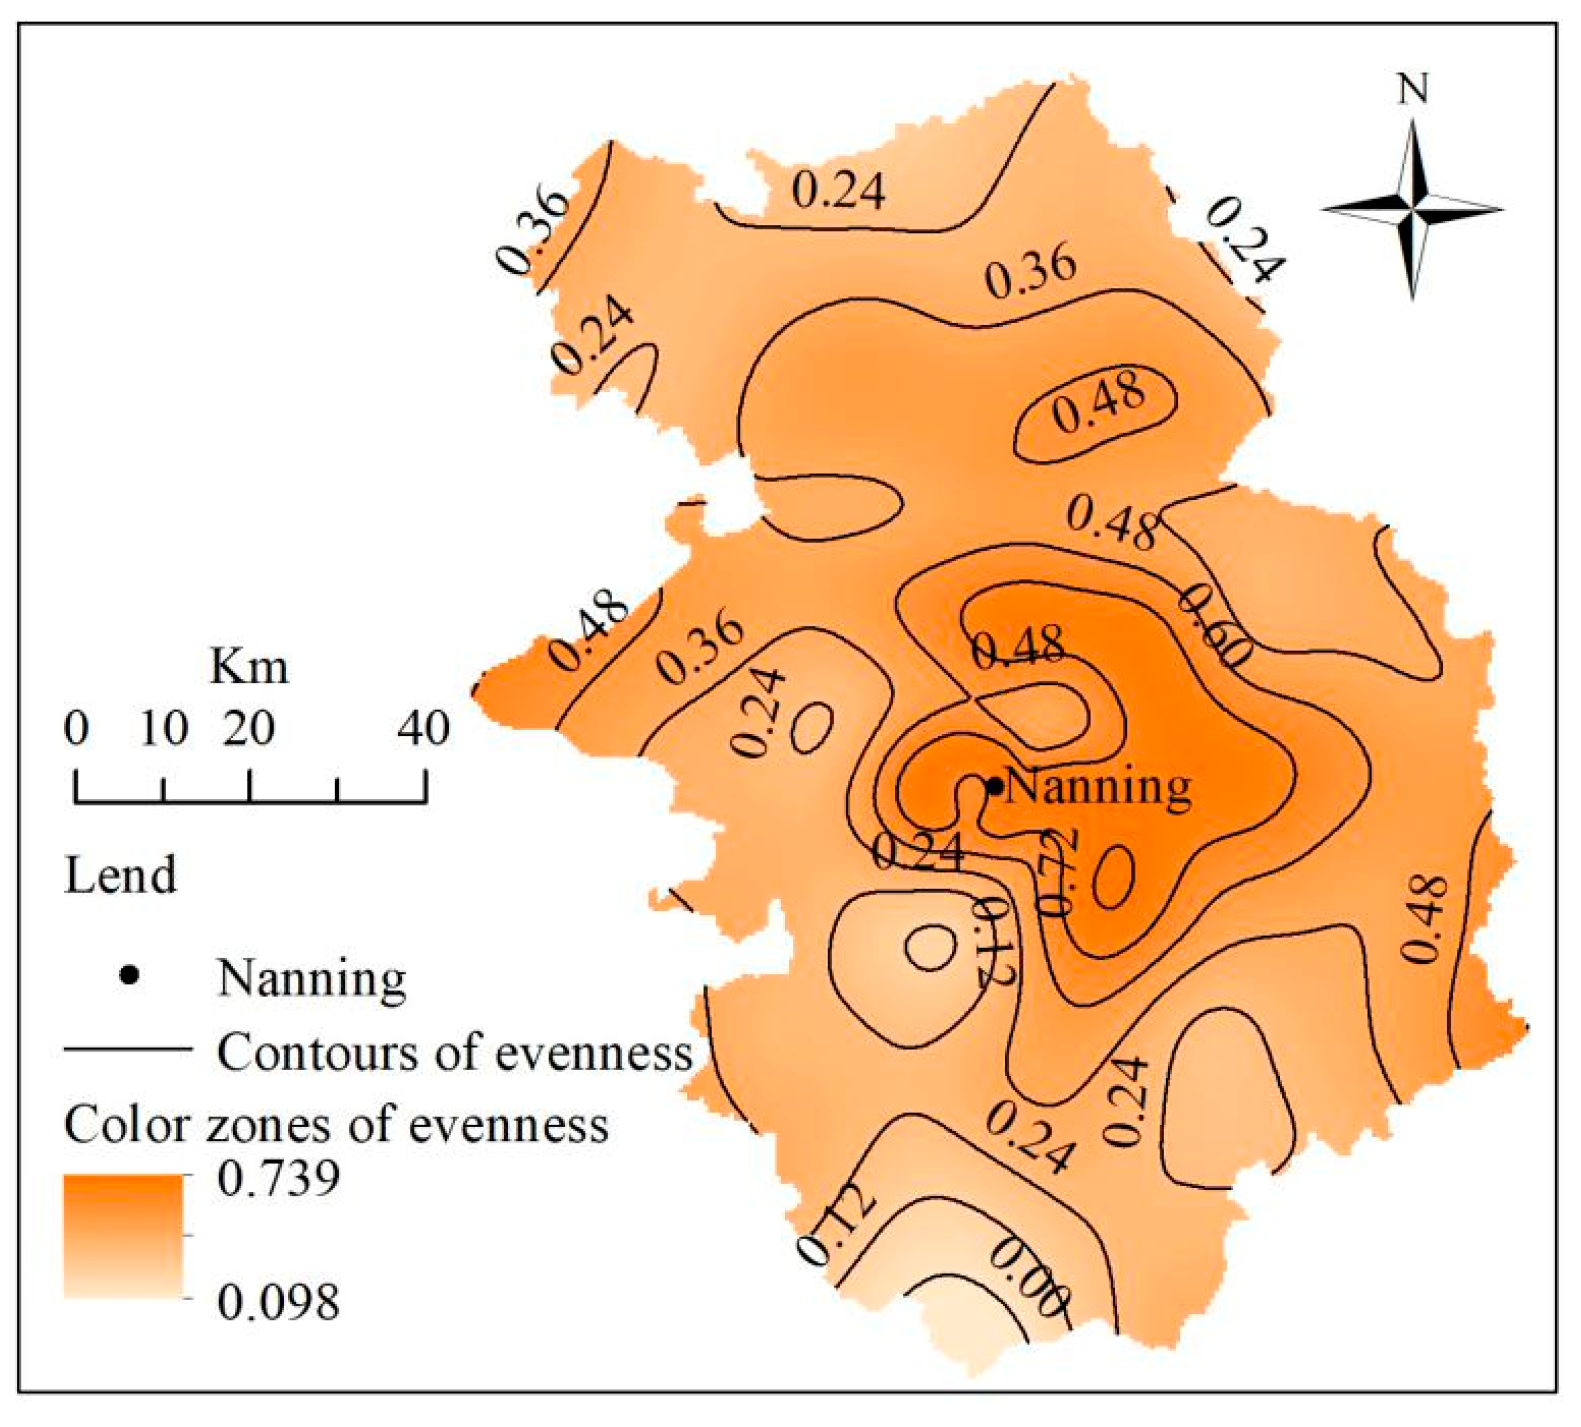
Figure 8.
Example of an outdoor gym (left) and gateball court (right).
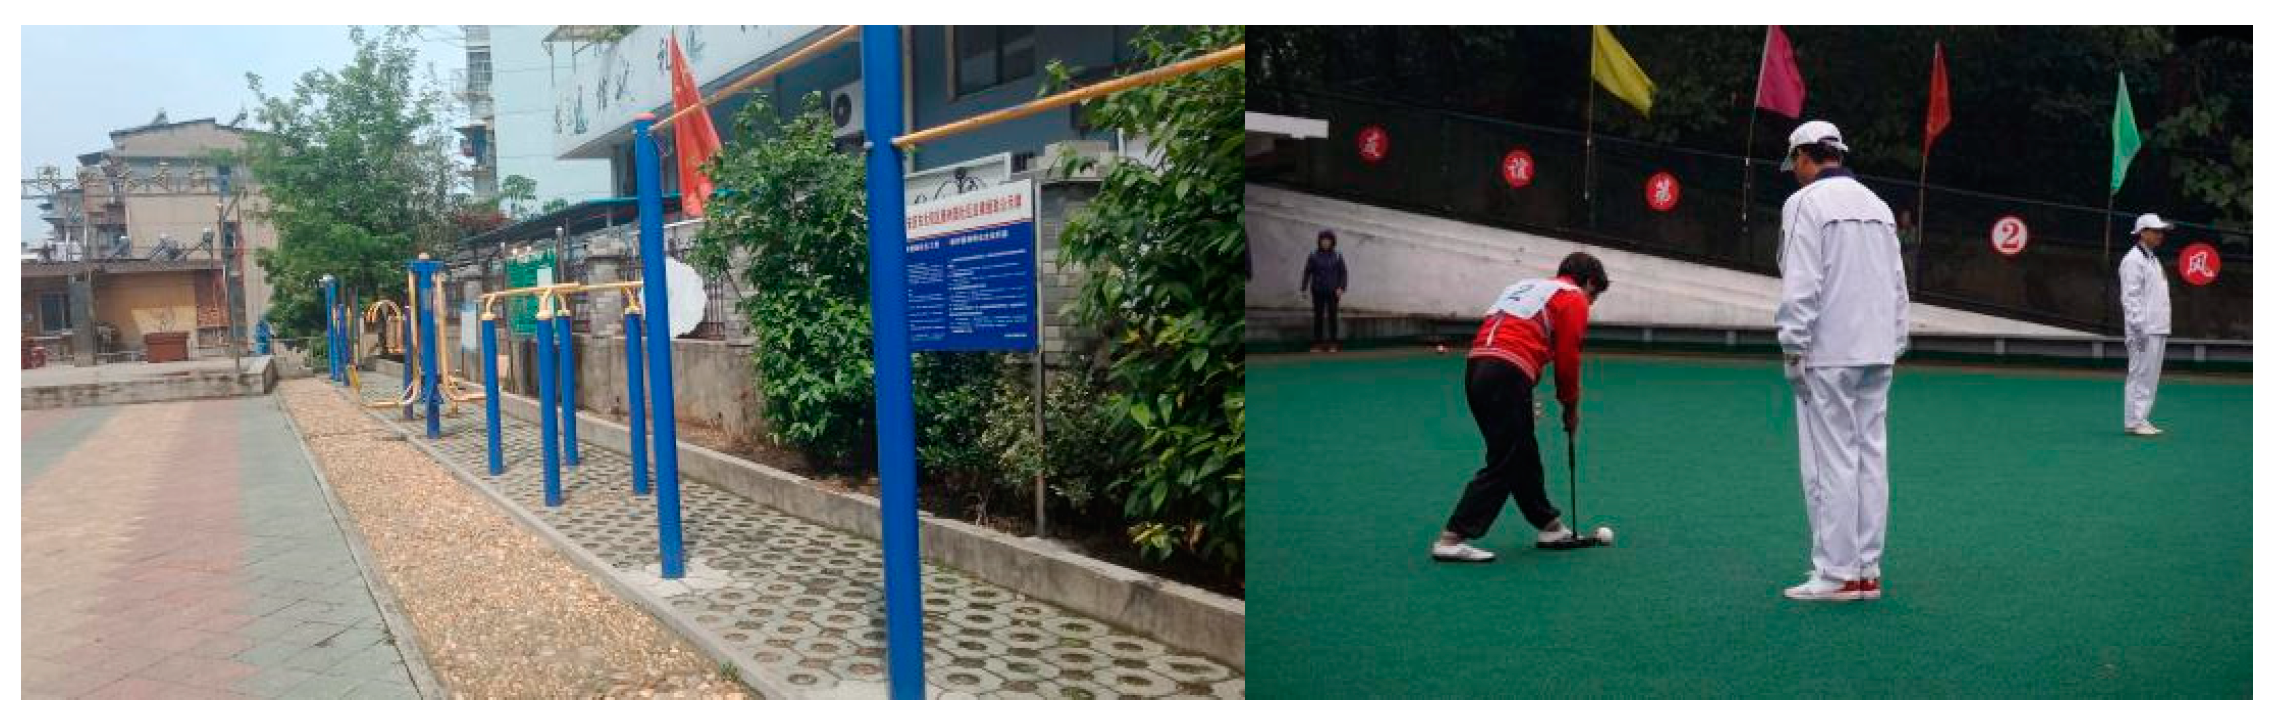
Figure 9.
The spatial distribution of evenness of age group-specific sports facilities in Nanning City.
Figure 9.
The spatial distribution of evenness of age group-specific sports facilities in Nanning City.
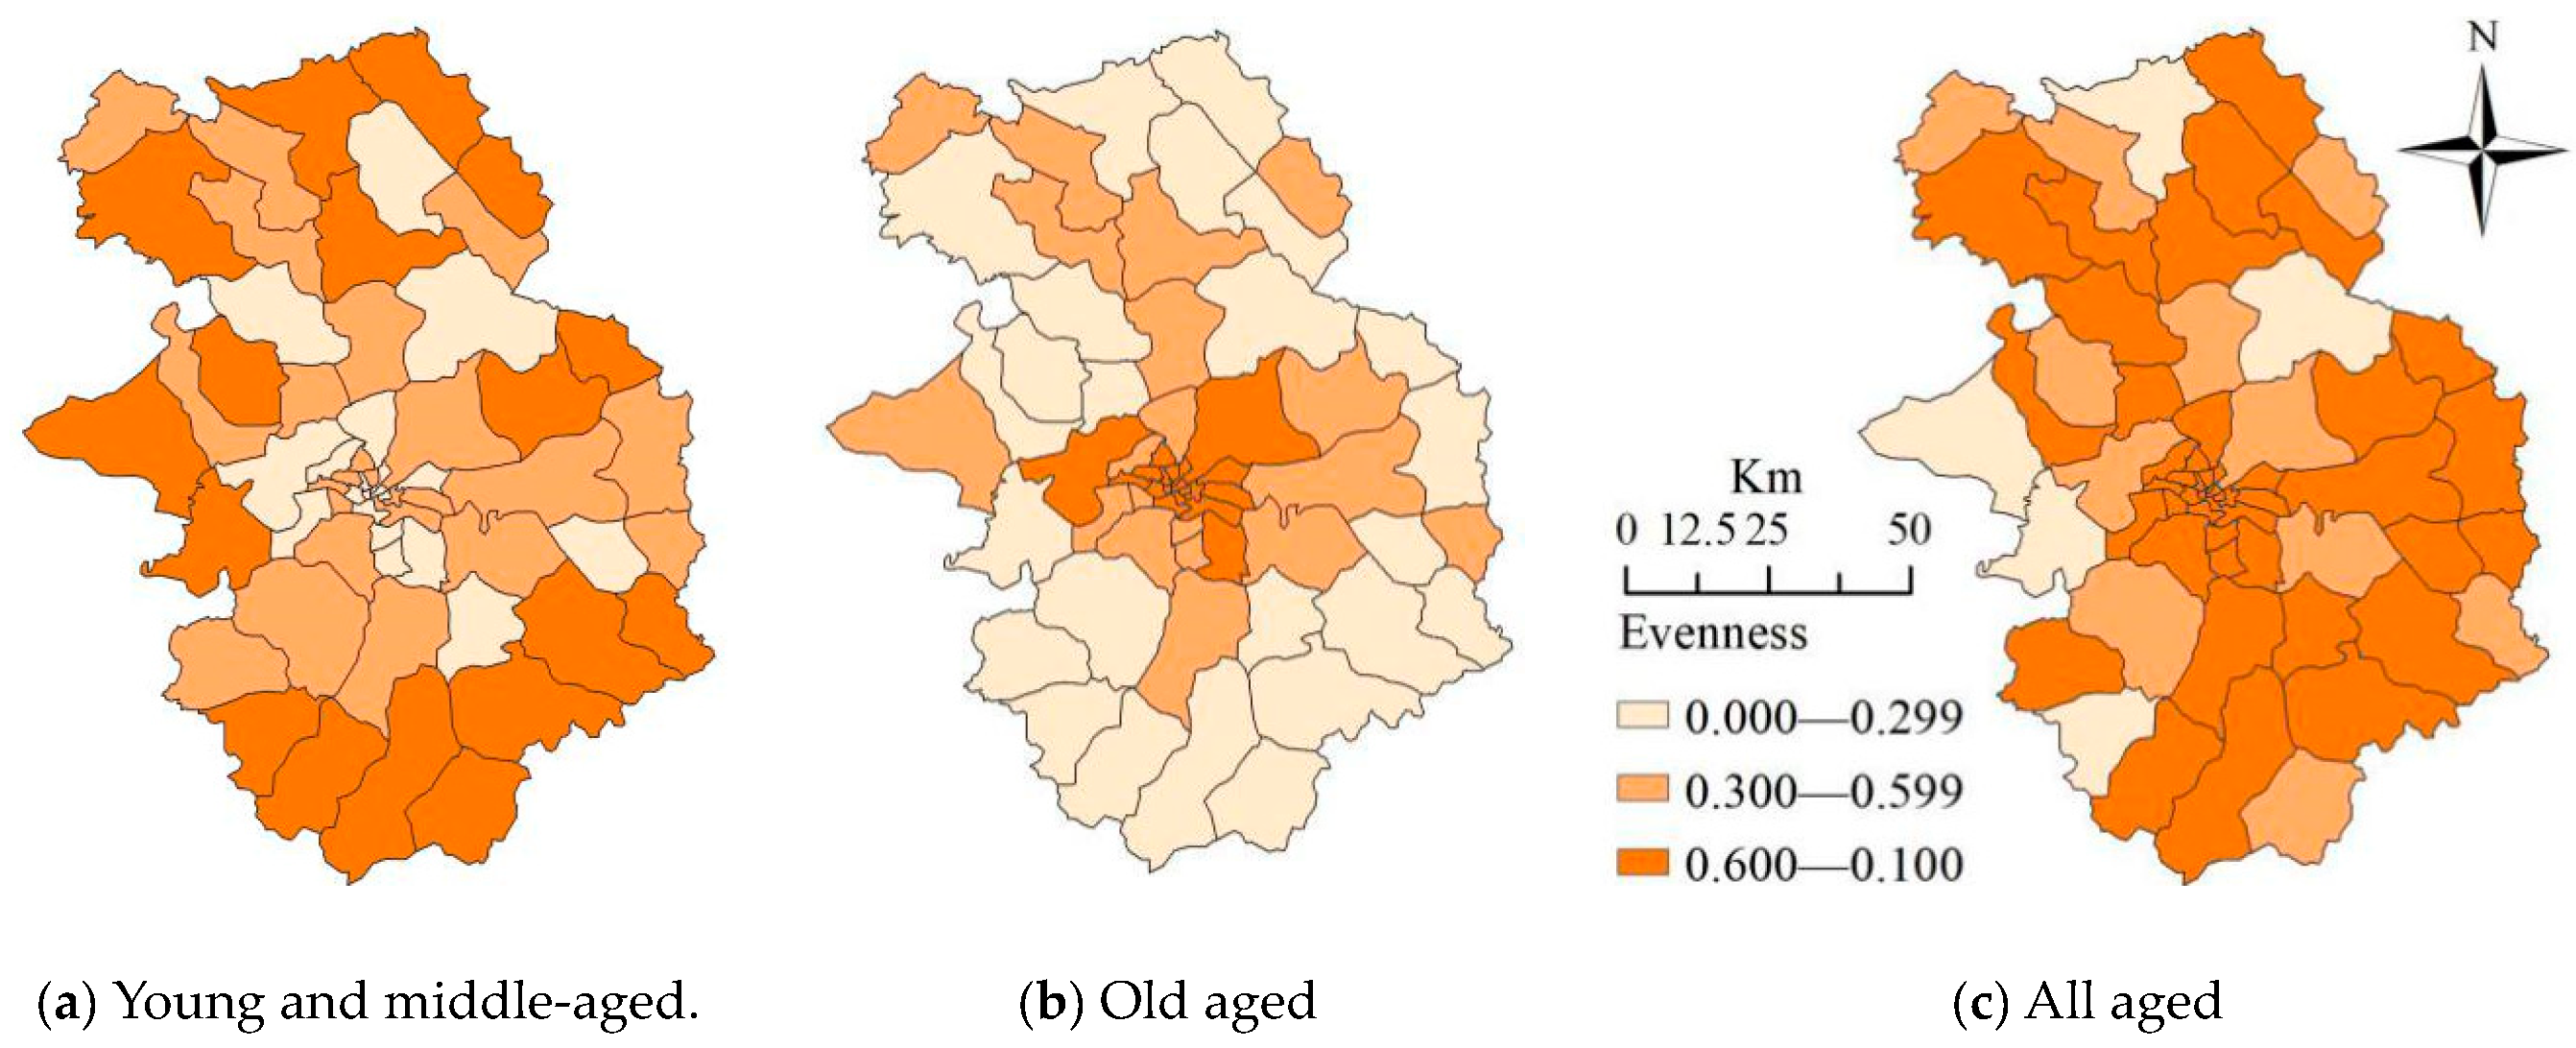
Figure 10.
Spatial distribution of the parameter estimations and t-values for each explanatory variable in the GWR model of accessibility.
Figure 10.
Spatial distribution of the parameter estimations and t-values for each explanatory variable in the GWR model of accessibility.
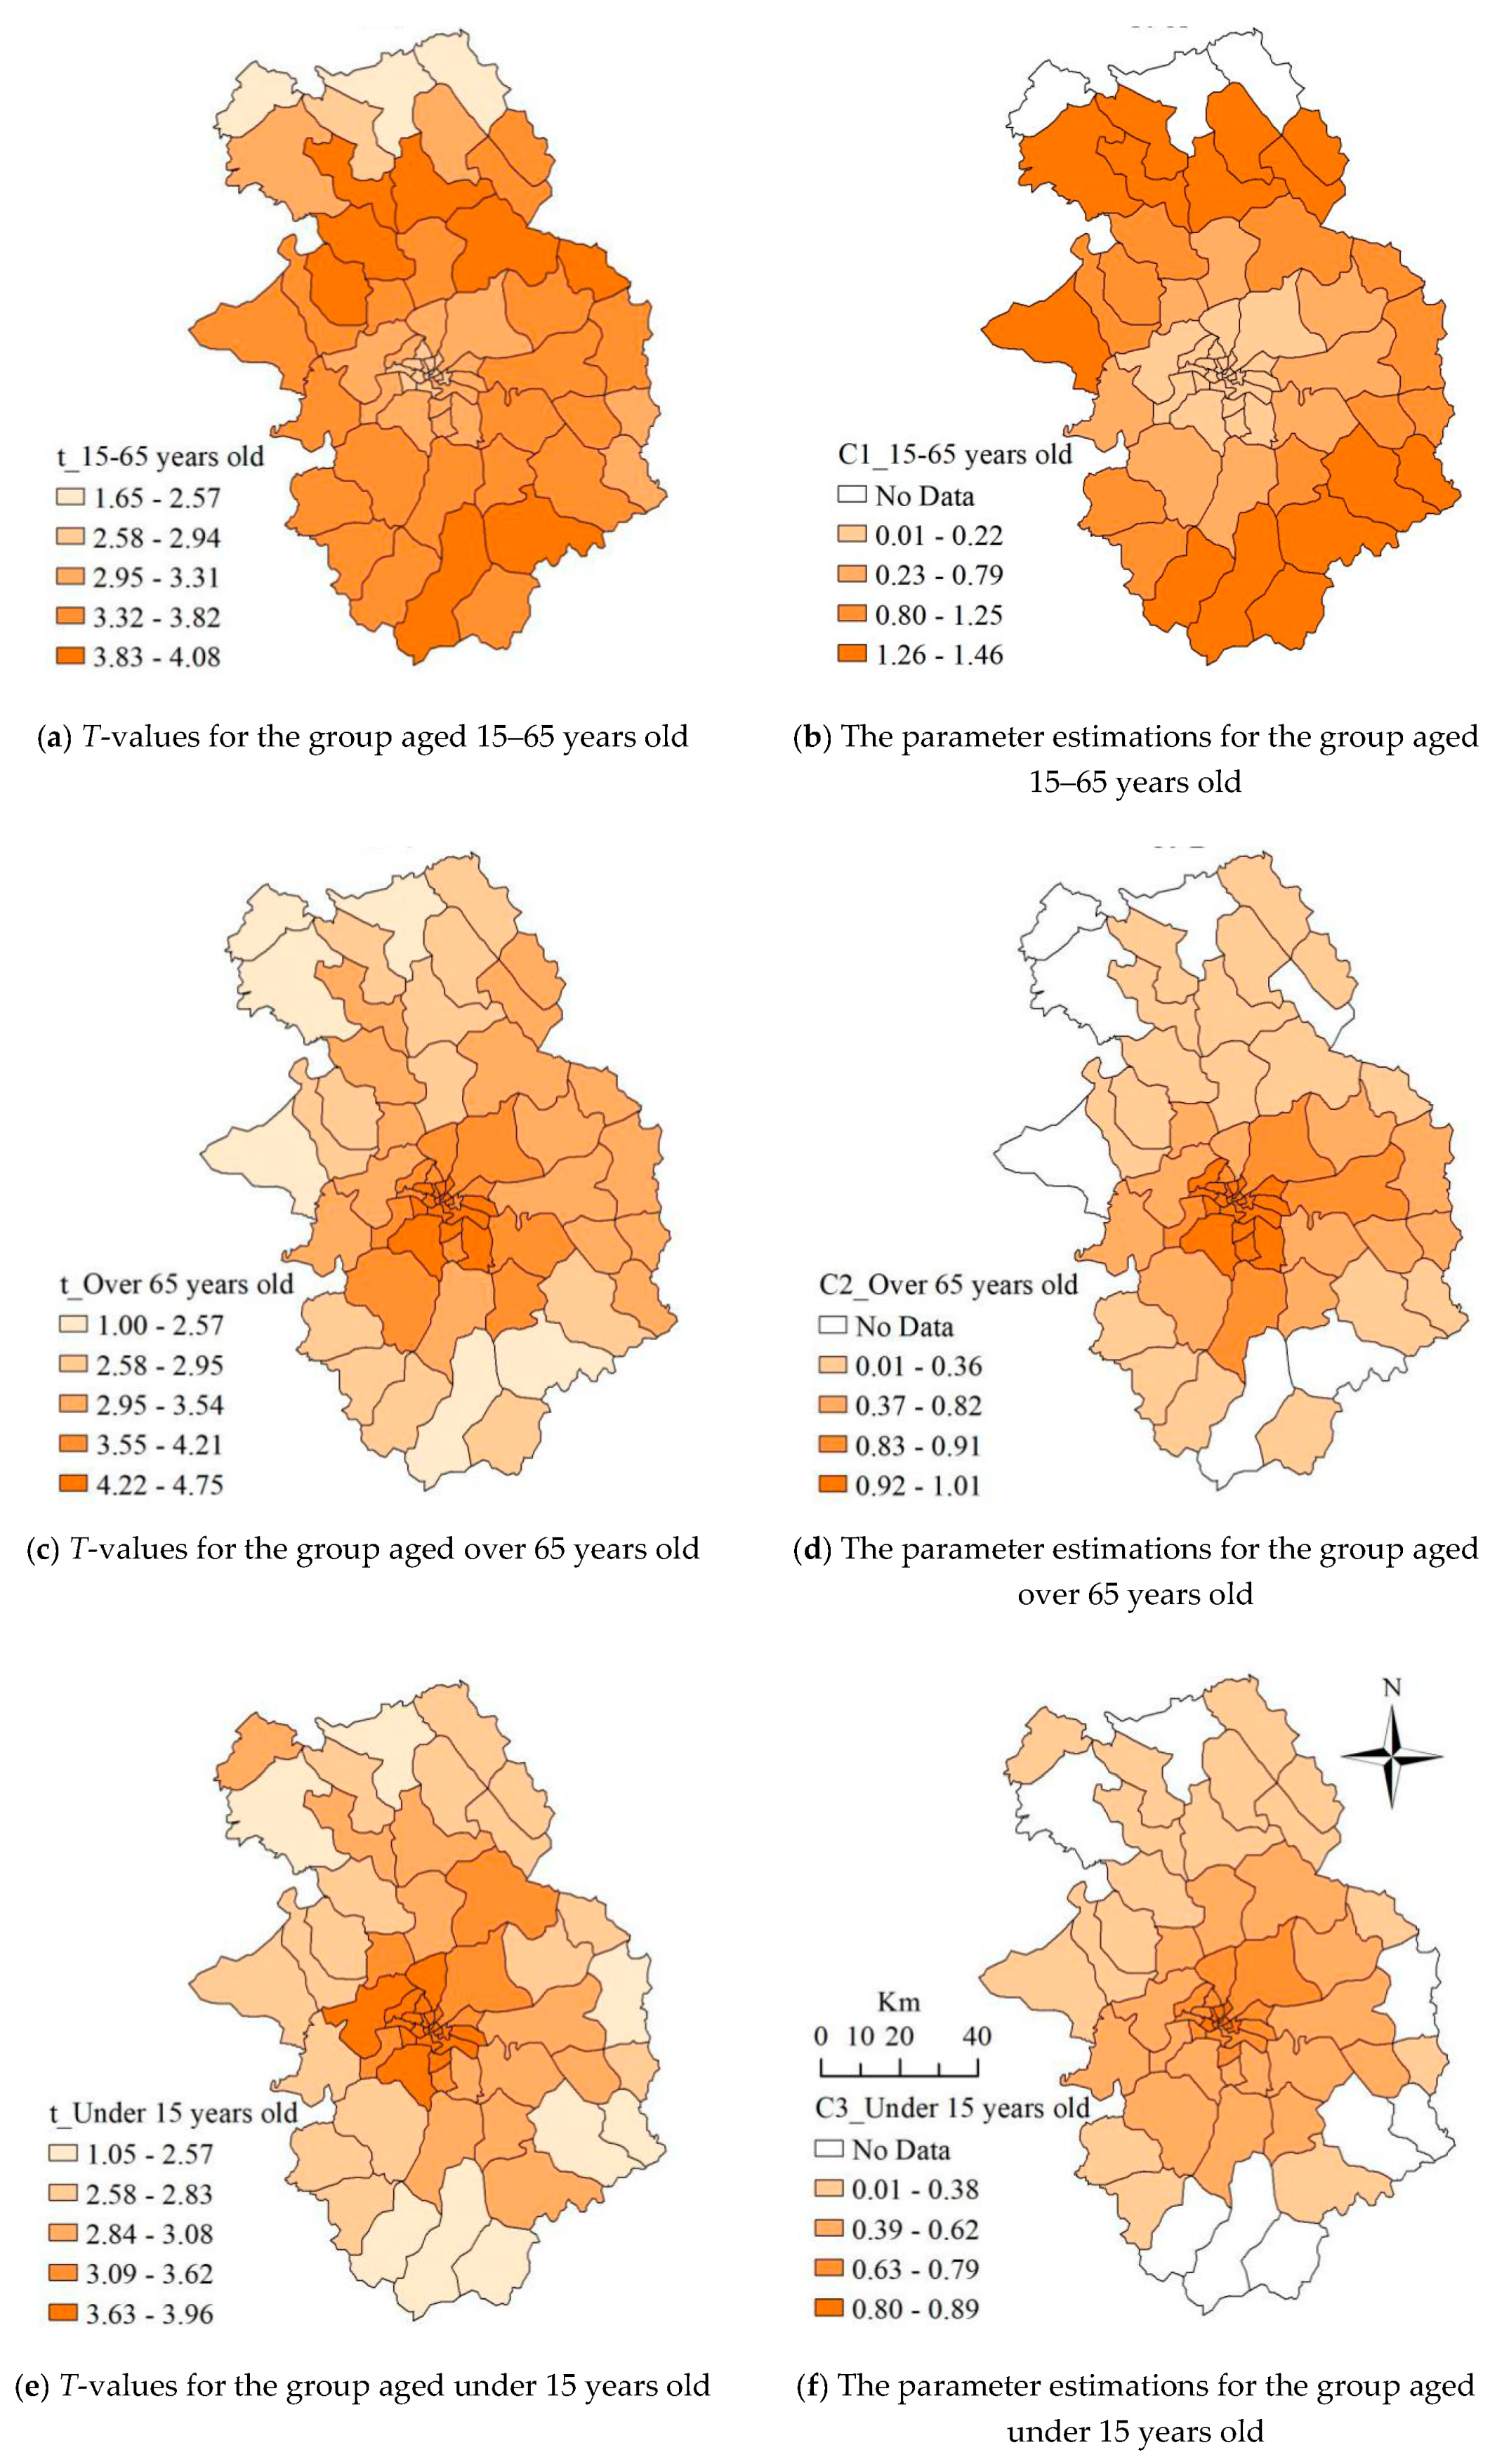
Figure 11.
The spatial distribution of the parameter estimations and t values for each explanatory variable from the GWR model of investment intensity.
Figure 11.
The spatial distribution of the parameter estimations and t values for each explanatory variable from the GWR model of investment intensity.

Table 1.
Variation Coefficient of sports facilities in Nanning City.
| Types | Basketball Courts | Table Tennis Courts | Athletic Tracks | Badminton Facilities | Football Fields | Air Volleyball Fields | Volleyball Courts | Outdoor Gyms | Gateball Courts | Tennis Courts | Indoor Sport Stadiums | Fitness Centers | Swimming Pools |
|---|---|---|---|---|---|---|---|---|---|---|---|---|---|
| Variation Coefficient | 0.081 | 0.115 | 0.141 | 0.144 | 0.189 | 0.210 | 0.210 | 0.219 | 0.308 | 0.312 | 0.371 | 0.377 | 0.484 |
Table 2.
Statistics from the accessibility and investment intensity Ordinary Least Squares (OLS) models.
Table 2.
Statistics from the accessibility and investment intensity Ordinary Least Squares (OLS) models.
| Explanatory Variables | Accessibility—PE Value | Accessibility—t Statistic | Investment Intensity—PE Value | Investment Intensity—t Statistic |
|---|---|---|---|---|
| <15 age group | 0.000882 | 2.963 | ||
| 15–65 age group | 0.000034 | 5.784 | ||
| >65 age group | 0.000011 | 3.016 | ||
| Population density | 0.000000 | 4.887 | ||
| Road network density | 0.000203 | 2.956 |
Table 3.
Comparison between the OLS and Geographically Weighted Regression (GWR) models.
| Dependent Variables | Models | AICc | Adj R2 |
|---|---|---|---|
| Accessibility | OLS | −129.636 | 0.746 |
| GWR | −536.171 | 0.795 | |
| Investment intensity | OLS | −67.256 | 0.763 |
| GWR | −130.527 | 0.853 |
© 2020 by the authors. Licensee MDPI, Basel, Switzerland. This article is an open access article distributed under the terms and conditions of the Creative Commons Attribution (CC BY) license (http://creativecommons.org/licenses/by/4.0/).
Share and Cite
MDPI and ACS Style
Shen, J.; Cheng, J.; Huang, W.; Zeng, F. An Exploration of Spatial and Social Inequalities of Urban Sports Facilities in Nanning City, China. Sustainability 2020, 12, 4353. https://doi.org/10.3390/su12114353
AMA Style
Shen J, Cheng J, Huang W, Zeng F. An Exploration of Spatial and Social Inequalities of Urban Sports Facilities in Nanning City, China. Sustainability. 2020; 12(11):4353. https://doi.org/10.3390/su12114353
Chicago/Turabian StyleShen, Jinghong, Jianquan Cheng, Wencong Huang, and Fantao Zeng. 2020. "An Exploration of Spatial and Social Inequalities of Urban Sports Facilities in Nanning City, China" Sustainability 12, no. 11: 4353. https://doi.org/10.3390/su12114353
Note that from the first issue of 2016, this journal uses article numbers instead of page numbers. See further details here.