The Forecasting Sales Volume and Satisfaction of Organic Products through Text Mining on Web Customer Reviews


Department of Business Administration, Global Business School, Soonchunhyang University, 22 Soonchunhyang-ro, Asan 31538, Korea
*
Author to whom correspondence should be addressed.
Sustainability 2020, 12(11), 4383; https://doi.org/10.3390/su12114383
Submission received: 29 April 2020
/
Revised: 19 May 2020
/
Accepted: 25 May 2020
/
Published: 27 May 2020
(This article belongs to the Special Issue Sustainability in Asian Emerging Markets)
Abstract
:The purpose of this study was to predict the online sales volume for organic products, identify important factors for selling organic products, and suggest web marketing strategies for organic product sales. Through the review of organic products on Taobao’s platform, the emotional analysis method is used to divide the review of crawling organic products into positive reviews and negative reviews. Using the Latent Dirichlet Allocation (LDA) method, extracting keywords, identifying important factors for selling organic products, using online survey methods and regression analysis methods, obtaining customers’ purchase intentions, and suggesting web marketing strategies for organic product sales, and by collecting data on organic products’ price, current price, free delivery, sales volume, number of customer reviews, customer reviews, organic labeling, and product fans on Taobao’s platform, the neural network analysis method is used to predict the online sales volume for organic products. This study found that packaging design, nutritional information, food quality, delivery risk, freshness, and source risk are the important online factors in the buying of organic products and the products’ fans, price discount, and number of customer reviews affected the sales volume. Therefore, the promotion of online services and logistics can be used to increase the sales of organic products. This research has an important role in promoting the sale of organic products and improving consumer satisfaction, providing consumers with safe and reliable products, and at the same time has important significance for promoting sustainable development.
1. Introduction
With the continuous improvement of people’s living standards, organic products are more and more valued by consumers, because organic products not only protect the environment but also play an important role in consumer health [1,2,3]. Organic products are safe, healthy, and nutritious, so consumers are more willing to buy organic products [4]. In particular, current food safety issues are becoming more prominent year after year, such as the occurrence of poisoned rice, fake eggs, and trench oil. Although the price of organic products is high, consumers are more willing to purchase organic products to find high-quality products. Due to the high price of organic products, in order to sell non-organic products at high prices, many non-organic products are packaged into organic products and circulated in various regions, making the authenticity of organic products difficult to distinguish [5]. At the same time, with rapid economic growth, consumers’ consumption capacity has improved significantly, and excessive consumption of natural resources has caused environmental problems [6]. Growers’ excessive or inappropriate use of pesticides and fertilizers [7], as well as the dumping of wastes [8], especially electronic waste [9], make the soil quality degraded [10], and the damage to the environment is enormous. At the same time, the offline organic product sales channel has high operating costs and low efficiency, which inhibits the interests of buyers and sellers [11]. Compared with the traditional single offline sales model, the online sales model can make the sales scope of organic products wider. At the same time, purchasing organic products online has more flexibility and provides more product varieties for consumers. It also provides more convenience and dynamic information [12,13,14].
According to the latest statistics from Organic World, the land area used for organic agriculture in China has increased from 1.914 million hectares in 2011 to 3.14 million hectares in 2018. According to the data, the land area used for organic agriculture shows an upward trend. At the same time, according to the China Organic Product Certification and Organic Industry Development (2019) Report, the production value of organic products rose from 728 billion in 2011 to 1666 billion in 2018, and the number of certificates issued showed that in 2011 there were 4810 products certified as organic products. By 2018, 19,365 products were certified. According to the data, sales of organic products are increasing year by year. To bring credible products to consumers, the number of certified products is also increasing year by year. Therefore, to provide consumers with organic products, so that consumers can buy safe, reliable, and environmentally friendly organic products, it is of great significance to increase sales of organic products and sustainable development.
Previous research has focused on factors that influence consumers’ actual purchases of organic products, and the research methods used were mainly structured questionnaires [15]. In contrast to the existing research on online organic products, which were mainly carried out through experimental and questionnaire surveys [16], this research not only uses questionnaire survey methods but also uses text mining methods for research.
The main purpose of previous research has been to study the impact of online reviews on products’ sales performance. The research has mainly used the sentiment‒topic model [17]. Previous research has aimed to study the impact of online customer reviews on e-retail sales, mainly using topic extraction [18]. The purpose of previous research was to use online promotional marketing and online reviews as predictors of consumers’ product demands. The main method used has been neural network analysis [19]. Previous research has mainly used a single research approach of sentiment analysis, Latent Dirichlet Allocation (LDA), and neural networks. This article uses not only sentiment analysis methods but also LDA and neural network research methods.
Therefore, the research purpose is to identify important factors for online sales of organic products, to predict the online sales of organic products, and to suggest web marketing strategies for the selling of organic products. The research questions in this study are as follows: First, what parameters can predict the sales volume of organic products? Second, what are the important elements for identifying the online organic product market and developing marketing strategies?
The rest of this paper is organized as follows: In Section 2 we present the literature review, in Section 3 the conceptual framework and research model, and in Section 4 the research procedure, data collection, data analysis, and results. In Section 5 we discuss the results and in Section 6 the implications for research and practice and future directions.
2. Literature Review
2.1. The Transition to Sustainable Organic Product Consumption
Generally, the transition model of sustainable development is composed of the process of co-evolution [20]. Sustainable development is a development model that meets customers’ needs and does not harm the needs of future generations to achieve a sustainable production and consumption system under the conditions of a green economy and environmental protection. To achieve sustainable production and consumption, consumer action is a key factor [21]. Therefore, it is necessary to change consumers ‘consumption behavior habits and promote consumers’ demand for sustainable products to promote sustainable development. The development of organic agriculture and the promotion of organic products can drive the sustainable development of agriculture [22]. Organic agriculture does not use chemically synthesized pesticides and fertilizers and focuses on using the material energy within the agricultural system to save energy and protect natural resources [23]. While developing agriculture to provide rich agricultural products, organic agriculture also takes into account the needs of the ecological environment. The development of organic agriculture can reduce the consumption of non-renewable energy, reduce the pressure of agricultural development on the environment, and help the restoration of the ecological environment. At the same time, organic agricultural products are beneficial to farmers’ incomes and improve the quality of life of farmers in the production area [24]. With the increase in consumer income and the focus on food safety and quality, more consumers choose to purchase organic products, which have a higher premium than conventional agricultural production [25]. Therefore, organic products are very important for sustainable development. Organic products are important products that guide the transition of sustainable production and consumption [26]. From this perspective, the market needs to continuously attract consumers to purchase organic products, and consumers’ continuous purchase of organic products means that previous consumption habits are constantly changing, thus promoting a consumer process of consumer adaptive behavior. This research promotes consumers ‘purchase of organic products by improving consumers’ satisfaction with organic products and promoting sales, which enables consumers to recognize organic products and develop consumer behavior habits for organic products. It plays an important role in promoting sustainable development.
2.2. User Satisfaction for Online Shopping
Buying organic products online provides a convenient platform for consumers and promotes online businesses, thus creating benefits. Therefore, providing online shopping platforms is very important for businesses, retailers, and consumers [27,28]. There is a lot of research on online products as shown in Table 1 below. In previous studies, various variables were mainly used to study the satisfaction of online consumers in purchasing products. Most of the studies focused on online products. This study mainly focused on online organic products.
In previous studies, the research on the impact of online product purchase satisfaction and sales volume mainly used questionnaire surveys or face-to-face interviews. However, such data is often limited and restricted by initial setups, for example, the amount of data surveyed is limited. With the increase in the number of online consumers, customers’ perceptions of products after a purchase are different. A single survey and a conventional method of face-to-face interviews cannot find out more comprehensively how different factors affect the customer satisfaction of customers buying organic products online. Therefore, this research not only uses the data from online reviews for analysis but also uses the questionnaire survey method to study the satisfaction.
Consumers pay more attention to product quality and authenticity when purchasing products online [34]. Therefore, reviews of products purchased online are important. Reviews are given after consumers buy a product, and the evaluation of products and services provided by the merchant include the pictures and additional comments. Online product reviews are the main source of information for customers, retailers, and manufacturers. They can explain the product quality to both practitioners and researchers. In fact, customer reviews of products represent customer satisfaction with a product. Table 2 below is a collection of previous research on online reviews.
The previous data on customers buying products online is from online reviews. The methods used are Latent Dirichlet Allocation (LDA), sentiment analysis, natural language processing (NLP) methods, and other single analysis methods. A single method cannot to better understand the satisfaction of online reviews. We needed to combine multiple analysis methods to study and better understand customers’ online reviews of product satisfaction. Therefore, this research mainly used sentiment analysis, LDA analysis methods, and regression analysis methods. The results obtained were examined regarding satisfaction. Online reviews were collected, and then, using the sentiment analysis and LDA analysis methods, the following keywords were obtained: packaging, nutritional information, food quality, delivery risk, product freshness, and source risk. These keywords were then used to study the relationship with satisfaction.
2.3. Research on Forecasting Sales Volume of Online Shopping
When consumers buy products online, they not only focus on reviews, product price, discount, convenience, and other aspects but, because they are also more concerned about these aspects, the variety of information available online is an important factor in driving consumer purchases [37]. In the research on online purchases, online reviews, the discount value, the discount rate, free delivery, and the sentiments of user reviews can help predict product sales [19]. Because organic products are more expensive than traditional products, consumers pay more attention to the price of online organic products, and assortment, price, and promotions are mainly used to determine the impact of retailer performance [38]. At the same time, organic products are different from traditional products. To buy credible organic produce, there must be an organic mark certified by relevant organizations. These factors are important factors for consumers to purchase organic products online. In this study price, free delivery, the number of customer reviews, product fan, organic labeling, and discount value were selected to predict the sales volume of online organic products. Table 3 below is a collection of previous research on predicting product sales.
Previous studies have used neural networks and regression analysis to predict sales. Generally, neural networks are better than the traditional regression analysis method as neural network analysis can provide a better prediction effect and is suitable for testing large-scale data with a relatively large number of input variables [9]. Linear regression can be used as a simple tool to study the linear relationship between independent and dependent variables. Information about estimated parameters is obtained from the results of linear regression, but the neural network gives no explanation on the parameter estimation [43]. Therefore, this research combines linear regression and neural networks to predict online sales of organic products through price, free shipping, the number of customer reviews, product fans, organic labeling, and discount values.
3. Conceptual Framework and Research Model
3.1. Study 1: Effects of Online Customer Reviews on Satisfaction
Product packaging is a bridge between products and consumers. Packaging design is one of the important factors in conveying product information and beautifying products to provide consumers with valuable products [44]. Therefore, packaging design can guide consumers to make a satisfactory choice [45]. An interesting food packaging design is a design made to satisfy consumer psychology. Product packaging must be realized with visual images that appeal to consumers, and that visual design affects consumers’ evaluations or behavioral intentions [46]. When the text and images of the product packaging are inconsistent with the product and do not meet consumers’ expectations, it affects consumers’ willingness to buy [47]. Therefore, our package design hypothesis is as follows:
H1.
Package design has a positive effect on satisfaction.
With the improvement of consumers’ quality of life, consumers pay more attention to the nutrition of products [48]. Therefore, the nutritional information of product packaging is very important for consumers, enabling consumers to choose products that are more suitable for them. It is important to improve consumers’ healthy quality of life. When consumers have relevant nutritious information, they make more informed choices and this makes consumers more satisfied [31,49]. Nutrition information labeling can improve consumers’ awareness of maintaining their health, which is of great significance in promoting consumer satisfaction and continued use of a product [46]. Therefore, our nutritional information hypothesis is as follows:
H2.
Nutritional information has a positive effect on satisfaction.
Food quality refers to the degree to which food quality characteristics can satisfy consumers. It is mainly the consumer’s evaluation of the food, including the appearance, taste and quality of the food [50]. Food safety has become an important food quality attribute [16]. Food safety issues make it difficult for consumers to trust products and make consumers satisfied with products. Many studies have shown that food quality is an important factor affecting consumer satisfaction [51]. In other words, food quality is an important factor in improving sales and satisfaction, retaining customers, and further ensuring a good buying experience. Therefore, our food quality hypothesis is as follows:
H3.
Food quality has a positive effect on satisfaction.
Delivery risk is mainly a measure of consumers’ concerns about product loss, damage, and errors at the place of delivery when they purchase a product online [30]. Delivery risk mainly refers to on-time delivery (OTD) and delivery without damage [52] (Shahzad Ahmad Khan, 2015). Products bought by consumers online have a lot of damage on arrival, and the phenomenon of products being sent to other places causes consumers who buy products online a lot of psychological inconvenience. Many kinds of research results have shown that the relationship between delivery risk and customer satisfaction is negatively correlated [33,52]. Therefore, our delivery risk hypothesis is as follows:
H4.
Delivery risk has a negative effect on satisfaction.
Product freshness usually refers to the freshness of food related to crispness, juiciness, and aroma [53]. Product freshness in the product purchased by customers is an important factor because customers think fresh products are good for health [29,54]. Consumers purchase products online, and their main concern is the freshness of products [55]. Online ordering for home delivery, which shortens the delivery time and keeps products fresh compared to traditional delivery, makes consumers more satisfied [56]. Consumer perception of the quality of food freshness has a positive influence on satisfaction [57,58].Therefore, our product freshness hypothesis is as follows:
H5.
Product freshness has a positive effect on satisfaction.
Source risk refers to unreliable and dubious online shops when purchasing products online [59]. When buying products online, firstly it is important for consumers to know about the reputation and evaluation of the store, whether online store products are credible, whether they will receive the product after payment, and whether the after-sales service is complete. These are all issues that can make consumers distrust online products [60]. At the same time, purchasing products online provides private data to unreliable stores, such as consumers’ addresses, names, phone numbers, etc., resulting in a higher source risk of products purchased by consumers online [18]. Therefore, our source hypothesis risk is as follows:
H6.
Source risk has a negative effect on satisfaction.
3.2. Study 2: Effects of Online Variables on Sales
Price is an important factor for consumers to buy products online, and consumers want to buy products of good quality and low price. Online shopping can provide more information about product categories so that consumers can get more price information and choose more suitable products. The prices of fruits and vegetables on Taobao are lower than those of meat and aquatic products [61]. The average fruit sales are the highest, followed by vegetables [62]. Therefore, price is an important factor affecting sales volume. Therefore:
H7.
The price of organic products online has a positive effect on sales volume.
Merchants often use price discounts to promote products to stimulate consumer purchases [63]. Based on the transaction posit utility theory, the price discount provided is one of the main reasons that promotes consumers to buy products [64]. The main reason is that there is a price concession during a promotion, so the purchase price is much lower than the usual purchase price and the products purchased make consumers feel the value of the product. Therefore:
H8.
The price discount of organic products online has a positive effect on sales volume.
Free delivery of products purchased online brings convenience to consumers and attracts consumers to online shopping [65]. Free delivery is actually a promotional activity for a product to stimulate consumption by consumers. Consumers feel that their consumption is lower than expected and, therefore, consumption is promoted. Previous research found that free delivery has a positive influence on the attitude toward online shopping. Free delivery has a positive impact on online shopping attitudes and encourages consumers to buy and increases online sales [11,66,67]. Therefore:
H9.
The free delivery of organic products online has a positive effect on sales volume.
Organic labeling refers to a mark for organic products that is traceable by customers [66]. The main difference between organic products and traditional products is whether there is an organic label [68]. Organic labels can be obtained through national agency certification. There are two forms of organic labels—one is an organic code, and the other is an QR code. These two forms determine whether products are organic agricultural products or not. Consumers have to purchase organic products through the government’s certification to build trust for consumers to purchase organic products [69]. This study found that US consumers who purchase chicken breasts with USDA(U.S. Department of Agriculture) organic labeling or universal organic certification labeling are willing to pay more [70]. Therefore:
H10.
The organic labeling of organic products online has a positive effect on sales volume.
Consumers are provided with products available for purchase online. Fans can collect and follow their favorite products [71]. When there are activities related to certain products or new products are launched, they receive relevant information provided by the merchant. Fans are more loyal to product brands and promote consumption [72]. Fans’ loyalty to a product generates better word-of-mouth marketing, makes more consumers understand the product, and some consumers also become fans of the product and better promote the consumption of it [73]. Therefore:
H11.
The product fans of organic products online have a positive effect on sales volume.
Generally, the reviews of consumers who buy products online have a significant impact on the sales volume of products with good reviews particularly important for the sales volume [30]. Similarly, the number of reviews by consumers is also very important [74]. The more consumers that buy a product, the more reviews they provide. These reviews are provided to more consumers, allowing more consumers to know about the product, and this increases the credibility of the product and the number of products purchased [75]. Therefore, the number of consumers has a significant impact on product purchases. Thus:
H12.
The number of consumer reviews of organic products online has a positive effect on sales volume.
Based on the proposed hypothesis, two research models were developed in this research, as shown in Figure 1.
4. Research Methodology
4.1. Research Procedure
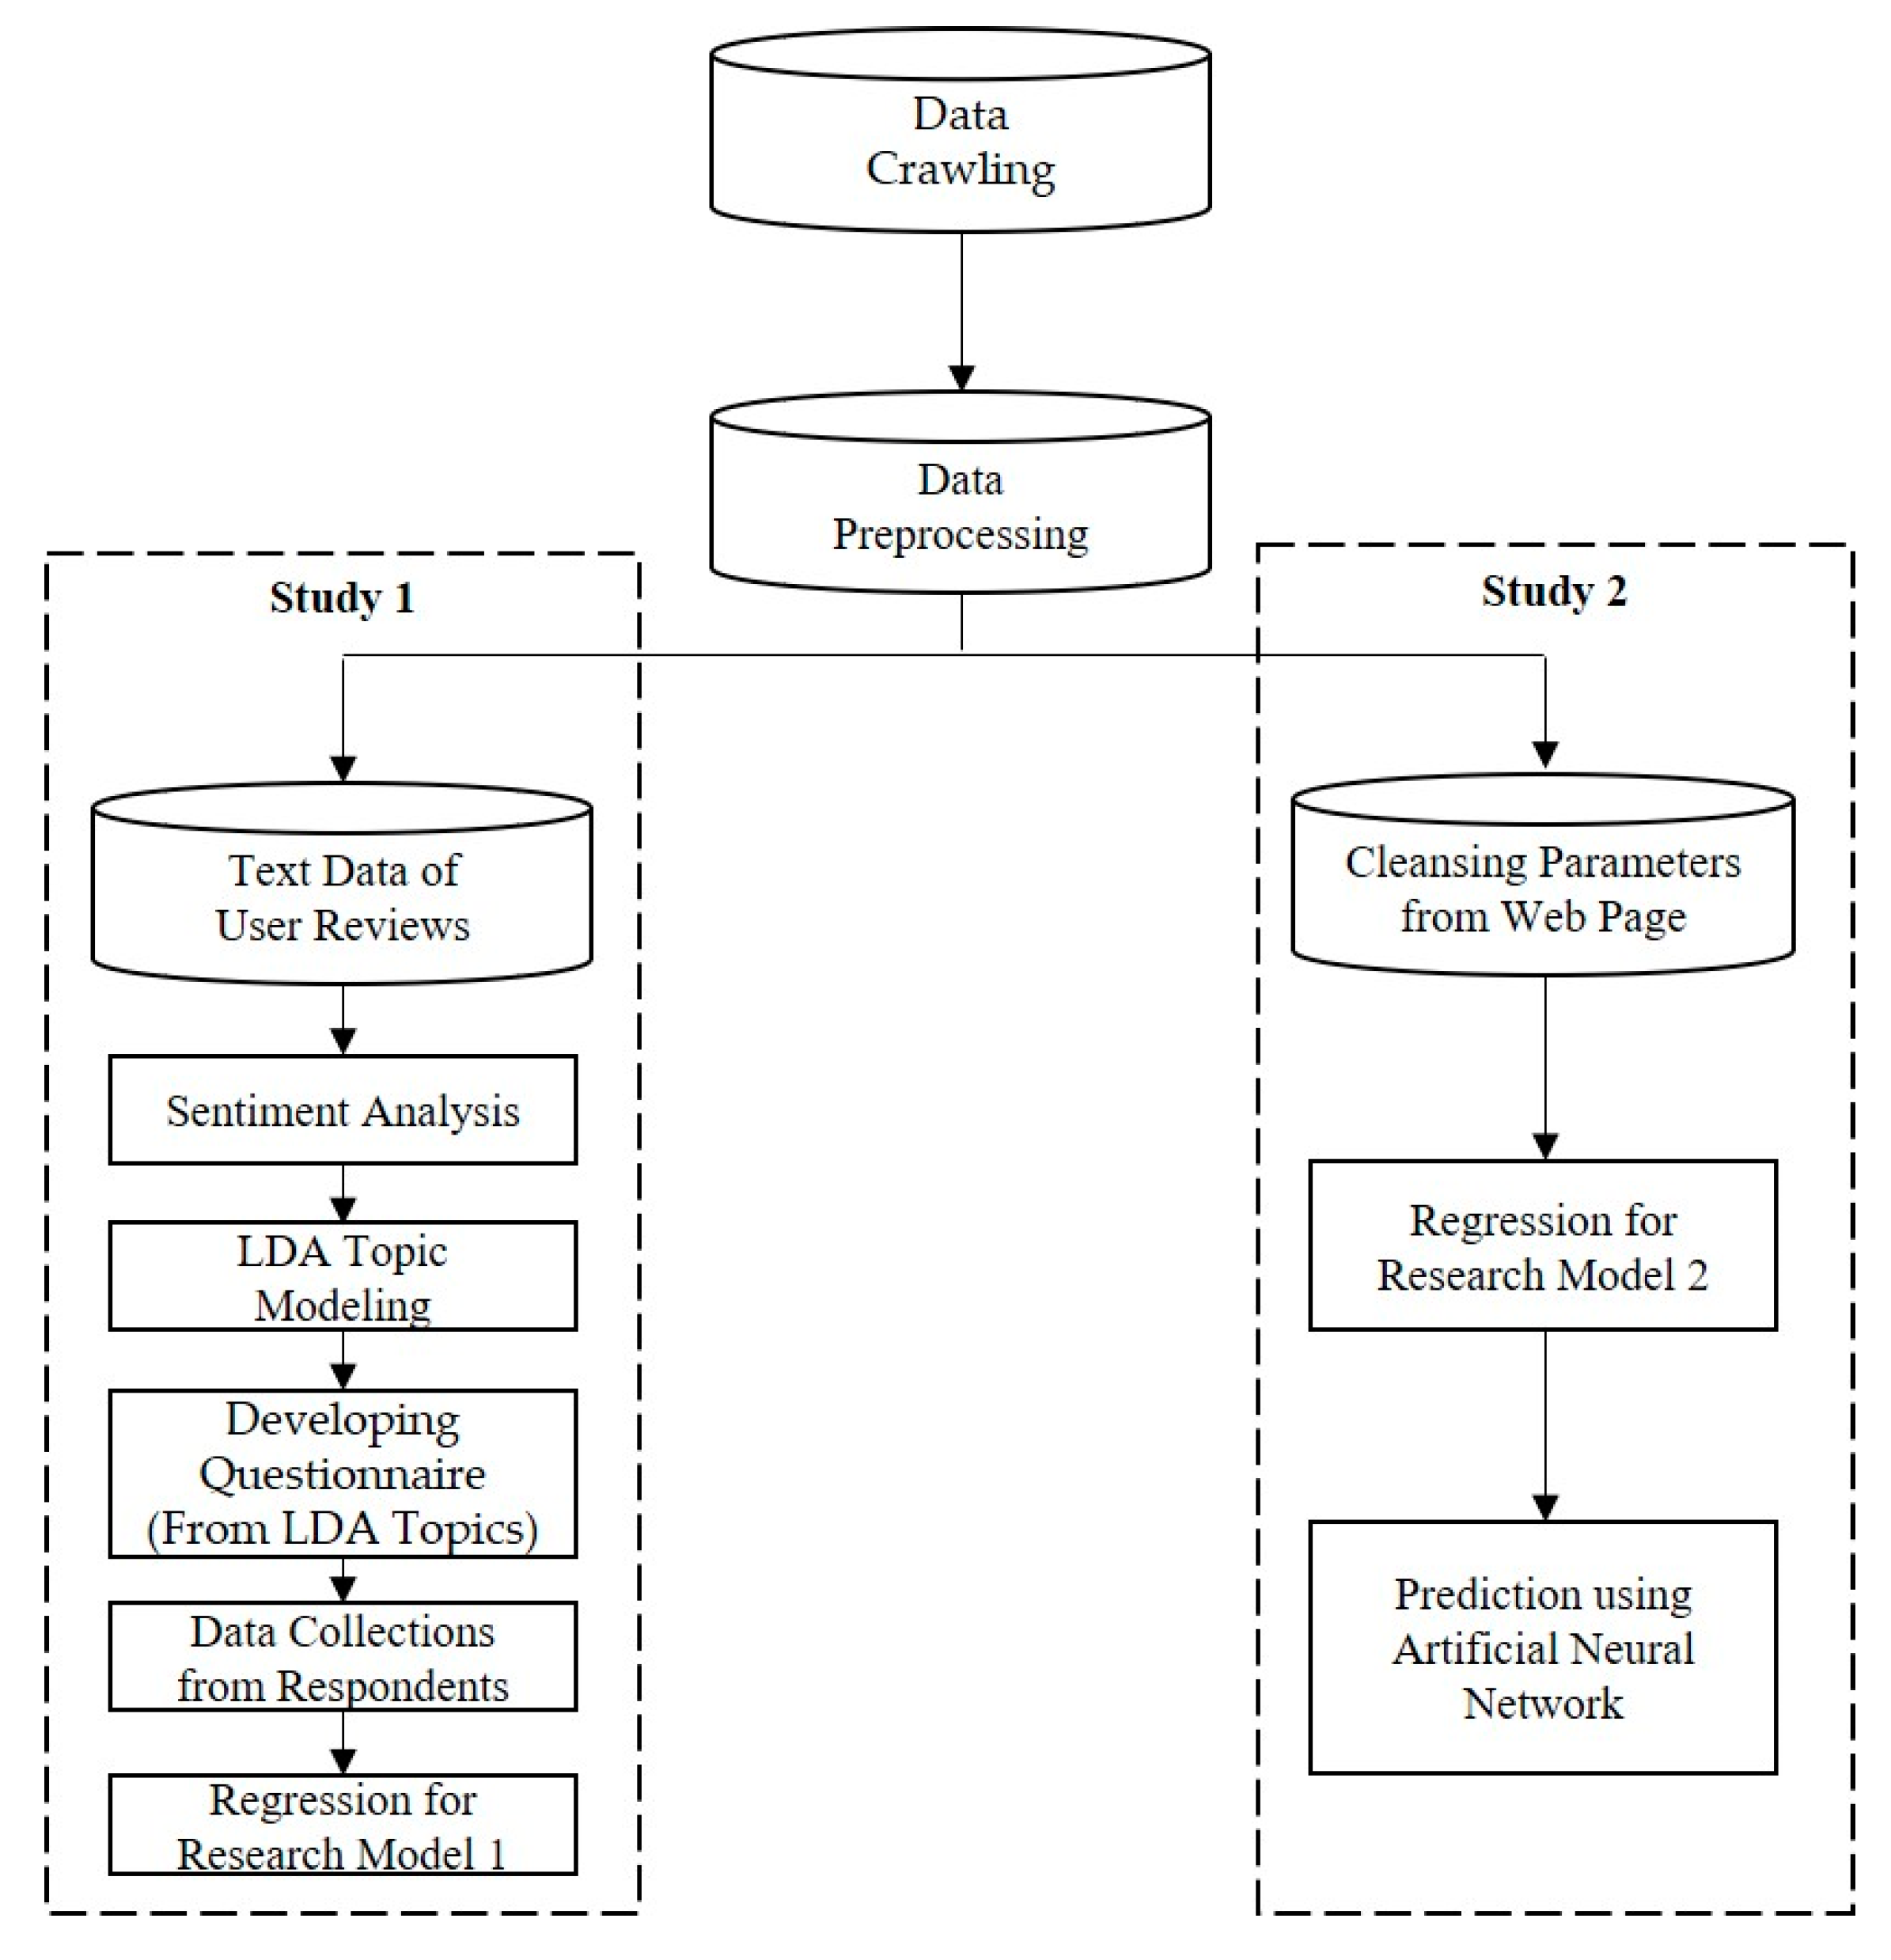
The research purpose was to identify important factors for online sales of organic products, to predict the online sales of organic products, and to suggest web marketing strategies for organic product sales. In order to verify the research purpose, this research constructed two research models and established two research processes. This research mainly collected unstructured data on Taobao organic product reviews, prices, product fans, price discounts, the number of customer reviews, organic labeling, and free delivery. By crawling the comments of Taobao, first the sentiment analysis method was used to divide the reviews into positive and negative reviews, the Latent Dirichlet Allocation (LDA) analysis method was used to find the topic words in positive and negative reviews. A linear regression analysis method was used to test the relationship between subject words and satisfaction in identifying important factors for online sales of organic products. At the same time, we used data collected from various variables, such as prices, product fans, price discount, the number of customer reviews, organic labeling, and free delivery, to determine the relationship between each variable and the sales volume, and to predict the online sales of organic products a neural network analysis method was used. The research process is shown in Figure 2 below.
4.2. Data Collection
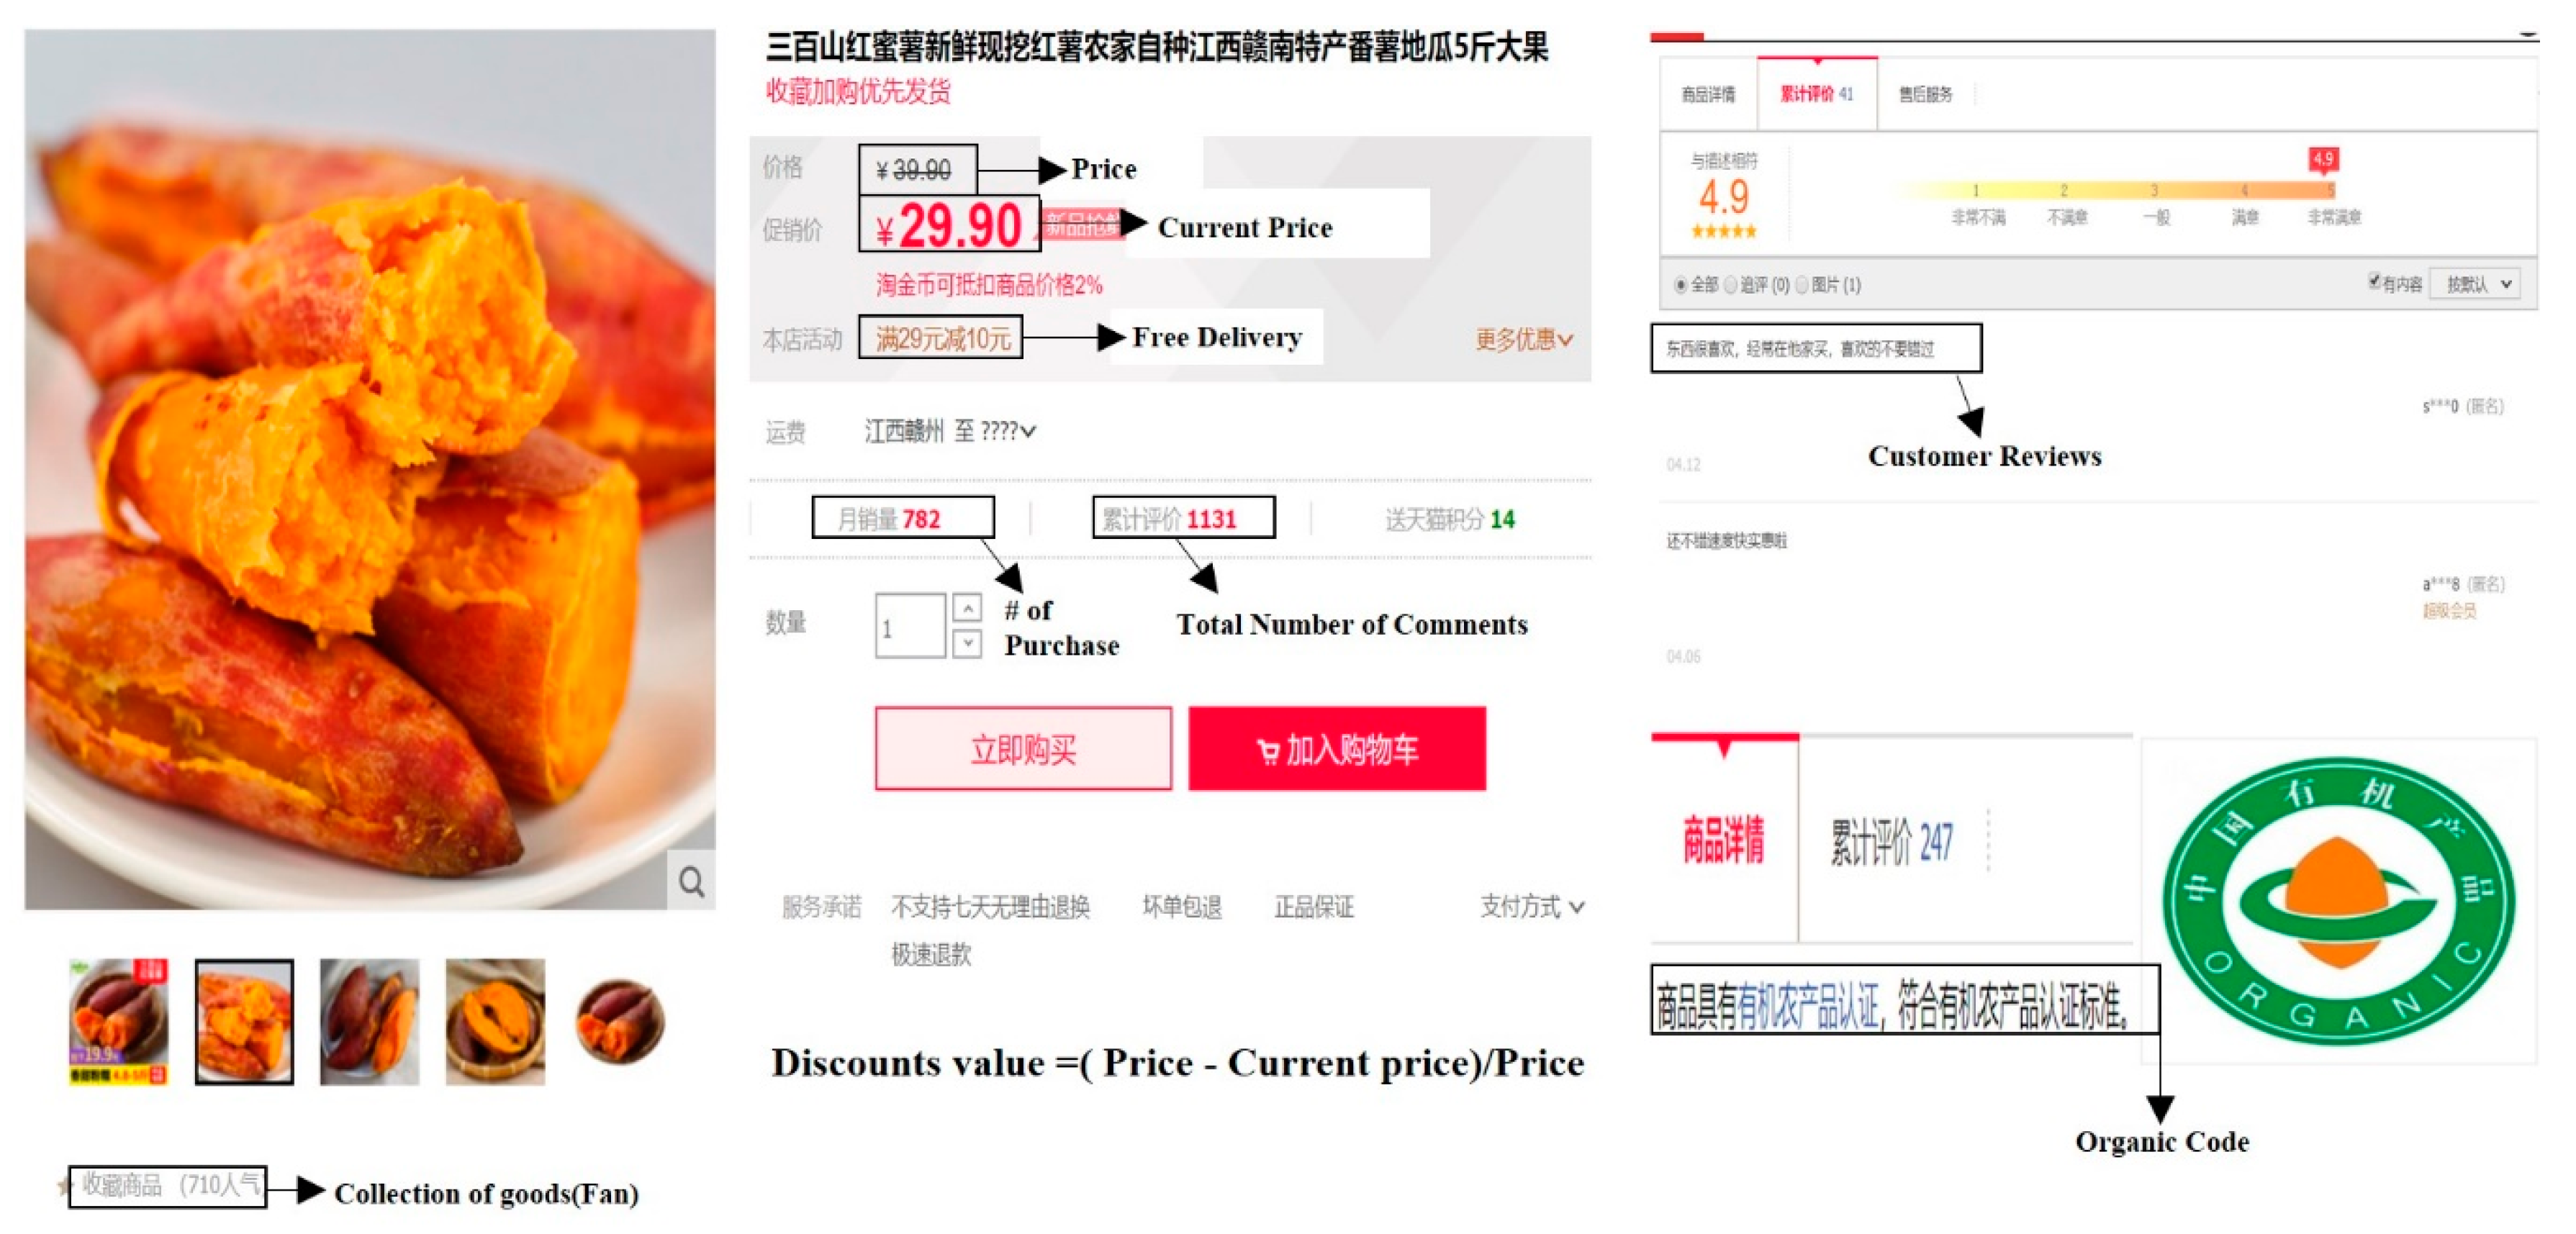
The purpose of this research was to identify important factors for online sales of organic products, to predict the online sales of organic products, and to suggest web marketing strategies for organic product sales. This research mainly used Taobao as a platform to collect data. Taobao is one of the fastest growing online B2C markets in China and has 721 million users, and sales have increased year by year [76]. Agricultural products are produced and processed according to the principles of organic agriculture and organic agricultural production methods and standards, certified by organic food certification agencies, for example, organic grains, organic fruits, organic vegetables, etc. Therefore, this study mainly collected data on organic products on Taobao, searching for related products by keywords, such as organic fruits, organic vegetables, organic rice, organic red beans, organic beef, organic pork, organic egg, and other organic products. A Python-based web crawler was developed to retrieve the relevant data. Python is a high-level scripting language that combines interpretability and compiled, interactive, and object orientation. The web crawler simulates the browser access to network resources and automatically collects the content of the accessed web pages in order to quickly and efficiently obtain the required content [77]. Thus, we developed our own web crawler to collect the data from web data. The period of data collection was from September 8 to September 18, 2019. Data from a total of 9040 organic products were collected, and there were 3446 organic products with reviews out of collected reviews on 506,001 organic products. This research mainly collected data with the titles of organic products’ price, current price, free delivery, sales volume, number of customer reviews, customer reviews, organic labeling, and product fans. The data collected is shown in Figure 3 below.
5. Data Analysis and Results
5.1. Study 1: Sentiment Analysis and Latent Dirichlet Allocation (LDA) Topic Modeling Analysis Results
This research was mainly based on the sentiment analysis of reviews of organic products on, which can help consumers know about the reputation of organic products on Taobao. Usually, sentiment analysis is divided into positive, negative, and neutral [78]. A dictionary-based sentiment analysis mainly uses the sentiment lexicon to give each word a weight for the corresponding emotional inclination, to give each word the corresponding sentiment weight, and then all sentiment words are extracted from the review and the final sentiment score is calculated based on the negative words and adverbs in the review, and the emotional polarity of the review is judged based on the sentiment score [36,79]. The dictionary includes the Boson NLP(Natural Language Processing) dictionary (including positive sentiment words and negative sentiment words), a negative dictionary, and a degree adverb dictionary. The dictionary is derived from the sentiment dictionary of the Boson NLP data downloaded and social media text, so the dictionary is suitable for processing social media sentiment analysis. This study divided reviews into positive and negative reviews based on weight. The criterion was that negative reviews were less than 0 and positive reviews were greater than 0.
Latent Dirichlet Allocation (LDA) is the most commonly used method for topic modeling [80]. Topic modeling using LDA can discover topic words from large amounts of unstructured text data or big data [75]. In this study, LDA was mainly used to extract the keywords related to consumer satisfaction with the online purchase of organic products. The generation process of this study was as follows:
- Read the collection of review documents and use Jieba for word segmentation.
- Assign an ID to each word, namely the corporate dictionary.
- After the ID is assigned, the word frequency of each word is sorted out, and a sparse vector is formed using the form of “word ID: word frequency”.
- Use the LDA model of the Gensim library for training.
- The results show that after the model finishes running, it will output the probability that a comment belongs to a topic and judge which topic that is, based on the probability.
First, using the sentiment analysis method, the reviews crawled on Taobao were divided into positive and negative reviews. A total of 36,603 articles were collected in negative reviews, and a total of 431,567 articles were collected in positive reviews.
Second, the positive and negative reviews were analyzed using LDA topic modeling analysis to derive the keywords. The words were extracted from nouns by topic modeling. The table below summarizes the themes related to consumer purchases of organic products. The LDA topic modeling analysis results of this study were as follows. In Topic 1, words such as great, golden, color, picture, very good, appearance, bag, and gift were extracted. This result confirmed that the topics were related to packaging design. In Topic 2, words such as quality, products, nutrition, health, first-rate, product quality, good, and type were extracted. Thus Topic 2 was related to nutritional information. In Topic 3, words such as quality, beautiful, perfect, great, loyal, fans, fresh, and crisp were extracted. This means that Topic 3 was related to food quality. In Topic 4, words such as time, too slow, hour, yuan tong, consumption, postage, nonsense, and late were extracted. Therefore, Topic 4 was related to the delivery risk. In Topic 5, words such as organic, garbage, almost, pesticide, diarrhea, bad smell, hospital, and epidermis were extracted. Topic 5 was related to freshness. In Topic 6, words such as evaluation, customer service, online shopping, attitude, regular customer, psychology, merchants, and cautious were extracted. This result confirmed that in Topic 6 words related to the source risk were extracted. Therefore, this study used LDA topic modeling analysis to extract a total of six keywords. The keywords for positive reviews were packaging design, nutritional information, and food quality, and the keywords for negative reviews were delivery risk, freshness, source risk. The keywords of online organic products are shown in Table 4 below.
An online survey was conducted among 434 users who purchased organic produce online to test the relationship between the six keywords above and satisfaction. Using a 7-point Likert scale (1 “completely disagree” to 7 “completely agree”) 24 items were evaluated. The measurement scales were adapted from previous studies, as shown in Appendix A. These issues have been reviewed by Chinese and Korean experts.
We conducted an online survey of 434 Chinese users who purchased organic agricultural products online, and the questionnaire was conducted from October 29 to November 16, 2019. The following table shows the demographic information of the participants. Appendix B shows the demographic information of the participants. Among them, there were 160 males (51.95%) and 274 females (48.05%). Users aged 18–40 constituted the largest group, with 184 consumers (42.63%) aged 18–30 and 101 consumers (21.89%) aged 31–40. Regarding the educational level, users who were undergraduates or had a master’s or higher degree were the largest group, with the number of universities being 227 (52.53%) and the number of those with a master’s or higher degree being 107 (24.65%). In terms of income, 255 (58.99%) consumers earned less than $710 and 140 (32.49%) consumers earned $710–1410, and in this group were the largest number of consumers who purchased organic produce online. In terms of occupation, 149 (34.33%) of the consumers who purchased organic produce online were career students, followed by 72 (16.59%) consumers who were full time workers (e.g., professor, nurse). Comparing the online and offline purchase of organic products, consumers were more willing to buy organic products online, there were 279 (64.52%) consumers who bought organic products once a month online and 6 (1.38%) consumers who bought organic products 11 or more times, there were 154 (35.71%) consumers who purchased organic products once a month offline, and 44 (10.37%) consumers who purchased organic products 11 or more times. The types of organic produce that was often bought were organic vegetables, 253 (58.29%); organic fruits, 345 (79.49%); and organic foods, 178 (41.01%). Consumers purchased organic products mainly because of their health—157 (55.67%).
This research used the data from the online questionnaire to analyze the validity and hypothesis tests on the relationship between variables and satisfaction, get relevant data results, and discuss the data results. First, using factor analysis, the factor load corresponding to each of the principal component topics was greater than 0.5, indicating that these topics fell well into the corresponding dimensions. The construct reliability (CR) and average variance extracted (AVE) were calculated based on the load values. The results showed that the construct reliability value of each variable was between 0.836 and 0.917—both greater than the standard of 0.6—and the average variance extracted value was between 0.562 and 0.759—both of which are greater than the 0.5 standard. The alpha coefficient is usually used to measure the reliability of a questionnaire. The larger the alpha coefficient, the higher the reliability of the questionnaire, that is, the higher the reliability and stability of the questionnaire. Generally, the alpha coefficient should be higher than 0.5, and the analysis results were all higher than 0.8, which showed that the data had good reliability and that this study passed the reliability test. The results are shown in Table 5.
Table 6 describes the regression analysis. Each independent variable had a corresponding regression coefficient and a significance test. β represented the standard regression coefficient. The standardized regression coefficient represented the independent variable, that is, the correlation between the predictor and the dependent variable. The results showed that packaging design, nutritional information, and food quality had a positive correlation with satisfaction. Delivery risk, freshness, and source risk had a negative correlation with satisfaction. Therefore, H1, H2, H3, and H4 were supported. However, H5 was rejected. After standardization, each independent variable and dependent variable could be unified. This made the results more accurate and reduced errors due to different units. The t-value was the result of a t-test of the regression coefficients. The larger the absolute value, the smaller the sig—sig represents the significance of the t-test. Statistically, a sig less than 0.05 is generally considered to be significant for the coefficient test. It shows that the independent variable can effectively predict the variation of the dependent variable. Our results were as follows: packaging design (β = 0.245, sig = 0.000), nutritional information (β = 0.240, sig = 0.000), food quality (β = 0.199, sig = 0.000), delivery risk (β = −0.104, sig = 0.009)), freshness (β = −0.107, sig = 0.008), and source risk (β = −0.137, sig = 0.001). The six independent variables had significant standardized regression coefficients for user satisfaction.
5.2. Study 2: Online Variables and Sales Volume Linear Regression
The main research purpose of this part is to predict the impact of consumer purchases of organic agricultural products by crawling the six variables of prices, product fans, the price discount, number of customer reviews, organic labeling, and free delivery. Based on the crawled data, regression analysis was used. β represents the standard regression coefficient. The results showed that product fans, the number of reviews, and price discount had a positive correlation with the sales volume. The t-value is the result of a t-test of the regression coefficients. The larger the absolute value, the smaller the sig, sig represents the significance of the t-test. Statistically, a sig less than 0.05 is generally considered to be significant for the coefficient test. It shows that the independent variable can effectively predict the variation of the dependent variable. The results of the regression model showed that the significance of product fan, price discount, and number of customer reviews were all below 0.005, and all three variables that affect sales passed. The results are shown in Table 7.
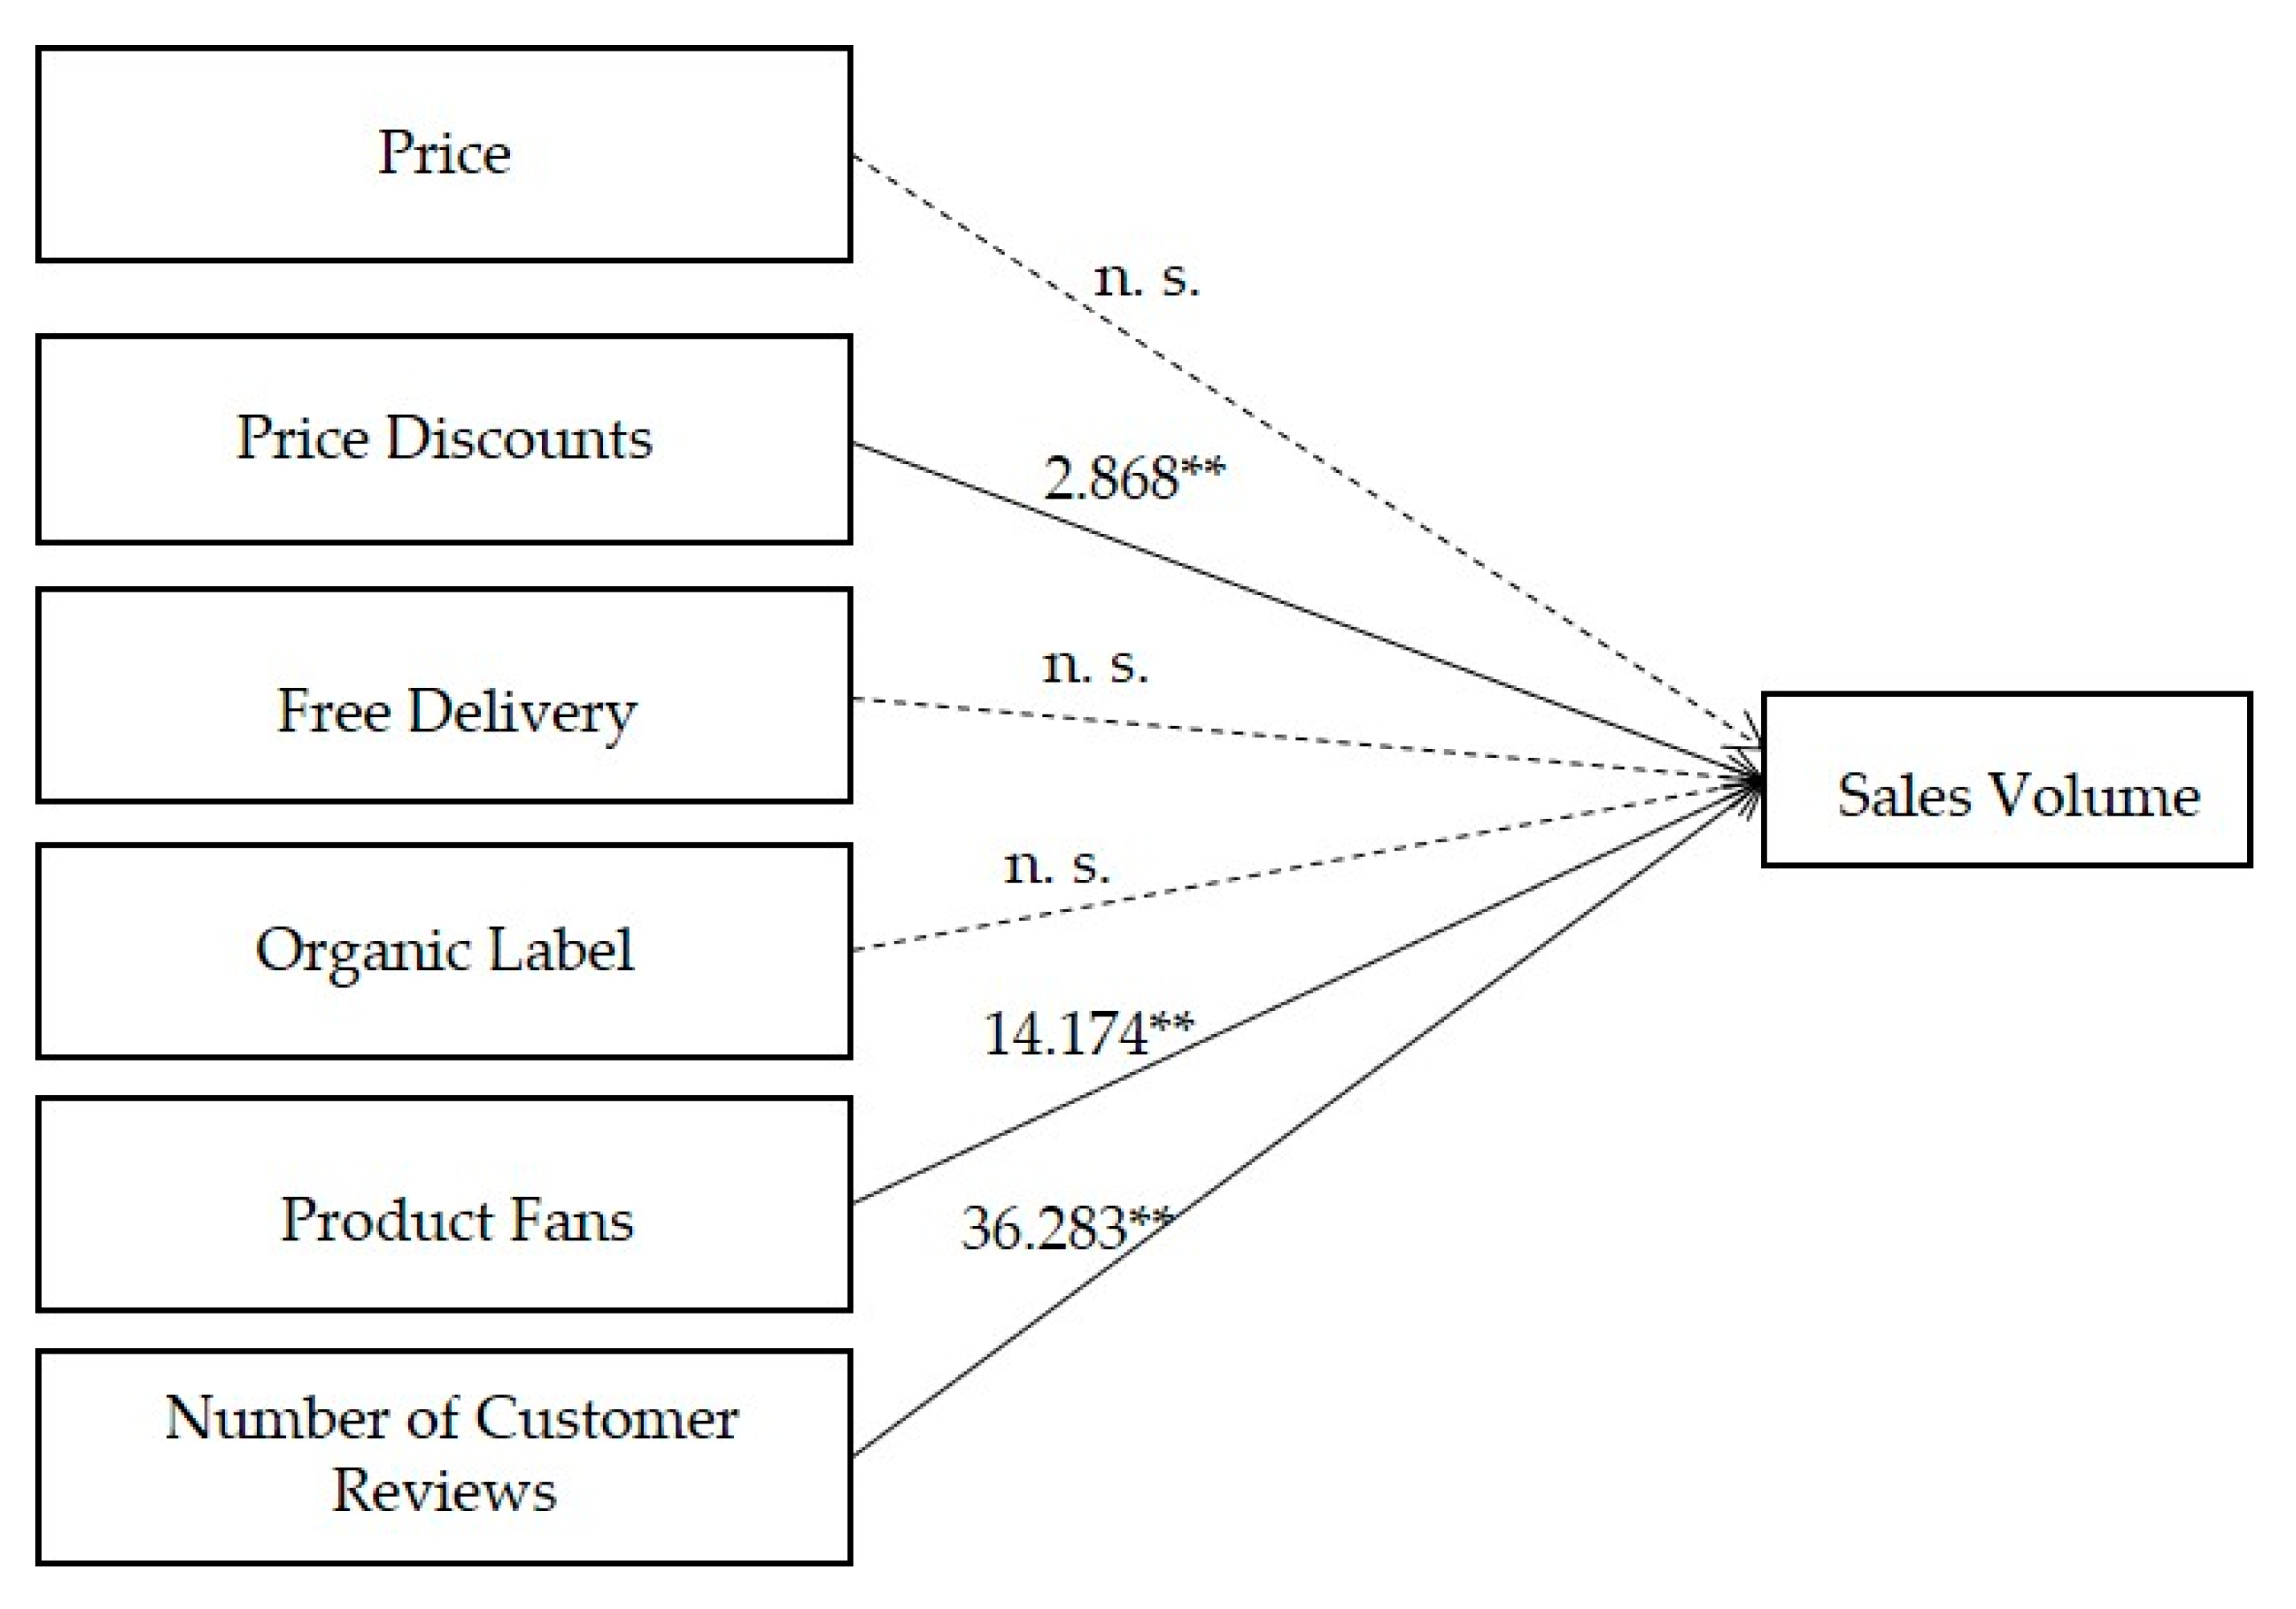
Therefore, the relationship between each variable and the sales volume in the regression analysis is shown in Figure 4 below. The path coefficient for H8 was positive and significant (2.868, p < 0.01). Thus, H8 was supported, indicating that the price discount has a positive impact on the sales volume. The hypothesis for the relationship between product fans and sale volume (H11) was also supported, with a path coefficient of 14.174(p < 0.01). The hypothesis regarding the number of reviews (H12) was also supported, having a significant path coefficient of 36.283. Thus, the regression analysis showed that the three variables of product fans, number of reviews, and price discount had a positive impact on the sale volume. However, hypotheses H7, H9, H10 were not supported, and price, free delivery, and organic labeling did not significantly affect the sales volume.
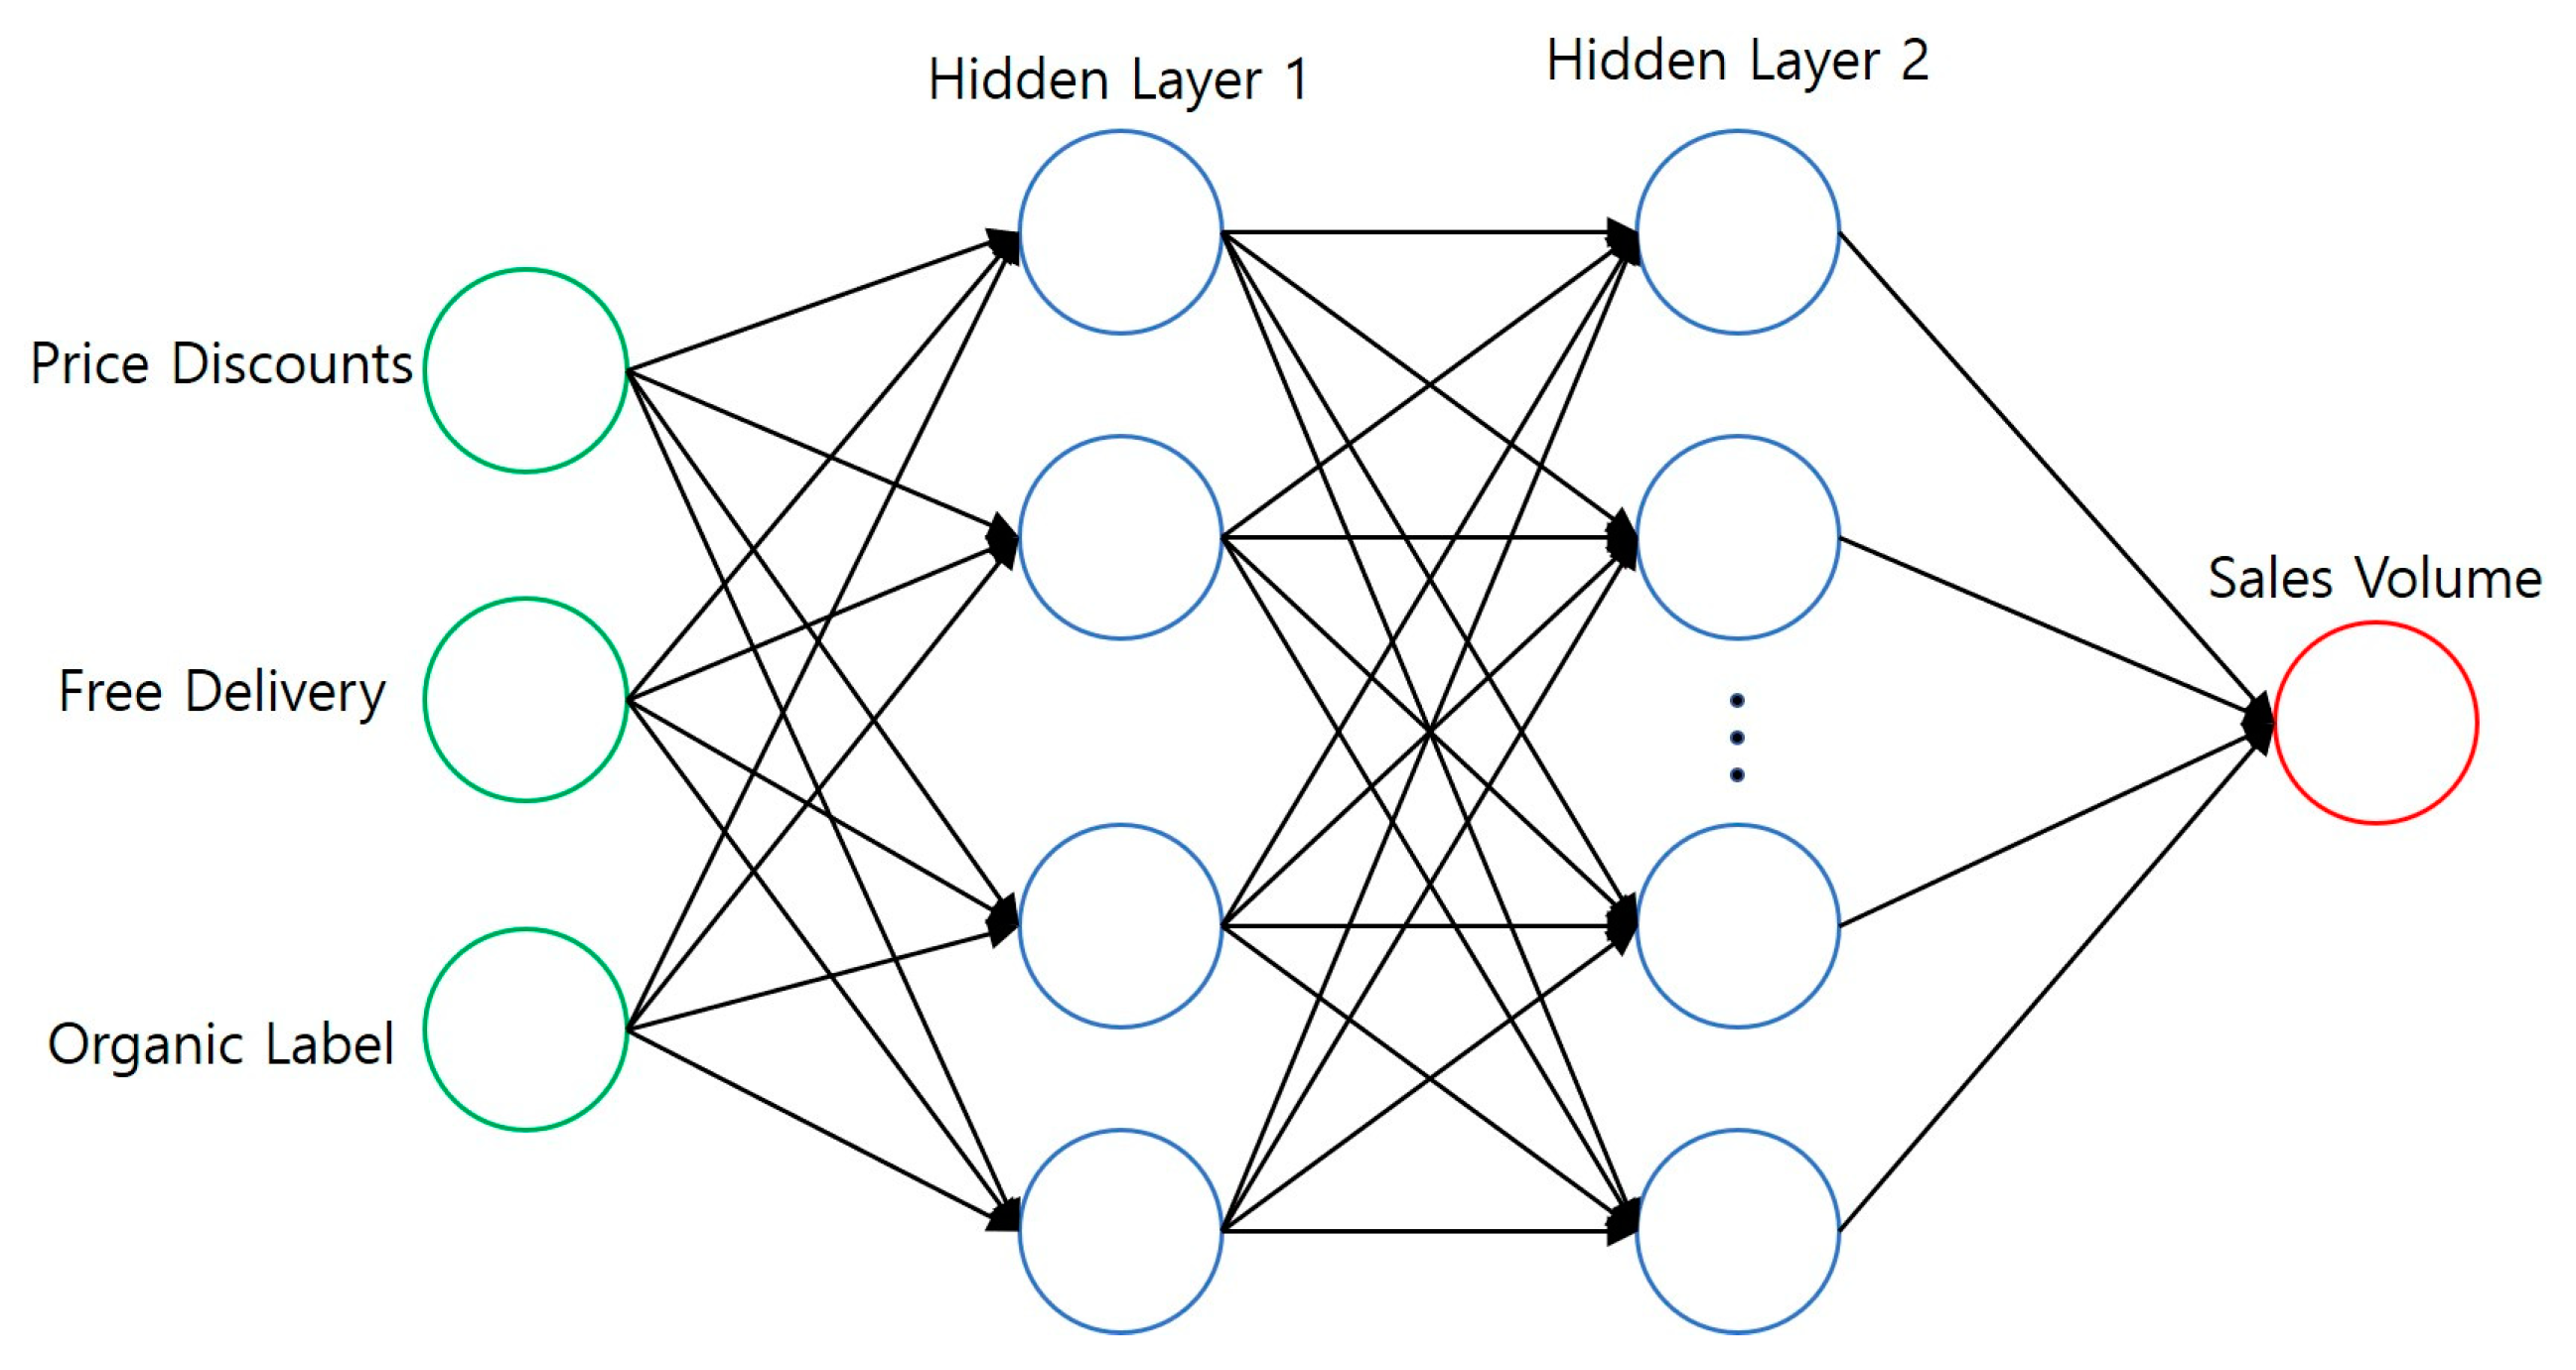
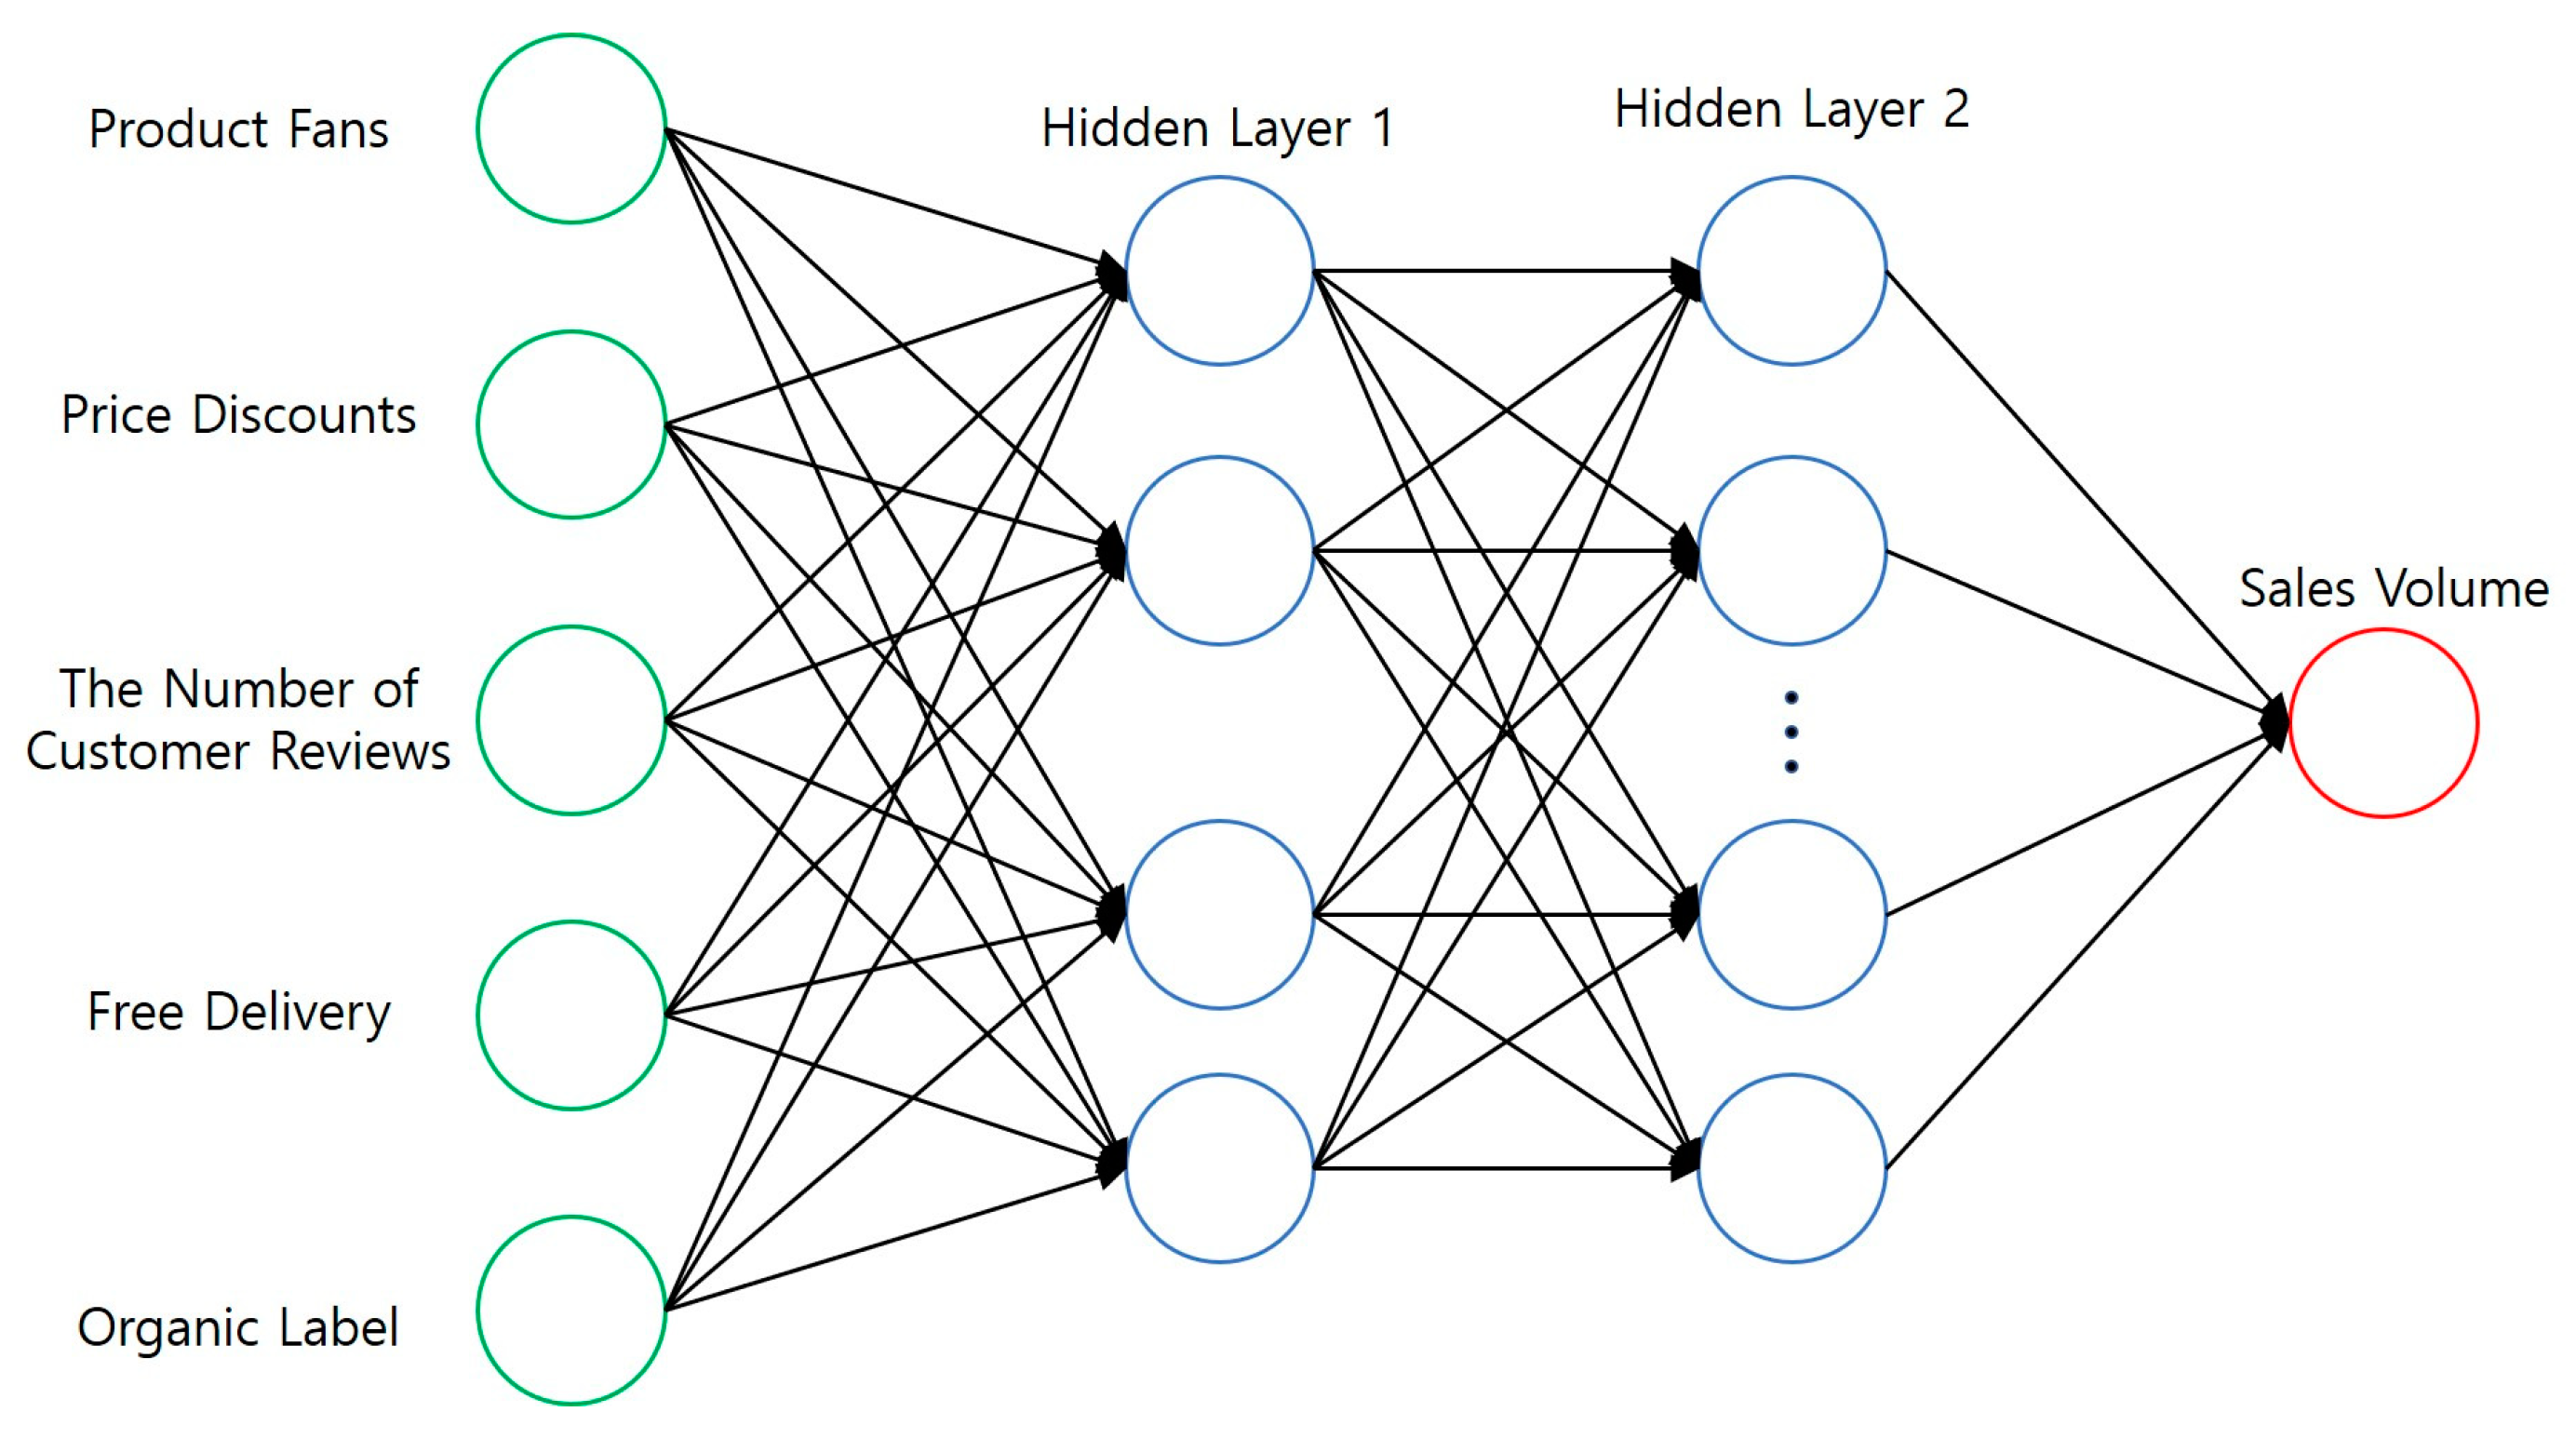
Recent neural network research has mainly focused on prediction to solve complex problems, and, therefore, is suitable for research with a large amount of data [50]. It is one of the research methods of machine learning. This research mainly used the BP(Back Propagation) neural network to predict the sales volume of organic products on Taobao. It was mainly composed of interconnected node systems in three hierarchical layers (input, hidden, and output). The process of the BP neural network was mainly divided into two stages. The first stage was the forward propagation of the signal, from the input layer through the hidden layer, and finally to the output layer; the second stage was the backpropagation of the error, from the output layer to the hidden layers, finally to the input layer, training with a BP model of the Keras neural network framework to predict the sales volume of organic products on Taobao.
Artificial neural network analysis and modeling, which is one of the representative methods of predictive analysis for checking whether the three indicators obtained through regression analysis can predict sales volume, was used. There were three layers—the input layer, the hidden layer, and the output layer. The input layer was the prices, discounted prices, free delivery, organic labeling, and the number of customer reviews, and the output layer was the sales volume. The hidden layer was set to 2. The crawled data set was divided into a training set and a test set “Training” was set to 50%, and “testing” was set to 50%. The training set, input prices, product fan, price discount, number of customer reviews, organic labeling, and free delivery were used for modeling to obtain the output index of the sales volume. After obtaining the model, the test set was used, with inputs of the dimensions of prices, product fans, price discount, number of customer reviews, organic labeling, free delivery to get the output index of the sales volume. To confirm the predictive power of three statistically significant indicators, a total of 6 artificial neural network models were implemented, with low loss and low RMSE(Root Mean Square Error) being better, so the artificial neural network analysis concluded that three variables had an impact on the sales volume. The results are shown in Table 8 below. The artificial neural network model is described in detail in Appendix C.
6. Discussion
First, in this study, we used topic modeling to study the important factors for online consumers purchasing organic agricultural products. The analysis results determined that packaging design, nutritional information, food quality, delivery risk, freshness, and source risk are important factors in buying organic products online. By using regression analysis, the relationship between packaging design, nutritional information, food quality, delivery risk, freshness, source risk, and satisfaction can be determined. Packaging design, nutritional information, food quality, and satisfaction have a positive effect, and delivery risk, freshness, source risk, and satisfaction have a negative effect. Previous studies have shown that packaging design, nutritional information, food quality, and freshness all have a positive effect on satisfaction [56,79,80,81,82,83,84,85]. However, freshness has a negative impact on satisfaction in this study. The main reason is that online ordering for home delivery can provide consumers with more fresh products than traditional express delivery [56]. But products purchased on Taobao usually take 3–4 days to arrive. Therefore, the freshness period of organic products purchased on Taobao will affect consumers’ purchasing of organic products online. In this way, an online and offline platform can be established, and online orders can be delivered to the home in a timely manner, while maintaining the freshness of organic products and providing convenience for consumers to purchase organic products online, providing freshness to products is especially important for consumer satisfaction with online purchases of organic produce. At the same time, maintaining online platforms to provide consumers with better packaging designs and clear nutritional information about organic agricultural products, while providing consumers with better products and ensuring product quality is an important marketing strategy for consumers to purchase organic products online. While buying organic produce online has brought many conveniences to consumers, there are many inconveniences. Previous research has shown that the delivery risk and source risk have a negative impact on satisfaction [11,18,33]. The relationship between the delivery risk, source risk, and satisfaction in this study is consistent with the results obtained in previous studies. Buying products online provides consumer data to unreliable merchants, and at the same time, online shopping raises the question of whether the merchants can send products to consumers safely. These are all unfavorable factors for purchasing products online. Merchants should improve the quality of service and establish a good and credible online shop, providing consumers with a satisfactory and credible platform for purchasing products.
Second, this research mainly used prices, product fans, price discount, the number of customer reviews, organic labeling, and free delivery to predict the sales volume of online organic agricultural products. The results show that product fans, price discount, and the number of customer reviews affected the sales volume. Previous studies have shown that product fans, price discounts, and the number of customer reviews promote product sales [65,73,74]. The relationship between product fans, price discount, the number of customer reviews, and the sales volume in this study is consistent with the results obtained in previous studies. At the same time, the way to promote the sales of organic products purchased online is not only an affected by a single factor but also various factors that jointly promote the sales of online organic products. The more products are discounted, the more consumers will buy, the more consumers will fill out reviews for the product, and at the same time this will attract more consumers to become product fans and jointly promote the increase in product sales. Previous research has shown that prices have an effect on the sales volume, with higher prices lowering the sales volume [61]. The results of this study show that price is not a very important factor in forecasting the sales volume. Generally, the price of organic agricultural products is higher than the price of traditional products. For consumers who purchase organic agricultural products, more attention is not paid to the price of the product. At the same time, previous research has shown that free delivery has a positive impact on sales [11,66,67]. However, the results of this study show that free delivery is not an important factor in predicting sales, because the purchasers of organic products are more concerned about health, product quality, and the environment [3,4,55]. When a consumer buys product online, some products provide free delivery services, some have free delivery services up to a certain price, and some products do not provide free delivery services. By collecting the number of online reviews and monthly sales we can see that many consumers are willing to buy organic products online without free delivery, so free delivery is not an important factor in predicting sales volume. At the same time, the analysis results show that organic codes are not an important factor in predicting sales. However, previous research has shown that organic codes have a positive impact on sales [70], because consumers are more willing to pay for organic products with organic codes [69]. When buying organic products online, merchants will provide consumers with the trademarks of organic agricultural products and certifications of national authoritative organizations online so that consumers can trust products and buy products with confidence. Therefore, buying organic products online in this research is not an important factor in predicting sales. Research shows that when promoting the sale of organic products online, focusing on discount promotions can attract many consumers to buy online, attract consumers to spend, get more reviews for the product, and attract more consumers to become fans of the product.
7. Conclusions and Implications
This research was mainly to determine the influencing factors on customer satisfaction when purchasing organic products online, predict the sales volume of organic products, and suggest web marketing strategies for organic product sales. Through research, this study first identified the influencing factors on satisfaction regarding the online purchase of organic products. The keywords obtained from online reviews using sentiment analysis and LDA analysis methods were packaging design, nutritional information, food quality, delivery risk, product freshness, and source risk. The questionnaire was designed using the topic words, online data collection, and regression analysis. The results showed that packaging design, nutritional information, and food quality had a positive effect on satisfaction, and delivery risk, product freshness, and source risk had a negative effect on satisfaction. The second aim was to predict the factors that affect the sales volume of organic products. Through regression analysis and neural network analysis, the results show that price discounts, product fans, and the number of customer reviews have an impact on the sales volume of online organic products. The results of this study mean that providing online organic products to consumers makes them satisfied, mainly by providing consumers with good packaging design, clear nutrition information, good product quality, and fresh products, while reducing the number of consumers’ various inconveniences, such as by establishing a trusted consumer platform and after-sales service for consumers, while providing consumers with better home delivery services. Consumers who are more satisfied with online organic products will give good reviews. At the same time, giving customers more discounted promotions attracts consumers to buy organic products online, gains more product reviews, attracts more customers to become fans of online organic products, and can increase the sales of online organic products. These are important factors that satisfy consumers and increase merchant profits. Providing consumers with safe and reliable organic products online satisfies consumers and also promotes more profits for merchants and farmers. At the same time, providing these products of great significance for improving the ecological environment and promoting sustainable development.
The results of this study have the following theoretical implications:
First, this research mainly collected large amounts of online data. We not only collected reviews, but we also collected data on forecasted sales volume. However, this study only extracted data from the Taobao platform, but used big data analysis to study consumer satisfaction and forecast sales volume of organic produce. Big data samples can more accurately predict consumer demand for organic products online and better satisfy consumers. Second, this research mainly used four analysis methods: sentiment analysis, LDA, neural network analysis, and regression analysis. The four analysis methods were not used at the same time, so the method remained a single research method. This research aim was to explore online products while using data mining, machine learning, and regression analysis. Third, this research not only used online survey methods to study, but it also used text mining methods to study consumer satisfaction with online organic products. Most of the data that were not collected from online reviews were used for research, mainly using online survey methods. This research could study consumers’ satisfaction in purchasing organic products online better by using the two methods.
This study also has important implications for practice. First, it is necessary to provide consumers with high-quality, safe, cheap, and convenient online organic products. When consumers purchase organic products online, they can get exquisite packaging design, high product quality, and detailed product nutrition information. At the same time, the products have many discounts. This is an important factor to attract consumers to buy online organic products. By attracting more consumers to become fans, products get more good reviews, consumers are satisfied with the purchase of organic products online, and sales of online organic products increase. Second, merchants should establish a secure and trusted online shopping platform. Merchants can protect consumer information and prevent leakage by improving service quality, including logistics, services, reputation, etc. For example, for consumers to receive online products in a timely manner, to maintain the freshness of organic agricultural products, online and offline platforms can be established, which can be quickly and timely sent to consumers, and any problems with the product can be communicated and resolved in a timely manner. This provides convenient services to consumers, meets consumer demand for online purchase of organic products, and increases sales of online organic products. Third, organic agriculture can improve the environment and the quality of life of farmers. It can promote sustainable development by promoting consumers’ consumption habits of organic products and ensure that consumers are provided with safe and high-quality products to protect consumers’ health. At the same time, improving the profits of online merchants and farmers is of great significance to improving the quality of life of farmers.
The results of this study should be interpreted in the context of its limitations. First, this research mainly crawled data on organic agricultural products on Taobao in China. Future research can crawl relevant data on organic products from online platforms in the United States, South Korea, and other regions to expand the results of the research, using three countries for comparison. Second, this study used sentiment analysis only with positive and negative reviews, without considering neutral reviews. Future research can consider using fine-grained sentiment analysis. Third, the online sales of organic produce are forecasted using only prices, discounted prices, free delivery, organic labeling, and the number of customer reviews. Future research could look for more factors to predict the sales of organic products online. Fourth, fake reviews are not considered in the scraped review data. Many merchants attract consumers by making fake reviews. The data obtained may have errors. Therefore, in future research, excluding fake reviews could be considered in order to get more accurate consumer reviews for research.
Author Contributions
Conceptualization, F.L. and J.C.; methodology, F.L. and J.C.; Software, F.L., formal analysis, F.L.; investigation, F.L.; Data curation, F.L.; writing—original draft preparation, F.L. and J.C.; writing—review and editing, F.L. and J.C.; Supervision, J.C. All authors have read and agreed to the published version of the manuscript.
Funding
This work was supported by the Soonchunhyang University Research Fund.
Acknowledgments
We are indebted to the anonymous reviewers and editor.
Conflicts of Interest
The authors declare no conflict of interest.
Appendix A

Table A1.
Measurement items.
| Construct | Items | Questions | Reference |
|---|---|---|---|
| Packaging Design | PD1 | Packaging color composition on organic products packaging draws attention. | [22,84] |
| PD2 | Organic products picture packaging draws attention. | ||
| PD3 | Organic products packaging visual design is aesthetic and unique to draw attention. | ||
| PD4 | Packaging material of organic products reflects good quality. | ||
| Nutritional Information | NI1 | Nutritional information is easy to understand. | [80] |
| NI2 | Nutritional information is useful and important, from the point of view of nutrition. | ||
| NI3 | Nutritional information influences more deliberate and reasonable choices. | ||
| NI4 | Nutritional information should be available in online shopping. | ||
| Food Quality | FQ1 | I shop online because organic products are superior to that sold in offline stores. | [84,86] |
| FQ2 | I feel the quality of organic products online is better than offline. | ||
| FQ3 | I feel the organic products purchased online are healthier than offline. | ||
| Delivery Risk | DR1 | The delivered organic products could be lost. | [71] |
| DR2 | Delivered the organic products to a wrong place. | ||
| DR3 | The organic products are damaged during delivery. | ||
| Freshness | FN1 | The freshness of organic products purchased online is more fresh than offline. | [30] |
| FN3 | The quality of organic products purchased online is more fresh than offline. | ||
| FN2 | The quality of fresh organic products purchased online is better than offline. | ||
| Source Risk | SR1 | Online information about organic products is not true. | [71] |
| SR2 | It is difficult to get support when organic products fail. | ||
| SR3 | I cannot find the place to settle disputes. | ||
| SR4 | Providers fail to keep the promise of post-purchase services. | ||
| Satisfaction | SF1 | I am very happy to buy organic products online. | [56] |
| SF2 | Overall, I am satisfied with the purchase of organic products online. | ||
| SF3 | Overall, buying organic products online comes up to my expectations. |
Appendix B
Table A2.
Descriptive statistics of respondents.
| Demographics | Frequency (n) | Percent (%) | |
|---|---|---|---|
| Gender | Male | 160 | 36.87 |
| Female | 274 | 63.13 | |
| Age | Below 18 | 28 | 6.68 |
| 18–30 | 184 | 42.63 | |
| 31–40 | 94 | 21.89 | |
| 41–50 | 70 | 16.36 | |
| 51–60 | 44 | 10.37 | |
| Above 61 | 8 | 2.07 | |
| Education Level | High school or below | 54 | 12.67 |
| College | 44 | 10.14 | |
| University | 227 | 52.53 | |
| Masters or above | 107 | 24.65 | |
| Income | Less than $710 | 255 | 58.99 |
| Between $710–1410 | 140 | 32.49 | |
| Between $1411–2830 | 20 | 4.61 | |
| More than $ 2830 | 16 | 3.92 | |
| Occupation | Career student | 149 | 34.33 |
| Staff | 61 | 14.06 | |
| Full time (professor, nurse) | 72 | 16.59 | |
| Freelance | 42 | 9.68 | |
| Civil servant | 37 | 8.53 | |
| Housewife | 18 | 4.15 | |
| Other | 55 | 12.67 | |
| How many times do you buy organic products online in a month? | 1 time | 279 | 64.52 |
| 2–3 times | 113 | 26.27 | |
| 4–6 times | 25 | 5.99 | |
| 7–10 times | 8 | 1.84 | |
| 11 or more times | 6 | 1.38 | |
| How many times do you buy organic products offline in a month? | 1 time | 154 | 35.71 |
| 2–3 times | 144 | 33.41 | |
| 4–6 times | 66 | 15.44 | |
| 7–10 times | 21 | 5.07 | |
| 11 or more times | 44 | 10.37 | |
| Please select the type of organic produce that you often buy (multiple choices) | Organic fruits | 345 | 79.49 |
| Organic vegetables | 253 | 58.29 | |
| Organic food (organic rice, organic red beans, etc.) | 178 | 41.01 | |
| Organic livestock and poultry products (organic beef, organic pork, organic eggs, etc.) | 93 | 21.43 | |
| Organic bee products | 67 | 15.44 | |
| Organic tea products | 56 | 12.9 | |
| Organic seafood products | 41 | 9.45 | |
| Organic edible fungi products (organic mushroom) | 49 | 11.29 | |
| Organic milk products | 116 | 26.73 | |
| Organic seasoning | 40 | 9.22 | |
| Processed products with organic products as raw materials (organic drinks) | 35 | 8.06 | |
| Why buy organic produce? | Health | 157 | 55.67 |
| Quality assurance | 11 | 3.90 | |
| Nutrition | 35 | 12.41 | |
| Safety | 24 | 8.51 | |
| Fresh | 9 | 3.19 | |
| Experience | 10 | 3.55 | |
| Cheap | 19 | 2.48 | |
| Good taste | 2 | 0.71 | |
| Convenience | 7 | 2.48 | |
| Environmental protection | 8 | 2.84 | |
Appendix C
Figure A1.
Artificial neural network analysis (ANN) results model (input layer is 3 layers).

Figure A2.
Artificial neural network analysis (ANN) results model (input layer is 4 layers).

Figure A3.
Artificial neural network analysis (ANN) results model (input layer is 5 layers).

References
- Basha, M.B.; Mason, C.; Shamsudin, M.F.; Hussain, H.I.; Salem, M.A. Consumers attitude towards organic food. Procedia Econ. Financ. 2015, 31, 444–452. [Google Scholar] [CrossRef] [Green Version]
- Fan, Z.P.; Che, Y.J.; Chen, Z.Y. Product sales forecasting using online reviews and historical sales data: A method combining the Bass model and sentiment analysis. J. Bus. Res. 2017, 74, 90–100. [Google Scholar] [CrossRef]
- Wu, Y.C.; Tu, J.C. A study on evalution indicator of green packaging design. J. Sci. Des. 2018, 2, 63–72. [Google Scholar]
- Xu, X.; Chen, J.; Liu, Y. Analysis of Sales Characteristics of Fresh Agricultural Products E-Commerce—Taking Taobao as an Example. In Proceedings of the 4th International Conference on Modern Management, Education Technology and Social Science (MMETSS 2019), Guangzhou, China, 20–22 September 2019. [Google Scholar]
- Guo, X.; Ling, K.C.; Liu, M. Evaluating factors influencing consumer satisfaction towards online shopping in China. Asian Soc. Sci. 2012, 8, 40. [Google Scholar] [CrossRef]
- Jung, H.J.; Choi, Y.J.; Oh, K.W. Influencing factors of chinese consumers’ purchase intention to sustainable apparel products: Exploring consumer “Attitude–Behavioral Intention” gap. Sustainability 2020, 12, 1770. [Google Scholar] [CrossRef] [Green Version]
- Fanelli, R.M. The spatial and temporal variability of the effects of agricultural practices on the environment. Environments 2020, 7, 33. [Google Scholar] [CrossRef] [Green Version]
- Núñez-Cacho, P.; Molina-Moreno, V.; Corpas-Iglesias, F.A.; Cortés-García, F.J. Family businesses transitioning to a circular economy model: The case of “Mercadona”. Sustainability 2018, 10, 538. [Google Scholar] [CrossRef] [Green Version]
- Danish, M.; Ali, S.; Ahmad, M.A.; Zahid, H. The influencing factors on choice behavior regarding greenelectronic products: Based on the green perceived value model. Economies 2019, 7, 99. [Google Scholar] [CrossRef] [Green Version]
- Zikeli, S.; Gruber, S. Reduced tillage and no-till in organic farming systems, Germany—Status quo, potentials and challenges. Agriculture 2017, 7, 35. [Google Scholar] [CrossRef] [Green Version]
- Khan, S.A.; Liang, Y.; Shahzad, S. An empirical study of perceived factors affecting customer satisfaction to re-purchase intention in online stores in China. J. Serv. Sci. Manag. 2015, 8, 291. [Google Scholar] [CrossRef] [Green Version]
- Alba, J.; Lynch, J.; Weitz, B.; Janiszewski, C.; Lutz, R.; Sawyer, A.; Wood, S. Interactive home shopping: Consumer, retailer, and manufacturer incentives to participate in electronic marketplaces. J. Mark. 1997, 61, 38–53. [Google Scholar] [CrossRef] [Green Version]
- Bhatnagar, A.; Ghose, S. Segmenting consumers based on the benefits and risks of Internet shopping. J. Bus. Res. 2004, 57, 1352–1360. [Google Scholar] [CrossRef]
- Hanaysha, J. Testing the effects of food quality, price fairness, and physical environment on customer satisfaction in fast food restaurant industry. J. Asian Bus. Strategy 2016, 6, 31–40. [Google Scholar] [CrossRef] [Green Version]
- Tabaei, Z.; Fathian, M. Developing online customer satisfaction strategic maps: With Iranian online retailing case studies. Int. J. Electron. Cust. Relatsh. Manag. 2012, 6, 87–112. [Google Scholar] [CrossRef]
- Salehan, M.; Kim, D.J. Predicting the performance of online consumer reviews: A sentiment mining approach to big data analytics. Decis. Support Syst. 2016, 81, 30–40. [Google Scholar] [CrossRef]
- Lim, N. Consumers’ perceived risk: Sources versus consequences. Electron. Commer. Res. Appl. 2003, 2, 216–228. [Google Scholar] [CrossRef]
- Lösing, T. How Does Privacy Perception Influence Online Shopping Behavior: A Comparison between Millennials and Generation X. Bachelor’s Thesis, University of Twente, Enschede, The Netherlands, 2016. [Google Scholar]
- Chong, A.Y.L.; Ch’ng, E.; Liu, M.J.; Li, B. Predicting consumer product demands via Big Data: The roles of online promotional marketing and online reviews. Int. J. Prod. Res. 2017, 55, 5142–5156. [Google Scholar] [CrossRef]
- Kemp, R.; Loorbach, D.; Rotmans, J. Transition management as a model for managing processes of coevolution towards sustainable development. Int. J. Sustain. Dev. World Ecol. 2007, 14, 78–91. [Google Scholar] [CrossRef] [Green Version]
- Blok, V.; Long, T.B.; Gaziulusoy, A.I.; Ciliz, N.; Lozano, R.; Huisingh, D.; Csutora, M.; Boks, C. From bestpractices to bridges for a more sustainable future: Advances and challenges in the transition to global sustainable production and consumption: Introduction to the ERSCP stream of the Special volume. J. Clean. Prod. 2015, 108, 19–30. [Google Scholar] [CrossRef]
- Bai, L.; Wang, M.; Gong, S. Understanding the antecedents of organic food purchases: The important roles of beliefs, subjective norms, and identity expressiveness. Sustainability 2019, 11, 3045. [Google Scholar] [CrossRef] [Green Version]
- Tsakiridou, E.; Boutsouki, C.; Zotos, Y.; Mattas, K. Attitudes and behaviour towards organic products: An exploratory study. Int. J. Retail Distrib. Manag. 2008, 36, 158. [Google Scholar] [CrossRef]
- Jouzi, Z.; Azadi, H.; Taheri, F.; Zarafshani, K.; Gebrehiwot, K.; Van Passel, S.; Lebailly, P. Organic farming and small-scale farmers: Main opportunities and challenges. Ecol. Econ. 2017, 132, 144–154. [Google Scholar] [CrossRef] [Green Version]
- Gan, C.; Chang, Z.; Tran, M.C.; Cohen, D.A.; Wang, X. Consumer attitudes towards the purchase of organic products in China. Int. J. Bus. Econ. 2016, 15, 117. [Google Scholar]
- Vittersø, G.; Tangeland, T. The role of consumers in transitions towards sustainable food consumption. The case of organic food in Norway. J. Clean. Prod. 2015, 92, 91–99. [Google Scholar] [CrossRef]
- Li, X.; Wu, C.; Mai, F. The effect of online reviews on product sales: A joint sentiment-topic analysis. Inf. Manag. 2019, 56, 172–184. [Google Scholar] [CrossRef]
- Mo, Z.; Li, Y.F.; Fan, P. Effect of online reviews on consumer purchase behavior. J. Serv. Sci. Manag. 2015, 8, 419. [Google Scholar] [CrossRef] [Green Version]
- Boyer, K.K.; Hult, G.T.M. Customer behavioral intentions for online purchases: An examination of fulfillment method and customer experience level. J. Oper. Manag. 2006, 24, 124–147. [Google Scholar] [CrossRef]
- Namkung, Y.; Jang, S. Does food quality really matter in restaurants? Its impact on customer satisfaction and behavioral intentions. J. Hosp. Tour. Res. 2007, 31, 387–409. [Google Scholar] [CrossRef]
- Timmerman, N.; Piqueras-Fiszman, B. The effect of ingredient item depiction on the packaging frontal view on pre-and post-consumption product evaluations. Foods 2019, 8, 354. [Google Scholar] [CrossRef] [Green Version]
- Van Loo, E.J.; Caputo, V.; Nayga, R.M., Jr.; Meullenet, J.F.; Ricke, S.C. Consumers’ willingness to pay for organic chicken breast: Evidence from choice experiment. Food Qual. Prefer. 2011, 22, 603–613. [Google Scholar] [CrossRef]
- Hui, C. The impact mechanism of consumer-generated comments of shopping sites on consumer trust. J. Comput. 2011, 6, 43–52. [Google Scholar]
- Singh, A.; Verma, P. Factors influencing Indian consumers’ actual buying behaviour towards organic food products. J. Clean. Prod. 2017, 167, 473–483. [Google Scholar] [CrossRef]
- Gagić, S.; Tešanović, D.; Jovičić, A. The vital components of restaurant quality that affect guest satisfaction. Turizam 2013, 17, 166–176. [Google Scholar] [CrossRef] [Green Version]
- Wu, L.; Zhu, D. Food Safety in China: A Comprehensive Review, 1st ed.; CRC Press: Boca Raton, FL, USA, 2014; pp. 55–183. [Google Scholar]
- Nourbakhsh, M.; Poursaeedi, A.; Asadollahi, A.R. An analysis of factors affecting on online shopping behavior of consumers. Int. J. Mark. Stud. 2012, 4, 81. [Google Scholar]
- Bezawada, R.; Pauwels, K. What is special about marketing organic products? How organic assortment, price, and promotions drive retailer performance. J. Mark. 2013, 77, 31–51. [Google Scholar]
- Chong, A.Y.L.; Li, B.; Ngai, E.W.; Ch’ng, E.; Lee, F. Predicting online product sales via online reviews, sentiments, and promotion strategies: A big data architecture and neural network approach. Int. J. Oper. Prod. Manag. 2016, 36, 358–383. [Google Scholar] [CrossRef] [Green Version]
- Lee, S.; Choeh, J.Y. Predicting the helpfulness of online reviews using multilayer perceptron neural networks. Expert Syst. Appl. 2014, 41, 3041–3046. [Google Scholar] [CrossRef]
- Sohn, B.; Lim, H.; Choi, J. The Prediction of Sales Volume and WoM Effect through Network Structure and Topic Modeling on Social Media. In Proceedings of the Pacific Asia Conference on Information Systems, Xi’an, China, 8–12 July 2019. [Google Scholar]
- Hou, F.; Li, B.; Chong, A.Y.L.; Yannopoulou, N.; Liu, M.J. Understanding and predicting what influence online product sales? A neural network approach. Prod. Plan. Control 2017, 28, 964–975. [Google Scholar] [CrossRef]
- Bakar, N.M.A.; Tahir, I.M. Applying multiple linear regression and neural network to predict bank performance. Int. Bus. Res. 2009, 2, 176–183. [Google Scholar] [CrossRef]
- Wu, D. Research on influence of interesting food packaging design on consumer psychology. In Proceedings of the 2017 International Conference on Humanities Science, Management and Education Technology (HSMET 2017), Taiyuan, China, 25 February 2017. [Google Scholar]
- Cahyorini, A.; Rusfian, E.Z. The effect of packaging design on impulsive buying. Bisnis Birokrasi J. 2011, 18, 11–21. [Google Scholar]
- Thomas, L., Jr.; Mills, J.E. Consumer knowledge and expectations of restaurant menus and their governing legislation: A qualitative assessment. J. Foodserv. 2006, 17, 6–22. [Google Scholar] [CrossRef]
- Ueasangkomsate, P.; Santiteerakul, S. A study of consumers’ attitudes and intention to buy organic foods for sustainability. Procedia Environ. Sci. 2016, 34, 423–430. [Google Scholar] [CrossRef] [Green Version]
- Fu, L.; Wang, K.L. The impact of nutritional information labels on consumer attitudes and behaviors in online food customization. In Proceedings of the 2014 International Conference on Management Science and Engineering 21th Annual Conference Proceedings, Helsinki, Finland, 17–19 August 2014. [Google Scholar]
- Cranage, D.A.; Conklin, M.T.; Lambert, C.U. Effect of nutrition information in perceptions of food quality, consumption behavior and purchase intentions. J. Foodserv. Bus. Res. 2005, 7, 43–61. [Google Scholar] [CrossRef]
- Grewal, D.; Krishnan, R.; Baker, J.; Borin, N. The effect of store name, brand name and price discounts on consumers’ evaluations and purchase intentions. J. Retail. 1998, 74, 331–352. [Google Scholar] [CrossRef] [Green Version]
- Shaharudin, M.R.; Mansor, S.W.; Elias, S.J. Food quality attributes among Malaysia’s fast food customer. Int. Bus. Manag. 2011, 2, 198–208. [Google Scholar]
- Kumar, D.U.; Misra, S. A study on shoppers’ preference for online shopping. Daffodil Int. Univ. J. Bus. Econ. 2015, 9, 163–170. [Google Scholar]
- Pozzi, A. The effect of Internet distribution on brick-and-mortar sales. Rand J. Econ. 2013, 44, 569–583. [Google Scholar] [CrossRef] [Green Version]
- Simmonds, G.; Spence, C. Thinking inside the box: How seeing products on, or through, the packaging influences consumer perceptions and purchase behaviour. Food Qual. Prefer. 2017, 62, 340–351. [Google Scholar] [CrossRef]
- Janssen, M.; Hamm, U. Product labelling in the market for organic food: Consumer preferences and willingness-to-pay for different organic certification logos. Food Qual. Prefer. 2012, 25, 9–22. [Google Scholar] [CrossRef]
- Boyer, K.K.; Hult, G.T.M. Customer behavior in an online ordering application: A decision scoring model. Decis. Sci. 2005, 36, 569–598. [Google Scholar] [CrossRef]
- Naiyi, Y.E. Dimensions of consumer’s perceived risk in online shopping. J. Electron. Sci. Technol. 2004, 2, 177–182. [Google Scholar]
- Péneau, S.; Hoehn, E.; Roth, H.R.; Escher, F.; Nuessli, J. Importance and consumer perception of freshness of apples. Food Qual. Prefer. 2006, 17, 9–19. [Google Scholar] [CrossRef]
- Brüseke, L. The Influence of Privacy Perceptions on Online Shopping Behavior: A Comparison between Millennials and Baby Boomers. Bachelor’s Thesis, University of Twente, Enschede, The Netherlands, 2016. [Google Scholar]
- Marshall, R.; Bee Leng, S. Price threshold and discount saturation point in Singapore. J. Prod. Brand Manag. 2002, 11, 147–159. [Google Scholar] [CrossRef]
- Chiang, K.P.; Dholakia, R.R. Factors driving consumer intention to shop online: An empirical investigation. J. Consum. Psychol. 2003, 13, 177–183. [Google Scholar] [CrossRef]
- Yan, W. The Study on the Influence of Clothing Packaging Design for Marketing. In Proceedings of the 2017 3rd International Conference on Education and Social Development (ICESD 2017), Frankfurt, Germany, 8–9 April 2017. [Google Scholar]
- Griffith, R.; Nesheim, L. Household Willingness to Pay for Organic Products; University College London; Institute for Fiscal Studies (IFS): London, UK, 2008. [Google Scholar]
- Li, Z.; Li, F.; Xiao, J.; Yang, Z. Effects of Negative Customer Reviews on Sales: Evidence based on text data mining. In Proceedings of the 2018 IEEE International Conference on Data Mining Workshops, Sentosa, Singapore, 17–20 November 2018. [Google Scholar]
- Röhr, A.; Lüddecke, K.; Drusch, S.; Müller, M.J.; Alvensleben, R.V. Food quality and safety––Consumer perception and public health concern. Food Control 2005, 16, 649–655. [Google Scholar] [CrossRef]
- Jiang, L.; Yang, Z.; Jun, M. Measuring consumer perceptions of online shopping convenience. J. Serv. Manag. 2013, 24, 191–214. [Google Scholar] [CrossRef]
- Kim, J.; Lennon, S.J. Effects of reputation and website quality on online consumers’ emotion, perceived risk and purchase intention. J. Res. Interact. Mark. 2013, 7, 33–56. [Google Scholar] [CrossRef]
- Deliana, Y. Market segmentation for organic products in Bandung West Java. Res. J. Recent Sci. 2012, 1, 48–56. [Google Scholar]
- Din, N.; Zahari, M.S.M.; Shariff, S.M. Customer perception on nutritional information in restaurant menu. Procedia Soc. Behav. Sci. 2012, 42, 413–421. [Google Scholar] [CrossRef] [Green Version]
- Liu, Z.W.; Park, S.W. What makes a useful online review? Implication for travel product websites. Tour. Manag. 2015, 47, 140–151. [Google Scholar] [CrossRef] [Green Version]
- Dholakia, U.M.; Durham, E. One café chain’s Facebook experiment. Harv. Bus. Rev. 2010, 88, 26. [Google Scholar]
- Barton, B. Ratings, reviews and ROI: How leading retailers use customer word of mouth in marketing and merchandising. J. Interact. Advert. 2006, 7, 5–50. [Google Scholar] [CrossRef]
- Ditlevsen, K.; Sandøe, P.; Lassen, J. Healthy food is nutritious, but organic food is healthy because it is pure: The negotiation of healthy food choices by Danish consumers of organic food. Food Qual. Prefer. 2019, 71, 46–53. [Google Scholar] [CrossRef] [Green Version]
- Tirunillai, S.; Tellis, G.J. Does chatter really matter? Dynamics of user-generated content and stock performance. Mark. Sci. 2012, 31, 198–215. [Google Scholar] [CrossRef] [Green Version]
- Hoffman, D.L.; Novak, T.P.; Chatterjee, P. Commercial scenarios for the web: Opportunities and challenges. J. Comput. Mediat. Commun. 1995, 1, 136. [Google Scholar] [CrossRef]
- George, G.; Haas, M.; Pentland, A. Big data and management. Acad. Manag. J. 2014, 57, 321–326. [Google Scholar] [CrossRef]
- You, F.; Gong, H.; Guan, X.; Cao, Y.; Zhang, C.; Lai, S.; Zhao, Y. Design of data mining of WeChat public platform based on Python. In Proceedings of the Journal of Physics: Conference Series, Suzhou, China, 22–24 June 2018. [Google Scholar]
- Lichtenstein, D.R.; Netemeyer, R.G.; Burton, S. Distinguishing coupon proneness from value consciousness: An acquisition-transaction utility theory perspective. J. Mark. 1990, 54, 54–67. [Google Scholar] [CrossRef]
- Chen, J.; Chen, H.; Wu, Z.; Hu, D.; Pan, J.Z. Forecasting smog-related health hazard based on social media and physical sensor. Inf. Syst. 2017, 64, 281–291. [Google Scholar] [CrossRef]
- Blei, D.M.; Ng, A.; Jordan, M. Latent dirichlet allocation. J. Mach. Learn. Res. 2003, 3, 993–1022. [Google Scholar]
- Lam, S.Y.; Shankar, V.; Erramilli, M.K.; Murthy, K. Customer value, satisfaction, loyalty, and switching costs: An illustration from a business-to-business service context. J. Acad. Mark. Sci. 2004, 32, 293–311. [Google Scholar] [CrossRef]
- Ullah, R.; Amblee, N.; Kim, W.; Lee, H. From valence to emotions: Exploring the distribution of emotions in online product reviews. Decis. Support Syst. 2016, 81, 41–53. [Google Scholar] [CrossRef]
- Soederberg, L.; Cassady, D. The effects of nutrition knowledge on food label use. A review of the literature. Appetitte 2015, 92, 207–216. [Google Scholar]
- Hu, Q.; Xu, Q.; Xu, B. Introducing of online channel and management strategy for green agri-food supply chain based on pick-your-own operations. Int. J. Environ. Res.Public Health 2019, 16, 1990. [Google Scholar] [CrossRef] [PubMed] [Green Version]
- Huang, J.; Xu, W.; Wei, H.; Wan, H. Study on consumers’ satisfaction degree and influencing factors of online shopping for agricultural products. In Proceedings of the 2014 International Conference on Mechatronics, Electronic, Industrial and Control Engineering (MEIC-14), Shenyang, China, 15–17 November 2014. [Google Scholar]
- Yu, H.; Gibson, K.E.; Wright, K.G.; Neal, J.A.; Sirsat, S.A. Food safety and food quality perceptions of farmers’ market consumers in the United States. Food Control 2017, 79, 266–271. [Google Scholar] [CrossRef] [Green Version]
Figure 1.
Research model.

Figure 2.
Research procedure.

Figure 3.
Variables examined in this research.

Figure 4.
Regression analysis results (*: p < 0.05, **: p < 0.01, n. s.: insignificant at the level of 0.05).
Figure 4.
Regression analysis results (*: p < 0.05, **: p < 0.01, n. s.: insignificant at the level of 0.05).

Table 1.
Previous studies on online products.
| Study | Research Content | Variables | Methodology |
|---|---|---|---|
| [29] | Customers’ food order intentions via internet or phone | Service quality, product quality, product freshness, time savings, behavioral intentions | Survey, ANOVA |
| [30] | The impact of perceived risk on online shopping | Fraud risk, delivery risk, financial risk, process and time loss risk, product risk, privacy risk, information risk | Survey, SPSS |
| [31] | Factors determining customer satisfaction with online shopping | Information, search, ordering facilities, after ordering facilities, website aesthetic and attractiveness, delivery and customer support activities, price, quality | Survey, SPSS |
| [32] | Factors affecting customers buying products online | Reputation, website design, fulfillment, reliability, customer service, security, privacy, emotion, perceived risk, purchase intention | Survey, EMS |
| [33] | Factors affecting customers’ online shopping satisfaction | Consumer satisfaction, website design, security, information quality, payment method, e-service quality, product quality, product variety, delivery service, customer satisfaction | Survey, ANOVA, Regression |
Table 2.
Previous studies on online reviews.
| Literature | Research Content | Data Sources | Methodology |
|---|---|---|---|
| [35] | Online reviews are related to product sales | Historical sales and online review data | The Bass/Norton model and sentiment analysis |
| [34] | Provide consumers with the best products online | Online consumer reviews | Sentiment mining |
| [36] | The relationship between word-of-mouth (WOM) and online reviews | Online customer reviews | Natural language processing (NLP) |
| [33] | Impact of online reviews on travel products | Online reviews for hotels | Latent Dirichlet Analysis |
Table 3.
Previous studies on predicting product sales.
| Study | Research Content | Variables | Methodology |
|---|---|---|---|
| [39] | Online reviews (e.g., valence and volume), online promotional strategies (e.g., free delivery and discounts) and sentiments from user reviews can help predict product sales. | Discount value, discount rate, free delivery, online reviews, discount rate, | Artificial neural network |
| [40] | The goal of this paper is to develop models for predicting the helpfulness of reviews, providing a tool that finds the most helpful reviews of a given product. | Product type, retail price, sales rank, review rating | Artificial neural network, Regression |
| [41] | Social media communication structure and predicting the product sales volume based on the literature review of the existing media theory. | Conveyance, convergence | Artificial neural network, Regression |
| [42] | This study aims to examine the roles of online reviews and reviewer characteristics in predicting product sales. | Votes of reviewer and picture of reviewer | Sentiment analysis, Artificial neural network |
Table 4.
Topic list of organic products online.
| Order | Positive Topics | Negative Topics | ||||
|---|---|---|---|---|---|---|
| Packaging Design | Nutritional Information | Food Quality | Delivery Risk | Freshness | Source Risk | |
| 1 | Great | Quality | Quality | Time | Organic | Evaluation |
| 2 | Golden | Products | Beautiful | Too slow | Garbage | Customer Service |
| 3 | Color | Nutrition | Perfect | Hour | Almost | Online Shopping |
| 4 | Picture | Health | Great | Yuan tong | Pesticide | Attitude |
| 5 | Very good | First-rate | Loyal | Consumption | Diarrhea | Regular customer |
| 6 | Appearance | Product quality | Fans | Postage | Bad smell | Psychology |
| 7 | Bag | Good | Fresh | Nonsense | Hospital | Merchants |
| 8 | Gift | Type | Crisp | Late | Epidermis | Cautious |
Table 5.
Convergent validity for the proposed model.
| Constructs | Items | Factor Loadings | AVE | Construct Reliability | Cronbach’s α |
|---|---|---|---|---|---|
| Packaging Design | PD1 | 0.804 | 0.665 | 0.888 | 0.891 |
| PD2 | 0.883 | ||||
| PD3 | 0.837 | ||||
| PD4 | 0.730 | ||||
| Nutritional Information | NI1 | 0.703 | 0.562 | 0.836 | 0.805 |
| NI2 | 0.817 | ||||
| NI3 | 0.808 | ||||
| NI4 | 0.657 | ||||
| Food Quality | FQ1 | 0.877 | 0.759 | 0.904 | 0.925 |
| FQ2 | 0.876 | ||||
| FQ3 | 0.860 | ||||
| Delivery Risk | DR1 | 0.862 | 0.701 | 0.875 | 0.843 |
| DR2 | 0.868 | ||||
| DR3 | 0.778 | ||||
| Freshness | FN1 | 0.842 | 0.729 | 0.890 | 0.870 |
| FN2 | 0.854 | ||||
| FN3 | 0.866 | ||||
| Source Risk | SR1 | 0.764 | 0.734 | 0.917 | 0.904 |
| SR2 | 0.885 | ||||
| SR3 | 0.880 | ||||
| SR4 | 0.891 | ||||
| Satisfaction | SF1 | 0.770 | 0.642 | 0.843 | 0.901 |
| SF2 | 0.821 | ||||
| SF3 | 0.811 |
Table 6.
The regression for user satisfaction.
| Index | β | t-value | Sig. |
|---|---|---|---|
| Packaging Design | 0.245 | 5.682 | 0.000 |
| Nutritional Information | 0.240 | 5.697 | 0.000 |
| Food Quality | 0.199 | 4.715 | 0.000 |
| Delivery Risk | −0.104 | −2.612 | 0.009 |
| Freshness | −0.107 | −2.668 | 0.008 |
| Source Risk | −0.137 | −3.479 | 0.001 |
Table 7.
The regression for sales volume.
| Index | β | t | Sig. |
|---|---|---|---|
| Product Fans | 0.069 | 14.174 | 0.000 |
| Price | 0.000 | −0.197 | n. s. |
| Price Discounts | 32.270 | 2.868 | 0.004 |
| Free Delivery | −0.001 | −0.041 | n. s. |
| Organic Label | 4.768 | 0.380 | n. s. |
| Number of Customer Reviews | 0.110 | 36.283 | 0.000 |
Table 8.
The result of artificial neural network.
| Index | RMSE | Loss |
|---|---|---|
| 6 variables | 0.5065 | 0.6085 |
| 5 variables | 0.7032 | 0.7826 |
| 4 variables | 0.4936 | 0.5079 |
| 3 variables | 0.2580 | 0.2651 |
| 2 variables | 0.4346 | 0.3725 |
| 1 variable | 0.6148 | 0.7720 |
© 2020 by the authors. Licensee MDPI, Basel, Switzerland. This article is an open access article distributed under the terms and conditions of the Creative Commons Attribution (CC BY) license (http://creativecommons.org/licenses/by/4.0/).
Share and Cite
MDPI and ACS Style
Lyu, F.; Choi, J. The Forecasting Sales Volume and Satisfaction of Organic Products through Text Mining on Web Customer Reviews. Sustainability 2020, 12, 4383. https://doi.org/10.3390/su12114383
AMA Style
Lyu F, Choi J. The Forecasting Sales Volume and Satisfaction of Organic Products through Text Mining on Web Customer Reviews. Sustainability. 2020; 12(11):4383. https://doi.org/10.3390/su12114383
Chicago/Turabian StyleLyu, Fang, and Jaewon Choi. 2020. "The Forecasting Sales Volume and Satisfaction of Organic Products through Text Mining on Web Customer Reviews" Sustainability 12, no. 11: 4383. https://doi.org/10.3390/su12114383
Note that from the first issue of 2016, this journal uses article numbers instead of page numbers. See further details here.