SDG-Based Sustainability Assessment Methodology for Innovations in the Field of Urban Surfaces


1
Institute for Acoustics and Building Physics, Department Life Cycle Engineering, University of Stuttgart, 70563 Stuttgart, Germany
2
Department Life Cycle Engineering, Fraunhofer Institute for Building Physics IBP, 70563 Stuttgart, Germany
*
Author to whom correspondence should be addressed.
Sustainability 2020, 12(11), 4466; https://doi.org/10.3390/su12114466
Submission received: 26 March 2020
/
Revised: 8 May 2020
/
Accepted: 22 May 2020
/
Published: 1 June 2020
(This article belongs to the Special Issue Sustainable Built Environment and Future Proof Innovations)
Abstract
:The sustainability of urban surfaces can be enhanced by introducing innovations. An ex-ante assessment of the potential sustainability impacts of innovations in urban areas can provide decision-makers with valuable recommendations for their selection before implementation. This knowledge helps to make the innovation more future-proof. Although a first methodological approach for such an assessment is available, there is no readily applicable set of indicators. Hence, this article proposes a holistic sustainability impact assessment method tailored to the management of urban surfaces and their innovations. For the development of the method, a Sustainable Development Goal (SDG)-based, top-down approach is adopted. The proposed assessment method makes it possible to identify an innovation’s potential contribution to the achievement of the SDGs before its introduction. In this article, the assessment method is tested by evaluating the sustainability impacts of weed-suppressing joint filling sand on a walkway in a municipal cemetery in Southern Germany. The case study shows that a mixed impact of the innovation in the three dimensions of sustainability could be expected within the system boundary. It highlights the need for innovation optimization, mainly in the economic dimension. As a result, the introduced method can support the innovation process of urban surfaces for sustainable municipal development.
1. Introduction
Cities and urban areas around the globe are under increasing pressure to mitigate the effects of global warming. Stakeholders are forced to take urgent measures to cope with the impacts of climate change. Cities and communities have recorded increased intensity of heavy rains and floods, storms, periods of heat, droughts, and fire incidents. As a result, these have caused loss of lives, damage to infrastructure and economies, and need to be addressed immediately by building resilient cities. Resilience can be addressed through the surfaces of urban areas that are most stressed by these impacts and can present as starting points for action. Based on the work done by Leistner et al. [1], the term urban surfaces was specified as “[…] surfaces that interact in public outdoor spaces within an urban context” [2] (p. 4). Some examples for urban surfaces include vertical surfaces such as building facades and horizontal surfaces such as roads, pavements, and squares. Especially when existing surfaces are not able to deal with the consequences due to their properties, new and adapted solutions must be developed and implemented. According to Leistner et al. [1], innovations in the field of urban surfaces refer to either materials, machines, technologies, or management processes. Those innovations have to improve their ability to resist stress factors, to increase the resilience of urban surfaces and linked systems, and to decrease their environmental impacts at the same time.
However, climate impact adaptation measures cannot be viewed in isolation from other effects. Transformation processes must be geared to the Sustainable Development Goals (SDGs) of the United Nations. In 2015, the member states of the United Nations committed to the realization of the Agenda 2030, with the 17 SDGs and 169 targets at its core [3,4]. The SDGs address all three sustainability dimensions [3] and aim “[…] to end poverty, protect the planet and ensure that all people enjoy peace and prosperity by 2030” [3]. Cities and communities are crucial for the success of sustainable development. Hence decisions such as the selection of product innovations must also be based on the SDGs. Innovations in the field of urban surfaces have the potential to contribute to several SDGs throughout their life cycle. By using methods of Life Cycle Assessment (LCA), product-related sustainability impacts can be quantified in the environmental dimension. Integrating the SDGs in the sustainability assessment allows for a holistic assessment in all three dimensions of sustainability. So far, there is neither an impact assessment method that is tailored to the case of urban surface innovations nor a method that can directly be applied to this research area. Therefore, this paper describes a methodical approach that aims to quantify the impact of innovations in the field of urban surfaces across all three dimensions of sustainability and on the SDGs. The quantification of sustainability impacts complements the basis for decisions at the municipal level, which usually are characterized by cost-benefit analyses. The integration of SDGs makes decisions more future proof, as they address main issues that are relevant to sustainable development.
2. State-of-the-Art
LCA is the “compilation and evaluation of the inputs, outputs and the potential environmental impacts of a product system throughout its life cycle” [5], with its general methodological framework being standardized in ISO 14040 [6]. The application of the Life Cycle Sustainability Analysis (LCSA) Framework allows the assessment of potential impacts in all three dimensions of sustainability, thus extending the scope of the classic LCA [6]. However, the LCSA Framework firstly has to be operationalized [6]. This includes the selection of suitable disciplinary models [6]. For a Life Cycle Sustainability Analysis on product level, there are various models and methods such as process-LCA, LCC (Life Cycle Costing), and SLCA (Social Life Cycle Assessment) [6]. However, particularly in the social dimension, there is no agreement on how to measure the impact and which indicators to use [7]. This brings the selection of suitable indicators for a holistic sustainability assessment into focus.
A study points out: “An indicator set chosen for technology sustainability assessment is gaining increasing relevance and reliability if related directly to SDGs” [8] (p. 59). Wulf et al. [8] have reviewed the use of SDGs by the LCA community. They have shown that the development of SDG-based approaches is still at an early stage [8]. There are some existing methods that combine the LCSA framework with indicators derived from the SDGs, such as [9,10,11,12,13,14]. Yet they are usually very specific to a certain field of application such as energy projects [9], building materials [11], municipal solid waste management [12], innovations in developing countries [13], only focus on individual SDGs [10] or on positive impacts [14]. To the knowledge of the authors, there is no SDG-based LCSA method that is able to evaluate innovations in the context of urban surfaces, despite their herein highlighted relevance for sustainable urban development.
An extensive review of existing LCSA methods has been carried out by Wulf et al. [15], as they point out there is still no agreement on the selection of SDG based indicators and the connection towards the LCSA framework [8,15].
Maier et al. [13] and Wang et al. [12] have shown that the international SDGs can be used to develop holistic sustainability assessment methods on a product and city level [2]. Looking at the approach by Maier et al. [13] to develop an SDG-based indicator set by assigning the SDGs to several impact category groups before allocating impact categories to those groups and identifying suitable indicators for those categories, a study found, e.g., that “[…] no full example for an application of all impact categories is given […]” [8] (p. 60). Wulf et al. [8] in turn have investigated the selection of LCA, S-LCA, and LCC indicators on both SDG goal and indicator tier for a product. They found that alone, the set of indicators based on the SDG goals covers the three dimensions of sustainability [8]. However, they point out that viewing the SDG indicators for a given case can help to improve the understanding of the SDGs and direct the selection process of suitable indicators [8].
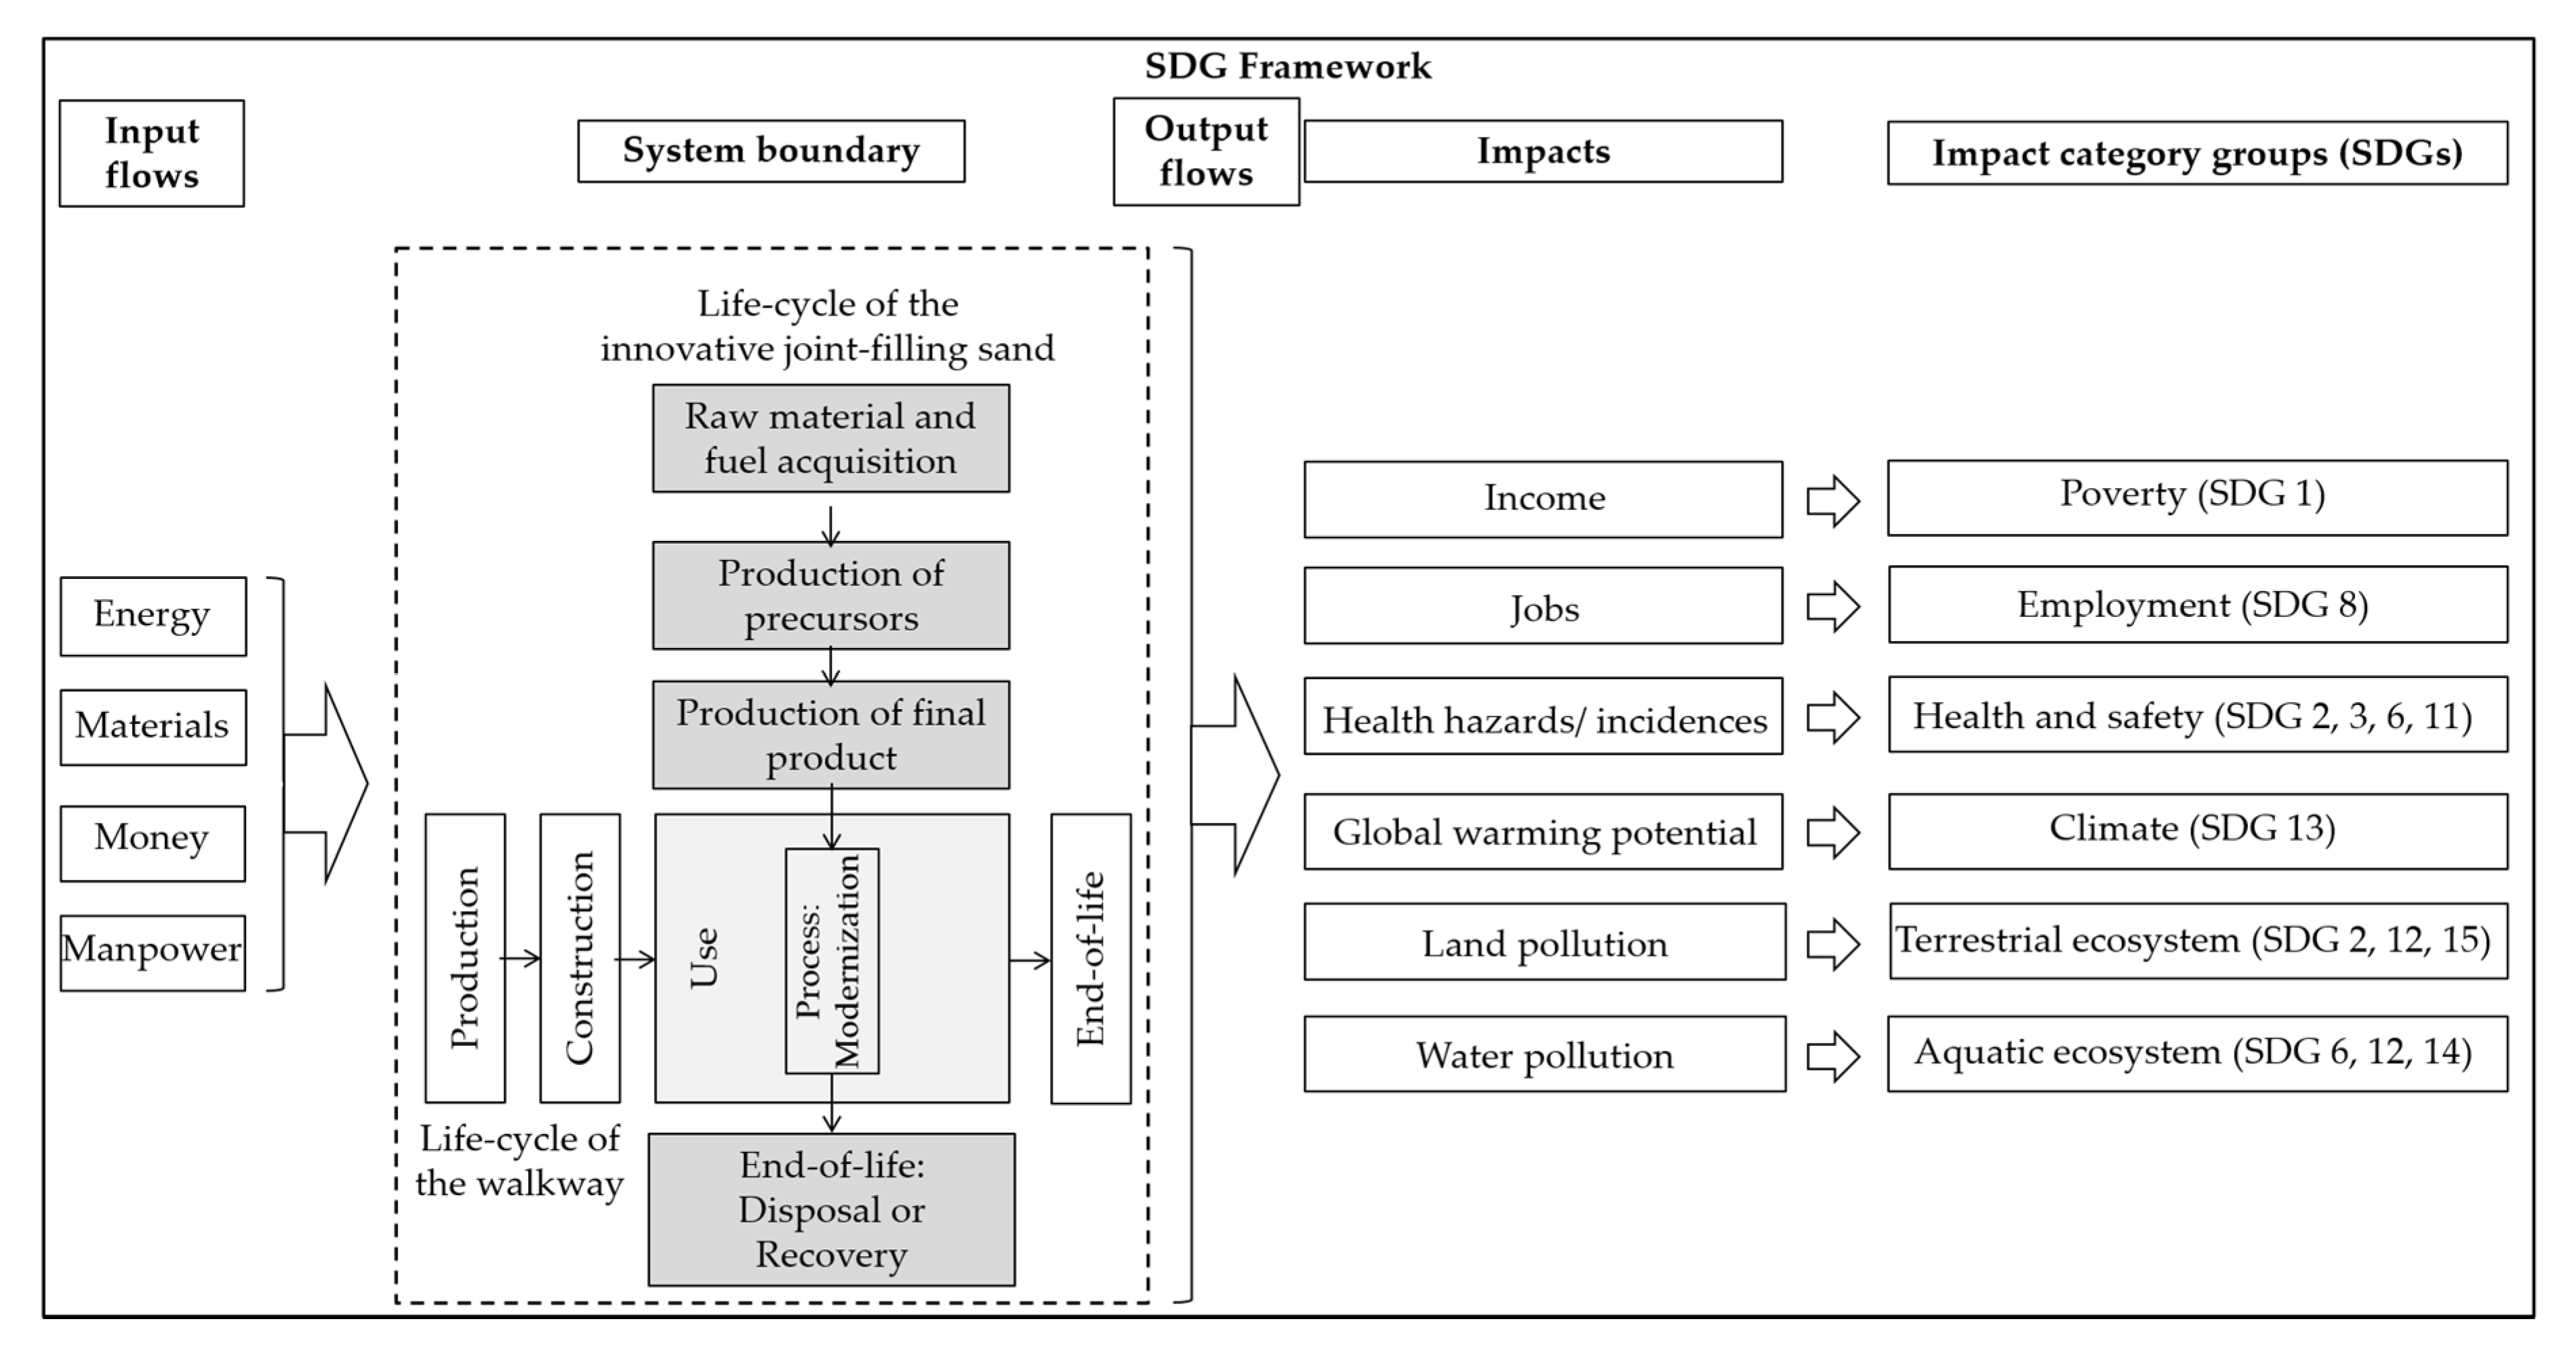
This speaks for the suitability of an SDG-centered sustainability assessment of urban surfaces, a building component of municipalities which has gained research interest [1,2]. Henzler et al. [2] propose a first methodological framework for the holistic sustainability assessment of innovations in the field of urban surfaces. This is based on the proven methodologies by Maier et al. [13] and Wang et al. [12], focusing on the general LCSA-operationalizing framework and phases of analysis [2]. Their approach adapts the SDG-based indicator sets by Wang et al. [12] and Maier et al. [13] to the case of urban surfaces [2]. Maier et al. [13] have presented one of the first methods linking SDGs with LCSA on a product level. This framework was then further developed by Wang et al. [12] and related to a larger urban context in the field of waste management. This makes their indicators in particular useful, as the new method is also being developed for the urban context. However, the focus of the indicators and SDGs in Maier et al. [13] was on innovations in development cooperation projects and in Wang et al. [12] on municipal solid waste management innovations. For this reason, their indicators and impact categories cannot directly be applied to urban surfaces and need to be adapted. This is the case in particular for the assessment of impacts in the social and economic dimension. For their framework, Henzler et al. [2] have proposed a general life cycle of urban surfaces and presented a scheme to consider the interaction between the life cycles of an urban surface and the products/product innovations that are used in the management phase of an urban surface. The practitioner should adapt this interactive life cycle scheme to obtain two scenarios representing the urban surface under question with its management processes and the conventional product (baseline scenario) and the innovation (comparison scenario), respectively [2,12]. Determining the delta between the two scenarios then shows the potential sustainability impact of the innovation [2]. Figure 1 shows how their general framework can be adapted to various urban surfaces and products/product innovations. It illustrates the interacting life cycle scheme for the comparison scenario, i.e., the life cycle of the urban surface with the life cycle of the innovative product that is used in its use phase.
However, while Henzler et al. [2] indicate theoretically how the interacting life cycle scheme and the SDGs are to be integrated into the sustainability assessment system, the impact assessment method is not yet developed, and its applicability has to be demonstrated. Accordingly, Henzler et al. [2] have pointed out that there is still a need for a complete indicator set that is tailored to the assessment of innovations for urban surfaces. The indicators and impact categories in the methods by Maier et al. [13] and Wang et al. [12] can be adapted to urban surfaces to close this gap. Hence, based on the framework of Henzler et al. [2], the focus of this article is on the development and description of the impact assessment method for the holistic sustainability assessment of innovations concerning different types of urban surfaces. Special attention is given to the selection of the impact category groups and suitable indicators. The developed method is then applied to a case study to test its applicability. As the focus of this publication is on the method development, the case study is not described in great detail.
3. Methodological Approach for the Impact Assessment
This section presents the development and description of an impact assessment method for innovations in the field of urban surfaces, which includes, among others, the analysis of the relevance of SDG targets and sub-targets for urban surfaces and their innovations, as well as the evaluation and selection of existing impact category groups, impact categories, and indicators for the sustainability assessment of such innovations. The newly introduced method is based on the methods by Wang et al. [12] and Maier et al. [13], adapting them to the assessment of urban surfaces and innovations in this field for decision-support of municipalities.
3.1. Development of the Impact Assessment Method
The modeling stage of the LCSA Framework comprises the Life Cycle Inventory (LCI) analysis as well as the Life Cycle Impact Assessment (LCIA) [6]. The LCSA Framework adds various expansion dimensions with regard to the indicators, level of assessment, and relevant connections to the LCA [6,12,17]. In the herein presented approach, the dimension of broadening of the LCSA Framework was mainly realized with regard to the indicators: The proposed indicator set covers all three dimensions of sustainability to allow for a holistic sustainability assessment.
To guide the development process, requirements for the indicator set were first established: (1) The set of indicators should, as has been done by Wang et al. [12], allow a qualitative statement on the potential contribution of an innovation to the achievement of the SDGs based on the evaluation results, (2) it should allow for a holistic ex-ante sustainability assessment, followed by a qualitative statement on the potential contribution of the innovation to the sustainability of the city, and (3) it should make it possible to identify a possible shift of potential sustainability impacts between the life cycle of an urban surface and the life cycle of a product/product innovation in this field.
For the development of the impact assessment methodology, the indicator-based, top-down approach by Wang et al. [12] is adopted and adapted to innovations in the field of urban surfaces. The adaption of the indicator system by Wang et al. [12] is guided by two research questions, to ensure that the methodology allows for an assessment of relevant potential impacts: (1) Which SDGs are relevant to municipalities? (2) Which SDGs are important for urban surfaces and innovations (product level)?
One challenge in the methodology development is that there are several assignment options of the SDGs to impact category groups, as the summary of the SDGs to impact category groups in Wang et al. [12] and Maier et al. [13] differs in part. This is backed up by the finding of Assman et al. [18] that some of the targets of the SDGs have to be broken down thematically into sub-targets to evaluate if they are relevant to municipalities (see research question (1).
Hence, with the two research questions in mind, one is to ensure that the targets and sub-targets of the SDGs relevant to municipalities, urban surfaces, and innovations in this field are taken into account and covered thematically when merging the SDGs to impact category groups and selecting suitable impact categories and indicators. Hence, the development process is structured as follows:
- SDG analysis;
- assignment of SDGs to impact category groups; and
- selection of impact categories and indicators for impact category groups.
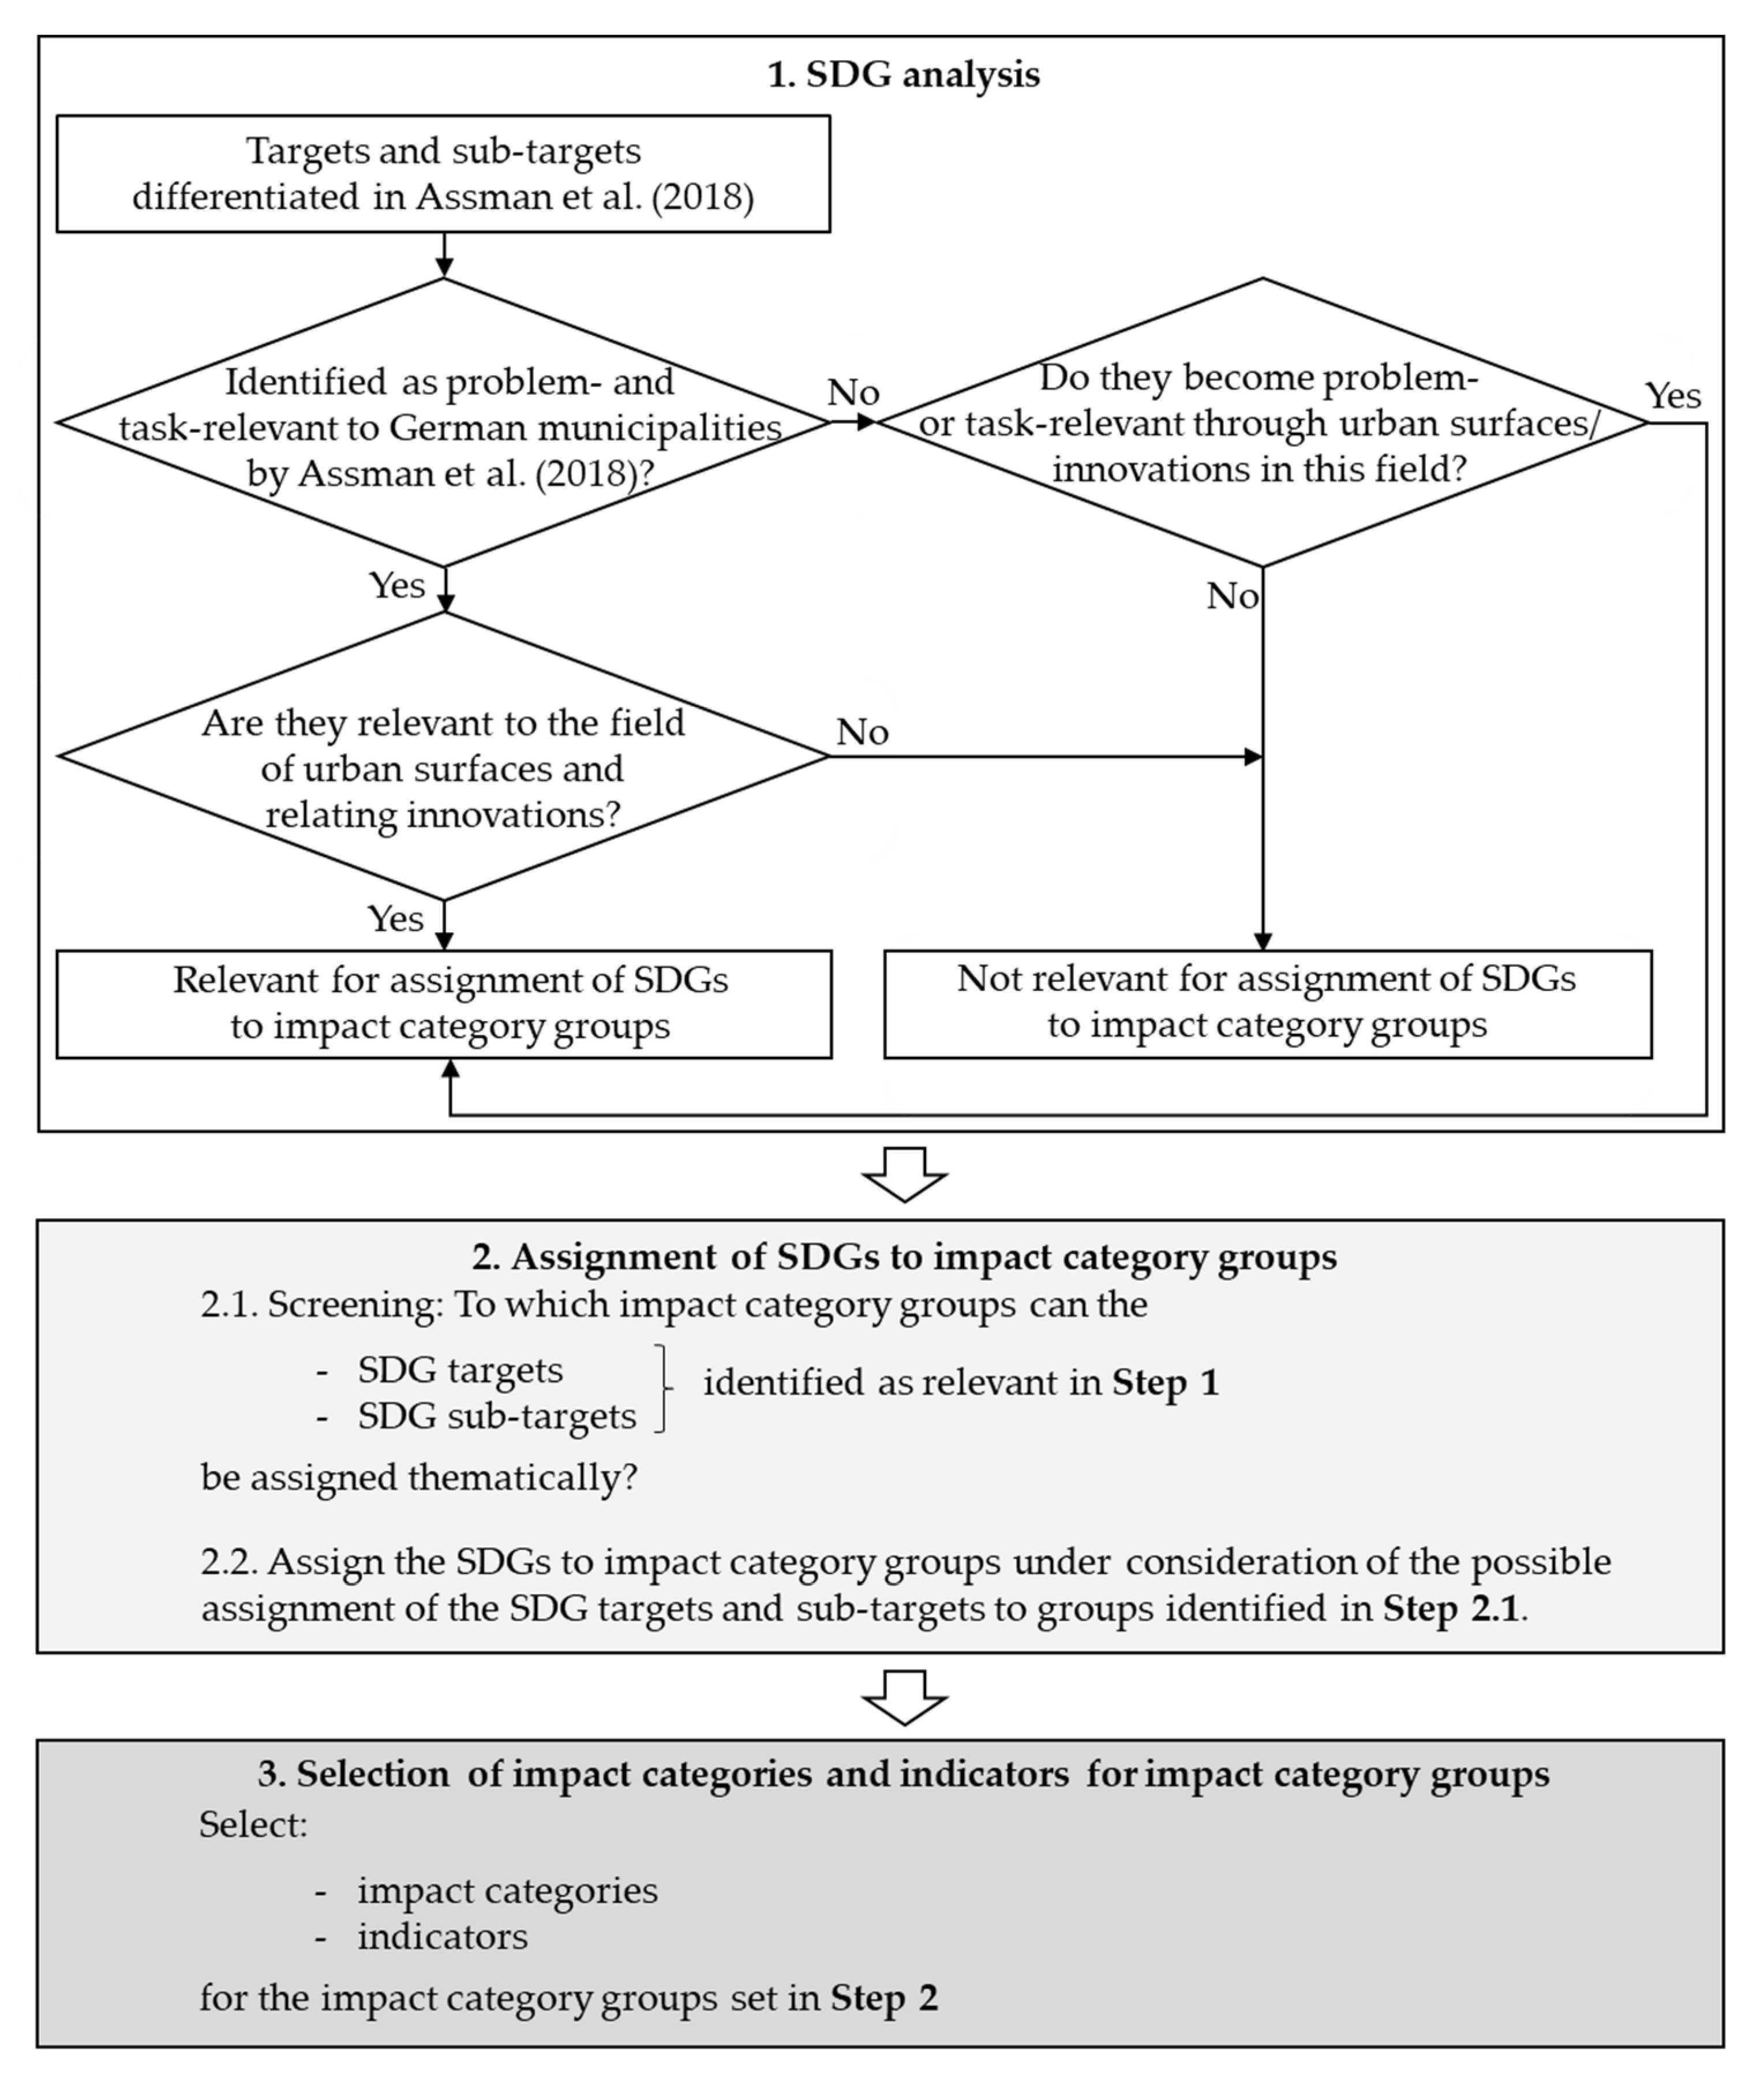
The first step of the development process is the analysis of the SDGs. In the second step, the SDGs are to be assigned to impact category groups. The final step is the selection of meaningful impact categories and indicators for the impact category groups. This procedure is shown in Figure 2.
3.1.1. SDG analysis
The procedure for identifying relevant targets and sub-targets that are to be considered in the assignment process of the SDGs to impact category groups is illustrated in a simplified manner in Figure 2, step 1.
As a first step of the method development, it was checked which of the targets and sub-targets of the SDGs identified in principal as problem- and task-relevant to German municipalities by Assman et al. [18] were relevant to the field of urban surfaces and relating innovations (i.e., the life cycle of urban surfaces and, e.g., the machines used for their management, respectively). When screening those targets and sub-targets relevant to municipalities as part of the SDG analysis, it was apparent that some of them were not relevant to the field of urban surfaces, e.g., target 4.2 (early childhood education). As part of step 1, it was then analyzed what additional targets and sub-targets of the SDGs in the relevance checklist [19] become problem- or task-relevant through urban surfaces and innovations in this field. Two of the criteria for evaluating the relevance were (1) whether the field of urban surfaces has potential impacts in the SDG subject area, and (2) whether it is possible to contribute/harm the achievement of a (sub)target through impacts in the field of urban surfaces, e.g., with suitable innovations. In this step, it was found that some of the targets and sub-targets have not been classified as problem- or task-relevant by Assman et al. [18], while innovations in the field of urban surfaces could create further issues regarding those objectives or open up new global areas of action for a municipality, e.g., for target 14.3 (acidification of the oceans) and sub-target 8.2.2 (precarious employment). Consequently, for the new approach, those targets and sub-targets are also classified as problem- and task-relevant. In doing so, here are taken into account the given and newly opened up municipal areas of actions regarding the SDGs and their relevant targets and sub-targets through the field of urban surfaces and related innovations. The targets/sub-targets identified here as significant can be seen in Table A1 (Appendix A).
3.1.2. Assignment of SDGs to Impact Category Groups
First, in step 2.1, it was screened to which impact categories in Wang et al. [12] and potential new impact category groups the SDG targets and sub-targets, identified as relevant in step 1, can be assigned thematically. The possible allocation can be seen in Table A1 in Appendix A. Then, in step 2.2, taking into account the possible assignment of the SDG targets and sub-targets to groups identified in step 2.1, the SDGs were assigned to impact categories of Wang et al. [12], those were then adopted as impact category groups, adapted, and supplemented by missing groups. With this thematic summary of the SDGs, direct connections are taken into account, as in Wang et al. [12] and Maier et al. [13].
Table 1 gives an overview of the eleven impact category groups that are used here. Changes made to the impact category groups adapted from Wang et al. [12] concern the addition of the term safety to the group health. Target 11.7 calls, for example, for ensuring general access to safe public spaces [20]. Due to the open formulation of the target, this is understood to mean surfaces that can be safely used in the sense of accident-free walkability and so on. Furthermore, the new impact category group municipal life cycle costs is added. This makes it possible to assess the potential economic impacts of an innovation from another perspective than in the impact category group poverty; namely, from the point of view of the municipality and the guarantee of its functional capability. Biodiversity loss, directly addressed in SDG 15, is a highly relevant issue in the field of urban surfaces. There are several approaches for assessing the state of biodiversity, which have been reviewed by for example Maier et al. [21]: The Sustainable Development Solutions Network (SDSN) [22] suggests, e.g., the indicators Red List Index and Living Planet Index, however, in ReCiPe, biodiversity loss is included as an endpoint-indicator [23]. However, due to its complexity, in this approach, biodiversity loss is only indirectly taken into consideration through indicators in the environmental dimension. As in Wang et al. [12], SDG 17 is not assigned to a specific group, as it is an instrument for realizing the other SDGs.
3.1.3. Selection of Impact Categories and Indicators
Analogous to the structure of the indicator set of Maier et al. [13], the impact category groups are composed of thematically refining impact categories and assigned to the three dimensions of sustainability. Complementing the definition of impact category in ISO 14040, where it is defined as a “class representing environmental issues of concern to which life cycle inventory analysis results may be assigned” [5] (p. 13), here, impact categories also represent social and economic problem areas. An indicator in turn is a “quantifiable representation of an impact category” [5] (p. 13). Accordingly, indicator results need to be determined for the impact categories to gain insight into the environmental impact of the system in question [5], as well as its social and economic repercussions. The SDG-based indicators in the three dimensions of sustainability by Wang et al. [12], based on Maier et al. [13], are in principal promising. In the environmental dimension, Wang et al. [12] use impact categories, such as resource use and climate change, that are also applied by the European Union in the method of the Environmental Footprint (EF) [24]. The indicators under the economic and social dimension in the method by Wang et al. [12] make various potential sustainability impacts measurable. Hence, in step 3, indicators and impact categories are selected for the impact category groups from the approach of Wang et al. [12], adapted and supplemented with further ones from several publications, e.g., [8,13,25,26]. For this purpose the following approach was applied: First, for each impact category group, and thus the here significant (sub-)targets of the SDGs, a) their relationship to the object of investigation and b) potential sustainability impacts in the life cycle of the urban surface and the products/ product innovations under investigation were researched; then suitable indicators that make it possible to assess those impacts in the context of the SDGs were identified and selected. As in the approaches by Wang et al. [12] and Maier et al. [13], this procedure makes it possible to evaluate the sustainability impacts of innovations holistically and to assess innovations’ potential impacts on the realization of the SDGs. Table 1 gives an overview of the impact category groups and the impact categories of the herein proposed indicator set. The full indicator set is summarized in Table A2 in Appendix B.
3.2. Description of the Impact Category Groups
In the following, the results are presented according to relevant sustainability impacts in the field of urban surfaces, selected indicators, the SDGs, and the thematic relevance of the group for sustainable development are elucidated.
3.2.1. Environmental Dimension
(1) Climate:
Climate change is the focus of SDG 13; however, it is related to other SDGs [13]. Greenhouse gas (GHG) emissions are emitted in different sectors and processes that are linked to urban surfaces. For example, when generating energy by burning fossil fuels, mainly the greenhouse gas CO2 is emitted [28]. Therefore, the amount of greenhouse gas emissions emitted by the management of urban surfaces depends on, among other things, the energy source. In addition, industrial processes, e.g., the production of goods such as steel and cement, are not only a source of air pollutants but also greenhouse gas emissions [28]. However, the design and management of urban surfaces also open up opportunities to reduce municipal GHG-emissions. For example, innovative urban surfaces, such as green facades, can help to protect the climate by binding CO2 [1]. As in the method by Wang et al. [12], the global warming potential is assessed for this impact category group.
(2) Terrestrial ecosystem:
Terrestrial ecosystems are thematized in SDGs 2, 12, and 15 [13]. There are links to other SDGs such as SDG 13 (climate action), SDG 11 (sustainable cities and communities) [29], and SDG 9 (industry, innovation, and infrastructure). Sound ecosystems provide safe drinking water and help protect the climate by functioning as carbon sinks [29]. The provision of urban surfaces intervenes in those ecosystems and impacts on their quality. Similarly to ReCiPE 2008 [30], two types of land use are to be considered in the field of urban surfaces: a) Direct through the urban surface, and b) indirect, e.g., through factories for the manufacturing of the surface materials or machines. The emission of toxic substances poses a threat to intact ecosystems, for example, soils can be contaminated with heavy metals through emissions from industrial areas and the use of chemical fertilizers and pesticides [31,32,33]. Accordingly, innovating the management process of fertilizing (process innovation) could help to reduce the negative impacts of the maintenance of green urban surfaces on soils. Furthermore, an increase in urban green spaces, the reduction of the sealing intensity of urban surfaces such as streets or walkaways, and the plantation of native and mixed vegetation positively influence biodiversity in an urban environment and are examples of biodiversity friendly management of urban surfaces [21].
The indicators terrestrial acidification potential and terrestrial ecotoxicity potential used in the approach by Wang et al. [12] are adopted. Besides, for the impact category land use, the model Soil Quality Index, based on the LANCA Model [34], is chosen, which is in line with its recommended use for the Environmental Footprint Framework in Sala et al. [24].
(3) Aquatic ecosystem:
This group is dealt with in the targets and sub-targets of SDGs 6, 12, and 14, and is thematically linked to SDGs 9 and 11. “Access to clean water and therefore healthy aquatic ecosystems are not only of environmental concern but also essential for human health and survival […]” [13] (p. 10). Additionally, manufacturing industries, among other economic sectors, rely on the availability of water [13]. In the field of urban surfaces, various materials and machines are used that can impact on the availability of the water resource and its quality. Water is withdrawn, e.g., for concrete production [35], and directly used during the management of municipal surfaces, e.g., in cleaning processes and when watering green spaces. Besides, hedge trimmers and leaf blowers with lithium-ion batteries are alternatives to conventional gasoline-powered versions. However, Mahmud et al. [36] have found that lithium-ion batteries have, e.g., a considerable marine aquatic ecotoxicity potential over their life cycle. For this impact category group, the indicators quantity of water depletion, eutrophication potential, and freshwater and aquatic ecotoxicity potential used in the methods by Wang et al. [12] and Maier et al. [13] are adopted.
(4) Abiotic resource depletion:
This impact category group is addressed by targets and sub-targets of SDG 7 (affordable and clean energy), SDG 8 (decent work and economic growth), SDG 12 (responsible consumption and production), and partially SDG 9 (industry, innovation and infrastructure), and is linked to SDG 11 (sustainable cities and communities). A more efficient resource usage as well as more sustainable production processes and use of products are indispensable to allow for economic growth and thus affluence in future [37]. Besides, “More efficient resource use can help to reduce environmental pollution […]” [38]. The life cycle of urban surfaces requires a broad variety of raw and operating materials, depending, e.g., on the type of surface and machines used. Consequently, different resources are consumed in the field of urban surfaces, such as fossil fuels and minerals. A thoughtful design of products that are, e.g., recyclable and durable, is one of many possible approaches to limit the resource use [38], besides, the consumption of resources for the provision of urban surfaces can be reduced through resource-efficient management processes. Similarly to Maier et al. [13], the consumption of water and land is considered in the impact category groups aquatic and terrestrial ecosystem, respectively. The consumption of mineral resources and fossil fuels is assessed with the indicators Abiotic depletion potential (ADP) elements and ADP fossil, respectively, adopted from Wang et al. [12].
3.2.2. Economic Dimension
(5) Employment:
This impact category group is directly thematized in the targets and sub-targets of SDG 8. “Jobs and employment are not only crucial for the people to be able to afford their basic needs as well as education or health services, but are also an important driver of the country’s economic growth“ [13] (p. 10). Jobs in mechanical engineering, its supplier industry, the production of surface and operating materials, the construction industry, as well as the municipal administration, among others, are linked to the field of urban surfaces. The management of urban surfaces falls, e.g., within the area of responsibility of the municipal building yard [1]. In the field of urban surfaces, one of the municipalities’ sphere of influence is seen, e.g., in the selection of the supplier companies for the machinery and various products employed, as well as external service providers (e.g., criteria fair wage). Besides, municipalities can influence the working conditions, with regard to some aspects, in their own enterprises. Ziegler [39] has found that operational innovations can influence the number of jobs, the required qualification, the working time, the wage level, as well as the working conditions. Innovations in the field of urban surfaces could have similar impacts on the employment, which are linked to the relevant (sub-)targets of SDG 8. Therefore, indicators in the impact categories job creation, job creation: Quality of jobs created, and working conditions are compiled from several publications [8,12,13,26,27].
(6) Poverty:
The topic of poverty is relevant to the field of urban surfaces, as, e.g., an innovation can lead to a reduction of the management intensity of a surface and thus result in a loss of jobs in the municipal building yard or a reduction of the number of working hours of external service providers, which in turn can impact on the income available for employees. However, the number of employees living below the poverty line could be reduced by creating well-paid jobs in the production of the innovation. Besides, municipalities can contribute to poverty alleviation with their public procurement activities, e.g., by choosing fair-trade products [40]. Consequently, the whole picture, but also the change of the working situation of the individual employees in the various life cycle phases of the innovation and urban surface, have to be examined to address poverty. Hence, here, the analysis of poverty is conducted with regard to incomes in the economic dimension, thus partially adopting the approach in Maier et al. [13]. Existing indicators from several indicator sets [12,13,22] are adapted.
(7) Energy supply and efficiency:
Especially the type of energy supply and the energy efficiency are addressed in the targets of SDG 7 (affordable and clean energy) that were identified as relevant to the topic at hand. This topic is linked to SDGs 8 (decent work and economic growth) and 9 (industry, innovation, and infrastructure), and SDG 13 (climate action). This impact category group is relevant to the field of urban surfaces since the management of urban surfaces, as well as the provision of the products and innovations used in its management, consume, in principle, energy. “For a prosperous economy, energy is needed for almost all types of economic activities (jobs, productivity, and development)” [13] (p. 9). This is why the indicators under the impact category group energy supply and efficiency are assessed in this dimension, as in the methods by Wang et al. [12] and Maier et al. [13]. In this group, a higher energy consumption and efficiency are evaluated as positive impacts from an economic perspective [12,13]. Here, the indicators primary energy consumption and change in energy intensity of Maier et al. [13] are adopted.
(8) Municipal life cycle costs:
According to SDG target 16.6, institutions shall be established which are, among other things, effective [20]. The living conditions in a municipality are directly influenced by its financial situation [18]. A lower investment rate, resulting from a high municipal debt, impacts negatively, e.g., on the development of infrastructure [18]. For municipalities, a sustainable material flow management is also beneficial from a financial, social, and economic perspective [41]. Innovations in the field of urban surfaces can potentially contribute to a more sustainable resource management. However, for a sustainable municipal product procurement, it is recommended that, apart from other criteria, not only a product’s acquisition costs but also, if applicable, e.g., related energy and maintenance costs, are to be considered in the decision-making process, i.e., the complete costs [42]. For this impact category group, an indicator of Wang [27] is adapted to the field of urban surfaces using impact categories of Horn et al. [25]. With this indicator, the municipal costs for resources, machines, electricity, other energy, disposal, and labor are to be assessed.
3.2.3. Social Dimension
(9) Health and safety:
“Ensuring healthy lives and promoting the well-being at all ages is essential to sustainable development” [43]. Health and well-being are thematized in SDG 3, and the topic is directly related to SDG 2 (zero hunger) and SDG 6 (clean water and sanitation) [13]. Additionally, the safety of people is addressed in targets of the SDGs 3, 11, and 13. The field of urban surfaces has many connections to those subject areas. Hauke and Neitzner [44] have pointed out several safety and health risks associated with the work in building and operating yards. In addition, particulate matter is produced, e.g., in the production of metal and steel and from emissions of diesel-fueled construction machines, and a high particulate matter level is linked to various health problems such as respiratory diseases [45,46]. Green facades can reduce the pollution load locally, e.g., particulate matter, and thus benefit the environmental quality in cities [1]. In the field of urban surfaces, it is important to evaluate if the innovation would lead to a shift of accidents or other health-related incidences from one life cycle phase to another. The indicators risk of (fatal) accidents and health incidences, particulate matter formation and human toxicity potential of several publications [12,13,26,47] are adopted and adapted.
(10) Egalitarian society:
The achievement of sustainable development requires that no one is left behind, e.g., access to basic services and a better life [48]. In the field of urban surfaces, especially the targets/sub-targets of the SDGs 4, 5, 8, 10, 11, and 16 are relevant, which address, among other things, the inclusion and equality of different groups with respect to income, employment, and education. In the area of urban surfaces, the realization of an egalitarian society is influenced, e.g., by the staffing in municipal facilities and the choice of product suppliers. Examples of relevant disadvantaged groups are women, e.g., due to the existing gender pay gap in many countries, such as Germany [49], and persons with migration background that experience discrimination on the labor market [50]. Target 11.7 calls for giving “[…] universal access to safe, inclusive and accessible, green and public spaces […]” [20] (p. 28) highlighting groups, such as elderly and disabled persons [20]. Hence, here indicators are adapted or derived from several indicator sets [12,13,18,20,26], e.g., for gender equality, equal access to employment and educational offers/ trainings, as well as the general accessibility of urban surfaces.
(11) Education and skill development:
“Education, or the transmission, acquisition, creation and adaptation of information, knowledge, skills and values, is a key lever of sustainable development” [51] (p. 3). In SDG 4, the guarantee of high-quality education and facilitation of life-long learning are addressed. Whilst in the relevant targets and sub-targets of SDG 4 and partly in SDG 8, e.g., technical and vocational education are specifically thematized. In the field of urban surfaces, education is relevant from various perspectives. Education and professional qualification are seen as prerequisites for access to work, whereby it is important that the vocational education meets the requirements of the labor market [52,53]. Additionally, life-long learning and skill development are crucial to maintain employees’ employability [54]. Besides, applying an innovation without the necessary skills, among other things, can result in its failure [55]. Therefore, on job training can be seen as vital for successful implementation of innovative machines for the management of urban surfaces. For innovations in the field of urban surfaces, e.g., façade PV systems, also knowledge sharing on their correct disposal is significant. Education-related indicators are adapted from various indicator sets [12,13,26].
3.2.4. Summary of the Impact Assessment Method
The proposed indicator set with descriptions and assessment methods can be found in Table A2 in Appendix B. Innovations in the field of urban surfaces may be of various kinds. The introduced indicator set is formulated in a general manner to be adaptable for a broad range of innovations and surfaces. The indicator catalog should be adapted before its use to assess relevant changes.
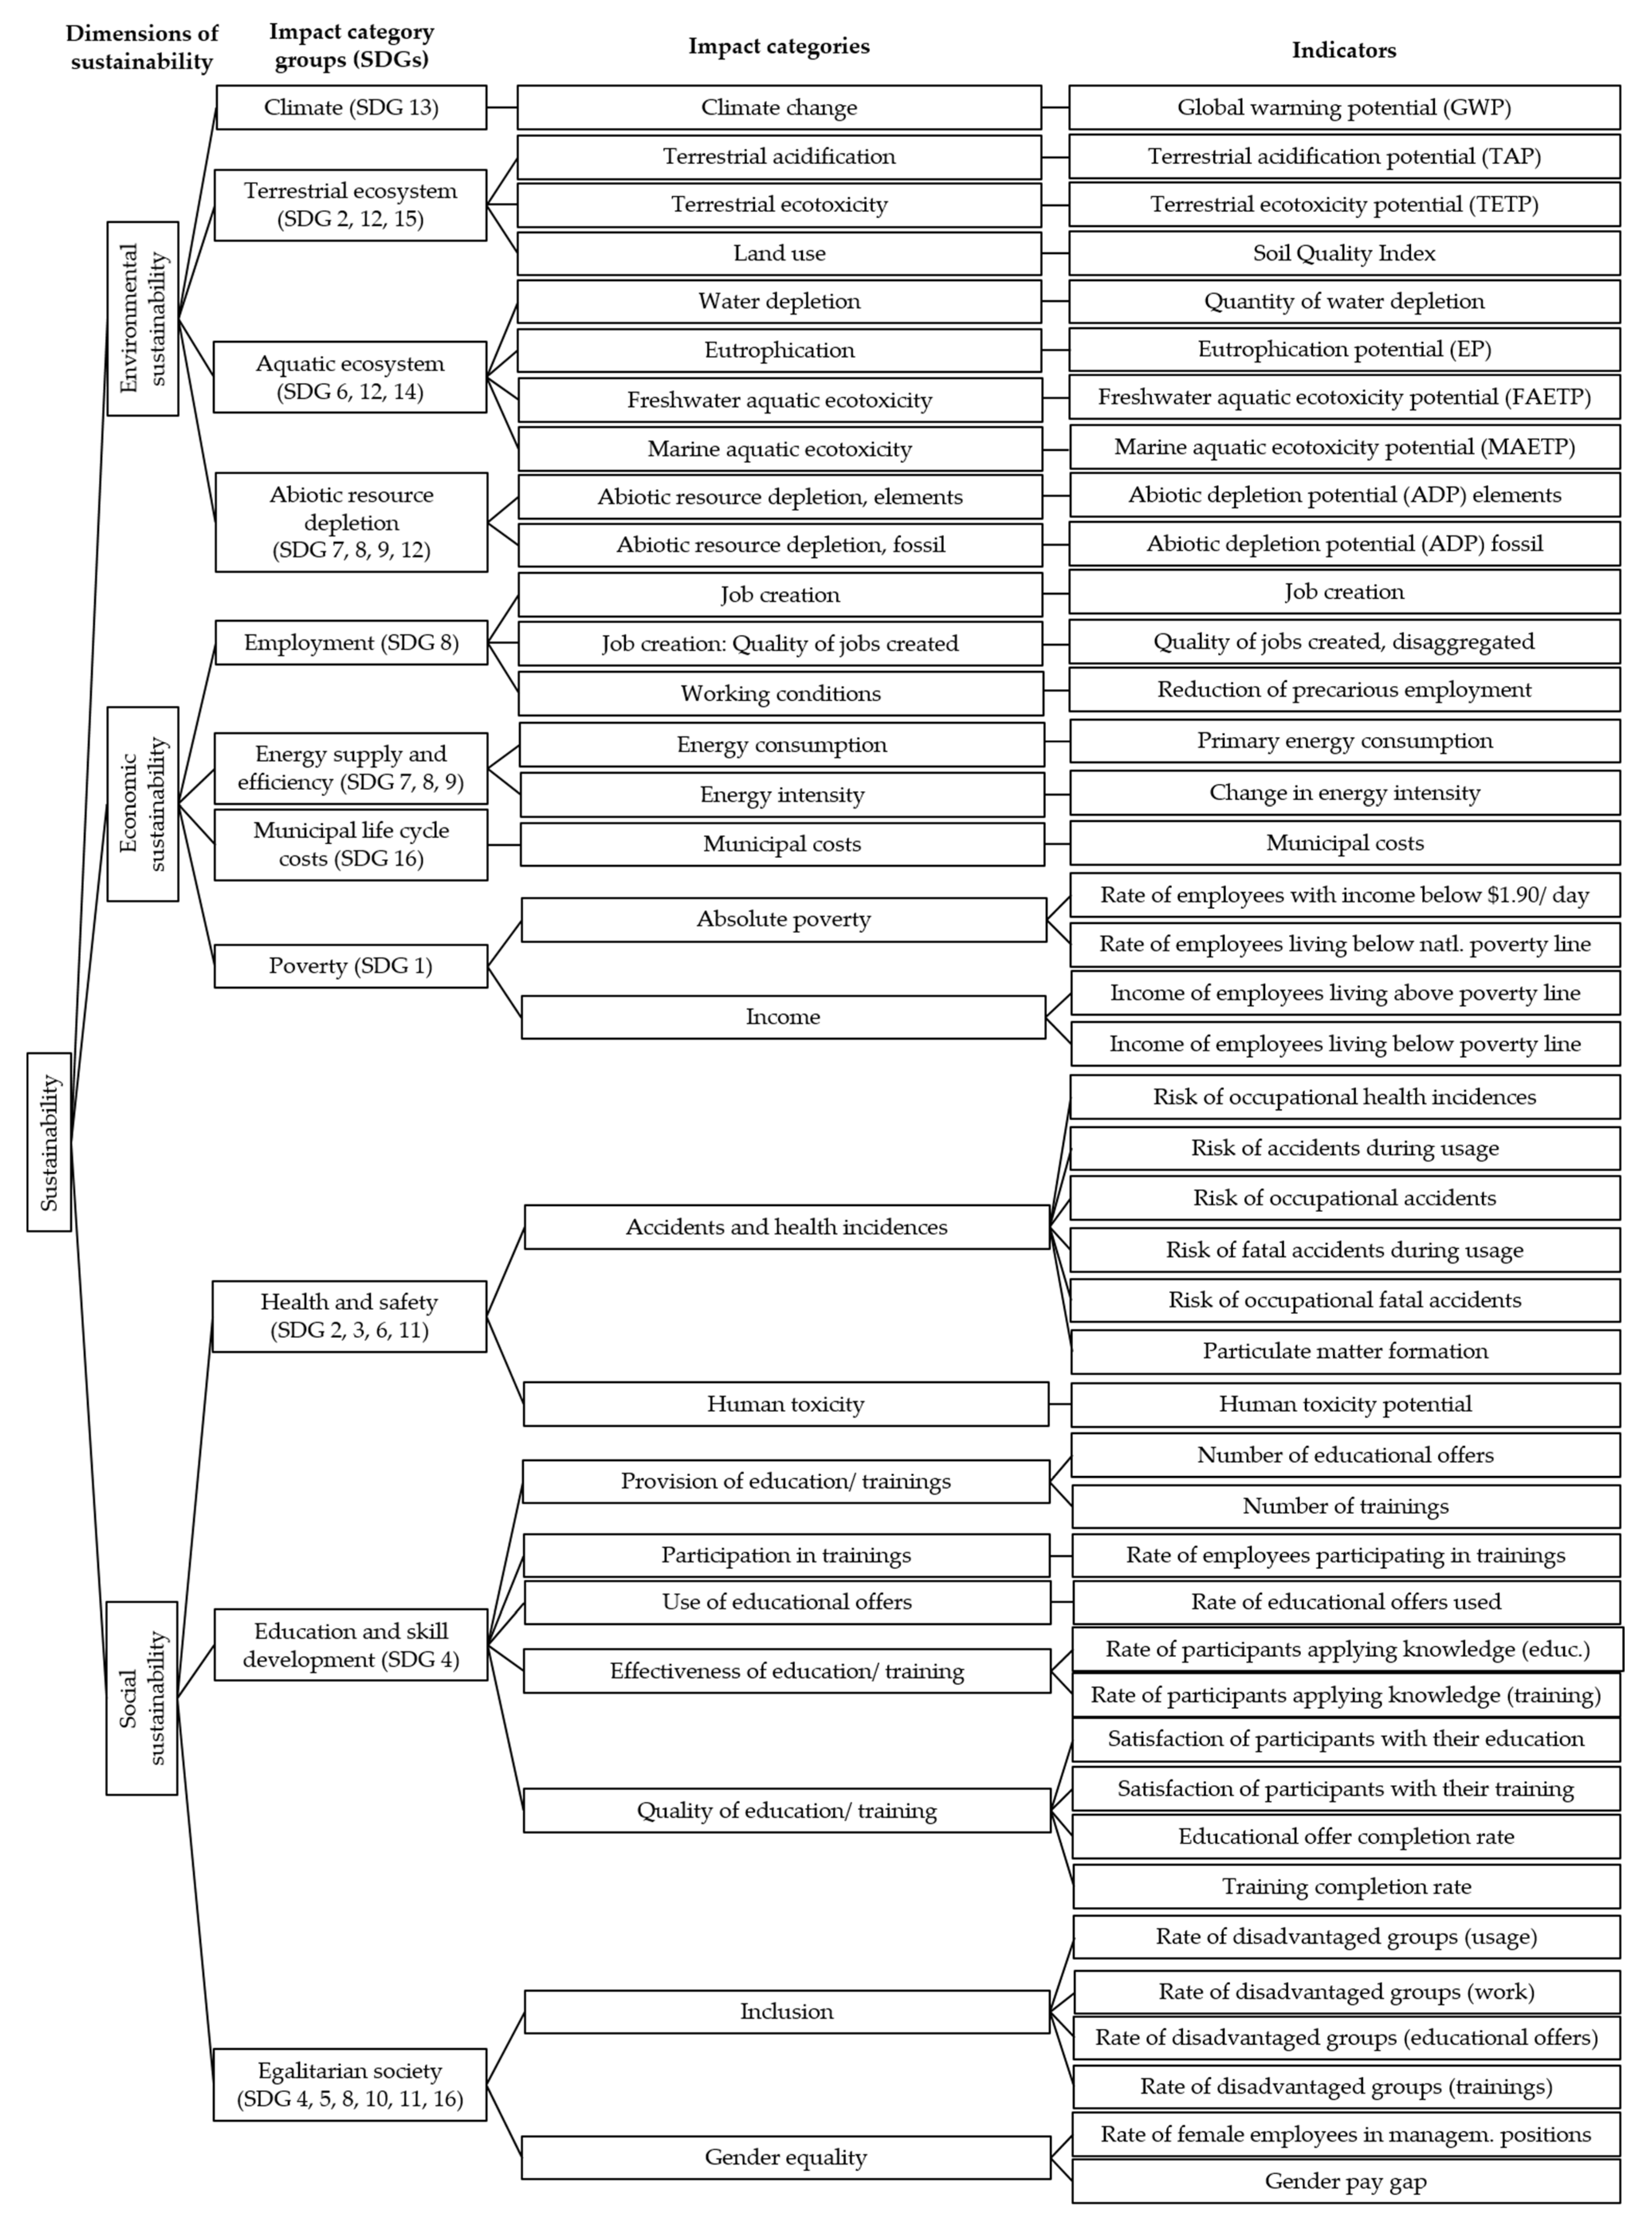
In Figure 3, the herein proposed general indicator set is illustrated as Tree of Sustainability, adapted from Sadok et al. [56]. Figure 3 displays the three dimensions of sustainability, the impact category groups under each sustainability dimension, and indicates in brackets to which impact category groups each SDG was assigned. To ensure the readability of Figure 3, the SDG targets and sub-targets were not included in this illustration. Figure 3 shows the indicators to be assessed for the selected impact categories.
As can be seen in Figure 3, it is possible that in the case of innovations in the field of urban surfaces, e.g., in the impact category accidents and health incidences, potential impacts of an innovation oppose one another in numerous ways: a) Within one life cycle stage. For example, in the case of an innovative flaming device for municipal weed removal, a possibly increased work-related risk of accidents, i.e., during the management of the surface with the innovation, could contrast a potentially reduced risk of accidents in the use of the pavement that has been treated with the innovation, meaning pedestrians using the surface; b) across life cycle stages. For instance, in the case of an innovative clearing and gritting vehicle, a potentially increased risk of occupational accidents during the production of the innovation could contrast a possibly reduced risk of accidents during the use of the street that has been managed with the innovative vehicle. Accordingly, during the assessment, the perspectives of the surface users and/or of the workers are taken, depending on the life cycle phase. Furthermore, the tree makes clear that a shift of impacts can also occur between the impact category groups, e.g., poverty and municipal life cycle costs, as well as between the dimensions of sustainability. For example, different perspectives are taken when assessing the potential impacts in the impact category groups costs and poverty: The one of the municipality (impact category group costs) and the one of the workers or end-users (impact category group poverty), respectively. The proposed approach also allows disclosing a shift between different processes that can compensate each other when determining the indicator values.
3.3. Operationalization of the Modeling Phase
First of all, the proposed general indicator set should be adapted to assess relevant impacts. For the operationalization of the modeling phase, the proven approach by Wang et al. [12] with its scoring rules, adapted from Maier et al. [13], is adopted. However, there are two differences to the scoring rules for the indicators by Wang et al. [12]: (1) In the case of a lack of data, an N/A should be noted. This N/A should be eliminated when calculating the score of the impact category and impact category group. (2) Likewise, an irrelevant indicator should be highlighted as such (N/A) or removed and not included in the further calculations. It should be noted that, as in Wang [27], the practitioner should determine diligently if the change of the indicator value between the comparison and the baseline scenario indicates a positive or a negative impact.
The line of aggregation to obtain a final result from the indicators can be followed by reading Figure 3 from right to left: The indicator scores are first aggregated to impact category scores, which then are aggregated to impact category group scores. Due to the assignment of the SDGs to impact category groups, the final impact category group scores show indirectly the possible impact of an innovation to the achievement of the respective SDGs.
4. Case Study
In a first application, the presented method was applied to a case study to a selected innovation in the area of a particular urban surface in order to investigate its potential sustainability impacts. The goal of the case study was to test the applicability of the presented method, therefore it is not described in great detail. Besides, possible starting points for the optimization of the approach were identified. The case study was conducted within an existing research project. While the city in which the case study was to be conducted was predefined by the project, the urban surface, the process to be innovated, as well as the innovation to be assessed were selected in a participatory process by the municipal stakeholders.
The newly introduced SDG-based sustainability assessment methodology was used to assess the potential sustainability impacts of weed-suppressing joint filling sand to support a municipality in Southern Germany in its decision on whether or not it should introduce the innovative material on walkways of its municipal cemeteries from a sustainability point of view. While there are several studies that examine the effectiveness of different weed-suppressing joint filling sands, e.g., [57,58,59,60], so far, no holistic sustainability assessment of those sands had been conducted. Hence, this study aimed to determine the potential impacts of the innovative joint filling sand in the environmental, social, and economic dimensions of sustainability within the system boundary. It was evaluated if the joint filling sand can contribute to the sustainability of the city. Based on the results of the sustainability assessment, a recommendation to the municipality regarding the introduction of the innovative material was to be put forward.
4.1. Goal and Scope Definition
Following the steps for the first phase of the methodology in Henzler et al. [2], both a baseline and comparison scenario were built. Primary data was collected using a semi-structured questionnaire in the municipality to form the basis of the baseline scenario. Due to the lack of data on a municipal level, assumptions based on secondary data had to be made in coordination with the municipality for the design of the baseline scenario. Further data sources, such as studies on the effectiveness of the joint filling sand [58,60], were used to develop the comparison scenario. Before lining out the assessed baseline and comparison scenario, the used functional equivalent is introduced and an overview of the installation mode of the innovation is provided below.
Joint filling sand is used for jointing the walkway in the cemetery and is managed in conjunction with the walkway in the use phase of the walkway. Accordingly, not only the joints with a width of 3 mm are cleaned, etc., but the whole surface is managed. Due to data availability, the assessment was conducted for the first management year. A functional equivalent was formulated as follows for the assessment: Provision of 100 m2 paved cemetery walkway for one year (the first management year), which is jointed with joint filling sand, is free from weed as well as aesthetically pleasing, durable, safe, and walkable, with the reference unit [100 m2 * 1a]. The acceptable weed growth was set to Class II according to Sluijsmans et al. 1997 (picture class quality) in Kortenhoff et al. [61] (low). This decision was made after considering the aspects mentioned in Kortenhoff et al. [61]: “The level of weed infestation that is acceptable depends—among others—on the function, the use and the location of the hard surface concerned and the demands (wishes) of the administrators and users” [61] (p. 6). The process of weed removal is conducted when this set limit is exceeded. This is in line with the information provided by the municipality for the case study that the weed removal on the walkway in question is conducted, e.g., depending on the visual impression.
In this case study, the innovative joint filling sand would be applied to an existing walkway in a municipal cemetery, which is made of concrete paving stones and currently jointed with crushed sand 0/2 mm. For this purpose, first, in a cleaning process (‘sweeping’), the currently installed crushed sand would be removed from the walkway’s joints at the height of 1.5 cm. Then, in the module modernization of the existing surface, the innovative joint filling sand would be applied on top of the remaining crushed sand. The modernization would be conducted before the first regular cleaning of the surface. It can be assumed that the municipal nursery will maintain its current use of equipment during jointing for the modernization with the innovative joint filling sand. Adopting the municipality’s use of equipment in the processes jointing and joint repairing from the questionnaires, only a broom would be used for applying the innovative joint filling sand in the module modernization, and not a vibrating plate as recommended by the producer [62]. After its introduction, the joint filling sand would also be used for the process of joint repair.
In Figure 1, a simplified version of the examined interactive life cycle scheme is illustrated, showing the installation mode of the innovative joint filling sand in the module modernization in the use phase of the walkway. In the use phase of the walkway, several tasks and management processes, respectively, are carried out. According to the questionnaire, they are conducted by employees of the municipal nursery. The processes of (pre-)cleaning, subsequent cleaning, thermal weed removal with a hand-held weed flamer, joint repair, as well as transports between the municipal building yard and the cemetery that are related to those processes, were identified as relevant in both the baseline and the comparison scenario. In the use phase in the comparison scenario, the additional processes of sweeping (removal of conventional crushed sand) and modernization of joint filling sand were determined as significant. Identified characteristics of the management processes included, e.g., the use of equipment, their frequency, number of involved employees, mode of transport, respective working-time (including transport time between municipal building yard and cemetery) as well as all input and output flows (MFA).
The environmental system boundary comprises the production and transport of the joint filling sand from the production site to the municipal building yard as well as the use phase. Due to data availability, for the social and economic dimension of sustainability, only the use phase was assessed in the case study at hand.
4.2. Modeling
Following the methodology, the introduced general indicator set was adapted as a first step of the modeling phase. The assessment of the environmental dimension was carried out using the LCA software GaBi. The GaBi models included the production and transport of the joint filling sand from its production site to the municipal building yard, the liquefied petroleum gas and its provision, as well as the transports between the municipal building yard and the cemetery in relation to the management processes (transport of employees, materials, and tools). It must especially be noted that since there are no processes available in GaBi to representatively model the process of weed flaming, here only the liquefied petroleum gas used in the flaming process and its provision were considered. As proposed by Wang et al. [12], characterization factors of the CML 2001 method (here: Version Jan. 2016) were applied for the assessment of most of the indicators under the environmental dimension, and also the factor from ReCiPe (here: Version 1.08) was used for the evaluation of the terrestrial acidification potential. For quantity of water depletion, the factor from ReCiPe 1.08 was used, for land use from EF 2.0. For the economic and social dimension, a partially quantitative and partially qualitative assessment was carried out.
Regarding the assessment, it should be noted that the authors have identified potentials and have not carried out a consequential assessment. This means that, for example, while a potential for working time-saving was pointed out, it was not considered if and what tasks could be accomplished in the time saved.
In the following, the modeling results of two exemplary impact category groups, climate and employment, are illustrated. In Table A3, Appendix C, the absolute and percentage change between the indicator values in the two scenarios are given for all impact category groups.
4.2.1. Modeling Results: Impact Category Group Climate
In the environmental dimension, an overall LCA was carried out for the production and transport of the joint filling sand to the municipal building yard and the use of the walkway and the joint filling sand. In the following, the modeling results for the impact category group climate under the environmental dimension are presented. It illustrates how the approach by Wang et al. [12] was adopted to receive an overall score for this impact category group.
In the group climate, the indicator global warming potential is assessed. The global warming potential is 95.3 kg CO2-eq./functional eq. in the baseline scenario and 52.1 kg CO2-eq./functional eq. in the comparison scenario. The indicator value in the comparison scenario is reduced by 45.3% compared to the baseline scenario. Hence, the indicator shows a positive impact (+1).
Insight: At 78.1 kg CO2-eq./functional eq. in the baseline and 29.4 kg CO2-eq./functional eq. in the comparison scenario, respectively, the liquefied petroleum gas causes the highest proportion of total Global Warming Potential (GWP). The reduction of the GWP of the liquefied petroleum gas by 62.4%, whose consumption is reduced by the innovation, leads to a decrease of the GWP in the overall balance. Hence, it is not obvious that, e.g., the GWP of the production and transport of the joint filling sand to the municipal building yard is increased through the innovation by 193.4% in the comparison scenario compared to the baseline scenario.
The scores in the impact category group climate are summarized in Table 2. The score of the impact category group climate is +1.
4.2.2. Modeling Results: Impact Category Group Employment
Due to limited data availability, only the impacts in the use phase were assessed for the impact category groups under the economic dimension. In the following, the modeling results in the impact category group employment are elucidated.
For the impact category job creation under the impact category group employment, the indicator job creation is assessed, which evaluates the possible impact of the innovation on the number of jobs that are linked to the provision of 1 functional eq. In 2019 the municipal nursery counted 24 employees. The working time required for the management of the walkway is calculated to 4554 min./functional eq. in the baseline scenario and 3828 min./functional eq. in the comparison scenario, respectively. The working time saving caused by the innovation is determined as 726 min./functional eq., which equals a reduction of 15.9% of the working time due to the innovative joint filling sand. Due to this reduction of the working time, the innovation could potentially have a negative impact on the number of jobs within the system boundary. The indicator shows a potential negative impact (−1).
As it was found that the innovation would potentially not increase the number of jobs, the indicator concerning the quality of jobs created is not relevant in the use phase.
The results of the assessment are summarized in Table 3. The score of the impact category group employment is −1.
4.3. Interpretation
4.3.1. Presentation and Evaluation
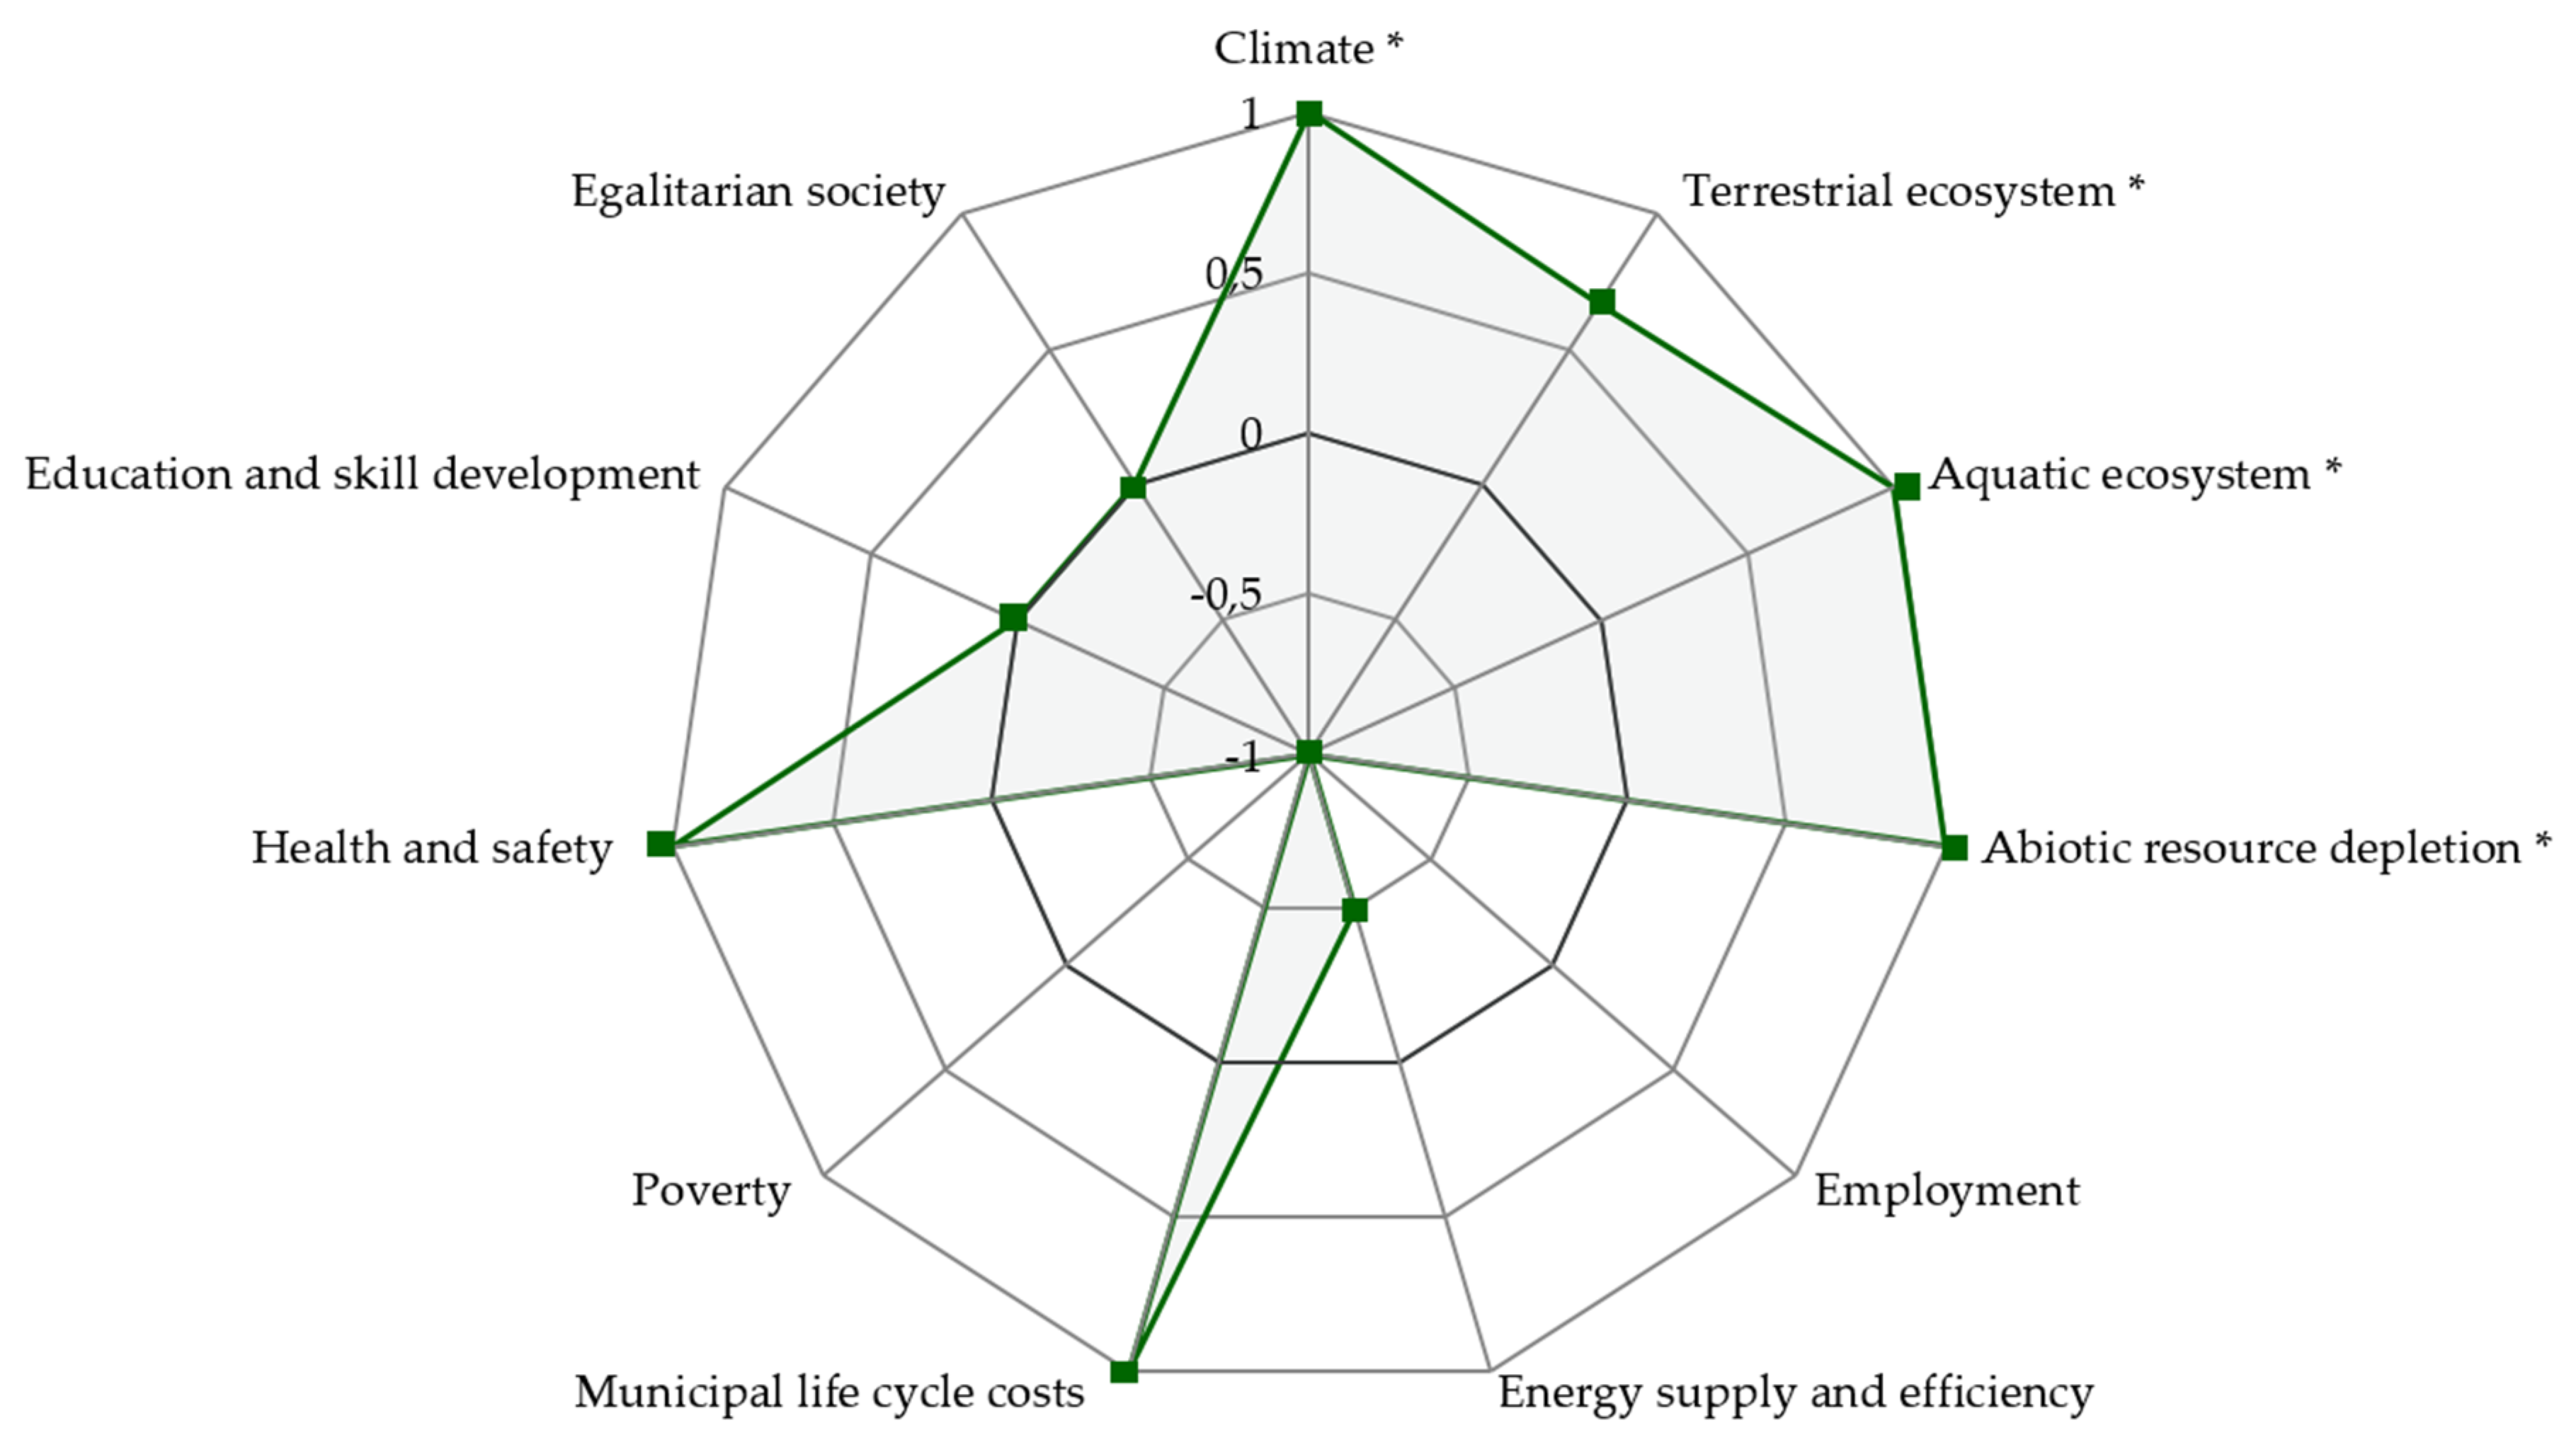
The scores of the eleven impact category groups in the case study are illustrated in Figure 4. When looking at this figure, it has to be kept in mind that for the impact category groups in the environmental dimension, an overall assessment of the phases production and transport of the joint filling sand and use was carried out, while for the impact category groups in the social and economic dimension, only the use phase was assessed.
Environmental dimension: In the overall assessment for the phases production & transport sand and use, the modernization of the walkway with the weed-suppressing joint filling sand could potentially have a positive impact in the impact category groups climate, terrestrial ecosystem, aquatic ecosystem, and abiotic resource depletion. This is due to the reduced consumption of liquefied petroleum gas in the process of weed removal, which covers, e.g., a deterioration in the provision of the joint filling sand. In the impact category group terrestrial ecosystem, the positive change through the innovation may not be so pronounced (+0.67), as the positive impact of the reduced demand for liquefied petroleum gas in the impact category land use contrasts with the clear negative impact of the provision of the innovative joint filling sand.
Economic dimension: In the use phase, the innovation could overall have a slightly positive impact on the impact category groups in the economic dimension. The innovation can potentially lead to a reduction of the effort needed for the management of the walkway, which in turn can result in savings in municipal expenditure related to the management of the cemetery walkway. In the impact category group life cycle costs, this is evaluated as a positive change (+1). In the impact category group energy supply and efficiency, a slightly negative economic impact of the innovation is observed (−0.5), which can be attributed to the fact that the primary energy consumption in the use phase is potentially decreasing while the used equipment would remain unchanged. In the impact category groups poverty and employment, the indicators show negative impacts of the weed-suppressing joint filling sand, which can be related to the reduced workload.
Social dimension: In the use phase, the innovation could potentially have either no or a positive impact in the three impact category groups under the social dimension. Due to the reduced weed growth and effort for the management of the walkway, the innovation could have an overall positive impact on the impact category group health and safety. With the slightly increased mileage of the platform truck due to the modernization of the joint-filing material, the risk of accidents during service rides increases somewhat; however, this change is only marginal. In the impact category group education and skill development, no potential impact of the innovation is assessed since no new skills are needed for the management of the modernized surface. The innovation has no effect on the structure of the workforce and does not change the accessibility of the surface for disadvantaged groups; hence no impact is observed in the impact category group egalitarian society.
Overall, the innovation could have a positive impact in the environmental dimension (sum of both phases), a negative impact in the economic dimension (use phase), and a slightly positive impact in the social dimension (use phase). In total, the innovation could have a slight positive contribution to the sustainability of the system and thereby to the sustainability of the municipality.
SDGs: The potential impact of the innovation in the eleven impact category groups and its possible contribution to the achievement of the SDGs are summarized in Table 4. The innovation could contribute across all dimensions of sustainability and assessed life cycle phases to the achievement of the SDGs 2, 3, 6, 12 to 15. In the use phase, the realization of the SDGs 11 and 16 would not receive full support (no and positive contribution of the innovation, respectively). Besides, in the use phase, the innovation cannot contribute to the realization of SDGs 4, 5, and 10. In the use phase, the innovation might counteract the achievement of SDG 1. The innovation would make contradicting contributions to the realization of SDGs 7, 8, and 9.
4.3.2. Conclusion and Recommendations
The assessment results have shown that the innovative joint filling sand could potentially have overall slightly positive impacts across the three dimensions of sustainability within the system boundary and could possibly contribute to the sustainability of the city.
Based on the results of the sustainability assessment, the introduction of the innovative joint filling sand on the walkways of municipal cemeteries in the municipality concerned seems promising. However, before making a final decision on the introduction of the innovation, it is recommended to assess the further life cycle phases holistically and to examine the effectiveness of the innovative joint filling sand in the planned installation mode.
On the basis of the assessment results, the following recommendations for the optimization of the potential sustainability impacts were put forward:
- Impact category groups employment and poverty: Additional tasks could be assigned to the employees of the municipal nursery to counteract a deterioration of their employment situation and income.
- Impact category group education and skill development: In the course of the introduction of the innovative joint filling sand, the employees should be informed about its correct installation and disposal.
- Impact category group health and safety: The municipality could purchase a gas cylinder trolley to reduce the risk of occupational health incidences and accidents.
- Impact category group egalitarian society: The municipality could investigate whether the reduction of the flaming activities makes the work at the municipal nursery more accessible for physically impaired people. In the course of modernization, the municipality could consider options for the improvement of the usability of the walkways for people with a visual impairment.
- Impact category group egalitarian society: The municipality could pay attention to granting equal access to jobs in the municipal building yard, sector municipal nursery.
- Optimization of material flows: The municipality could investigate the use of an alternative method for weed removal since the liquefied petroleum gas used for the flaming is the leading cause of the environmental sustainability impacts within the system boundaries.
- Optimization of material flows: The municipality could look into modernizing the walkway with an alternative weed-suppressing joint filling sand since the indicators in the environmental dimension show potential negative impacts for the transport of the selected innovative joint filling sand from its production site to the municipal building yard.
5. Discussion
5.1. Strengths of the Newly Developed Method
This study presents a methodological approach to the sustainability assessment of innovations in the field of urban surfaces based on SDGs. This includes the development of an SDG-based catalog of indicators tailored to the management of urban surfaces. The methodology thus enables impact assessment and result communication in all three dimensions of sustainability in a consistent way. It provides information on the possible (positive and negative) sustainability impacts of an innovation before it is implemented in a city. Thus, a product can be assessed in the context of the embedding organization. The results can therefore be used by decision-makers to identify benefits and trade-offs, and to derive further recommendations for optimization that can contribute to sustainable and future-proof innovations. The applicability of the methodology was demonstrated by applying the new method to a case study on the innovation of weed-suppressing joint filling sand on the urban surface of pavements compared to the baseline scenario. With Table 4, the municipality is provided with an easily communicable summary of the assessment results, thus giving a first insight into the results. The case study results have shown that recommendations can be made to the municipality regarding the introduction of the innovation from a sustainability perspective. This is accompanied by specific proposals for optimizing the material flows on the surface. It is important to ensure the transparency of the method and to provide the municipal decision-makers with the detailed assessment results to allow for informed decisions on changes of the system. Transparency can be achieved through close collaboration between municipal stakeholders and the assessors, e.g., during the design of the scenarios and the data collection process, as well as the provision of information on the assessed indicators and applied methods for calculating the assessment results. Giving insight into the assessment methods and indicators can make it easier to understand the given evaluation results. Furthermore, providing the full results (here made available in Appendix C) allows municipal stakeholders to comprehend why hot spots were identified as such, how the recommendations for system improvement were derived, and to identify further optimization potentials. However, a balance must be achieved: While decision-makers should have as detailed information as possible, the results should still be comprehensible. One advantage of the method presented is that the results can be both communicated in a simple, understandable way, and that more detailed information on the individual indicators can be given.
5.2. Limitations and Outlook
One of the general challenges for LCSA are the data needs [65]. The here presented method is no exception. One of the main limitations is the large amount of data required to assess each indicator within each impact category group across all life cycle phases of the innovation. For the production phase of the innovation, for example, only those indicators that can be assessed by life cycle assessment could be considered, the other indicators would require primary information or secondary statistical data, which would make the assessment very time-consuming. As this information was not available for the case study, it was not possible to quantitatively assess the indicators of the social and economic dimension of the production of the innovation. However, for a holistic assessment, it would be necessary to examine the possible shifts in impacts within the different life cycle phases and between SDGs. While the amount of data required for the assessment might limit the application of the method, this is no real obstacle, which is shown by the broad use of LCA. The impact assessment method presented here goes beyond the LCA’s scope, e.g., by assessing potential impacts in all three dimensions of sustainability and on the SDGs, providing additional valuable insights for decision-support, which cannot be done with a small data set. One of the advantages of the method is its coupling with the LCA, which already provides a large background data set for the environmental dimension.
With regards to the assessment of an innovation’s potential impact on the realization of the SDGs, for the proposed impact assessment methodology, the same applies as for the underlying methodology by Maier et al. [13], which is that “[…] the direct connection between the chosen indicators and the SDGs is weakened by several steps of impact categorization” [8] (p. 60). To address this weakness of the approach, one of the next steps could be making the cause-effect-chains transparent.
The analysis and assessment of the individual indicators should be updated in the future, as the values for each indicator and impact category are simply added together, which does not reflect the magnitude of the actual impacts. Therefore, normalization factors such as for EF could be adjusted to aggregate all results within one dimension. Besides, while the indicator set considers imported sustainability impacts, such as working conditions in the case of import goods, and can disclose a shift of sustainability impacts to other countries, it should be adopted to the country of assessment to take into account case-specific circumstances. This is in line with the finding that holistic sustainability assessments also need to be tailored to the country of assessment to ensure that relevant impacts are assessed and representative modeling processes are used. In addition, the set of indicators is not universally applicable, and may need to be adjusted to reflect case-specific changes.
Furthermore, some of the impact categories cannot yet be assessed, although their importance is highlighted in one or more SDGs. For example, as mentioned in SDG 15, impacts on biodiversity should be included in the overall methodology. As the authors have made the method development process transparent and opted for an open design of the method, the impact categories can be adapted and supplemented.
With regards to the case study, the limited availability of data at local level on the material flows associated with the various management processes was a major issue. In consultation with the city administration, several assumptions based on observations of the city administration and secondary data had to be made in order to design the baseline scenario. Consequently, the scenario did not represent the exact management situation in the city administration, which made the evaluation results less meaningful for the city. Furthermore, due to a lack of data, the potential sustainability impacts of the innovation in the social and economic dimension could not be assessed for the life cycle phases of the production and transport of the joint filling sand. Therefore, this case study compared the evaluation results of an overall assessment for the environmental dimension (phases of production and transport of the joint filling sand and use) with the results for the use phase in the social and economic dimension. Prior to a final decision on the introduction of the innovation, an overall assessment should be carried out to show a possible shift of the sustainability impacts to other phases and to identify further starting points for the optimization of the innovation. With respect to the case study, it should be kept in mind that it represents a first application of the method. While it has shown its applicability, it has also helped to determine valuable starting points for further improvement, both of the method and the data collection in municipalities. Building on this usage of the method, further case studies on innovations in the context of other urban surfaces are to be conducted.
6. Conclusions
In the context of urban surfaces, the authors have advanced the sustainability assessment of innovations connecting the life cycles of the urban surface and the proposed innovation through an SDG-based impact assessment methodology. In the process of method development, a detailed analysis of the SDG (sub-)targets with regard to the urban context and especially to urban surfaces was conducted. Based on relevant SDGs, a first literature review on suitable indicators was carried out to measure sustainability impacts of innovations in the field of urban surfaces.
The analyzed case study showcases the applicability of the proposed approach for decision support on a very specific issue. However, the robustness of results may increase with growing availability of both background and foreground data. The development of generic data for the sustainability of urban surfaces is strongly recommended by the authors and identified as a requirement for the approach to be applicable in broader contexts. While the case study provides decision support on a very specific issue, the proposed methodology offers a way to assess urban surfaces in a holistic approach based on life cycle thinking. The impact assessment framework furthermore allows us to communicate the findings through the SDG framework, which is better understood by the public and by deciding authorities. Thus, the approach perspectively allows practitioners to consider the impacts of a decision in the context of urban surfaces based on quantitative life cycle sustainability assessment. Having information on potential sustainability impacts and starting points for system optimization prior to the implementation of innovations helps to make innovations more future-proof. Furthermore, urban surfaces are identified as an original field of scientific interest and field of decisions impacting the sustainability of public organizations. In the time of climate change emergencies decided by public bodies and actions towards the SDGs becoming an integral part of public decision making, quantitative evaluations on decision options become a necessary prerequisite. This publication contributes to this, providing a scalable, transferrable impact assessment method and showcasing its application and communication. However, further steps are inevitable to facilitate the approach and make it accessible to practitioners.
Author Contributions
Conceptualization, K.H.; formal analysis, K.H.; funding acquisition, S.D.M. and M.J.; investigation, K.H.; methodology, K.H.; project administration, S.D.M. and M.J.; supervision, S.D.M., M.J. and R.H.; validation, K.H.; visualization, K.H.; writing—original draft, K.H., S.D.M., M.J., and R.H.; writing—review & editing, K.H., S.D.M., M.J., and R.H. All authors have read and agreed to the published version of the manuscript.
Funding
This research was funded by the German Federal Ministry of Education and Research—BMBF (BMBF 01 LR 172 5 C) as part of the BUOLUS project (Bauphysikalische Gestaltung urbaner Oberflächen für nachhaltige Lebens—und Umweltqualität in Städten—BUOLUS). This publication was supported by the Open Access Publishing Fund of the University of Stuttgart.
Acknowledgments
We thank the four anonymous reviewers and the editors for their valuable and helpful comments. We thank our project partners in Rosenheim for their support in retrieving primary data, especially Robert Freund and Constanze Müller. Our special thanks go to Steffen Steier (IABP, University of Stuttgart) for his support with the GaBi modeling. We would like to express our deep gratitude to our two colleagues for proofreading our manuscript.
Conflicts of Interest
The authors declare no conflict of interest.
Appendix A

Table A1.
SDG targets and sub-targets in Assman et al. [18], and further SDG targets and sub-targets in the relevance checklist [19] (highlighted in italic), here identified as relevant with a potential (direct) allocation to the impact categories in Wang et al. [12] and potential new impact category groups, respectively.
| SDG | Targets/Sub-Targets of the SDGs and Possible Assignment to Impact Category Groups |
|---|---|
| 1 | 1.1: Poverty; 1.2: Poverty; 1.5.1: Poverty |
| 2 | 2.1.1: Health; 2.2.1: Health, terrestrial ecosystem |
| 3 | 3.4.2: Health and well-being; 3.6: (traffic) Safety; 3.9.2: Health |
| 4 | 4.3: Egalitarian society; 4.4: Education and skill development; 4.5.1: Egalitarian society; 4.5.2: Egalitarian society; 4.a: Egalitarian society |
| 5 | 5.1: Egalitarian society; 5.5: Egalitarian society |
| 6 | 6.3.1: Aquatic ecosystem, health; 6.4: Aquatic ecosystem, health; 6.6: Aquatic ecosystem |
| 7 | 7.2: Energy supply, abiotic resource depletion; 7.3: Energy efficiency, abiotic resource depletion |
| 8 | 8.3.1: Employment; 8.4.1: Abiotic resource depletion; 8.4.2: Employment, energy supply and efficiency, abiotic resource depletion, terrestrial ecosystem, aquatic ecosystem; 8.5.1: Employment, egalitarian society; 8.5.2: Egalitarian society; 8.6: Egalitarian society; 8.7.1: Employment; 8.7.2: Employment; 8.8.1: Employment; 8.8.2: Employment |
| 9 | 9.4: Abiotic resource depletion, energy supply and efficiency; aquatic ecosystem, terrestrial ecosystem, climate; 9.5.3: Promotion of innovations (within the innovation process); 9.5.5: Spending on research and development (within the innovation process) |
| 10 | 10.2.2: Egalitarian society; 10.3.2: Egalitarian society; 10.4: Egalitarian society |
| 11 | 11.3.1: Egalitarian society; 11.5: Health and safety; 11.6: Health, terrestrial ecosystems, aquatic ecosystems; 11.7: Egalitarian society; safety; 11.b.1: Egalitarian society, abiotic resource depletion, climate |
| 12 | 12.1: Abiotic resource depletion, aquatic ecosystem, terrestrial ecosystem; 12.2: Abiotic resource depletion, aquatic ecosystem, terrestrial ecosystem; 12.4: Terrestrial ecosystem, aquatic ecosystem, health; 12.5: Abiotic resource depletion |
| 13 | 13.1: Climate |
| 14 | 14.1: Aquatic ecosystem; 14.3: Aquatic ecosystem |
| 15 | 15.1: Terrestrial ecosystem; 15.2.1: Terrestrial ecosystem; 15.3.1: Terrestrial ecosystem; 15.3.2: Terrestrial ecosystem; 15.5.1: Terrestrial ecosystem; 15.5.2: Biodiversity; 15.8: Biodiversity; 15.9.1: Biodiversity; 15.9.2: Biodiversity |
| 16 | 16.6: Municipal costs (for functional capability of municipality); 16.7: Egalitarian society; 16.b: Egalitarian society |
| 17 | 17.16: Partnerships |
Appendix B
Table A2.
Indicator set for the sustainability assessment of innovations in the field of urban surfaces. Sources of impact category groups, impact categories, indicators and assessment methods are given in the right column.
Table A2.
Indicator set for the sustainability assessment of innovations in the field of urban surfaces. Sources of impact category groups, impact categories, indicators and assessment methods are given in the right column.
| Impact Category Group | Impact Category | Indicator | Description | Measurement Unit | Assessment Method | Sources |
|---|---|---|---|---|---|---|
| Climate | Climate change | Global warming potential | Potential contribution to global warming by providing 1 funct. eq. | [kg CO2-eq.] | LCA-CML 2001 | [12,13] |
| Terrestrial ecosystem | Terrestrial acidification | Terrestrial acidification potential | Potential for terrestrial acidification by providing 1 funct. eq. | [kg SO2-eq.] | ReCiPe 1.08 | [12,13] |
| Terrestrial ecotoxicity | Terrestrial ecotoxicity potential | Potential toxicological effects of substances on terrestrial ecosystems by providing 1 funct. eq. | [kg DCB-eq.] | LCA-CML 2001 | [12,13,47] | |
| Land use | Soil Quality Index | Potential impact of land use on several soil properties by providing 1 funct. eq.; aggregated index | [pt] | Soil Quality Index (based on LANCA, Bos et al. 34) | [12,24] | |
| Aquatic ecosystem | Water depletion | Quantity of water depletion | Water consumption for the provision of 1 funct. eq. | [m3] | ReCiPe 1.08 | [12,13] |
| Eutrophication | Eutrophication potential | Potential for eutrophication of aquatic ecosystems by providing 1 funct. eq. | [kg PO43--eq.] | LCA-CML 2001 | [12] | |
| Freshwater aquatic ecotoxicity | Freshwater aquatic ecotoxicity potential | Potential toxicological effects of substances on freshwater aquatic ecosystems by providing 1 funct. eq. | [kg DCB-eq.] | LCA-CML 2001 | [12,13,47] | |
| Marine aquatic ecotoxicity | Marine aquatic ecotoxicity potential | Potential toxicological effects of substances on marine aquatic ecosystems by providing 1 funct. eq. | [kg DCB-eq.] | LCA-CML 2001 | [12,13,47] | |
| Abiotic resource depletion | Abiotic resource depletion, elements | Abiotic depletion potential (ADP) elements | Consumption of elements by providing 1 funct. eq. | [kg Sb-eq.] | LCA-CML 2001 | [12] |
| Abiotic resource depletion, fossil | Abiotic depletion potential (ADP) fossil | Consumption of fossil fuels by providing 1 funct. eq. | [MJ] | LCA-CML 2001 | [12] | |
| Employment | Job creation | Job creation | Number of jobs that is linked to the provision of 1 funct. eq. | [Number] | Quantitative | [12,13] |
| Job creation: Quality of jobs created | Quality of jobs created, e.g., disaggregated by: Percentage of jobs: - with indefinite contract - with commitment to a collective agreement - that requires a certain qualification (skilled) - that is in line with nationally recognized labor standards (e.g., ILO) | Jobs created that are linked to the provision of 1 funct. eq., analyzed with regard to their quality: - Type of contract: temporary/indefinite (possibly: jobs bound by a collective agreement) - Required qualification (skilled/unskilled) - Compliance with nationally recognized labor standards, e.g., remuneration according to basic wage or tariff wage, working time, no child labor | [%] | Quantitative | [8,12,13,26,27] | |
| Working conditions | Reduction of precarious employment | Percentage of precarious employment in relation to total employment that is linked to the provision of 1 funct. eq. | [%] | Quantitative | [12,13] | |
| Energy supply and efficiency | Energy consumption | Primary energy consumption, from renewable and fossil energy sources | Primary energy consumption (renewable and fossil) of the individual life cycle phases | [MJ] | LCA-CML 2001 | [12,13] |
| Energy intensity | Change in energy intensity | Change in energy intensity in the individual life cycle phases | [MJ] | LCA-CML 2001 | [12,13] | |
| Municipal life cycle costs | Municipal costs | Municipal costs | Municipal costs for the provision of 1 funct. eq.: Costs for resources, power, other forms of energy (e.g., fuel), employees, machines, disposal | [Local currency of the municipality] | Quantitative | [25,27] |
| Poverty | Absolute poverty | Rate of employees with an income below $1.90 (PPP) per day | Percentage of employees with an income below $1.90 (PPP)/day per total number of employees. (Employees that are involved in the provision of 1 funct. eq.) | [%]; local currency and then converted into international dollars (PPP) | Quantitative | [12,13,22,66] |
| Rate of employees living below the national poverty line (urban/rural) | Percentage of employees living below the national poverty line (urban/rural) per total number of employees. | [%]; local currency and then converted into international dollars (PPP) | Quantitative | [12,13,22] | ||
| Income | Income of employees living above national/international poverty line | Assessment of how the income of the employees living above the national/international poverty line changes through the innovation. | Local currency and then converted into international dollars (PPP) | Quantitative | [12,13] | |
| Income of employees living below national/international poverty line | Assessment of how the income of the employees living below the national/international poverty line changes through the innovation. | Local currency and then converted into international dollars (PPP) | Quantitative | [12,13] | ||
| Health and safety | Accidents and health incidences | Risk of occupational health incidences | Risk of employees’ health incidences | [%] | Quantitative | [12,13] |
| Risk of accidents (during usage and at work) | Risk of users’ and employees’ accidents | [%] | Quantitative | [12,13] | ||
| Risk of fatal accidents (during usage and at work) | Risk of users’ and employees’ fatal accidents | [%] | Quantitative | [12,13,26] | ||
| Particulate matter formation | Particulate matter formation by providing 1 funct. eq. | [kg PM 10-eq.] | ReCiPe 1.08 | [12,13] | ||
| Human toxicity | Human toxicity potential | Potential toxicological effects of substances on human health by providing 1 funct. eq. | [kg DCB-eq.] | LCA-CML 2001 | [12,13,47] | |
| Education and skill development | Provision of education/trainings | Number of educational offers/trainings | Number of offered training positions or number of further training offerings | [Number] | Quantitative | [12,26] |
| Participation in trainings | Rate of employees participating in trainings | Percentage of employees participating in trainings per total employees | [%] | Quantitative | [12,26] | |
| Use of educational offers | Rate of educational offers used | Percentage of educational offers, e.g., training positions, used/filled per total educational offers | [%] | Quantitative | [12] | |
| Effectiveness of education/training | Rate of participants in educational offer/training applying their knowledge | Percentage of participants in educational offer/training applying their knowledge per total participants | [%] | Quantitative | [12,13] | |
| Quality of education/training | Satisfaction of participants with their education/training | Survey among participants on their satisfaction with their education/training | Grading system | Quantitative | [12,13] | |
| Educational offer/training completion rate | Percentage of participants completing the educational offer/training per total participants | [%] | Quantitative | [12,13] | ||
| Egalitarian society | Inclusion | Rate of disadvantaged groups (usage, work, educational offers/trainings) | - Percentage of disadvantaged employees (handicapped, female, young, older employees/employees with a migrant background) per total employees - Percentage of disadvantaged participants (e.g., handicapped, female participants) per total participants in educational offers/trainings - Percentage of disadvantaged groups (mainly elderly and handicapped persons) for whom the publicly useable space is usable | [%] | Quantitative | [12,13,20,26] |
| Gender equality | Rate of female employees in management positions | Percentage of female employees in management positions in relation to all employees in management positions. (Management positions in companies, municipal enterprises etc. participating in the provision of 1 funct. eq.) | [%] | Quantitative | [12,26] | |
| Gender pay gap | Median income of female employees in relation to the median income of male employees participating in the provision of 1 funct. eq. | [%] | Quantitative | [12,18,26] |
Note: Abbreviation funct. stands for “functional”, eq. stands for “equivalent”.
Appendix C
Table A3.
Modeling results of the case study. The fourth column gives the change between the indicator values in the comparison scenario compared to the baseline scenario.
Table A3.
Modeling results of the case study. The fourth column gives the change between the indicator values in the comparison scenario compared to the baseline scenario.
| Impact Category Group | Impact Category | Indicator | Difference | Unit | Change [%/funct. eq.] | Assessment Method |
|---|---|---|---|---|---|---|
| Climate | Climate change | Global warming potential | −4.32 × 10 | [kg CO2-eq./funct. eq.] | −45.3 | CML 2001—Jan. 2016 |
| Terrestrial ecosystem | Terrestrial acidification | Terrestrial acidification potential (TAP) | −1.02 × 10⁻¹ | [kg SO2-eq./funct. eq.] | −50.9 | ReCiPe 1.08 Mindpoint(H) |
| Terrestrial ecotoxicity | Terrestrial ecotoxicity potential (TETP inf.) | −4.20 × 10⁻² | [kg DCB eq./funct. eq.] | −44.2 | CML 2001—Jan. 2016 | |
| Land use | Land use | 7.00 | [pt/funct. eq.] | 3.6 | EF 2.0 | |
| Aquatic ecosystem | Water depletion | Quantity of water depletion | −5.20 | [m3/funct. eq.] | −27.8 | ReCiPe 1.08 Mindpoint(H) |
| Eutrophication | Eutrophication potential (EP) | −6.90 × 10⁻³ | [kg PO43--eq./funct. eq.] | −26.04 | CML 2001—Jan. 2016 | |
| Freshwater aquatic ecotoxicity | Freshwater aquatic ecotoxicity potential (FAETP inf.) | −1.23 | [kg DCB-eq./funct. eq.] | −59.2 | CML 2001—Jan. 2016 | |
| Marine aquatic ecotoxicity | Marine aquatic ecotoxicity potential (MAETP inf.) | −3.47 × 10³ | [kg DCB-eq./funct. eq.] | −56.0 | CML 2001—Jan. 2016 | |
| Abiotic resource depletion | Abiotic resource depletion, elements | Abiotic depletion potential (ADP) elements | −8.09 × 10⁻⁶ | [kg Sb-eq. /funct. eq.] | −51.2 | CML 2001—Jan. 2016 |
| Abiotic resource depletion, fossil | Abiotic depletion potential (ADP) fossil | −3.39 × 10³ | [MJ/funct. eq.] | −58.5 | CML 2001—Jan. 2016 | |
| Employment | Job creation | Job creation | Negative 1 | [no./funct. eq.] | −15.9 | Qualitative |
| Energy supply and efficiency | Energy consumption | Primary energy consumption (net calorific value) | −3.01 × 10³ | [MJ/funct. eq.] | −59.9 | GaBi |
| Energy intensity | Change in energy intensity | 0 2 | [MJ/funct. eq.] | 0 | Quantitative | |
| Municipal life cycle costs | Municipal costs | Municipal costs | −2.62 × 10² | [€/funct. eq.] | −18.7 | Quantitative |
| Poverty | Income | Total remuneration of employees | −1.87 × 10² 3 | [€/funct. eq.] | −15.9 | Quantitative |
| Health and safety | Accidents and health incidences | Risk of occupational health incidences while performing the tasks | - | - | −16.4 | Quantitative |
| Risk of accidents during usage | - | - | Negative 4 | Qualitative | ||
| Risk of occupational accidents while carrying out the management tasks | - | - | −16.4 | Quantitative | ||
| Risk of fatal and injury accidents during transport between municipal building yard and walkway | - | - | 7.7 | Quantitative | ||
| Particulate matter formation | −2.66 × 10⁻² | [kg PM 10-eq./funct. eq.] | −45.4 | Quantitative | ||
| Human toxicity | Human toxicity potential | −5.05 | [kg DCB-eq./funct. eq.] | −55.3 | Quantitative | |
| Education and skill development | Provision of education/trainings | Number of trainings | N/A 5 | [no./funct. eq.] | N/A | Qualitative |
| Number of educational offers | 0 6 | [no./funct. eq.] | 0 | Qualitative | ||
| Egalitarian society | Inclusion | Rate of disadvantaged groups for whom the public space is usable | - | - | 0 7 | Qualitative |
Note: Abbreviation funct. eq. stands for “functional equivalent”; abbreviation no. stands for “number”. 1 See Section 4.2.2. 2 No change in energy intensity is expected since the same machines are used in the baseline and comparison scenario. 3 Change in total remuneration that the employees would receive in connection with the provision of 1 funct. eq. 4 There is no information available on whether the innovative joint filling sand can prevent a moving of the paving stones more efficiently in comparison to the conventional crushed sand and thus enable a higher degree of safety when using the walkway. However, e.g., the surefootedness of walkways can be influenced negatively by some weed species with a pronounced shoot and root growth [67]. As a result of the reduced weed growth between the weed removal operations in the reference scenario with the innovation, the risk of accidents during usage could potentially be reduced for all users. The indicator shows a positive impact. 5 Depending on the implementation mode of the innovation, instruction might be given when introducing the innovative joint-filling material to inform the employees about the correct handling and disposal of the weed-suppressing sand. According to the municipality, the crushed sand used in the baseline scenario is mainly reused as a component of tree substrate, and only a small amount is disposed of at a construction rubble landfill. However, the chosen innovative joint filling sand has to be taken to a recycling center [62]. Hence, the number of trainings could potentially increase due to the innovation. However, as the number of trainings would potentially only be changed marginally, the indicator shows no impact. 6 According to the questionnaire, the municipal nursery is responsible for carrying out several tasks. Hence, it is not expected that less training positions will be offered in the comparison scenario due to the reduced effort for the management of the cemetery walkway. Moreover, for the management of the walkway grouted with the innovative joint filling sand, no new skills are required for which new training positions would have to be created. The indicator shows no impact of the innovation. 7 Two disadvantaged groups are considered for the assessment of this indicator: Physically impaired people using a wheelchair or walker and visually impaired people. In the assessed comparison scenario, the introduction of the innovation is not accompanied by measurements that would considerably change the properties of the surface, which in turn would lead to an increase or decrease of the rate of disadvantaged groups for whom the public space is usable. Moreover, the reduced weed growth in the comparison scenario does not impact on the accessibility of the surface. Hence, the innovation does not result in a change of the rate of disadvantaged groups for whom the walkway is useable. The indicator shows no impact.
References
- Leistner, P.; Kaufmann, A.; Koehler, M.; Würth, M.; Hofbauer, W.; Dittrich, S.; Maier, S.D.; Gordt, A.; Jäger, M. Bauphysik urbaner Oberflächen. Bauphysik 2018, 40, 358–368. [Google Scholar] [CrossRef]
- Henzler, K.; Horn, R.; Jäger, M.; Maier, S.D. Sustainability of innovative urban surfaces—A new approach of assessment. Earth Environ. Sci. 2019, 323, 12068. [Google Scholar] [CrossRef]
- What Are The Sustainable Development Goals? Available online: https://www.undp.org/content/undp/en/home/sustainable-development-goals.html (accessed on 2 May 2020).
- Transforming Our World: The 2030 Agenda for Sustainable Development. Available online: https://sustainabledevelopment.un.org/post2015/transformingourworld (accessed on 2 May 2020).
- International Organization for Standardization. Umweltmanagement—Ökobilanz—Grundsätze und Rahmenbedingungen (ISO 14040:2006); Beuth: Berlin, Germany, 2009. [Google Scholar]
- Guinée, J.; Heijungs, R.; Huppes, G.; Zamagni, A.; Masoni, P.; Buonamici, R.; Ekvall, T.; Rydberg, T. Life Cycle Assessment: Past, Present, and Future. Environ. Sci. Technol. 2011, 45, 90–96. [Google Scholar] [CrossRef] [PubMed]
- Finkbeiner, M.; Schau, E.; Lehmann, A.; Traverso, M. Towards Life Cycle Sustainability Assessment. Sustainability 2010, 2, 3309–3322. [Google Scholar] [CrossRef] [Green Version]
- Wulf, C.; Werker, J.; Zapp, P.; Schreiber, A.; Schlör, H.; Kuckshinrichs, W. Sustainable Development Goals as a Guideline for Indicator Selection in Life Cycle Sustainability Assessment. Procedia CIRP 2018, 69, 59–65. [Google Scholar] [CrossRef]
- Castor, J.; Bacha, K.; Fuso Nerini, F. SDGs in action: A novel framework for assessing energy projects against the sustainable development goals. Energy Res. Soc. Sci. 2020, 68, 1–9. [Google Scholar] [CrossRef]
- Albertí, J.; Balaguera, A.; Brodhag, C.; Fullana-I-Palmer, P. Towards life cycle sustainability assessment of cities. A review of background knowledge. Sci. Total. Environ. 2017, 609, 1049–1063. [Google Scholar] [CrossRef]
- Omer, M.A.; Noguchi, T. A conceptual framework for understanding the contribution of building materials in the achievement of Sustainable Development Goals (SDGs). Sustain. Cities Soc. 2020, 52, 101869. [Google Scholar] [CrossRef]
- Wang, J.; Maier, S.D.; Horn, R.; Holländer, R.; Aschemann, R. Development of an Ex-Ante Sustainability Assessment Methodology for Municipal Solid Waste Management Innovations. Sustainability 2018, 10, 3208. [Google Scholar] [CrossRef] [Green Version]
- Maier, S.D.; Beck, T.; Vallejo, J.F.; Horn, R.; Söhlemann, J.-H.; Nguyen, T.T. Methodological Approach for the Sustainability Assessment of Development Cooperation Projects for Built Innovations Based on the SDGs and Life Cycle Thinking. Sustainability 2016, 8, 1006. [Google Scholar] [CrossRef] [Green Version]
- Kühnen, M.; Silva, S.; Beckmann, J.; Eberle, U.; Hahn, R.; Hermann, C.; Schaltegger, S.; Schmid, M. Contributions to the sustainable development goals in life cycle sustainability assessment: Insights from the Handprint research project. Nachhalt. Sustain. Manag. Forum 2019, 27, 65–82. [Google Scholar] [CrossRef]
- Wulf, C.; Werker, J.; Ball, C.; Zapp, P.; Kuckshinrichs, W. Review of Sustainability Assessment Approaches Based on Life Cycles. Sustainability 2019, 11, 5717. [Google Scholar] [CrossRef] [Green Version]
- Maier, S.D. Methodological Approach Based on Life Cycle Thinking for Sustainability Assessments of Development Cooperation Projects. Analyzing a Case Study within the GIZ Program Renewable Energies and Energy Efficiency. Master’s Thesis, University of Bayreuth, Bayreuth, Germany, 2016. [Google Scholar]
- Van Der Giesen, C.; Kleijn, R.; Kramer, G.; Guinée, J. Towards application of life cycle sustainability analysis. Rev. Métallurgie 2013, 110, 29–36. [Google Scholar] [CrossRef]
- Assman, D.; Honold, J.; Grabow, B.; Roose, J. SDG-Indikatoren für Kommunen-Indikatoren zur Abbildung der Sustainable Development Goals der Vereinten Nationen in Deutschen Kommunen; Bertelsmann Stiftung, Bundesinstitut für Bau-, Stadt- und Raumforschung, Deutscher Landkreistag, Deutscher Städtetag, Deutscher Städte- und Gemeindebund, Deutsches Institut für Urbanistik, Engagement Global: Gütersloh, Germany, 2018. [Google Scholar]
- Relevanzcheck Langfassung. Available online: https://www.bertelsmann-stiftung.de/fileadmin/files/Projekte/Monitor_Nachhaltige_Kommune/Relevanzcheck_Langfassung.xlsx (accessed on 30 August 2019).
- United Nations Economic and Social Council. Report of the Inter-Agency and Expert Group on Sustainable Development Goal Indicators; United Nations Economic and Social Council (ECOSOC): New York, NY, USA, 2017. [Google Scholar]
- Maier, S.D.; Lindner, J.P.; Francisco, J. Conceptual Framework for Biodiversity Assessments in Global Value Chains. Sustainability 2019, 11, 1841. [Google Scholar] [CrossRef] [Green Version]
- Sustainable Development Solutions Network. Indicators and a Monitoring Framework for the Sustainable Development Goals: Launching a Data Revolution for the SDGs; SDSN: New York, NY, USA, 2015. [Google Scholar]
- Teillard, F.; Anton, A.; Dumont, B.; Finn, J.A.; Henry, B.; Souza, D.M.; Manzano, P.; Milài Canals, L.; Phelps, C.; Said, M.; et al. A Review of Indicators and Methods to Assess Biodiversity–Application to Livestock Production at Global Scale; Livestock Environmental Assessment and Performance (LEAP) Partnership; FAO: Rome, Italy, 2016. [Google Scholar]
- Sala, S.; Cerutti, A.K.; Pant, R. Development of a Weighting Approach for the Environmental Footprint; Publications Office of the European Union: Luxembourg, 2018. [Google Scholar]
- Horn, R.; Dahy, H.; Gantner, J.; Speck, O.; Leistner, P. Bio-Inspired Sustainability Assessment for Building Product Development—Concept and Case Study. Sustainability 2018, 10, 130. [Google Scholar] [CrossRef] [Green Version]
- Siebert, A.; Bezama, A.; O’Keeffe, S.; Thrän, D. Social life cycle assessment indices and indicators to monitor the social implications of wood-based products. J. Clean. Prod. 2018, 172, 4074–4084. [Google Scholar] [CrossRef]
- Wang, J. Ex-ante Sustainability Assessment of Municipal Solid Waste Management Innovations under the Life Cycle Sustainability Analysis Framework: With a Case Study of Waste Bank in Indonesia. Master’s Thesis, University of Leipzig, Leipzig, Germany, 2018. [Google Scholar]
- Emissionsquellen. Available online: https://www.umweltbundesamt.de/themen/klima-energie/treibhausgas-emissionen/emissionsquellen#textpart-1 (accessed on 10 April 2019).
- Deutsche Nachhaltigkeitsstrategie. Neuauflage. 2016. Available online: https://www.bundesregierung.de/resource/blob/975292/730844/3d30c6c2875a9a08d364620ab7916af6/deutsche-nachhaltigkeitsstrategie-neuauflage-2016-download-data.pdf?download=1 (accessed on 18 March 2019).
- ReCiPE 2008: A Life Cycle Impact Assessment Method Which Comprises Harmonised Category Indicators at the Midpoint and the Endpoint Level. First edition (version 1.08). Report I: Characterisation. Available online: https://www.researchgate.net/publication/302559709_ReCiPE_2008_A_life_cycle_impact_assessment_method_which_comprises_harmonised_category_indicators_at_the_midpoint_and_the_endpoint_level/link/576cd72808ae193ef3a9adb1/download (accessed on 26 August 2019).
- LCIA Methods. Impact Assessment Methods in Life Cycle Assessment and Their Impact Categories. Version: 1.5.5. Available online: http://www.openlca.org/wp-content/uploads/2016/08/LCIA-METHODS-v.1.5.5.pdf (accessed on 28 April 2019).
- Wuana, R.A.; Okieimen, F.E. Heavy Metals in Contaminated Soils: A Review of Sources, Chemistry, Risks and Best Available Strategies for Remediation. ISRN Ecol. 2011, 2011, 1–20. [Google Scholar] [CrossRef] [Green Version]
- Zhang, M.; Liu, Z.-Y.; Wang, H. Use of Single Extraction Methods to Predict Bioavailability of Heavy Metals in Polluted Soils to Rice. Commun. Soil Sci. Plant Anal. 2010, 41, 820–831. [Google Scholar] [CrossRef]
- Bos, U.; Horn, R.; Beck, T.; Lindner, J.P.; Fischer, M. LANCA-Characterization Factors for Life Cycle Impact Assessment: Version 2.0; Fraunhofer Verlag: Stuttgart, Germany, 2016. [Google Scholar]
- Miller, S.A.; Horvath, A.; Monteiro, P.J.M. Impacts of booming concrete production on water resources worldwide. Nat. Sustain. 2018, 1, 69–76. [Google Scholar] [CrossRef]
- Mahmud, M.P.; Huda, N.; Farjana, S.H.; Lang, C. Comparative Life Cycle Environmental Impact Analysis of Lithium-Ion (LiIo) and Nickel-Metal Hydride (NiMH) Batteries. Batteries 2019, 5, 22. [Google Scholar] [CrossRef] [Green Version]
- Ressourcenschonung und Kreislaufwirtschaft: Ressourcenverbrauch und Wachstum Durch Nachhaltige Produktion Entkoppeln. Available online: https://www.nachhaltigkeitsrat.de/thema/ressourcenschonung-und-kreislaufwirtschaft/ (accessed on 18 March 2019).
- Resource Conservation in the Manufacturing and Consumption Domain. Available online: https://www.umweltbundesamt.de/en/topics/waste-resources/resource-conservation-in-the-manufacturing (accessed on 23 March 2019).
- Ziegler, A. Welche Auswirkungen haben betriebliche Innovationen auf die Beschäftigten? WSI Mitt. 2010, 63, 103–108. [Google Scholar] [CrossRef]
- Erstes Entwicklungsziel. Available online: https://skew.engagement-global.de/ziel-1-bekaempfung-von-extremer-armut-und-hunger.html (accessed on 23 March 2020).
- Nachhaltiges Wirtschaften Bringt Gewinn. Available online: https://www.bmbf.de/de/nachhaltiges-wirtschaften-bringt-gewinn-7662.html (accessed on 20 March 2019).
- Nachhaltige Beschaffung Konkret. Arbeitshilfe für den Umweltfreundlichen und Sozialverträglichen Einkauf in Kommunen. Available online: https://www.lubw.baden-wuerttemberg.de/documents/10184/147663/Nachhaltige+Beschaffung+konkret+2017.pdf/aa413776-352c-4167-a7e7-5448be7ca817 (accessed on 18 February 2020).
- Goal 3: Ensure Healthy Lives and Promote Well-Being for All at All Ages. Available online: https://www.un.org/sustainabledevelopment/health/ (accessed on 13 February 2020).
- Bau- und Betriebshöfe. Ausführliches Branchenbild aus dem Risikoobservatorium der DGUV. Available online: https://www.dguv.de/medien/ifa/de/fac/arbeiten_4_0/bau-und-betriebshoefe_langfassung.pdf (accessed on 30 March 2019).
- Luftreinhalteplanung: Baumaschinen. Available online: https://www.berlin.de/senuvk/umwelt/luftqualitaet/de/baumaschinen/index.shtml (accessed on 21 March 2019).
- Feinstaub. Available online: https://www.umweltbundesamt.de/themen/luft/luftschadstoffe/feinstaub (accessed on 22 March 2019).
- Guinée, J.B. (Ed.) Handbook on Life Cycle Assessment: Operational Guide to the ISO Standards; Kluwer Academic Publishers: New York, NY, USA; Boston, CA, USA; Dordrecht, The Netherland; London, UK; Moscow, Russia, 2004. [Google Scholar]
- EQUALITY: WHY IT MATTERS. Available online: https://www.un.org/sustainabledevelopment/wp-content/uploads/2018/09/Goal-10.pdf (accessed on 27 March 2019).
- Verdienstunterschied Zwischen Frauen und Männern 2018 unverändert Bei 21%. Available online: https://www.destatis.de/DE/Presse/Pressemitteilungen/2019/03/PD19_098_621.html (accessed on 21 February 2020).
- Koopmans, R.; Veit, S.; Yemane, R. Ethnische Hierarchien in der Bewerberauswahl: Ein Feldexperiment zu den Ursachen von Arbeitsmarktdiskriminierung. Discussion Paper SP VI 2018-104; Wissenschaftszentrum Berlin für Sozialforschung: Berlin, Germany, 2018. [Google Scholar]
- The United Nations Educational, Scientific and Cultural Organization. UN System Task Team on the Post-2015 UN Development Agenda: Education and Skills for Inclusive and Sustainable Development Beyond 2015: Thematic Think Piece; The United Nations Educational, Scientific and Cultural Organization (UNESCO): Paris, France, 2012. [Google Scholar]
- Berufliche Bildung-Qualifizierte Fachkräfte für Nachhaltige Entwicklung. Available online: http://www.bmz.de/de/themen/bildung/berufliche_bildung/index.html (accessed on 3 April 2019).
- Carcillo, S.; Huillery, É.; L’Horty, Y. Prévenir la pauvreté par l’emploi, l’éducation et la mobilité. Notes du conseil d’analyse économique-Englischer Titel: Preventing Poverty Through Employment, Education and Mobility. Notes du conseil d’analyse économique 2017, 40, 1–12. [Google Scholar] [CrossRef] [Green Version]
- Skills and Employability. Available online: https://www.ilo.org/global/topics/dw4sd/themes/skills/lang--en/index.htm (accessed on 3 April 2019).
- Klein, K.J.; Knight, A.P. Innovation Implementation. Curr. Dir. Psychol. Sci. 2005, 14, 243–246. [Google Scholar] [CrossRef]
- Sadok, W.; Angevin, F.; Bergez, J.-E.; Bockstaller, C.; Colomb, B.; Guichard, L.; Reau, R.; Messéan, A.; Doré, T. MASC, a qualitative multi-attribute decision model for ex ante assessment of the sustainability of cropping systems. Agron. Sustain. Dev. 2009, 29, 447–461. [Google Scholar] [CrossRef] [Green Version]
- De Cauwer, B.; Fagot, M.; Beeldens, A.; Boonen, E.; Bulcke, R.; Reheul, D. Effectiveness of water permeable joint filling materials for weed prevention in paved areas. Weed Res. 2014, 54, 532–540. [Google Scholar] [CrossRef]
- De Cauwer, B.; Fagot, M.; Beeldens, A.; Boonen, E.; Bulcke, R.; Reheul, D. Reduced weed growth with different paving constructions. Weed Res. 2013, 54, 151–161. [Google Scholar] [CrossRef]
- Wirksamkeit Vegetationsunterdrückender Fugensande für Pflasterflächen: Kurzfassung des Endberichts zu den Forschungsvorhaben L068a_09 Bis L068d_09. Available online: https://www.dorfner.com/global/downloads/fachartikel-studien/LWG_Bericht_Fugensand.pdf (accessed on 15 May 2019).
- Vergleich der Vegetationsunterdrückenden Wirkung von Dansand® Mit Konventionellen Fugensanden: Kurzbericht zum Forschungsvorhaben L069_10. Available online: https://www.lwg.bayern.de/mam/cms06/landespflege/dateien/fugen_dansand_in.pdf (accessed on 16 May 2019).
- Kortenhoff, A.; Kempenaar, C.; Lotz, L.A.P.; Beltman, W.; den Boer, L. Rational Weed Management on Hard Surfaces: Phase I-Further Identification of Objectives and Elements That Should Be Part of a DSS and Certification System; Plant Research International B.V.: Wageningen, The Netherland, 2001. [Google Scholar]
- Technisches Produktblatt: No Growtm Dansand® Fugensand für Schmale Fugen. Unkrauthemmendes Fugenmaterial zur Neuverfugung und Instandsetzung von Pflaster und Plattenbelägen aus Beton und Naturstein. Available online: https://www.danfugensand.de/fileadmin/Relaunch_2015/PDFs/DE/2017/DANSAND_DE_Produktblatt_2016_Fugensand_web.pdf (accessed on 19 May 2019).
- Biodiversity and the Sustainable Development Goals. Available online: https://twitter.com/ipbes/status/1148231261158301696 (accessed on 22 August 2019).
- Communications Materials: SDG Poster and Individual Goals for Web and Print. Available online: https://www.un.org/sustainabledevelopment/news/communications-material/ (accessed on 3 September 2019).
- Guinée, J. Life Cycle Sustainability Assessment: What Is It and What Are Its Challenges. In Taking Stock of Industrial Ecology; Clift, R., Druckman, A., Eds.; Springer International Publishing: Cham, Switzerland, 2016; Volume 18, pp. 45–68. [Google Scholar]
- FAQs: Global Poverty Line Update. Available online: http://www.worldbank.org/en/topic/poverty/brief/global-poverty-line-faq (accessed on 13 June 2019).
- Unkräuter auf Wegen und Plätzen: Ein kleiner Ratgeber für Kommunen, Dienstleister und Hausbesitzer. Available online: https://www.julius-kuehn.de/media/Veroeffentlichungen/Flyer/Unkraeuter_auf_Wegen_und_Plaetzen.pdf (accessed on 26 July 2019).
Figure 1.
Depiction of an integrated exemplary life cycle scheme with an excerpt of the Sustainable Development Goal (SDG)-based sustainability assessment system, adapted from Maier [16] and Henzler et al. [2].

Figure 2.
Three-step procedure for methodology development.

Figure 3.
Schematic representation of the proposed indicator set as Tree of Sustainability, concept adapted from Sadok et al. [56].
Figure 3.
Schematic representation of the proposed indicator set as Tree of Sustainability, concept adapted from Sadok et al. [56].

Figure 4.
Scores of the impact category groups in the phase use, for * in the phases production and transport (joint filling sand), and use.
Figure 4.
Scores of the impact category groups in the phase use, for * in the phases production and transport (joint filling sand), and use.

Table 1.
Overview of the SDGs, assigned impact category groups and their impact categories, compiled from several publications [12,13,18,24,25,26,27].
| Sustainability Dimension | Impact Category Group | SDGs | Impact Category |
|---|---|---|---|
| Environmental | Climate | 13 | Climate change |
| Terrestrial ecosystem | 2, 12, 15 | Terrestrial acidification Terrestrial ecotoxicity Land use | |
| Aquatic ecosystem | 6, 12, 14 | Water depletion Eutrophication Freshwater aquatic ecotoxicity Marine aquatic ecotoxicity | |
| Abiotic resource depletion | 7, 8, 9, 12 | Abiotic resource depletion, elements Abiotic resource depletion, fossil | |
| Economic | Employment | 8 | Job creation Job creation: Quality of jobs created Working conditions |
| Energy supply and efficiency | 7, 8, 9 | Energy consumption Energy intensity | |
| Municipal life cycle costs | 16 | Municipal costs | |
| Poverty | 1 | Absolute poverty Income | |
| Social | Health and safety | 2, 3, 6, 11 | Accidents and health incidences Human toxicity |
| Education and skill development | 4 | Provision of education/trainings | |
| Participation in trainings | |||
| Use of educational offers | |||
| Effectiveness of education/training | |||
| Quality of education/training | |||
| Egalitarian society | 4, 5, 8, 10, 11, 16 | Inclusion | |
| Gender equality |
Table 2.
Scores in the impact category group climate, phases: Production and transport, use.
| Impact Category | Indicator | Score of Indicator | Score of Impact Category | Score of Impact Category Group |
|---|---|---|---|---|
| Climate change | Global warming potential | +1 | +1 | +1 |
Table 3.
Scores in the impact category group employment, phase: Use.
| Impact Category | Indicator | Score of Indicator | Score of Impact Category | Score of Impact Category Group |
|---|---|---|---|---|
| Job creation | Job creation | −1 | −1 | −1 |
Table 4.
Potential impact of the innovation in the impact category groups and potential contribution of the innovation to the achievement of the SDGs. Concept adapted from IPBES [63]. SDG Icons: [64].
| Impact Category Group | Sustainable Development Goals (SDGs) | Potential Contribution of the Innovation to the Achievement of the SDGs |
|---|---|---|
| Climate |  |  |
| Terrestrial ecosystem |  |  |
| Aquatic ecosystem |  |  |
| Abiotic resource depletion |  |  |
| Employment |  |  |
| Poverty |  |  |
| Energy supply and efficiency |  |  |
| Municipal life cycle costs |  |  |
| Health and safety |  |  |
| Egalitarian society |  |  |
| Education and skill development |  |  |
© 2020 by the authors. Licensee MDPI, Basel, Switzerland. This article is an open access article distributed under the terms and conditions of the Creative Commons Attribution (CC BY) license (http://creativecommons.org/licenses/by/4.0/).
Share and Cite
MDPI and ACS Style
Henzler, K.; Maier, S.D.; Jäger, M.; Horn, R. SDG-Based Sustainability Assessment Methodology for Innovations in the Field of Urban Surfaces. Sustainability 2020, 12, 4466. https://doi.org/10.3390/su12114466
AMA Style
Henzler K, Maier SD, Jäger M, Horn R. SDG-Based Sustainability Assessment Methodology for Innovations in the Field of Urban Surfaces. Sustainability. 2020; 12(11):4466. https://doi.org/10.3390/su12114466
Chicago/Turabian StyleHenzler, Kristina, Stephanie D. Maier, Michael Jäger, and Rafael Horn. 2020. "SDG-Based Sustainability Assessment Methodology for Innovations in the Field of Urban Surfaces" Sustainability 12, no. 11: 4466. https://doi.org/10.3390/su12114466
Note that from the first issue of 2016, this journal uses article numbers instead of page numbers. See further details here.