Exploring a Sustainable Cropping System in the North China Plain Using a Modelling Approach


1
College of Land Science and Technology, China Agricultural University, Beijing 100193, China
2
Shaanxi Provincial Land Engineering Construction Group Co., Ltd., Key Laboratory of Degraded and Unused Land Consolidation Engineering, the Natural Resources Ministry, Xi’an 710075, China
3
Soil Fertilizer and Environment Resources Institute, Heilongjiang Academy of Agriculture Sciences, Harbin 150086, China
*
Author to whom correspondence should be addressed.
Sustainability 2020, 12(11), 4588; https://doi.org/10.3390/su12114588
Submission received: 2 April 2020
/
Revised: 20 May 2020
/
Accepted: 2 June 2020
/
Published: 4 June 2020
(This article belongs to the Special Issue Sustainability and Production of Cropping Systems)
Abstract
:The North China Plain (NCP) is one of the most important grain production regions in China. However, it currently experiences water shortage, severe nonpoint source pollution, and low water and N use efficiencies (WUE and NUE). To explore sustainable agricultural development in this region, a field experiment with different cropping systems was conducted in suburban Beijing. These cropping systems included a winter wheat and summer maize rotation system for one year (WM), three harvests (winter wheat-summer maize-spring maize) in two years (HT), and continuous spring maize monoculture (CS). Novel ways were explored to improve WUE and NUE and to reduce N loss via the alternative cropping system based on the simulation results of a soil-crop system model. Results showed that the annual average yields were ranked as follows: WM > HT > CS. The N leaching of WM was much larger than that of HT and CS. WUE and NUE were ranked as follows: WM < HT < CS. Comprehensive evaluation indices based on agronomic and environmental effects indicated that CS or HT have significant potential for approaches characterized by water-saving, fertilizer-saving, high-WUE, and high-NUE properties. Once spring maize yield reached an ideal level HT and CS became a high-yield, water-saving, and fertilizer-saving cropping systems. Therefore, this method would be beneficial to sustainable agricultural development in the NCP.
1. Introduction
The North China Plain (NCP) is one of the most important grain production regions and one of the main irrigated regions in China. Winter wheat (WW), summer maize (SM), and spring maize (SPM) are three major grain crops in the NCP. The rotational pattern of WW-SM (two harvests in one year) is widely adopted in this region to maximize light and heat resources and achieve high grain production [1,2]. However, the NCP currently faces several problems, such as decreasing groundwater table, water resource shortage, and environmental pollution [1,3,4]. Water shortages have been caused by water consumption in agricultural areas, industrial sites, and private households. Although groundwater consumption in industrial sites has increased sharply, irrigation for agricultural production is responsible for approximately 70% of total groundwater consumption [5]. Fertilizers have been excessively applied by farmers to obtain a high crop yield. Currently, China is the largest consumer of N fertilizer worldwide [6]. N fertilizer consumption was 22.972 million tons in 2017 [7], and approximately 30% of this value was used in the NCP. Excessive N fertilizer input increases N losses through gaseous N emissions (N2O and NH3) and nitrate leaching and leads to a series of environmental problems, such as groundwater nitrate contamination, surface water eutrophication, and air pollution [8,9,10].
In the NCP, WW is planted in October of the first year and harvested in June of the next year. SM is planted after WW is harvested, and harvested in September of the same year. SPM is planted in April and harvested in September. A fallow period from October to the following April is then observed. However, the NCP has a typical monsoonal climate with 70% to 80% of annual rainfall concentrated from June to September, thus overlapping with the growing season of maize [4,11]. Given these climate characteristics, a high amount of irrigation water is essential for WW production [12,13]. However, no irrigation is generally required for SM, and only a slight amount is required for SPM. Over-pumping groundwater is one of the important causes of land surface subsidence [13,14,15] and ground fracturing in some regions in the NCP. Therefore, the government proposed that wheat production must be reduced or stopped [16]. Plants or cropping systems, such as SPM or a continuous SPM cropping system, with high water use efficiency (WUE) or N use efficiency (NUE) should be developed to save groundwater for irrigation and develop sustainable agriculture in the NCP. According to statistical data from 2010, the arable land areas of the WW-SM rotation system and the SPM monoculture system in Beijing were 27.2 × 10³ ha and 64.2 × 10³ ha. Compared with the situation in the 1990s, approximately 20% to 50% of the grain arable land has changed from the WW-SM rotation system to the continuous SPM monoculture system, and the area of the continuous SPM monoculture system has gradually increased from the outer suburbs to inner suburbs [1].
Previous research studies have mainly focused on comparing results regarding the fate of water and N, as well as crop growth, under different field management practices in the same cropping system [2,8,17]. However, few studies have considered the matching degree between water and heat resources required by crop growing development and weather conditions. Thus, in this study, a process-based water and nitrogen management model (WNMM), which was developed by Li et al. [17], was used to quantify the WUE and NUE of different cropping systems. The model is able to simulate water, carbon, and N dynamics, as well as plant growth under various agricultural management practices. It has been well calibrated and validated for the Chinese agroecosystems [17,18,19,20], specifically for the intensive cropping (wheat–maize) systems in the NCP, and these scholars studied water drainage, N leaching, and crop growth for different cropping systems based on this model. Therefore, considering water and N input, drainage, N leaching, yields, WUE, and NUE, this study aimed to (i) quantify the WUE and NUE of different cropping systems under optimized water and N inputs with the WNMM and (ii) provide suggestions for improving WUE and NUE, and developing sustainable agriculture in the NCP using an alternative cropping system.
2. Materials and Methods
2.1. Study Area
Field experiments were conducted in the experimental station of China Agricultural University. Dongbeiwang Village is located in the north of the NCP, in Beijing (39.5° N, 116.2° E), at an elevation of 50 m and a groundwater depth of 18–20 m. The climate is a typical warm temperate continental monsoon climate with an annual average air temperature of 11.5 °C and an annual mean precipitation of 540 mm. Approximately 70% to 80% of precipitation occurs from June to September (Figure 1). The typical cropping system is WW-SM in one year. Crops are flood irrigated with groundwater, which has slight nitrate pollution (3.9 mg NO3−-N L−1 and 0.55 mg NH4+-N L−1) [21]. The soil in the study area comprises 22.3 g kg−1 organic matter, 1.1 g kg−1 total N, 42 mg kg−1 Olsen P, and 168 mg kg−1 exchangeable K. The particle size, bulk density, water content at field capacity and permanent wilting point of the soil are listed in Table 1.
2.2. Experimental Design
The field experiments were conducted from October 2004 to September 2006 for three different cropping systems, including two harvests in one year (winter wheat–summer maize, WM), three harvests in two years (winter wheat–summer maize–spring maize, HT), and one harvest in one year (spring maize, CS). Winter wheat (WW) was sown in late October and harvested in mid-June. Summer maize (SM) was sown and harvested in mid-June and early October, respectively. Compared with summer maize, spring maize had a long crop growth period, while summer maize was sown and harvested in late April and early September, respectively. The size of each experiment plot was 12 ×7 m, and plots were replicated four times in randomized block designs.
In all the cropping systems, optimized water and fertilizer management was conducted on the basis of soil moisture monitoring. Irrigation was performed to maintain soil moisture between 50% and 80% of the available water capacity based on the measured soil water content in the rooting zone. The fertilization rate was determined by considering crop demand and the soil N supply method [22,23,24]. Crop N demand was determined by the crop target yield. The target values of the total N uptake for WW and SM were 190 and 240 kg N ha−1, respectively. Traditional farmers’ practice involves using surface-applied urea before heavy rainfall or flooding irrigation. In this study, P fertilizer was applied as a basal fertilizer at a rate of 40 kg ha−1 before crops were planted. Water and N management is shown in Table 2.
In each plot, soil water contents in five soil layers (0–15, 15–30, 30–60, 60–90, and 90–120 cm) were measured every four days using TDR (Time Domain Reflectometry) probes (MP917, ESI, Canada). Soil inorganic N content was measured at key crop growth stages of sowing, jointing, flowering, and maturation. Soil samples were collected at a depth of 90 cm in 30-cm intervals using a soil auger. Five cores per plot were collected, and those samples in the same soil layer were uniformly mixed. The soil samples were extracted with 0.01 mol L−1 CaCl2 (10:1, water/soil) and filtered before NO3−-N and NH4+-N concentrations were determined with a continuous-flow analyzer (TRAACS 2000, Bran and Luebbe, Germany). A 1 m2 plant sample was selected for dry matter (DM) and leaf area index (LAI) measurement at key crop growth stages. Winter and maize yields were measured at three quadrats with a size of 20 m2 each.
2.3. Model Description
A water and N management model (WNMM) was used to simulate the water dynamics and N fates. This model is able to simulate the key processes of water movement and N cycle, including hydrodynamics, water-level fluctuation, soil temperature, C and N cycles in a soil and crop system, crop growth, and agricultural management. This model has been successfully applied at sites in the north of the NCP [17,18,19,20], and a detailed model description is available in another study [17].
The input data in the model include geographic information, soil properties (hydrodynamics and basic physical and chemical properties), land-use type, meteorological data (daily data), crop biological data (energy conversion index, harvest index, maximum LAI, and maximum root depth index), agricultural management measures (cultivation, sowing date, total amounts of irrigation and fertilizer, and harvest date), and controlling data (start date, simulate period, and initial soil conditions).
The model was run on a daily time step and driven by variables of meteorological and crop biological data. In the model, the Penman–Monteith method was used to estimate the potential evapotranspiration (ET) with a height of 40 cm alfalfa (Medicago sativa L.) [25]. Considering ground cover, LAI, and crop root density distribution in the soil profile, soil evaporation and plant transpiration were predicted separately. A numerical solution of a simple tipping-bucket water balance model was used to calculate the dynamic soil water content and flux [26]. Considering the water stress response function, root water uptake was simulated with the van Genuchten model [27]. An empirical solute transport equation, which was adopted in the EPIC model, was used to govern the transport of nitrate, ammonium, and urea [28]. Average daily soil temperatures with depth were estimated using the empirical equation of Arnold et al. (1993) [29]. The crop growth module was a simplification of the EPIC crop model, which applies the concepts of phenological crop development based on daily accumulated heat units, harvest index for partitioning grain yield, Monteith’s approach for potential biomass, and stress adjustments for water, temperature, and N availability in the root zone of the soil profile.
The model can simulate the following outputs: soil water content, water flux, mineral N solute concentration (NH4+ and NO3−), soil profile temperature, soil evaporation, crop transpiration, crop resides, denitrification rate, ammonia volatilization rate, nitrous oxide emissions, N leaching, crop uptake, LAI, and crop biomass accumulation.
2.4. Model Parameters
Initial conditions: The initial contents of water, N mineral, Olsen P, cation exchange, and organic matter were set on the basis of field measurements made before maize was planted.
Boundary conditions: Potential soil evaporation or water infiltration-controlled boundary was used for the surface [17]. A low boundary was set as free drainage since the groundwater table was 18–20 m at the site.
Meteorological data: These data included daily solar radiation, minimum temperature, maximum temperature, wind speed, humidity, and rainfall. They were collected from an automatic weather station located at the experimental site.
Hydraulic parameters: These parameters included residual water content, wilting point water content, field capacity, saturated water content, and saturated hydraulic conductivity in each soil layer. The parameters were all measured. Considering the strongly spatial variability of soil saturated hydraulic conductivity, in order to ensure the simulated soil water contents matched well with the measured values, we only adjusted hydraulic conductivity during the processes of model calibration and validation. These data are summarized in Table 1.
Carbon and N transformation: The rate constants for mineralization, immobilization, volatilization, and denitrification should be specified for N transformations. Data published by Li et al. were used to define these N transformation rates [30].
Crop development parameters: The maximum crop height was set to 1 m for WW and 2.5 m for SM and SPM. The maximum root depths of crops were set to 1.2 m. The optimal and minimum temperatures for WW development were set to 18 °C and 0 °C, respectively. The optimal and minimum temperatures for SM and SPM development were set to 25 °C and 8 °C, respectively. The accumulated effective temperatures for WW, SM, and SPM from emergence to maturity were set to 2100 °C, 1700 °C, and 2150 °C, respectively. The top of the wheat and maize canopies received photosynthetic active radiation of 0.30 and 0.38 J m−2 s−1, respectively. Normal N fractions in WW biomass at emergence, at 50% maturity, and at full maturity were set to 0.035, 0.015, and 0.006 kg N kg−1 biomass, respectively. Those in SM were set to 0.0350, 0.0100, and 0.0075 kg N kg−1, and those in SPM were set to 0.0250, 0.0125, and 0.0075 kg N kg−1, respectively [31]. The harvest indices for WW, SM, and SPM were set to 0.44, 0.49, and 0.45, respectively. The maximal LAIs were set to 6.0 for WW and SM and 8.0 for SPM. Residual LAI was set on the basis of field measurement. The crop root uptake NH4+-N and NO3−-N coefficients were set to 0.50.
2.5. Model Performance Criteria
The developer of the WNMM suggested that calibration should focus on the biological parameters of crop growth [17]. This study adopted a ‘trial and error’ method to calibrate the model. Soil hydraulic parameters were all directly measured. Those parameters could be used as the initial input value. First, considering the strongly spatial variability of soil saturated hydraulic conductivity, the saturated hydraulic conductivity was slightly adjusted, and the biological parameters of the crop growth were calibrated. The hydraulic parameters and solute transform parameters were calibrated. The correlation coefficient, normalized root-mean-square error (nRMSE) and Nash–Sutcliffe modeling efficiency (E) [32] were used to evaluate the agreement between the predicted and observed data.
(i) Normalized root-mean-square error (nRMSE):
(ii) Nash–Sutcliffe modeling efficiency (E) [32]:
where Oi is the observed value, Pi is the predicted value corresponding to the observed value Oi, and n is the number of data pairs. Here, O is the mean of the observed data. nRMSE ranges from 0 to 1. The closer the nRMSE value is to 0, the more accurate the model. Some studies suggested that an nRMSE < 15% represents “good” agreement; 15%–30% “moderate” agreement; and >30% “poor” agreement. E ranges from −∞ to 1, and E = 0 indicates that the model predictions are the same as the mean of the observed data. The values of E ≥ −1.0 are the minimum threshold values for soil output evaluation [33].
3. Results and Discussion
3.1. Model Calibration and Validation
The field experiment was conducted from October 2004 to September 2006. The datasets from the traditional WM cropping system were used to calibrate the WNMM. Thereafter, the model was validated using the field experiment data from other cropping systems. The nitrification process is dominant in upland soils in the NCP, so accumulated inorganic N in the soil profiles exists mainly in the form of NO3−-N. Field experimental results also showed that NO3−-N concentrations were much higher than NH4+-N concentrations [17,19,34]. The measured NH4+-N concentrations were mostly <1 mg kg−1 in our study. Thus, the movement of soil NH4+-N was disregarded.
Figure 2 illustrates the comparison of the simulated and measured soil volumetric water contents at the observed depths. The soil water content in the topsoil was missing during the soil freezing period because the TDR only measures liquid water content. The nRMSE of the simulated soil water contents generally decreased from 29% in the topsoil to 5% in deep soil depths for the cropping systems. The E ranged from 0.18 to 0.90. The large simulation error of the topsoil water content has been previously observed [19,35,36]. This phenomenon may be caused by two reasons. First, the WNMM is a one-dimension model that is less responsive to surface water dynamics caused by irrigation and rainfall. Second, the change in the top soil layer water content was sensitive to soil surface conditions, such as ground roughness and presence of macro-pores, leading to less reliable simulated results.
Figure 3 shows the comparison of the simulated and measured soil NO3−-N at the observed depths. The simulated soil NO3−-N concentration in all of the cropping systems resulted in nRMSE that varied from 10% to 23% in different soil layers. The E ranged from 0.01 to 0.28. Generally speaking, the simulation of soil NO3−-N concentration was not as good as that of soil water content, which is similar to the research results of many scholars [2,19,20,35,36]. According to the evaluation threshold of some studies [33], these results were all acceptable. Figure 4 and Figure 5 illustrate the comparison of the simulated and measured DM and LAI under different cropping systems. The nRMSEs of the simulated DM and the simulated LAI varied from 16% to 18% in all of the cropping systems and from 10% to 14%, respectively. The E for DM and LAI ranged from 0.69 to 0.98 and from 0.89 to 0.91. The simulated DM and LAI had better performance than those of soil water content and soil NO3−-N concentration.
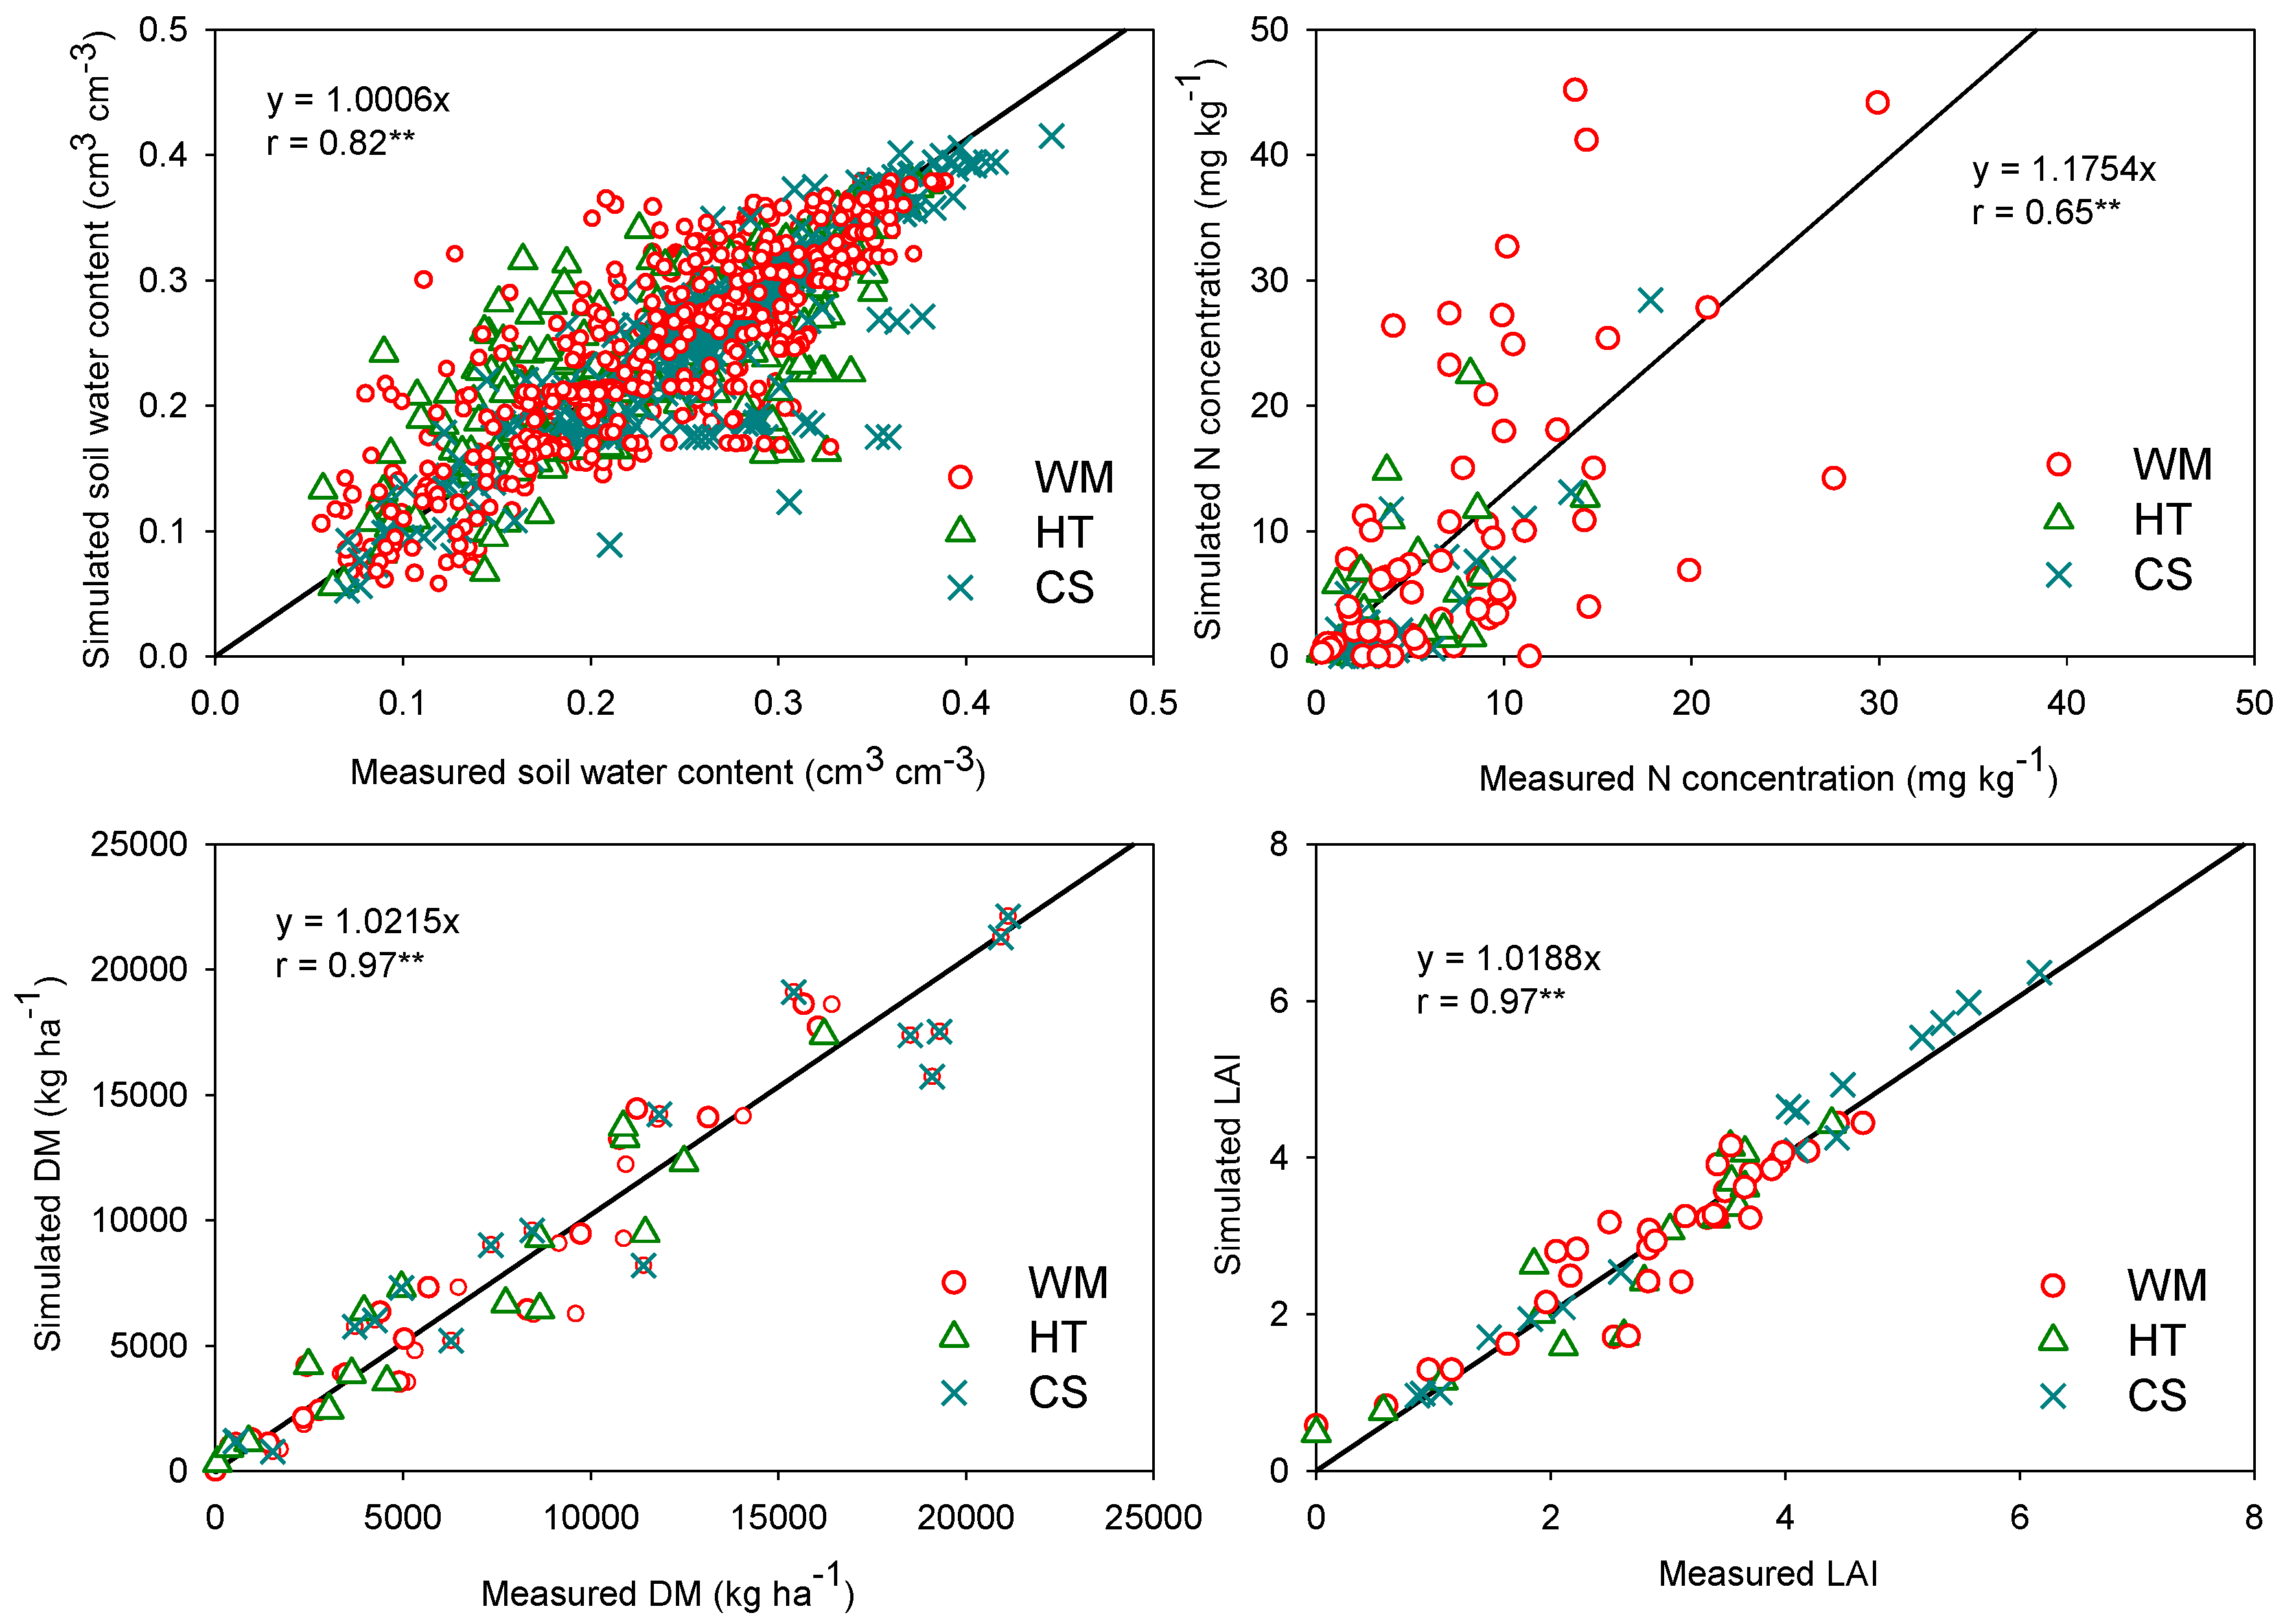
The correlations between the measured and simulated volumetric water contents, nitrate concentrations, DM, and LAI in all of the cropping systems are shown in Figure 6. The linear regression correlation coefficients (r) of the volumetric water contents, nitrate concentrations, DM, and LAI were 0.82, 0.65, 0.97, and 0.96, respectively. All of these parameters were highly significant (p < 0.01). All of the slopes of the regressions of the volumetric water contents, N concentrations, DM, and LAI were close to 1.
Those results showed that the model performed reasonably well in predicting the soil water content, NO3−-N, DM, and LAI. The simulated crop yields in all of the cropping systems were also close to the measurements. Therefore, the WNMM can be used to simulate water dynamics, N fates and crop growth under different water management schemes under different cropping systems.
Considering the cost and time required, we did not measure N leaching and gaseous N loss. Thus, there are limitations in the model calibration and validation. However, a sensitivity analysis was carried out by the model developer by running WNMM with the value of a single parameter or variable altered by 10%, while all other selected parameters and variables remained constant [17]. The results indicated that meteorological data (such as average, minimum, and maximum air temperature and relative humidity) had the most effect on simulated results. Hydraulic parameters such as saturated soil water content, field capacity, and wilting point had strong effects on all output variables, while soil saturated hydraulic conductivity had slight effects on all output variables. These parameters mainly affected the total N denitrification and total N2O emission. In general, the effects of other parameters on the outputs of water and N can be ignored. In this study, meteorological data was from an automatic weather station located at the experimental site, and soil hydraulic parameters were all mainly measured, so the uncertainty of model outputs could be controlled.
3.2. Water Balance and Water Use Efficiency
The management practices of water and N on WM, HT, and CS were optimal. The effect of the difference in these parameters on water and N management was excluded. Thus, the effect of cropping systems on water and N loss was evaluated. Based on the model output, water balance and nitrogen balance in a 1.2-m soil profile for different cropping systems in two years are shown in Table 3 and Table 4, respectively. For annual water balance, drainage mainly occurred during the maize growth season. Drainage during the SPM season in 2006 was significantly higher than that in 2005, mainly because precipitation during the SPM season in 2006 was much higher than that in 2005. The results indicated that heavy rainfall was a key factor in water drainage, which has also been observed in other studies [13,19]. Dai et al. [37] showed that solar radiation in 2006 was lower by at least 12% compared with that in 2005 at this experimental site. Thus, in our study, the yields of WW, SM, and SPM in 2006 were significantly lower compared with those in 2005.
Precipitation of 957, 911 and 798 mm for WM, HT and CS cropping systems was detected during the crop growth period. The amounts of irrigation for WM, HT and CS were 720, 545 and 265 mm, respectively. The amount of irrigation for HT and CS was obviously reduced compared with that for WM. The amount of irrigation for CS was only 37% of the amount of irrigation for WM. Therefore, the CS system showed obvious advantages in decreasing irrigation water. For water consumption, the main water loss was ET, which was 1405, 1160 and 827 mm for WM, HT, and CS, respectively. The amount of drainage for HT was bigger than those of WM and CS. Although the irrigation amount of CS was less than those of WM and HT, the drainage factor was larger in CS than those of HT and WM. Precipitation was the main source of water input. Therefore, the irrigation use efficiency of CS was not decreased. Water balance was positive on both WM and HT but negative on CS. The results indicated that CS consumed the soil water stored in the soil profile in addition to the irrigation and precipitation compared with WM and HT. The total yields of HT and CS in the two years were 85.3% and 76.5% of that of WM, respectively. The yield of the WM system was the highest among the three cropping systems. However, the WUE of CS was the highest among the three cropping systems. CS and HT show great potential for reducing water consumption and improving WUE [1,3,11,38].
3.3. N Balance and N Use Efficiency
In the three cropping systems, N leaching mainly occurred during the maize growing season. The amount of N leaching was related to the amount of precipitation. In the wet year (2006), N leaching was 65.7 kg N ha−1 during the SM season for WM. However, given that the fertilization rate was minimal on HT and CS compared with that on WM, N leaching almost did not occur during the SPM season on HT and CS. This result indicated that the SPM cropping system was effective in decreasing the potential of N leaching during the rainy season. The cropping systems provided a new strategy for decreasing N leaching during the rainy season. Some studies reported that an alternative cropping system was a potentially useful practice for mitigating N leaching and increasing NUE [1,11,39]. Our results agreed with those reports.
The amounts of fertilization were 540, 335 and 165 kg N ha−1 in two years for WH, HT, and CS, respectively. The fertilization rate for CS was only 31% of that for WM. Considering the water and N input for CS, this result showed the potential of developing a water- and fertilizer-saving cropping system. Given that N leaching for WM, HT, and CS were minimal, ammonia volatilization became the main N loss process in these three cropping systems, and their amounts of ammonia volatilization accounted for 19%, 17%, and 31% of the fertilization rate, respectively. N2O emissions (denitrification) from the three cropping systems were ranked WM > HT > CS, but no remarkable differences were observed. This result was also lower than the average N2O emissions from N fertilizer upland crops in China of 0.6% [40]. In addition, crop uptake was the largest sink of N and reached 792, 569 and 446 kg N ha−1 under WM, HT, and CS, respectively. The N balance was negative on WM, HT, and CS, indicating that the optimized fertilization not only decreased N accumulation in the soil profile but also consumed the N accumulated from the previous season. Compared with WH, HT and CS showed minimal reduction of soil N residue and significant reduction of N leaching loss. However, N use efficiency was 32 and 36 kg kg−1 N−1 for HT and CS, respectively, which were much higher than 24 kg kg−1 N-1 for WM. Fertilizer N use efficiency reached 44, 60, and 109 kg kg−1 N−1 for WM, HT, and CS, respectively, which showed that HT and, in particular, CS, could improve NUE. Considering agricultural and environmental effects under different systems, we found that HT and, in particular, CS, could also achieve high WUE and NUE. Similar results have been reported previously [11,38].
3.4. Comprehensive Evaluation of Different Cropping Systems
Considering the input and output on WM, HT, and CS, the amounts of irrigation and fertilization on HT decreased, whereas their WUEs and NUEs increased compared with those on WM. However, the yield on HT was not very satisfactory compared with that on WM. Similarly, the amount of irrigation and fertilization on CS was reduced dramatically, whereas WUEs and NUEs were improved compared with those on WM. Unfortunately, the yield on CS was only 17,976 kg ha−1 in both years and was much lower than the 23,496 kg ha−1 on WM in two years. To compare the advantages and disadvantages of all the cropping systems, we referred to the method of Dai et al. [37] and evaluated results using the comprehensive evaluation index (CEI). First, we selected grain yield, WUE, NUE, and N leaching as the comprehensive evaluation indices, with weight coefficients set to +5, +3, +2, and −5, respectively [19]. Second, each index was normalized and then multiplied by its weight coefficient to obtain the CEI. The MW, HT, and CS were 3.65, 8.36, and 8.69, respectively. The results showed that the CEI of HT or CS was higher than that of WM.
Although water and fertilizer resource consumption and environmental effects were perfect on CS, developing this cropping system is impossible in the NCP if food safety cannot be guaranteed. However, SPM has a high yield potential because of its long growth period and the sufficient light and heat resources in the NCP. The potential yield of SPM can reach up to 14–23 t ha−1 in this region [37,41]. In general, SPM was planted by the end of April in this region under farmers’ practice. However, some scholars have found that the yield can be influenced by sowing date. The effect of sowing date on yield in this region has been previously studied [2,3,37]. The results showed that yield will be increased by >10% if sowing date is delayed to the middle or end of May. Considering that the yield of SPM can reach a high level by optimizing the SPM cultivar and management practice, CS or HT may be a good cropping system.
On the basis of the aforementioned studies, we simulated and obtained the highest yield of SPM, which was only influenced by sowing date. According to the simulated results of the WNMM, the highest yield of SPM was achieved when the sowing date was delayed by 17 days. The highest yields reached 11,527 and 8710 kg ha−1, which increased by 11% and 13% in 2005 and 2006, respectively. In China, however, the average yield of maize is only half of the average yield obtained in developed countries, and the yield can be further increased [11,42]. If the SPM yield could be increased by improving water and N management, and using good cultivars and other agricultural management techniques, CS or HT would be a good cropping system in the NCP to achieve high yield, save water and fertilizer, and efficiently use water and N.
In addition, it is very difficult to compare ET, WUE, and water balance under different cropping systems when the environmental/meteorological variables are different due to seasonality/variability. Recently, Kukal and Irmak [43] established a benchmark to maintain consistent conditions across four crop species to justify fair comparisons of crop water use, and the results would aid informed crop selection by producers in light of water use across these crops. The method can be considered in future study.
4. Conclusions
The WNMM was calibrated and validated to simulate water and N dynamics on three cropping systems in the NCP. The simulated results indicated that the simulated soil water contents, inorganic nitrate concentrations, DM, and LAI, as well as yield, were all consistent with the measured data. This model could be used to simulate the transport of water and N and the growth of crops for different cropping systems in the NCP.
Drainage was almost the same among WM, HT, and CS, which were under reduced water and N inputs. N leaching almost did not occur on HT and CS but was severe on WM. The yields showed the following trend: WM > HT > CS. WUE and NUE had the following pattern: WM < HT < CS. The potential yield of SPM was high in the NCP because of sunlight resources. The yield would be increased by improving water and N management practices, using good cultivars, and applying other agricultural production techniques. HT or CS might be a sustainable cropping system in the NCP, not only because of its high-yielding, water-saving, and fertilizer-saving properties but also its highly efficient use of water and N.
Author Contributions
Data curation, H.W.; writing–original draft preparation, H.W.; writing–review and editing, K.H. and B.L.; supervision, K.H.; project administration and resources, L.J. All authors have read and agreed to the published version of the manuscript.
Funding
This research was funded by the national key research and development program of China, grant number 2016YFD0800102 and the Program for Changjiang Scholars and Innovative Research Team in University, grant number IRT0412.
Conflicts of Interest
The authors declare no conflict of interest.
References
- Sun, Q.P.; Kröbel, R.; Müller, T.; Römheld, V.; Cui, Z.L.; Zhang, F.S. Optimization of yield and water-use of different cropping systems for sustainable groundwater use in North China Plain. Agric. Water Manag. 2011, 98, 808–814. [Google Scholar] [CrossRef]
- Li, Z.J.; Hu, K.L.; Li, B.G.; He, M.R.; Zhang, J.W. Evaluation of water and N use efficiencies in a double cropping system under different integrated management practices based on a model approach. Agric. Water Manag. 2015, 159, 19–34. [Google Scholar] [CrossRef]
- Binder, J.; Graeff, S.; Link, J.; Claupein, W.; Liu, M.; Dai, M.H.; Wang, P. Model-based approach to quantify production potentials of summer maize and spring maize in the North China Plain. Agron. J. 2008, 100, 862–873. [Google Scholar] [CrossRef]
- Yang, X.L.; Chen, Y.; Pacenka, S.; Gao, W.; Ma, L.; Wang, G. Effect of diversified crop rotations on groundwater levels and crop water productivity in the North China Plain. J. Hydro. 2015, 522, 428–438. [Google Scholar] [CrossRef]
- Zhang, Y.Q.; Kendy, E.; Yu, Q.; Liu, C.M.; Shen, Y.J.; Sun, H.Y. Effect of soil water deficit on evapotranspiration, crop yield, and water use efficiency in the North China Plain. Agric. Water Manag. 2004, 64, 107–122. [Google Scholar] [CrossRef]
- Zhu, Z.L.; Chen, D.L. Nitrogen fertilizer use in China—Contributions to food production, impacts on the environment and best management strategies. Nutr. Cycl. Agroecost. 2002, 63, 117–127. [Google Scholar] [CrossRef]
- National Bureau of Statistics of China. China Statistical Yearbook 2018; China Statistics Press: Beijing, China, 2018.
- Ju, X.T.; Xing, G.X.; Chen, X.P.; Zhang, S.L.; Zhang, L.J.; Liu, X.J.; Cui, Z.L.; Yin, B.; Christie, P.; Zhu, Z.L.; et al. Reducing environmental risk by improving N management in intensive Chinese agricultural systems. Proc. Natl. Acad. Sci. USA 2009, 106, 3041–3046. [Google Scholar] [CrossRef] [PubMed] [Green Version]
- Zhang, M.; Tian, Y.H.; Zhao, M.; Yin, B.; Zhu, Z.L. The assessment of nitrate leaching in a rice–wheat rotation system using an improved agronomic practice aimed to increase rice crop yields. Agric. Ecosyst. Environ. 2017, 241, 100–109. [Google Scholar] [CrossRef]
- Yu, C.Q.; Huang, X.; Chen, H.; Godfray, H.C.J.; Wright, J.S.; Hall, J.W.; Gong, P.; Ni, S.Q.; Qiao, S.C.; Huang, G.R.; et al. Managing N to restore water quality in China. Nature 2019, 567, 516–520. [Google Scholar] [CrossRef]
- Leghari, S.H.; Hu, K.L.; Liang, H.; Wei, Y.C. Modelling water and nitrogen balance of different cropping systems in the North China Plain. Agronomy 2019, 9, 696. [Google Scholar] [CrossRef] [Green Version]
- Chen, C.; Wang, E.L.; Yu, Q. Modeling wheat and maize productivity as affected by climate variation and irrigation supply in North China Plain. Agron. J. 2010, 102, 1037–1049. [Google Scholar] [CrossRef] [Green Version]
- Liang, H.; Qin, W.; Hu, K.L.; Tao, H.B.; Li, B.G. Modelling groundwater level dynamics under different cropping systems and developing groundwater neutral systems in the North China Plain. Agric. Water Manag. 2019, 213, 732–741. [Google Scholar] [CrossRef]
- Kendy, E.; Gerard-Marchant, P.; Walter, M.T.; Zhang, Y.; Liu, C.; Steenhuis, T.S. A soil-water-balance approach to quantify groundwater recharge from irrigated cropland in the North China Plain. Hydrol. Process. 2003, 17, 2011–2031. [Google Scholar] [CrossRef]
- Sun, H.Y.; Zhang, X.Y.; Wang, E.L.; Chen, S.Y.; Shao, L.W. Quantifying the impacts of irrigation on groundwater reserve and crop production-a case study in the North China Plain. Eur. J. Agron. 2015, 70, 48–56. [Google Scholar] [CrossRef]
- Ministry of Agriculture and Rural Affairs. Notice of the 10 Ministries and Commissions of the Ministry of Agriculture on the Issuance of a Pilot Program to Explore the Implementation of the Arable Land Rotation System. 2017. Available online: http://www.moa.gov.cn/nybgb/2016/diqiqi/201711/t20171128_5921712.htm (accessed on 28 November 2017).
- Li, Y.; White, R.E.; Chen, D.L.; Zhang, J.B.; Li, B.G.; Huang, Y.F.; Edis, R. A spatially referenced water and nitrogen management model (WNMM) for (irrigated) intensive cropping systems in the North China Plain. Ecol. Model. 2007, 203, 395–423. [Google Scholar] [CrossRef]
- Sun, B.; Chen, D.L.; Li, Y.; Wang, X.X. Nitrogen leaching in an upland cropping system on an acid soil in subtropical China: Lysimeter measurements and simulation. Nutr. Cycl. Agroecosyst. 2008, 81, 291–303. [Google Scholar] [CrossRef]
- Hu, K.L.; Li, Y.; Chen, W.P.; Chen, D.L.; Wei, Y.P.; Edis, R.; Li, B.G.; Huang, Y.F.; Zhang, Y.P. Modeling nitrate leaching and optimizing water and nitrogen management under irrigated maize in Desert Oases in Northwestern China. J. Environ. Qual. 2010, 39, 667–677. [Google Scholar] [CrossRef] [PubMed]
- He, Y.; Hu, K.L.; Wang, H.; Huang, Y.F.; Chen, D.L.; Li, B.G.; Li, Y. Modeling of water and nitrogen utilization of layered soil profiles under a wheat-maize cropping system. Math. Comput. Model. 2013, 58, 596–605. [Google Scholar] [CrossRef]
- Yu, H.M.; Li, Z.Z.; Gong, Y.S.; Mack, U.; Feger, K.H.; Stahr, K. Water drainage and nitrate leaching under traditional and improved management of vegetable-cropping systems in the North China Plain. J. Plant Nutr. Soil Sci. 2006, 169, 47–51. [Google Scholar] [CrossRef]
- Chen, X.P.; Zhang, F.S.; Römheld, V.; Horlacher, D.; Schulz, R.; Böning-Zilkens, M.; Wang, P.; Claupein, W. Synchronizing N supply from soil and fertilizer and N demand of winter wheat by an improved Nmin method. Nutr. Cycl. Agroecosyst. 2005, 74, 91–98. [Google Scholar] [CrossRef]
- Zhao, R.F.; Chen, X.P.; Zhang, F.S.; Zhang, H.L.; Schroder, J.; Romheld, V. Fertilization and nitrogen balance in a wheat–maize rotation system in North China. Agron. J. 2006, 98, 938–945. [Google Scholar] [CrossRef]
- Cui, Z.L.; Chen, X.P.; Miao, Y.X.; Li, F.; Zhang, F.S.; Li, J.L.; Ye, Y.L.; Yang, Z.P.; Zhang, Q.; Liu, C.S. On-farm evaluation of winter wheat yield response to residual soil nitrate-N in North China Plain. Agron. J. 2008, 100, 1527–1534. [Google Scholar] [CrossRef]
- Allen, R.G.; Pereira, L.S.; Raes, D. Crop evapotranspiration: Guidelines for computing crop water requirements. FAO Irrigation and Drainage Pap. 56. Food Agric. Organ. United Nations Rome 1998, 300, D05109. [Google Scholar]
- Scotter, D.R.; Clothier, B.E.; Turner, M.A. The soil water balance in a fragiaqualf and its effect on pasture growth in Central New Zealand. Aust. J. Soil Res. 1979, 17, 455–465. [Google Scholar] [CrossRef]
- Van Genuchten, M.T. A Numerical Model for Water and Solute Movement in and Below the Root Zone; United States Department of Agriculture Agricultural Research Service US Salinity Laboratory: California, CA, USA, 1987.
- Williams, J.R. The EPIC model. In Computer Models of Watershed Hydrology; Water Resources Publications: Colorado, CO, USA, 1995; pp. 909–1000. [Google Scholar]
- Arnold, J.G.; Engel, B.A.; Srinivasan, R. Continuous Time Grid Cell Watershed Model. Application of Advanced Information Technologies. In Effective Management of Natural Resources; In-formation and Electrical Technologies; ASAE: Michigan, MI, USA, 1993. [Google Scholar]
- Li, X.X.; Hu, C.S.; Delgado, J.A.; Zhang, Y.M.; Ouyang, Z.Y. Increased nitrogen use efficiencies as a key mitigation alternative to reduce nitrate leaching in North China Plain. Agric. Water Manag. 2007, 89, 137–147. [Google Scholar] [CrossRef]
- Peng, Y.F.; Niu, J.F.; Peng, Z.P.; Zhang, F.S.; Li, C.J. Shoot growth potential drives N uptake in maize plants and correlates with root growth in the soil. Field Crops Res. 2010, 115, 85–93. [Google Scholar] [CrossRef]
- Nash, J.E.; Sutcliffe, J.V. River flow forecasting through conceptual models. Part I. A discussion of principles. J. Hydrol. 1970, 10, 282–290. [Google Scholar] [CrossRef]
- Yang, J.M.; Yang, J.Y.; Liu, S.; Hoogenboom, G. An evaluation of the statistical methods for testing the performance of crop models with observed data. Agric. Syst. 2014, 127, 81–89. [Google Scholar] [CrossRef]
- Ju, X.T.; Liu, X.J.; Zhang, F.S.; Roelcke, M. Nitrogen fertilization, soil nitrate accumulation, and policy recommendations in several agricultural regions of China. Ambio 2004, 33, 300–305. [Google Scholar] [CrossRef]
- Fang, Q.X.; Ma, L.W.; Yu, Q.; Malone, R.W.; Saseendran, S.A.; Ahuja, L.R. Modeling nitrogen and water management effects in a wheat-maize double-cropping system. J. Environ. Qual. 2008, 37, 2232–2242. [Google Scholar] [CrossRef] [Green Version]
- Hu, K.L.; Li, B.G.; Chen, D.L.; Robert, E. Simulation of nitrate leaching under irrigated maize on sandy soil in desert oasis in Inner Mongolia, China. Agric. Water Manag. 2008, 95, 1180–1188. [Google Scholar] [CrossRef]
- Dai, M.H.; Tao, H.B.; Liao, S.H.; Wang, L.N.; Wang, P. Estimation and analysis of maize potential productivity based on CERES-Maize model in the North China Plain. Trans. CSAE 2008, 24, 30–36, (In Chinese with English Abstract). [Google Scholar]
- Liu, M.; Tao, H.B.; Wang, P.; Lv, L.H.; Zhang, Y.J.; Zhang, L. Water consumption, soil water content variation and water utilization efficiency of different cropping system in China. J. Soil Water Conser. 2008, 22, 116–120, (In Chinese with English Abstract). [Google Scholar]
- Wu, Y.C.; Zhou, S.L.; Wang, Z.M.; Feng, H.Y.; Lu, L.Q.; Wang, R.Z. Recovery of Residual Fertilizer-Nitrogen by Wheat in a Winter Wheat–Summer Maize Rotation in the North China Plain: A Soil Column Study. Agron. J. 2009, 101, 925–932. [Google Scholar] [CrossRef]
- Xing, G.X. N2O emission from cropland in China. Nutr. Cycl. Agroecosyst. 1998, 52, 249–254. [Google Scholar] [CrossRef]
- Zhao, C.S. Analysis of potential high yield for maize in Beijing rural area. Beijing Agric. 1998, 5, 3–6, (In Chinese with English Abstract). [Google Scholar]
- Luo, J.M.; Shen, Y.J.; Qi, Y.Q.; Zhang, Y.C.; Xiao, D.P. Evaluating water conservation effects due to cropping system optimization on the Beijing-Tiajin -Hebei plain, China. Agric. Syst. 2018, 159, 32–41. [Google Scholar] [CrossRef]
- Kukal, M.S.; Irmak, S. Characterization of water use and productivity dynamics across four C3 and C4 row crops under optimal growth conditions. Agric. Water Manag. 2020, 227, 105840. [Google Scholar] [CrossRef]
Figure 1.
Monthly mean temperature and rainfall in 1988 and 2006 at the Dongbeiwang site of Beijing.
Figure 1.
Monthly mean temperature and rainfall in 1988 and 2006 at the Dongbeiwang site of Beijing.
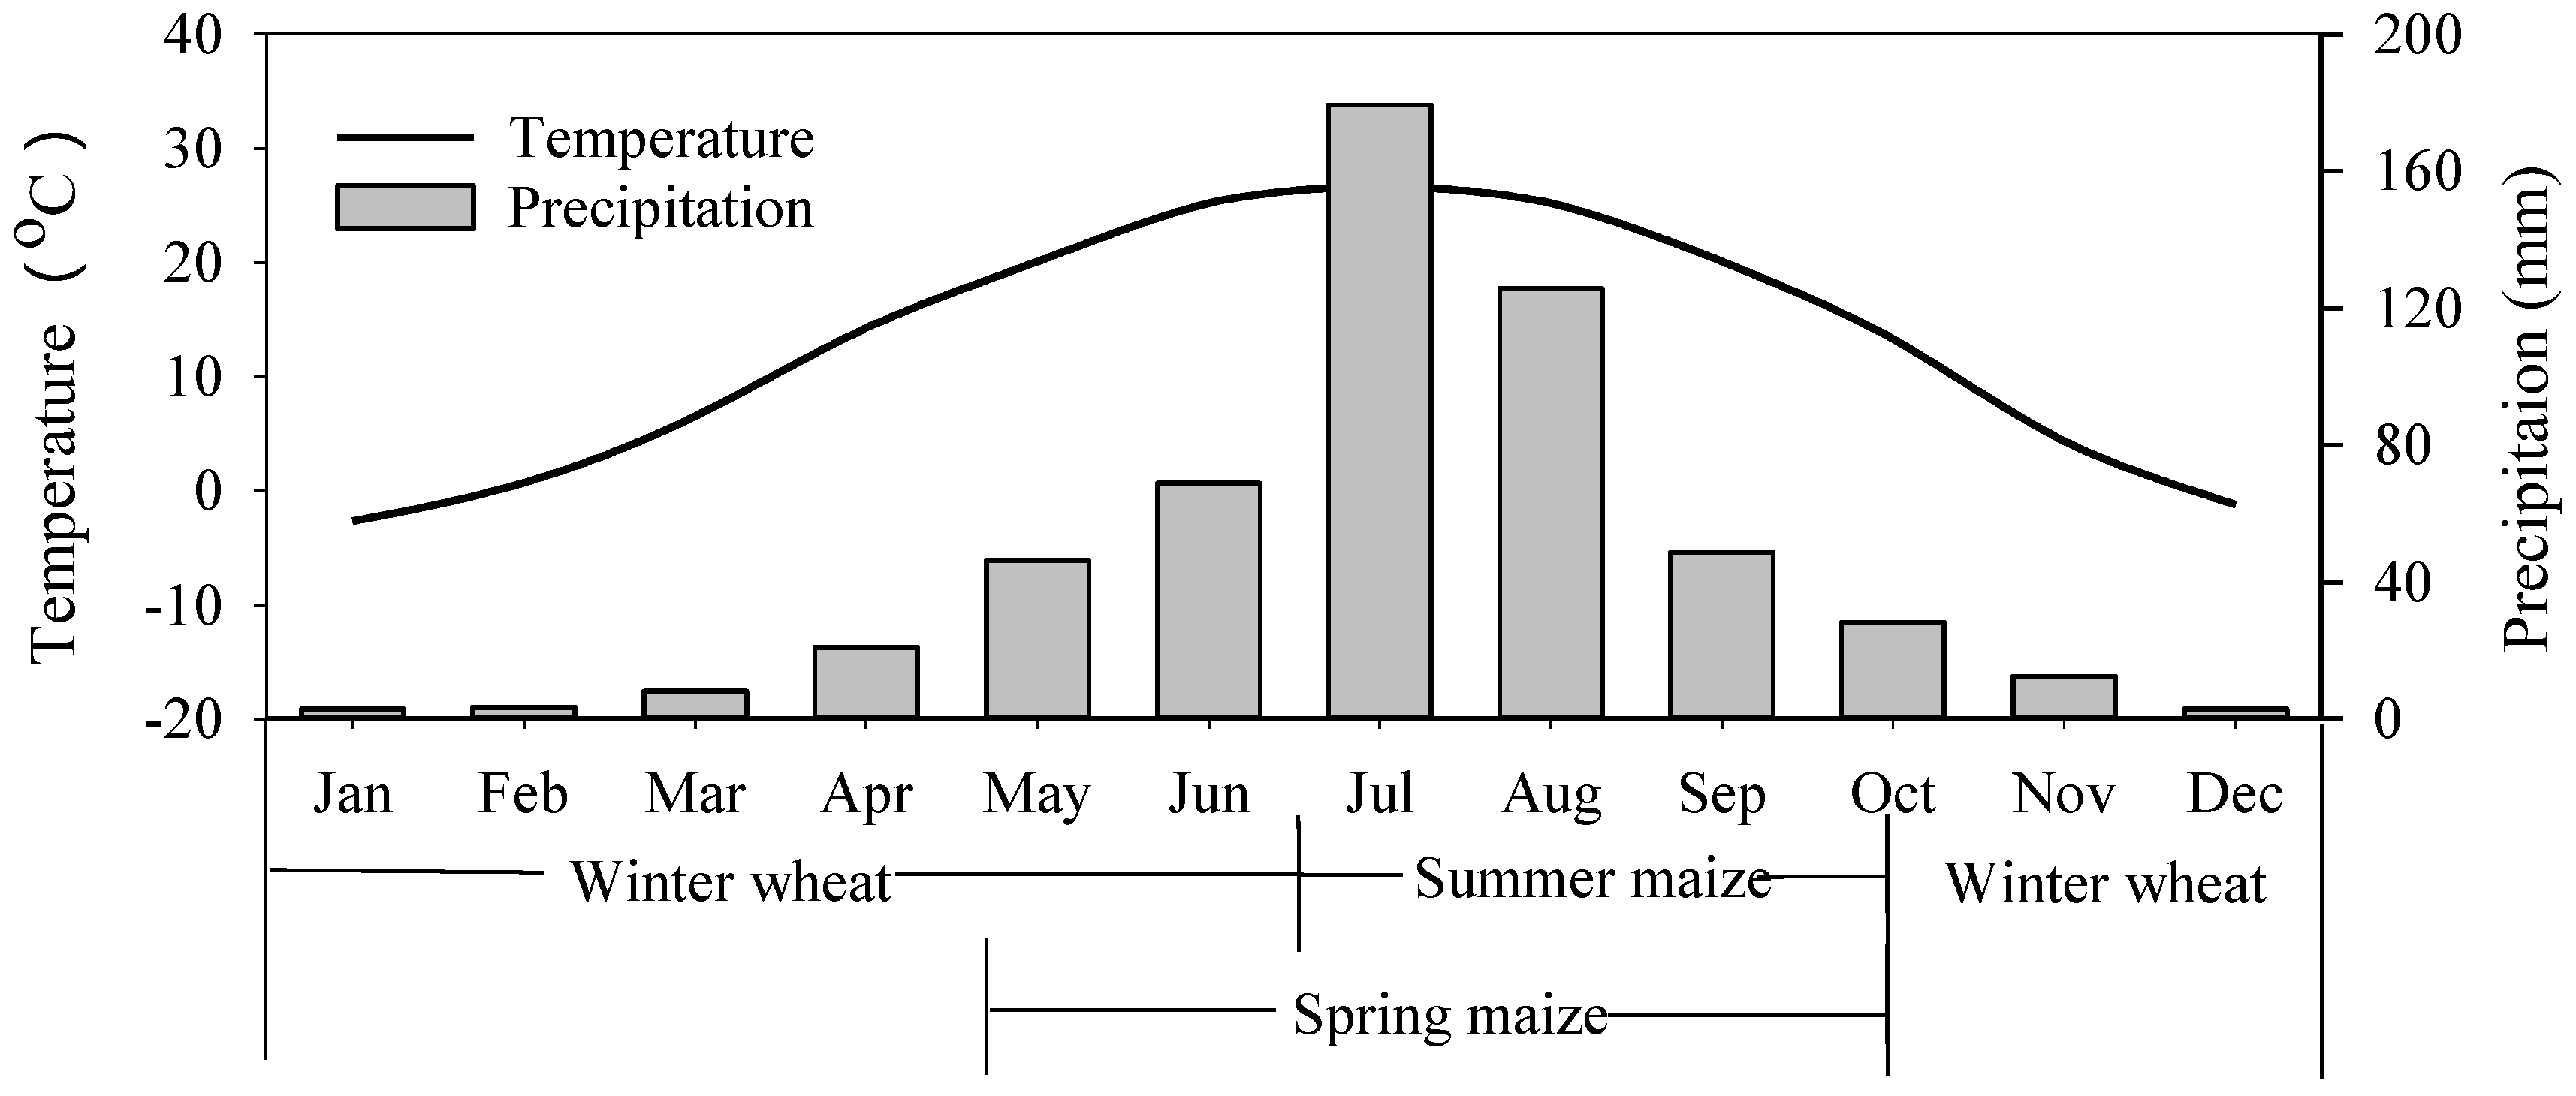
Figure 2.
Comparison of simulated (solid line) and measured (circle) soil water content at observed depths for HT (left) and CS (right) cropping systems.
Figure 2.
Comparison of simulated (solid line) and measured (circle) soil water content at observed depths for HT (left) and CS (right) cropping systems.
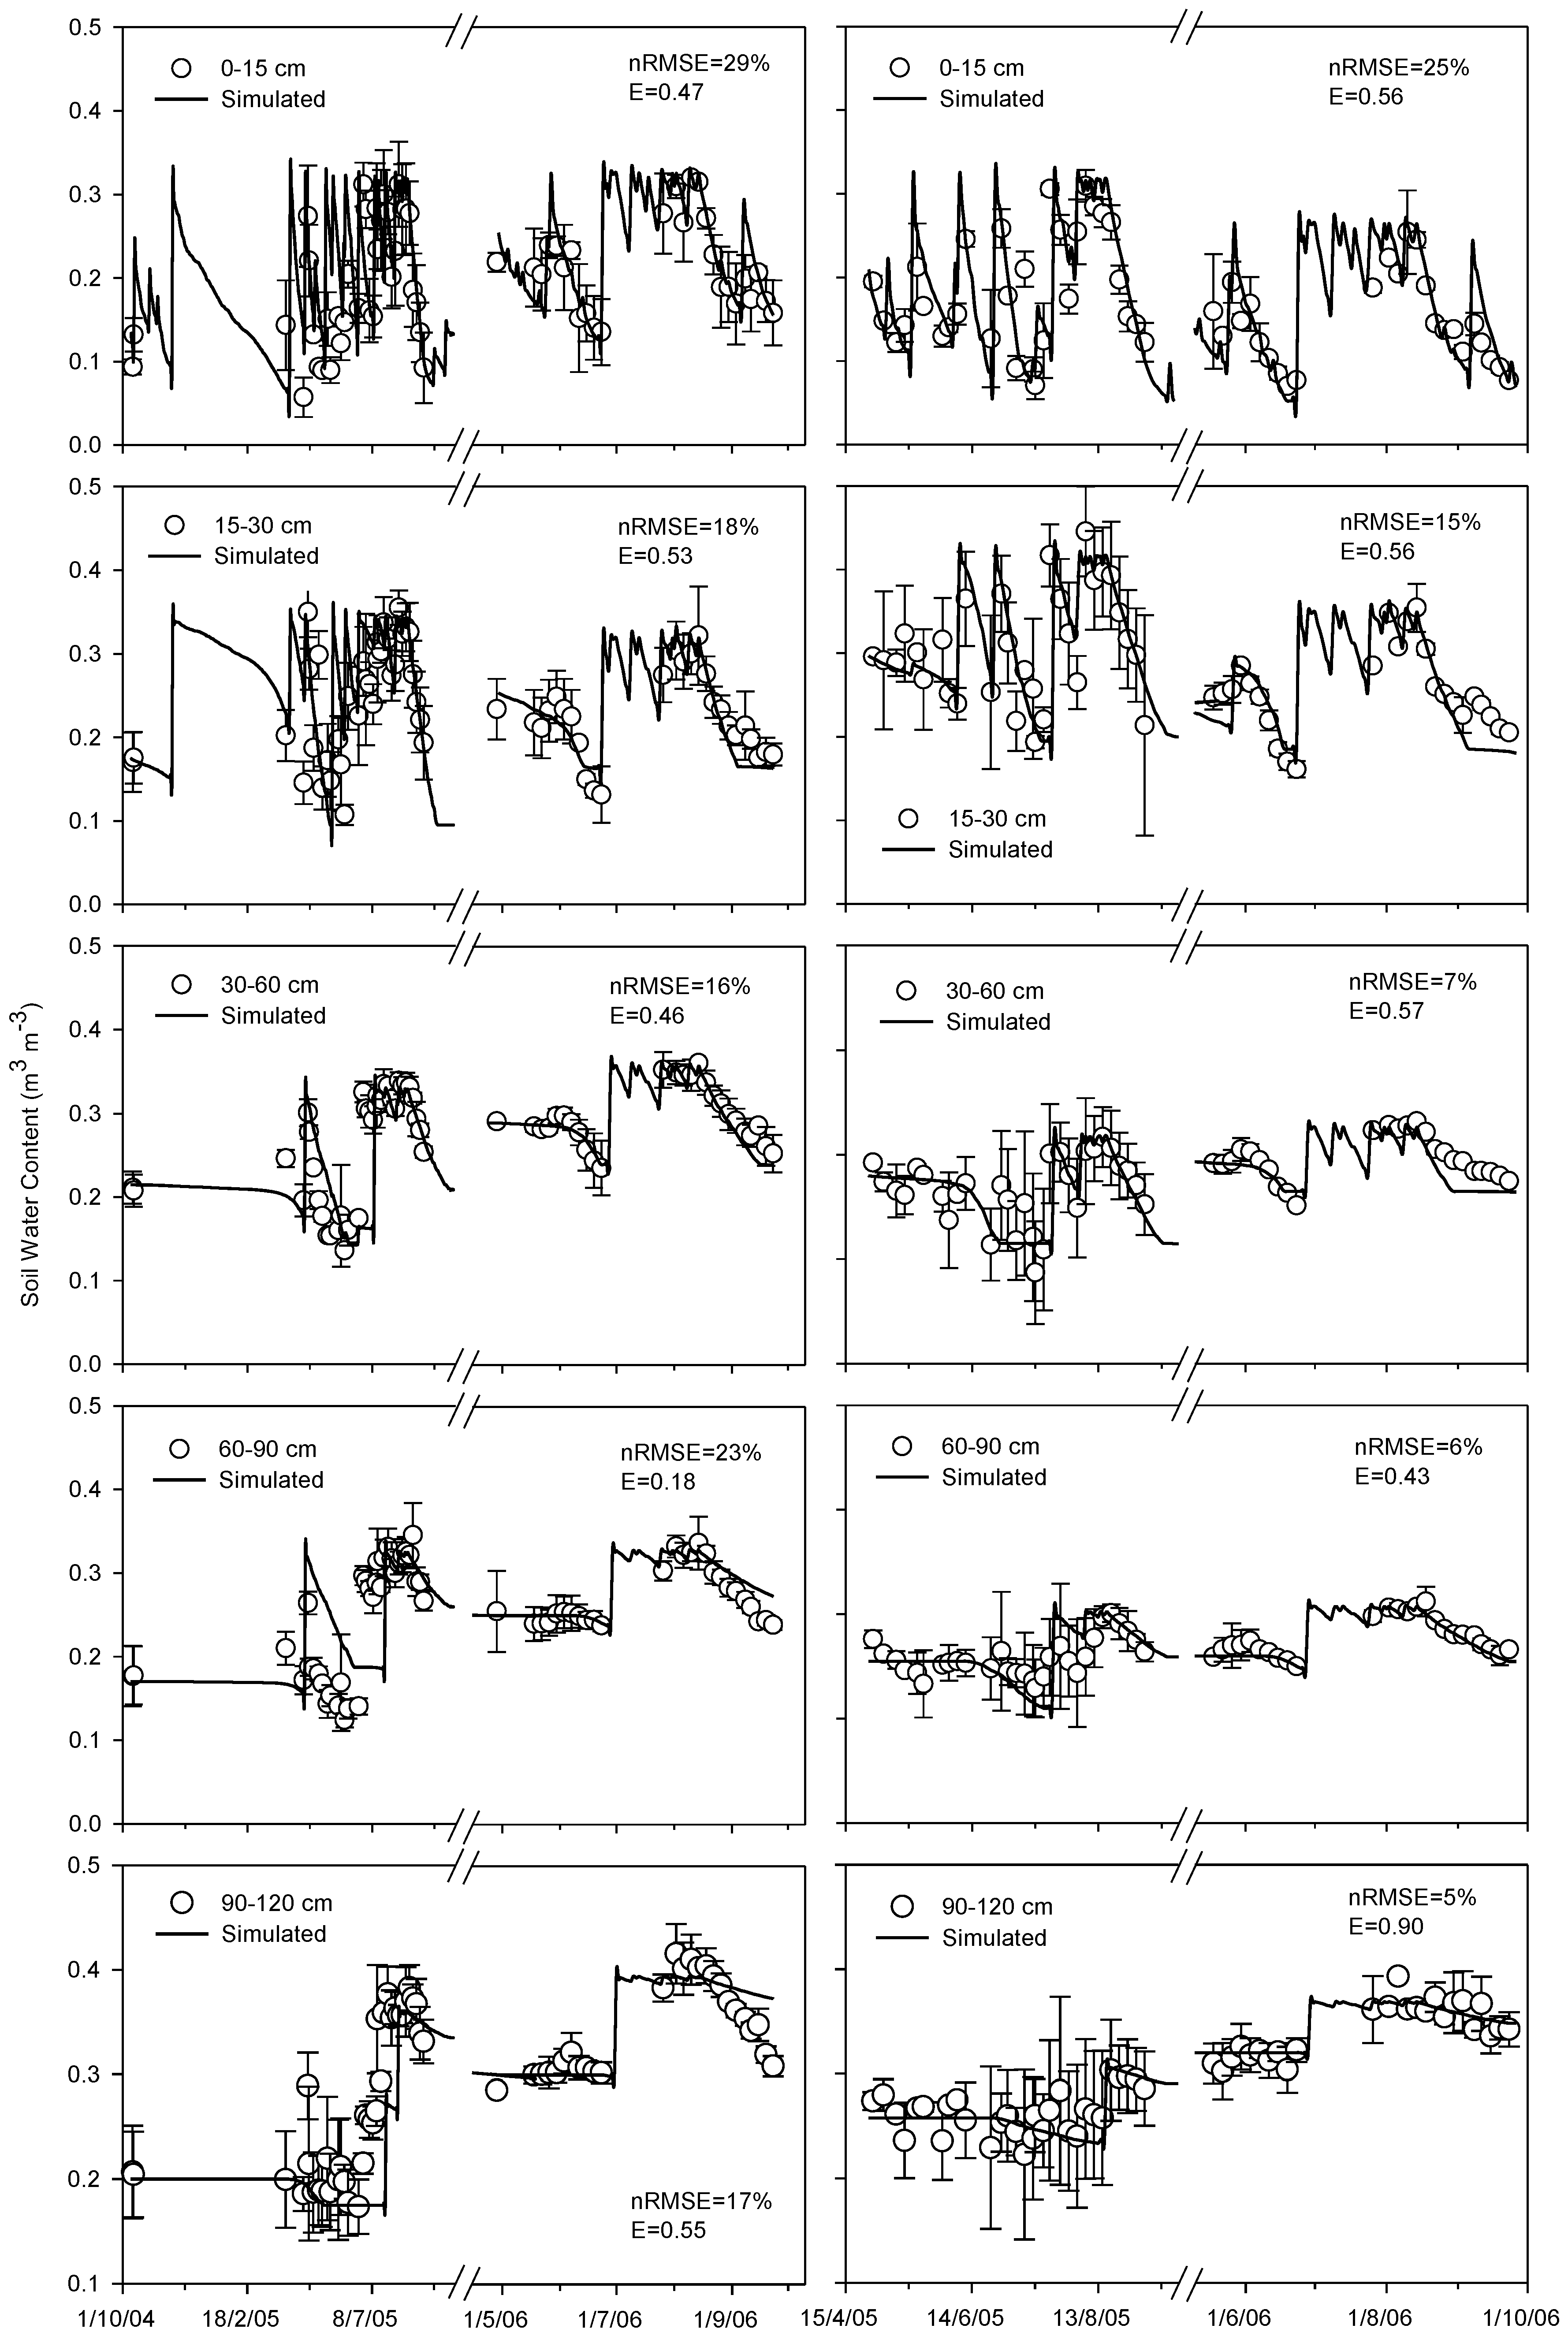
Figure 3.
Comparison of the simulated (solid line) and measured (circle) soil nitrate concentration at the observed depths for HT (left) and CS (right) cropping systems.
Figure 3.
Comparison of the simulated (solid line) and measured (circle) soil nitrate concentration at the observed depths for HT (left) and CS (right) cropping systems.
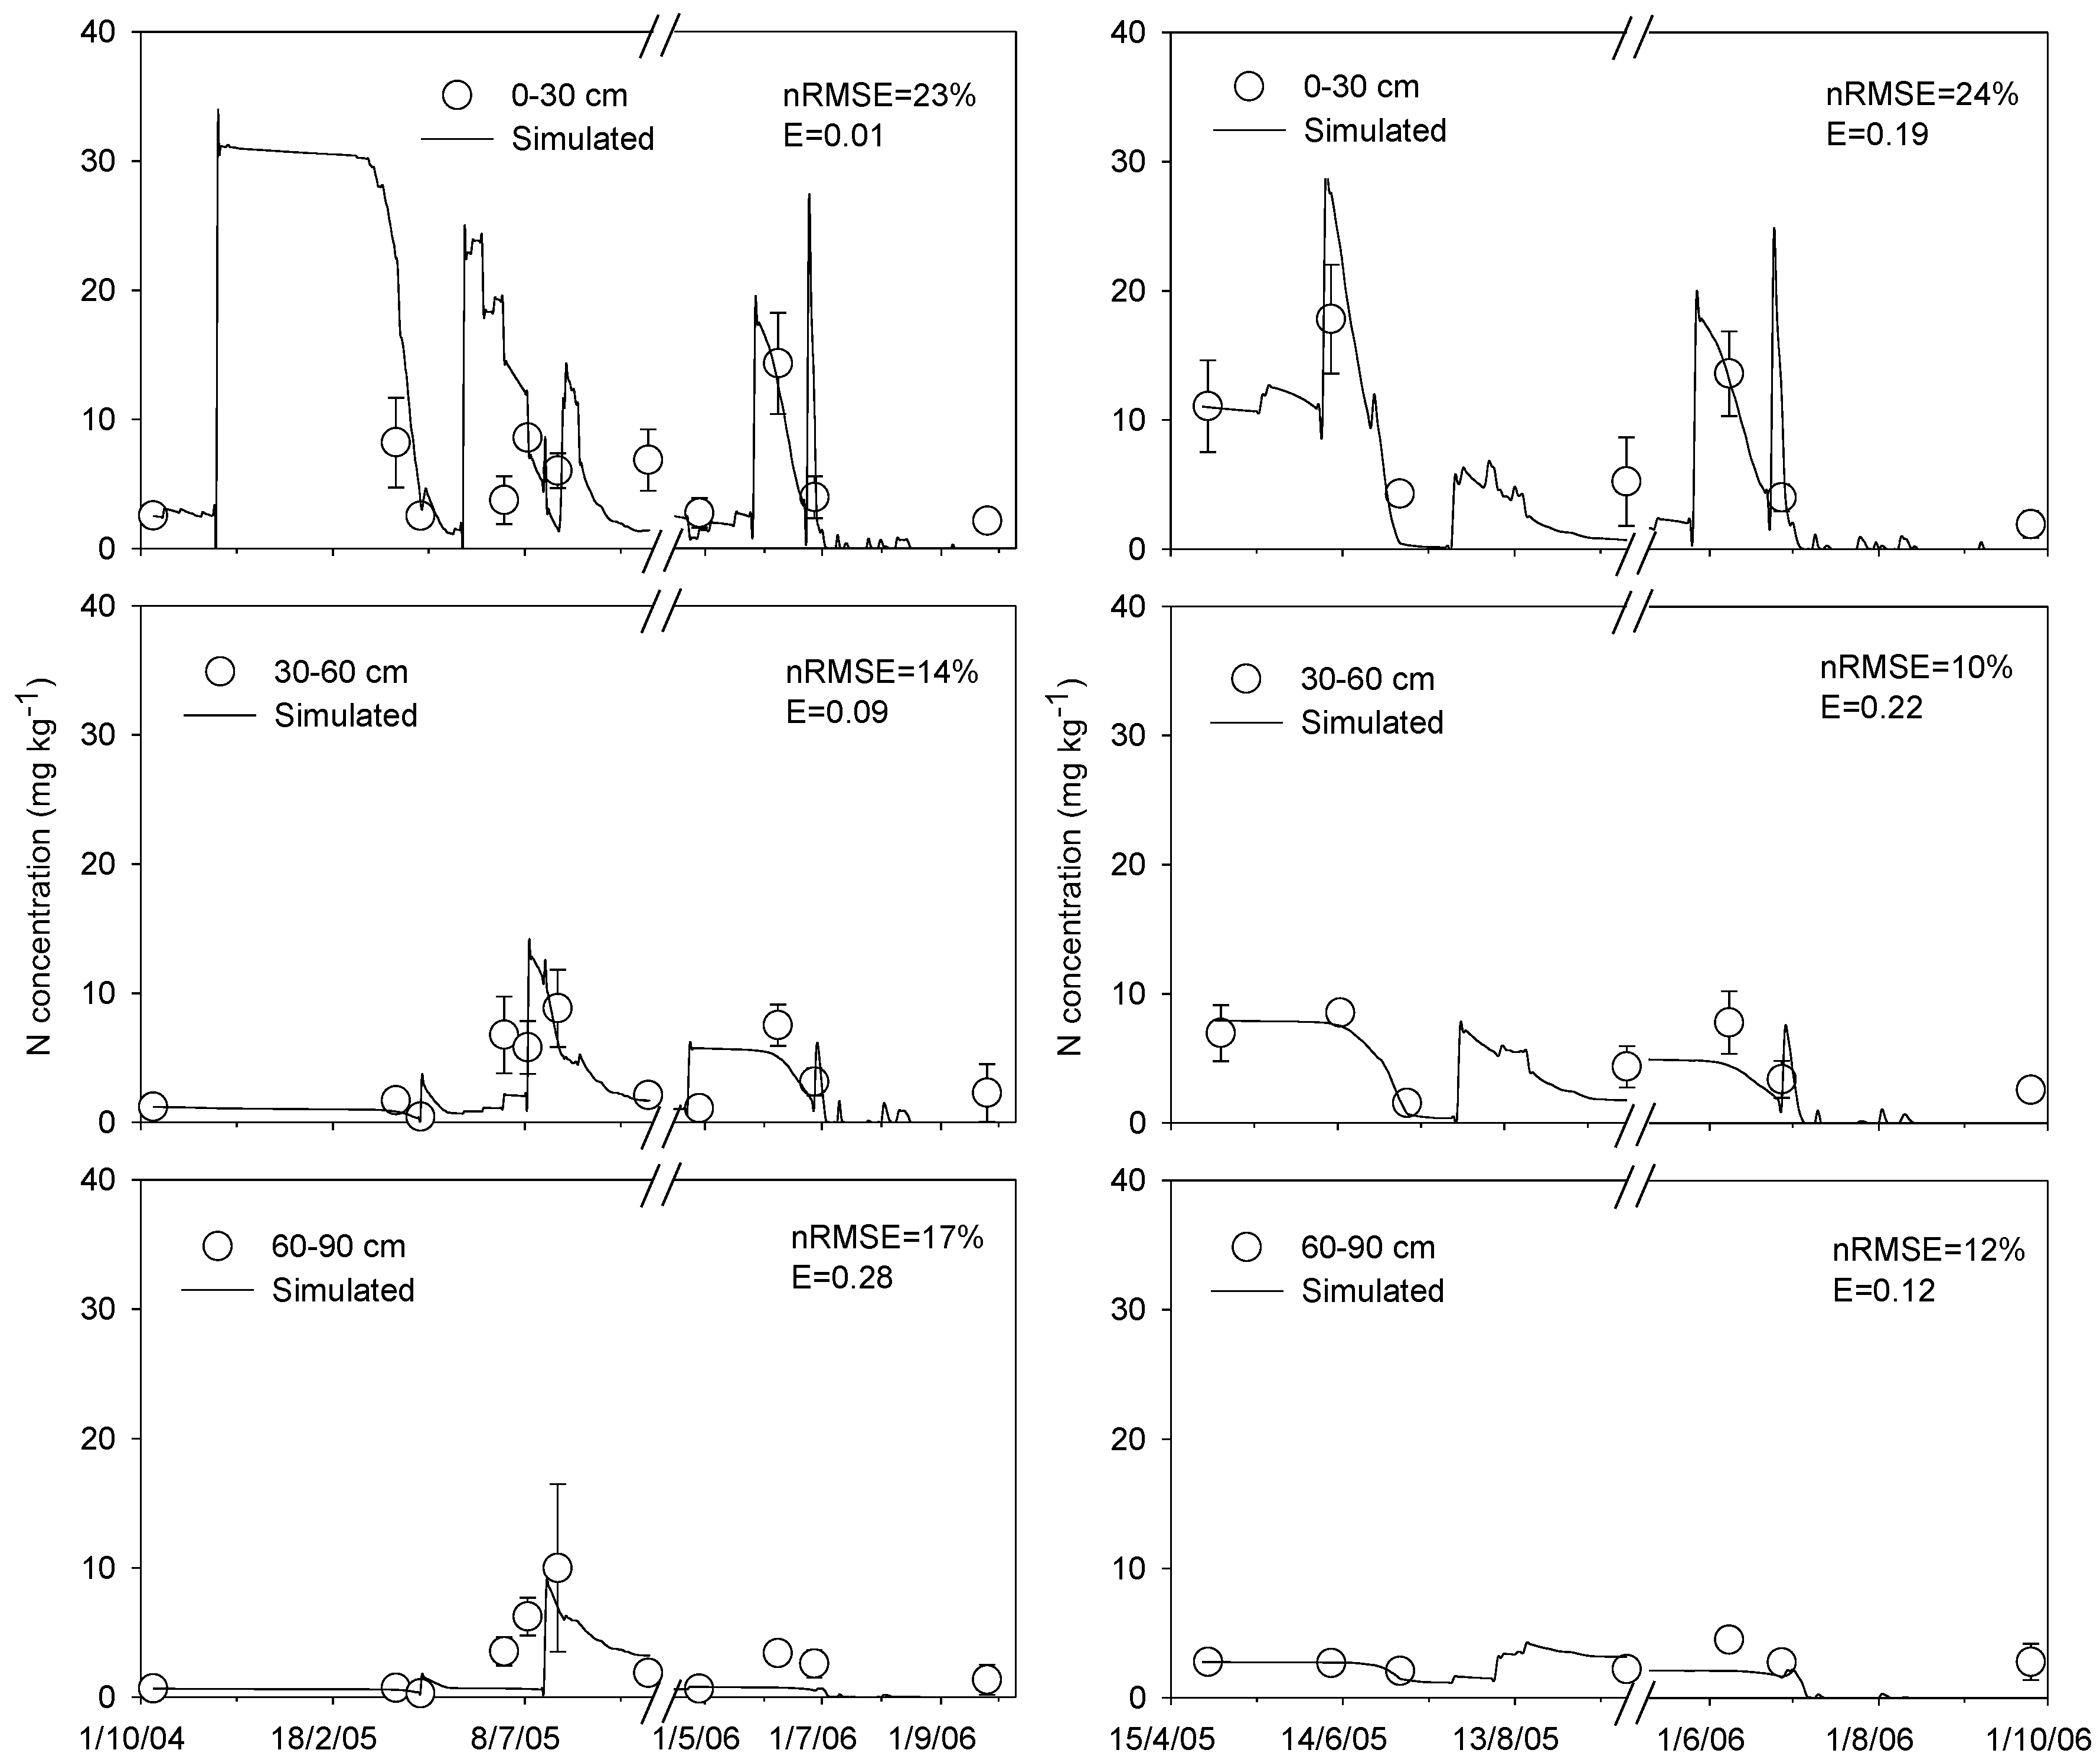
Figure 4.
Comparison of the simulated (solid line) and measured (circle) dry matter (DM) for HT (left) and CS (right).
Figure 4.
Comparison of the simulated (solid line) and measured (circle) dry matter (DM) for HT (left) and CS (right).
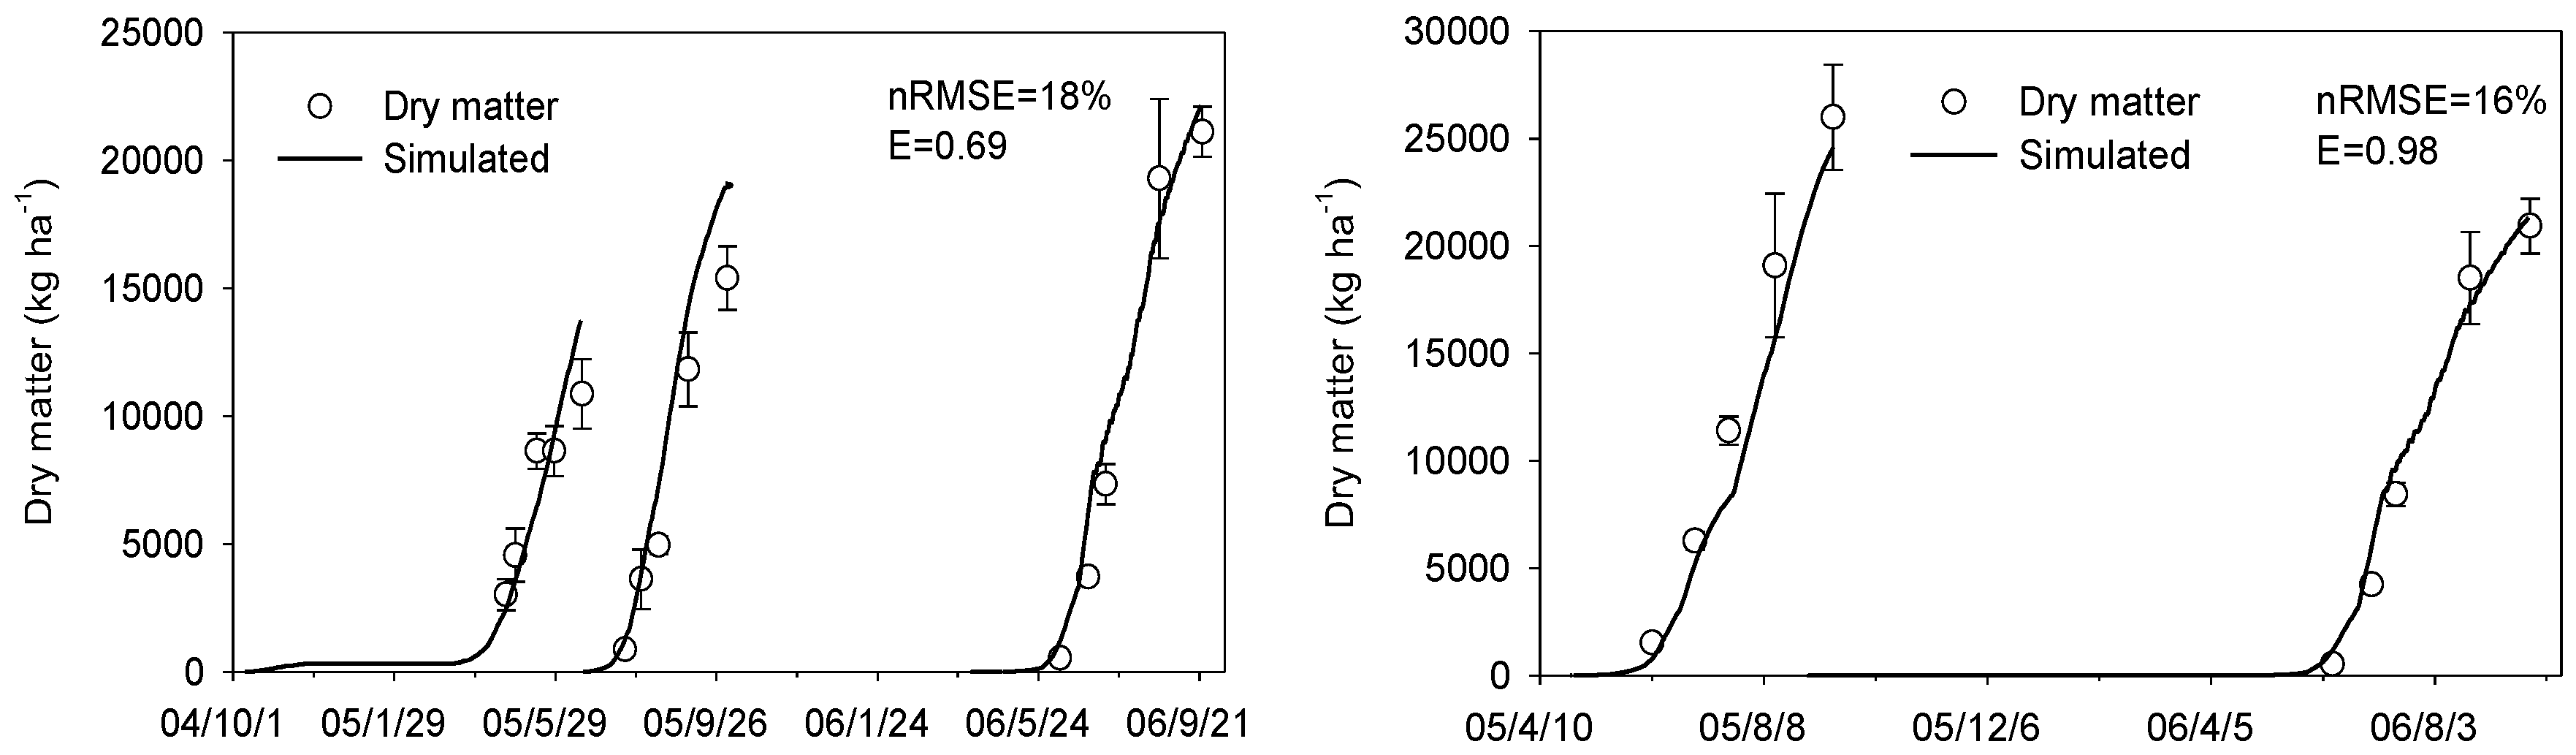
Figure 5.
Comparison of the simulated (solid line) and measured (circle) leaf area index (LAI) for HT (left) and CS (right).
Figure 5.
Comparison of the simulated (solid line) and measured (circle) leaf area index (LAI) for HT (left) and CS (right).
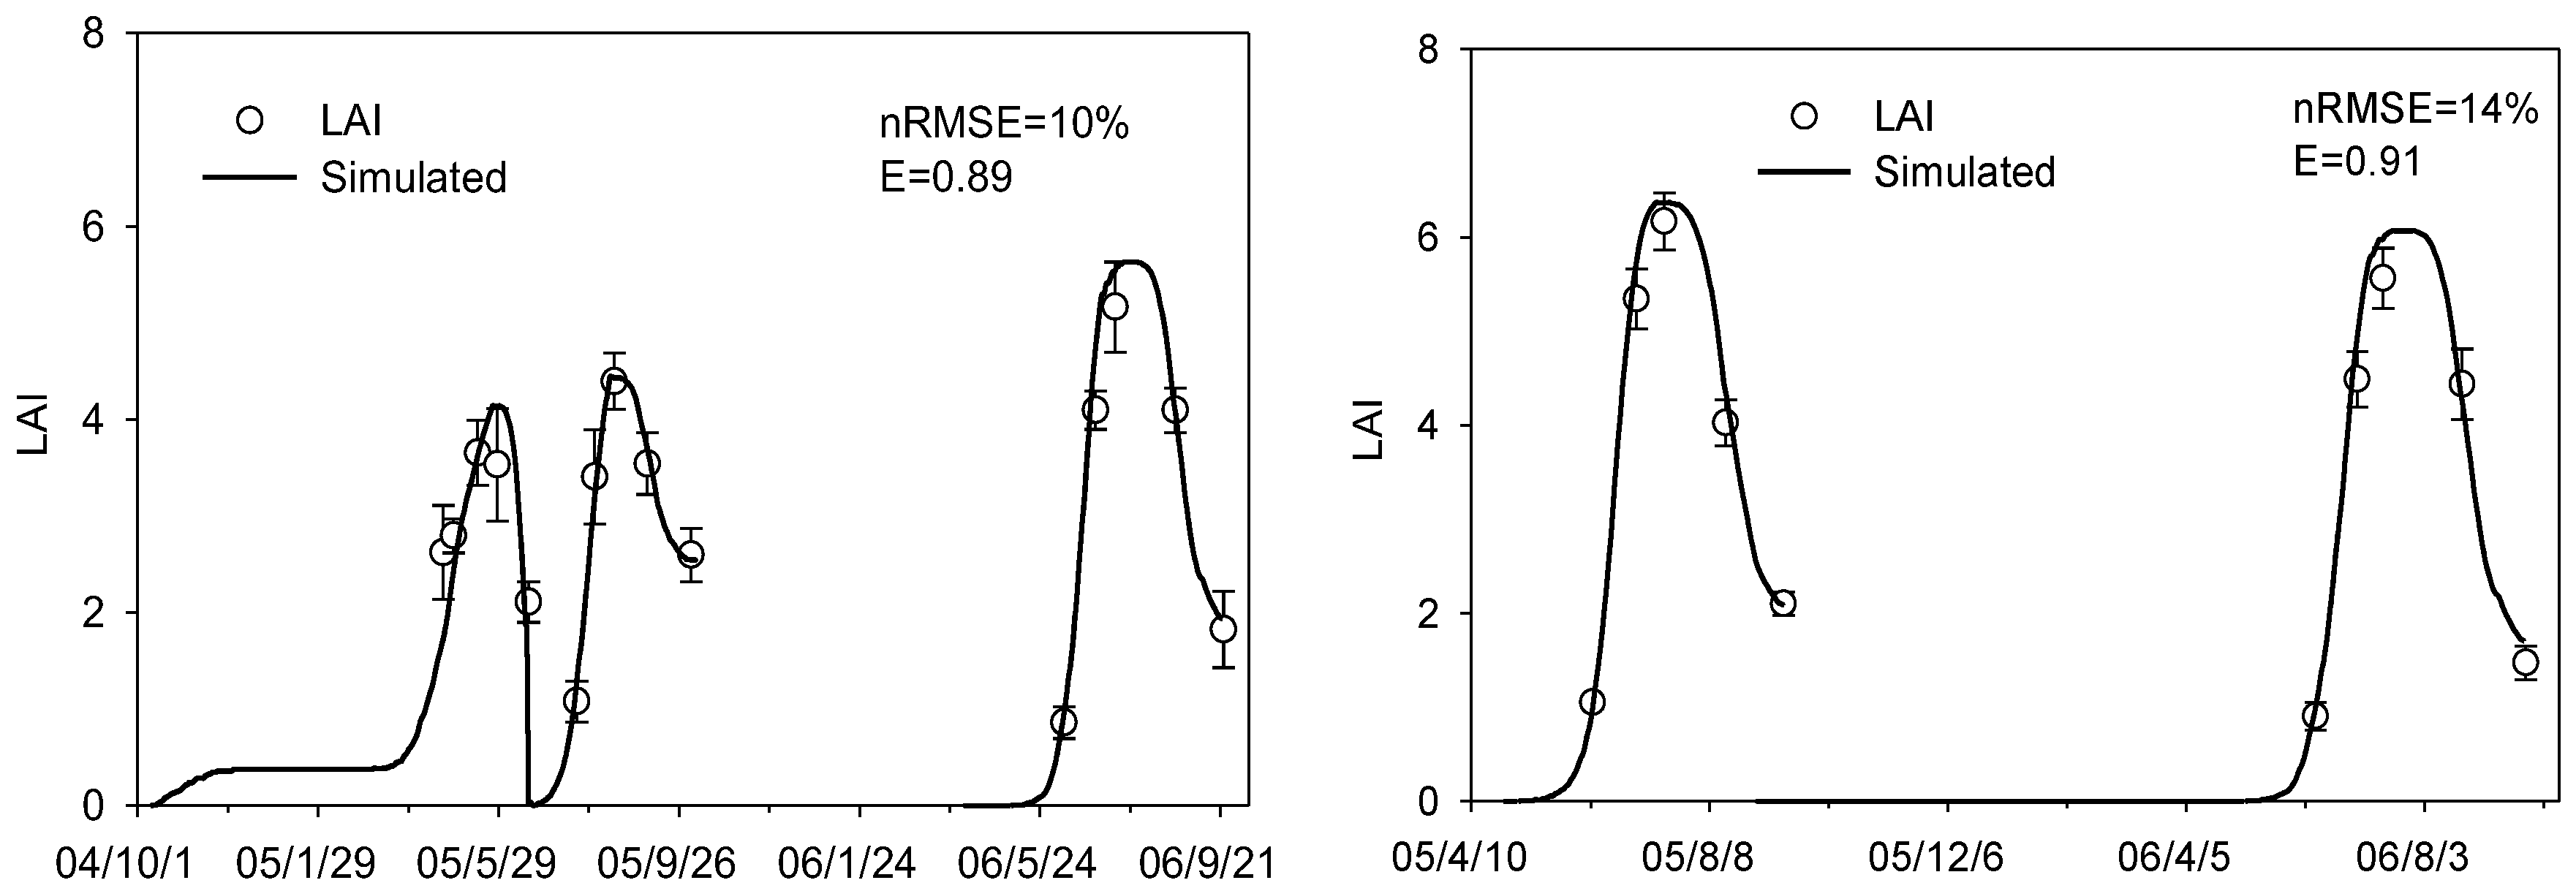
Figure 6.
Relationship between the measured and simulated soil volumetric water content, nitrate concentration, DM, and LAI in all of the cropping systems.
Figure 6.
Relationship between the measured and simulated soil volumetric water content, nitrate concentration, DM, and LAI in all of the cropping systems.

Table 1.
Basic physical and chemical properties of soil at the experimental site.
| Soil Layer (cm) | Particle Fraction (%) | Soil Texture (USDA) | BD (g·cm−3) | pH | θs (cm3·cm−3) | θfc (cm3·cm−3) | θwp (cm3·cm−3) | Ks (cm·d−1) | ||
|---|---|---|---|---|---|---|---|---|---|---|
| Sand | Silt | Clay | ||||||||
| 0–15 | 30.8 | 52.6 | 16.6 | Silt loam | 1.33 | 8.0 | 0.411 | 0.285 | 0.100 | 29.8 |
| 15–30 | 34.6 | 47.8 | 17.6 | Loam | 1.35 | 8.5 | 0.469 | 0.375 | 0.200 | 11.4 |
| 30–60 | 16.4 | 56.8 | 26.8 | Silt loam | 1.52 | 9.1 | 0.450 | 0.315 | 0.225 | 15.6 |
| 60–90 | 30.7 | 47.6 | 21.7 | Loam | 1.42 | 8.8 | 0.420 | 0.300 | 0.210 | 18.8 |
| 90–120 | 35.0 | 46.4 | 18.6 | Loam | 1.47 | 8.5 | 0.425 | 0.305 | 0.220 | 13.6 |
Note: BD, soil bulk density; θwp, soil wilting point; θs, soil saturated water content; θfc, field capacity; Ks, soil saturated hydraulic conductivity.
Table 2.
Water and nitrogen management in the Dongbeiwang site of Beijing.
| Date | Irrigation (mm) | Date | Fertilization (kg N ha−1) | ||||
|---|---|---|---|---|---|---|---|
| WM | HT | CS | WM | HT | CS | ||
| 2004/10/14 | 20 | 20 | - | 2004/10/10 | 60 | 60 | - |
| 2004/11/26 | 50 | 50 | - | 2005/4/7 | 30 | 30 | - |
| 2005/3/29 | - | - | - | 2005/4/24 | 100 | 100 | - |
| 2005/4/7 | 65 | 65 | - | 2005/4/27 | - | - | 30 |
| 2005/4/24 | 100 | 100 | 75 | 2005/7/4 | - | - | 65 |
| 2005/5/25 | 70 | 70 | - | 2005/7/11 | 30 | 30 | - |
| 2005/6/23 | 50 | 50 | - | 2005/8/2 | 45 | 45 | - |
| 2005/7/4 | - | - | 50 | ||||
| 2005/7/11 | 50 | 50 | - | ||||
| 2005/10/16 | 20 | - | - | 2005/10/11 | 50 | - | - |
| 2005/11/16 | 50 | - | - | 2006/4/17 | 85 | - | - |
| 2006/3/17 | 60 | - | - | 2006/6/28 | - | 70 | 70 |
| 2006/4/17 | 70 | - | - | 2006/7/8 | 50 | - | - |
| 2006/4/23 | - | 90 | 90 | 2006/8/7 | 90 | - | - |
| 2006/5/20 | 65 | - | - | ||||
| 2006/6/19 | 50 | 50 | 50 | ||||
Note: WM, two harvests in one year; HT, three harvests in two years; CS, continuous spring maize monoculture.
Table 3.
Water balance in a 1.2-m soil profile for different cropping systems in two years.
| Rotation | Season | Pre (mm) | Irri (mm) | ET (mm) | Drainage (mm) | WSC (mm) | Measured Yield (kg ha−1) | Simulated Yield (kg ha−1) | WUE (kg m−3) |
|---|---|---|---|---|---|---|---|---|---|
| WM | 2004–05WW | 123 | 305 | 442 | 0 | −14 | 5033 ± 118 | 5131 | 1.14 |
| 2005SM | 274 | 100 | 310 | 34 | 30 | 8368 ± 510 | 8488 | 2.70 | |
| 2005–06WW | 49 | 265 | 314 | 0 | 0 | 3223 ± 260 | 3293 | 1.03 | |
| 2006SM | 511 | 50 | 339 | 180 | 42 | 6872 ± 287 | 6822 | 2.03 | |
| Sum | 957 | 720 | 1405 | 214(13%) | 58 | 23,496 | 23,734 | 1.67 | |
| HT | 2004–05WW | 123 | 305 | 432 | 0 | −4 | 4810 ± 618 | 4755 | 1.11 |
| 2005SM | 274 | 100 | 319 | 0 | 55 | 8307 ± 694 | 8360 | 2.60 | |
| 2006SPM | 514 | 140 | 409 | 204 | 41 | 6933 ± 742 | 7140 | 1.70 | |
| Sum | 911 | 545 | 1160 | 204(14%) | 92 | 20,050 | 20,255 | 1.73 | |
| CS | 2005SPM | 284 | 125 | 434 | 7 | −32 | 10,253 ± 549 | 10,406 | 2.36 |
| 2006SPM | 514 | 140 | 393 | 236 | 25 | 7723 ± 660 | 7726 | 1.97 | |
| Sum | 798 | 265 | 827 | 243(23%) | −7 | 17,976 | 18,132 | 2.17 |
Note: WM, two harvests in one year; HT, three harvests in two years; CS, continuous spring maize monoculture; WW, winter wheat; SM, summer maize; SPM, spring maize; Pre, precipitation; Irri, irrigation; ET, evapotranspiration; water storage change (WSC) = Pre + Irri − ET − Drainage; Water use efficiency (WUE) = Measured yield/ET.
Table 4.
Nitrogen balance in a 1.2-m soil profile in different cropping systems in two years.
| Rotation | Season | N Input (kg N ha−1) | N Output (kg N ha−1) | NUE | FNUE | ||||||||
|---|---|---|---|---|---|---|---|---|---|---|---|---|---|
| Nini | Nres | Nfer | Ndep | Nirr | Nnet | Nvol | Nden | Nup | Nlea | kg kg−1 N−1 | |||
| WM | 2004–05WW | 32.8 | 109.1 | 190 | 39 | 12 | 74 | 47.1 | 0.6 | 191 | 0 | 21 | 26 |
| 2005SM | 109.1 | 88.3 | 75 | 14 | 4 | 33 | 0.4 | 0.3 | 186 | 2.3 | 44 | 112 | |
| 2005–06WW | 90.0 | 81.1 | 135 | 39 | 10 | 25 | 16.4 | 0.4 | 201 | 0 | 15 | 24 | |
| 2006SM | 81.1 | 0.2 | 140 | 14 | 2 | 83 | 40.1 | 0.4 | 214 | 65.7 | 21 | 49 | |
| Sum | 32.8 | 0.2 | 540 | 106 | 28 | 215 | 104 | 1.7 | 792 | 68 | 24 | 44 | |
| HT | 2004–05WW | 35.8 | 107.1 | 190 | 39 | 12 | 60 | 39.7 | 0.6 | 189 | 0 | 21 | 25 |
| 2005SM | 107.1 | 48.3 | 75 | 14 | 4 | 38 | 0.4 | 0.3 | 190 | 0 | 44 | 111 | |
| 2006SPM | 21.3 | 0.1 | 70 | 53 | 5 | 59 | 17.5 | 0.2 | 190 | 0.1 | 33 | 99 | |
| Sum | 35.8 | 0.1 | 335 | 106 | 21 | 157 | 57.6 | 1.1 | 569 | 0.1 | 32 | 60 | |
| CS | 2005SPM | 102.8 | 38.8 | 95 | 53 | 5 | 62 | 33.8 | 0.4 | 243 | 1.6 | 37 | 108 |
| 2006SPM | 39.1 | 0.7 | 70 | 53 | 5 | 66 | 18.1 | 0.2 | 203 | 0.3 | 35 | 110 | |
| sum | 102.8 | 0.7 | 165 | 106 | 10 | 128 | 51.9 | 0.6 | 446 | 1.9 | 36 | 109 | |
Note: WW, winter wheat; SM, summer maize; SPM, spring maize; Nini, the amount of N accumulation before crop planting; Nres, the amount of N accumulation after crop harvest; Nfer, N fertilizer; Ndep, N deposition; Nirr, N coming from irrigated water; Nnet, net mineralization; Nvol, NH3 volatilization; Nden, denitrification; Nup, crop N uptake; Nlea, N leaching. N use efficiency (NUE) = measured yield/N output; FNUE = measured yield/fertilization rate.
© 2020 by the authors. Licensee MDPI, Basel, Switzerland. This article is an open access article distributed under the terms and conditions of the Creative Commons Attribution (CC BY) license (http://creativecommons.org/licenses/by/4.0/).
Share and Cite
MDPI and ACS Style
Wang, H.; Li, B.; Jin, L.; Hu, K. Exploring a Sustainable Cropping System in the North China Plain Using a Modelling Approach. Sustainability 2020, 12, 4588. https://doi.org/10.3390/su12114588
AMA Style
Wang H, Li B, Jin L, Hu K. Exploring a Sustainable Cropping System in the North China Plain Using a Modelling Approach. Sustainability. 2020; 12(11):4588. https://doi.org/10.3390/su12114588
Chicago/Turabian StyleWang, Huanyuan, Baoguo Li, Liang Jin, and Kelin Hu. 2020. "Exploring a Sustainable Cropping System in the North China Plain Using a Modelling Approach" Sustainability 12, no. 11: 4588. https://doi.org/10.3390/su12114588
Note that from the first issue of 2016, this journal uses article numbers instead of page numbers. See further details here.