Article

Optimal Scheduling of Hybrid Multi-Carrier System Feeding Electrical/Thermal Load Based on Particle Swarm Algorithm

by
Alaa Farah
1,2,*,
Hamdy Hassan
1,3,
Alaaeldin M. Abdelshafy
1,2 and
Abdelfatah M. Mohamed
2,4
1
Energy Resources Engineering Department, Egypt-Japan University of Science and Technology, Alexandria 21934, Egypt
2
Electrical Engineering Department, Faculty of Engineering, Assiut University, Assiut 71515, Egypt
3
Mechanical Engineering Department, Faculty of Engineering, Assiut University, Assiut 71515, Egypt
4
Mechatronics and Robotics Engineering Department, Egypt-Japan University of Science and Technology, Alexandria 21934, Egypt
*
Author to whom correspondence should be addressed.
Sustainability 2020, 12(11), 4701; https://doi.org/10.3390/su12114701
Submission received: 7 May 2020 / Revised: 31 May 2020 / Accepted: 3 June 2020 / Published: 9 June 2020
(This article belongs to the Section Energy Sustainability)

Abstract

:
In this paper, the optimum coordination of an energy hub system, fed with multiple fuel options (natural gas, wood chips biomass, and electricity) to guarantee economically, environmentally friendly, and reliable operation of an energy hub, is presented. The objective is to lessen the total operating expenses and CO2 emissions of the hub system. Additionally, the effect of renewable energy sources as photovoltaics (PVs) and wind turbines (WTs) on energy hub performance is investigated. A comparison of various configurations of the hub system is done. The proper planning of the hub elements is determined by a multi-objective particle swarm optimization (PSO) algorithm to achieve the lowest level of the gross running cost and total system emissions, simultaneously. The outcomes show that the natural gas turbine (NGT) is superior to the biomass generating unit in lowering the gross operating expenses, while using the biomass wood chips plant is most effective in lessening the total CO2 emissions than the NGT plant. Furthermore, the combination of the natural gas turbine, biomass generator, photovoltaics, and wind turbines enhances the operation of the hub infrastructures by lessening both the gross operating cost and overall CO2 emission simultaneously.

1. Introduction

Nowadays, due to the massive overpopulation and precipitous economic growth, most countries are facing ever-increasing energy demands [1]. Besides, global concerns regarding economic and environmental concerns related to energy generation have recently been reported. Such concerns intensify the genuine need for the traditional energy system’s physical transformation to attain the consumer’s wishes with high efficiency. Multiple energies hub network is a compelling solution because different kinds of energies can be interacting and transforming within the hub from one form to another one [2,3]. Within the hub, several forms of energies can be generated and stored using cogeneration units, electrical and gas heater, electrical and thermal storage units, converters and inverters, heat exchangers, pumps, and other facilities.
Multiple energy hub systems are local energy suppliers that depend on generating energy with the lowest possible cost and the lowest level of carbon emissions to conserve the environment through the use of distributed renewable and non-renewable energy resources [4]. It mainly consists of distributed generation (DG) sources, essential cogeneration units and renewable energy resources. The efficiency and reliability of combined heat and power (CHP) units come from their capability to generate electrical and thermal energy from a single fuel source [5]. CHP fueled with natural gas, is a preferred technology for powering energy hubs, since the process of natural gas combustion produces a small level of by-products disseminated to the environment. Moreover, natural gas is a cheap fuel, available in most areas and easily transported through pipelines. CHP fueled by wood is being considered one of the most plausible choices for alternative energy as it is continually replenished, no threat to acid rain pollution and low carbon emissions [6].
Several studies in the literature focused on optimal energy hubs architecture based on conventional methods of optimization. A linear integer programming method is suggested to define the optimum photovoltaic energy hub system configuration, consisting entirely of a thermal energy system, battery, CHPs, and thermal storage backup [7]. Wang et al. implemented a multilinear programmable technique to achieve optimal multi-carrier architecture by reducing the system’s infrastructure and running costs without taking environmental issues into account [8]. In reference [9], a linear integer programming methodology is designed to lessen the carbon emissions of the combined photovoltaics (PVs), wind turbines (WTs), and hydropower storage system. In reference [10], a linear programming strategy is identified based on the weighted sum formula to mitigate the total expense and negative environmental impacts of the hybrid energy system. CHPs, solar thermal energy systems, heating systems, and thermal storage technologies were used to meet time-varying load requirements. The optimal operation of an integrated energy network that contains three kinds of energy carriers, including natural gas, electricity, and district heating, was proposed by Zhong et al. [11]. The authors constructed an internal optimization model based on lowering the running fuel cost factor to achieve the optimal function of the hub structure. In addition, to maximize the benefits of the energy producers, an external optimization model has been developed. Sheikhi et al. proposed a general algebraic designing system to identify the optimum operating conditions and the proper size of a hub system feeding an Iranian hotel [12]. Qi et al. [13] presented the commercial CPLEX solver to optimize the operation of a domestic multi-carrier energy network consisting primarily of a concentrated solar thermal system. The objective is to reduce the entire system operating expenses in addition to optimizing the demand side management of the variable family loads. Based on economic issues, the optimization problem of the PV hydropower pumped storage scheme was solved in reference [14]. The author has addressed the unpredictability of renewable energy sources, market price volatility, and the discrepancy between day-ahead load and actual-time load.
To obtain an efficient energy hub system, it is necessary to address the optimal hub design for covering a certain load demand. Meta-heuristic algorithms are used to identify the optimum scheme for the system due to the complexity of the objective function. Identifying the appropriate layout of the hub structure poses several difficulties. The genetic algorithm (GA) has been employed to evaluate the proper size of the isolated hybridized CHP system [15]. Internal combustion engines, micro gas turbines, electrical energy storage, and heat pumps are used in this design. Based on the multi-objective function of the overall system efficiency and the energy cost, the optimum size of the energy system was examined. GA was used to solve two-stage optimum design and operation problems of the multiple carriers microgrid based on the investment and operation (fuel and maintenance) cost [16]. The energy hub expansion planning problem was solved based on an improved GA to mitigate total energy hub investment costs, including natural gas furnaces, CHP units, and transmission lines [17]. Luca Urbanucci et al. presented the Monte Carlo technique for identifying effective cogeneration system layouts under the long-term unpredictability of electricity demand [18]. As a cogeneration facility, a gas internal combustion engine is used to serve an Italian hospital. Game theory was also used to evaluate the optimal coordination of an interconnected multi-carrier energy system by mitigating the inner system’s electricity generation and fuel costs [19]. To achieve an optimum operating strategy of a decentralized multi-carrier network, an advanced particle swarm optimization (PSO) has been developed to reduce gross annual costs [20]. In reference [21], a multi-energy carrier modeling method is proposed to reduce the operating expenses of the system. The micro-grid involved a wind turbine, CHP units, a trash-burning power plant, an anaerobic reactor–reformer system, and an energy storage system. The optimal design of hybrid energy systems servicing standalone accommodation buildings is examined in reference [22]. Two objective functions were used to define the proper size of each system component: net present value and zero renewable energy per building floor area. A hierarchical economic operation strategy of the multiple carrier’s systems based on three main interest parts—energy consumer, energy facilitator, and an energy provider—was investigated by Huang et al. [23]. In conjunction with an internal point solution, the PSO algorithm was proposed to minimize the facilitator and the energy provider’s energy costs. In reference [24], a new hybrid optimization method of the grey wolf and PSO for multi-objective optimization problems comprising the cost of electricity and CO2 emission is presented. This procedure is used to specify the appropriate size of the hybrid energy system feeding the water desalination system. A comparison of PSO-based optimization techniques and a Monte Carlo approach is discussed to address the appropriate design of the faraway low voltage microgrids [25]. The objectives are to maximize the gross microgrid revenues, the use of renewable sources, and the total energy transferred to the national grid and to lessen power losses, the use of non-renewable sources, and the total energy transmitted from the national grid.
We are convinced that further studies need to be carried out regarding the optimal planning of the multi-energy hub system, considering both economic and environmental issues. Besides, it is crucial to make a comparison between various layouts of the hub system to select best configuration in accordance with a certain objective function. This paper presents the PSO technique to effectively addressing the optimum scheduling of multiple energy hub frameworks, including both the economical and environmental challenges with the incorporation of renewable energy sources—biomass energy, solar energy, and wind energy. The efficient framework and appropriate planning of hub elements, considering the variation of the thermal and electric requirements of the load, are determined. Two scenarios are considered for studying this energy hub system. In the first scenario, PVs and WTs are not included in the hub performance, whereas the second one considers the integrated effects of PVs and WTs. Three main objective functions studied: minimizing the gross operational system expenses, minimizing CO2 emissions, and the combined objective of the gross operating cost and CO2 emissions. In each scenario, each objective function is performed for the three various hub configurations. Each one includes a combination of the various hub elements, such as natural gas turbine (NGT), biomass unit, and boiler. The remaining parts of the paper are structured as follows: Section 2 introduces the modeling of the multiple energy hub frameworks. Section 3 outlines the arithmetic formularization of the planning problem. Then, PSO is mentioned in Section 4. Next, the study case and the results of the examined energy hub are addressed in Section 5 and Section 6, followed by the conclusions in Section 7.

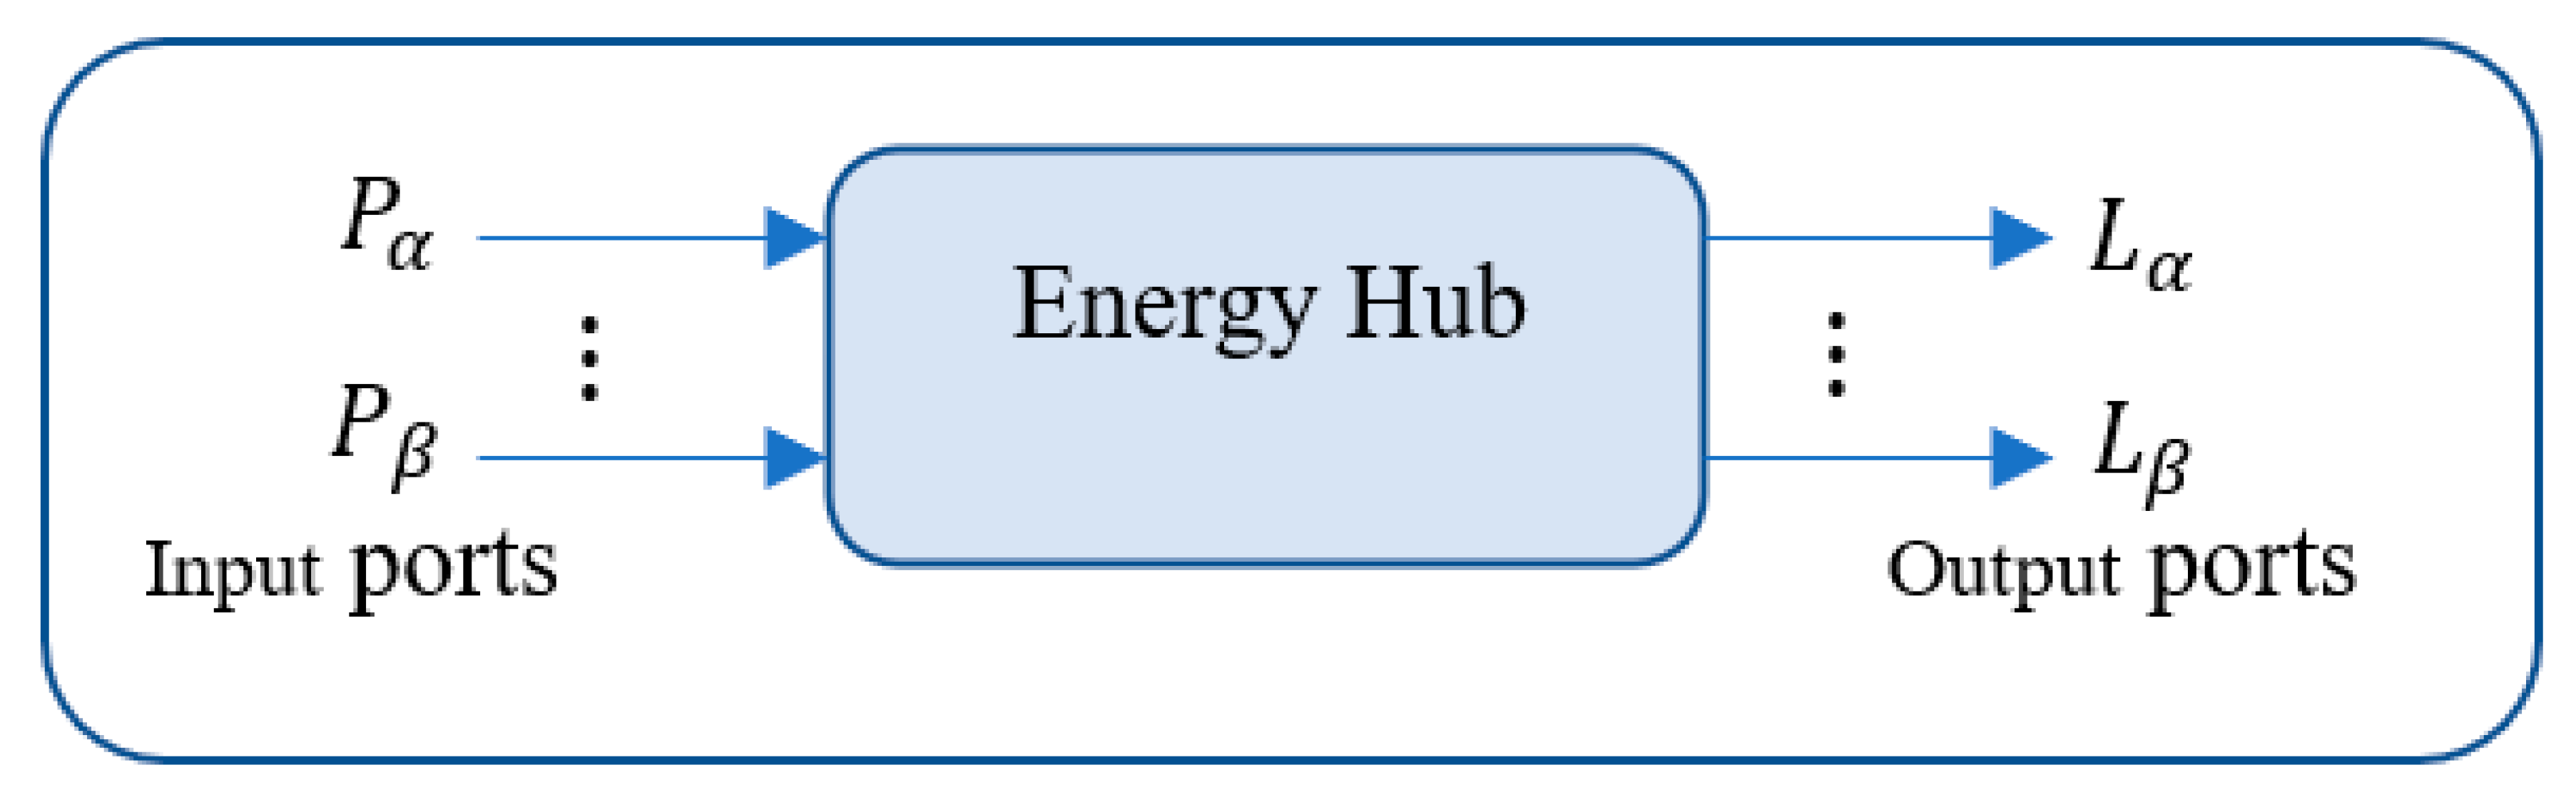
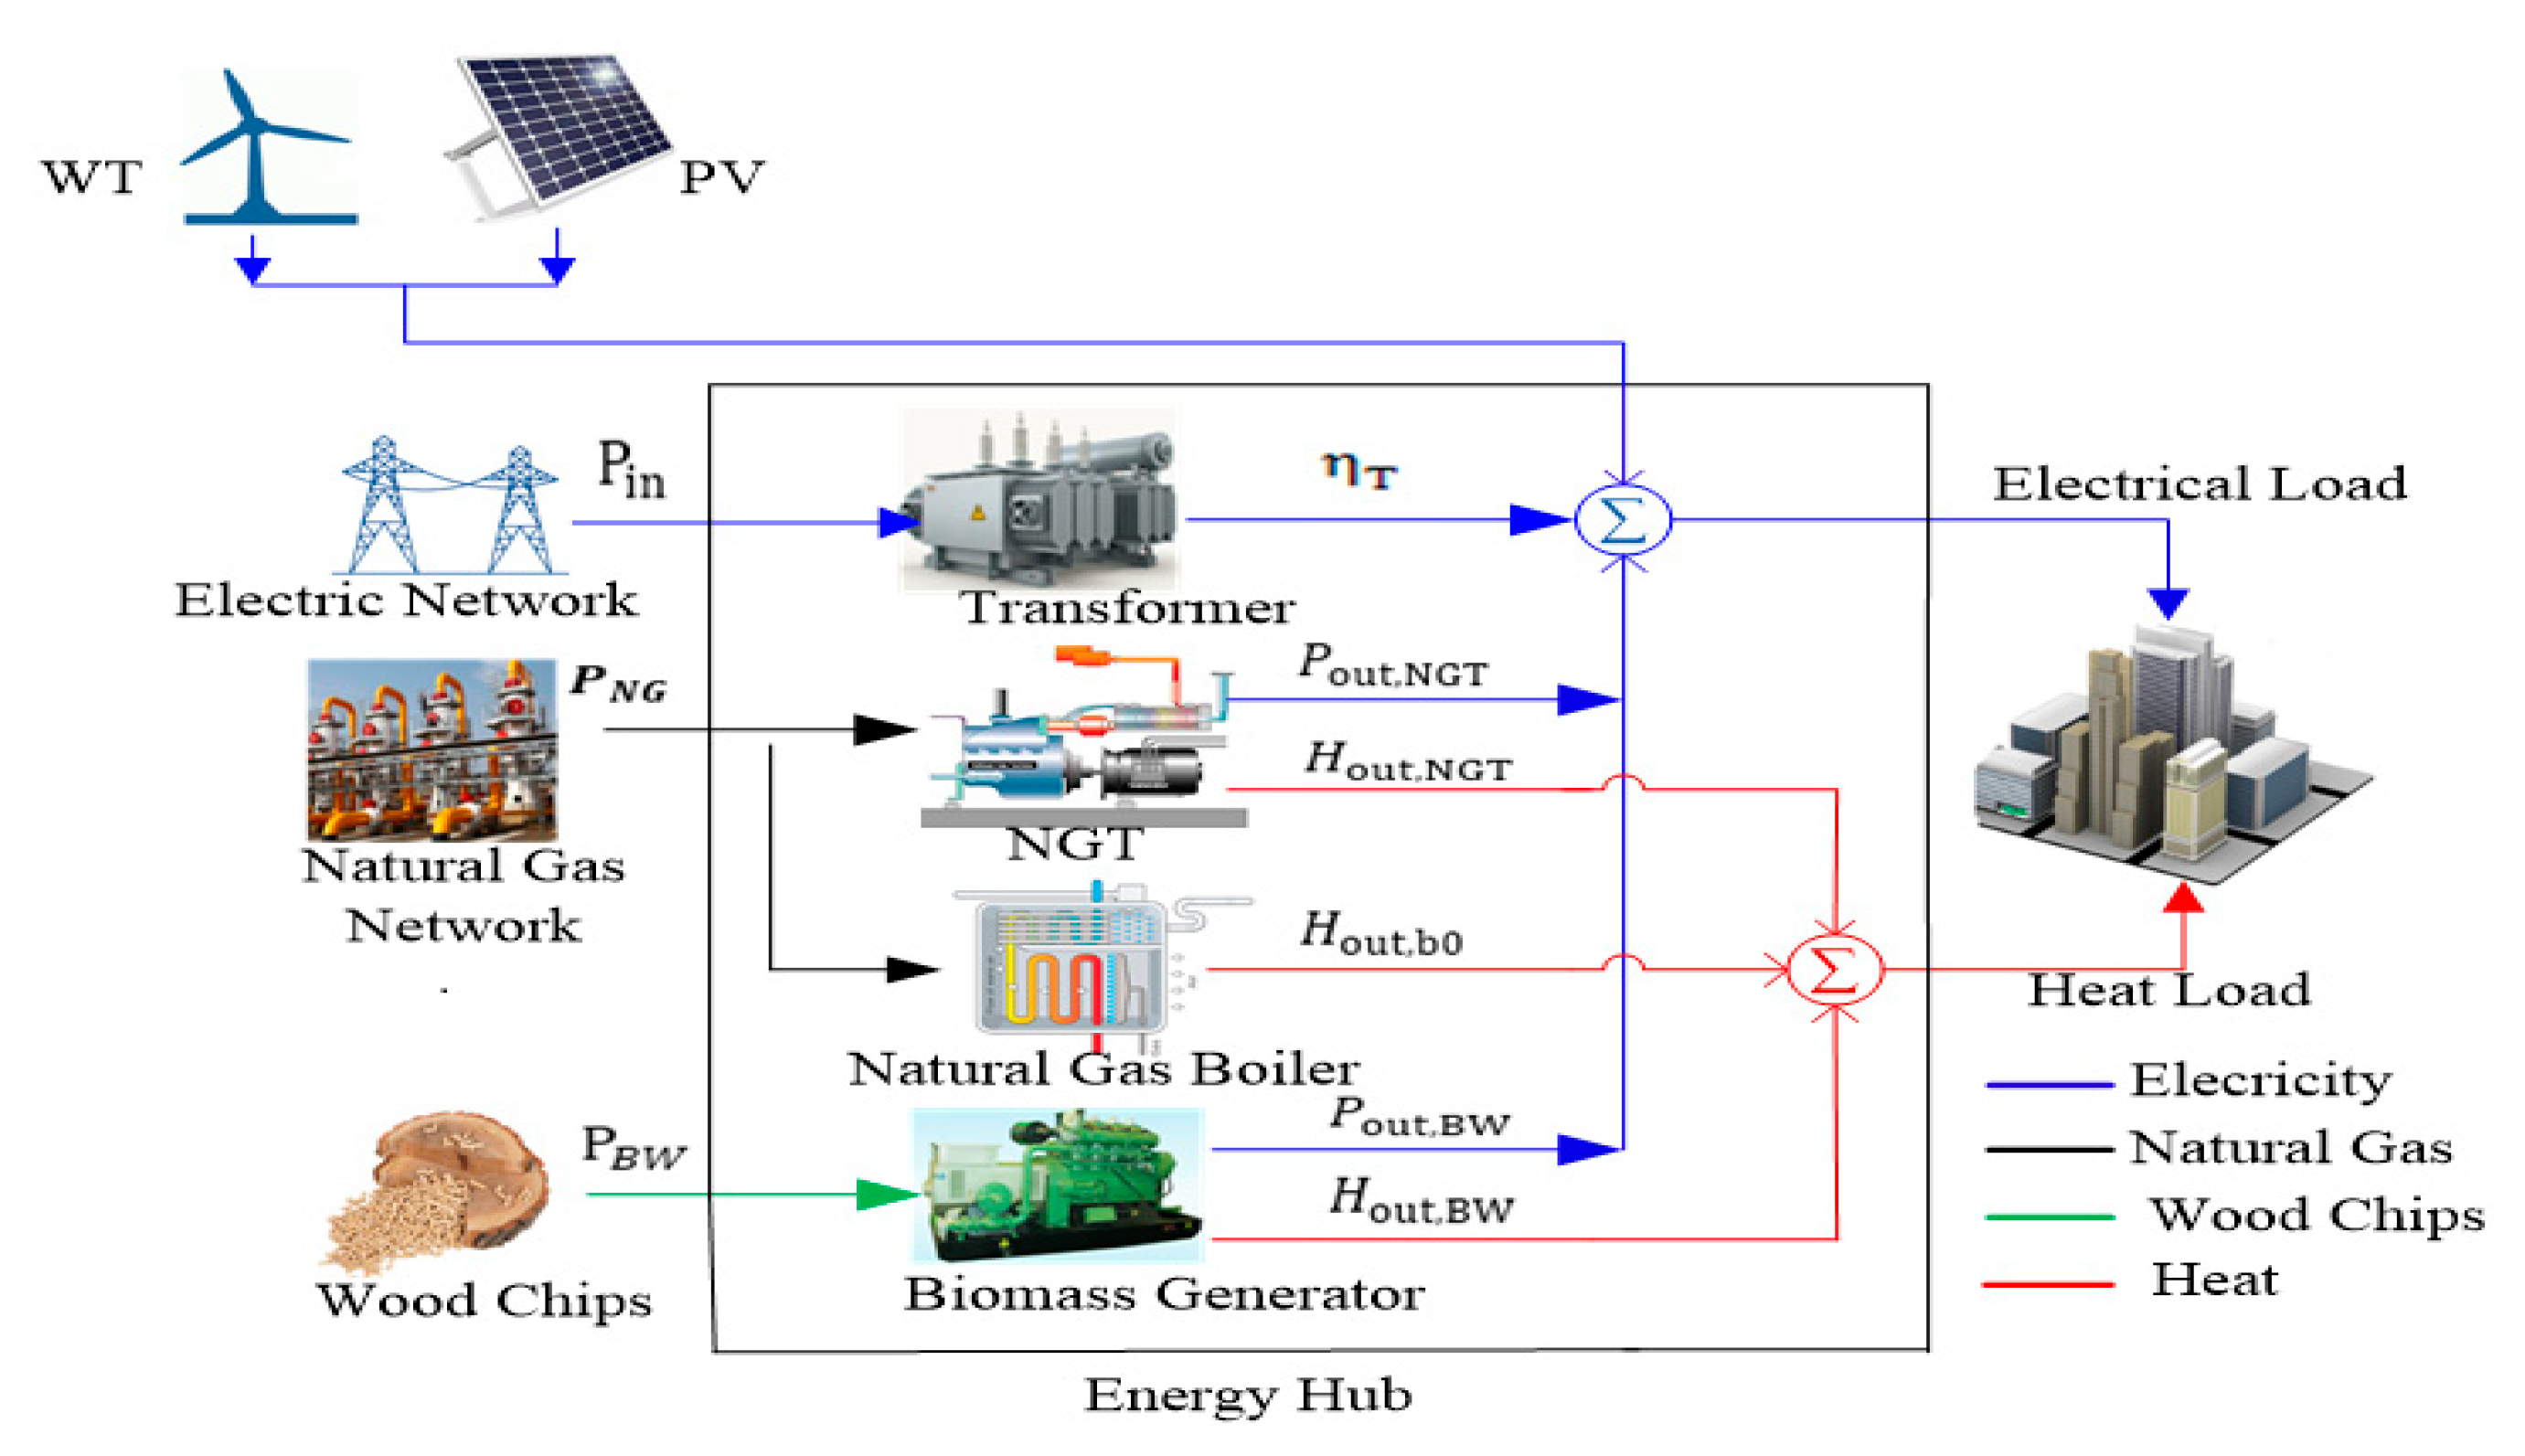
2. Hub Components Modeling

Besides sharing various forms of energies with the surrounding networks, the multi-carrier hub system provides a connection between various energy infrastructures and several load types. Figure 1 depicts the general framework of the multiple carrier’s systems. The linking between the output carrier’s L and the input carrier’s P is estimated by the coupling matrix C, given as follows [26]:
L =   CP
where the coupling matrix C that links all inputs energy P α .   P β and all outputs energy L α . L β is stated by the following matrix form equation.
[ L α L β ] = [ C α α C α β C β α C β β ] [ P α P β ]
where, C α β is the coupling factor between input energy P α and output energy P β .
Figure 2 shows the formation of the examined energy hub system. In this framework, in addition to the inputs of the wind and solar energy carriers, the consumed electrical and biomass, and natural gas energies are converted to electrical and heat energy to fulfill load needs. The energy hub consists mainly of biomass generating units and natural gas turbines with the assimilation of WTs and PVs. In addition to the conventional boiler, it is utilized to compensate the inadequate heat requirements. The steady-state of the multi carrier’s hub framework is represented as follows:
[ P out H out ] = [ η T 0 η BWe η BWh α η NGTe α η NGTh + ( 1 α ) η bo 1 0 ] [ P in P B W P NG P out , PV + P out , WT ]
where, P out and H out are the hub output electricity and heat, respectively. P in , P B W and P NG are electricity, biomass, and natural gas inputs, respectively. P o u t , PV and P o u t , WT are PVs and WTs output power, respectively. η T and η bo are the efficiency of the electrical transformer and boiler, respectively. α is the dispatch factor. η BWe and η NGTe are the electrical efficiency of the biomass unit and NGT, respectively. η BWh and η NGTh are the thermal efficiency of the biomass unit and NGT, respectively.

3. Problem Formulation

In this section, the appropriately coordinated energy hub planning structure is defined for one scheduling day. The objective is to lessen the overall cost of operation or total CO2 emissions, or both.

3.1. Objective Functions

The objective is to assess optimal scheduling and the combination of different types of the multi-energy carrier infrastructures that guarantee the energy hub can operate economically in a wide range of load conditions. During this analysis, two objective functions are considered, in comparison to the overall objective function (F3), the gross operating expenses of the hub (F1), and the comprehensive CO2 released from the energy hub (F2). The gross operating expenditure of the hub consists of three main parts, including fuel cost ( F f u e l ), costs of maintenance ( F m ) and the costs of purchased energy ( F p u r ). The overall system emissions include the CO2 released from CHP units ( E C H P ), the emissions from the boiler ( E b o ) and the CO2 created by the electric grid ( E g ).
Minimize   ( F 1 ,   F 2 )
F 1 = F f u e l + F m + F p u r
F f u e l = t Є T ( C N G P N G ( t ) + C B W P B W ( t ) )
F m = t Є T ( C m , N G T P o u t , N G T ( t ) + C m , B W P o u t , B W ( t ) + C m b o H b o ( t ) + C m , P V P out , PV ( t ) + C m , W T P out , WT )
F p u r = t Є T ( C b u y P g , b u y ( t ) C s e l l P g , s e l l ( t ) )
F 2 = E C H P + E b o + E g
E C H P = K N G T P o u t , N G T ( t ) + K B W P o u t , B W ( t )
E b o = t Є T K b o H b o ( t )
E g = t Є T K g P g , b u y ( t ) .  
where C NG and C B W are the purchasing price of the natural gas and biomass fuel in USD/kWh. C m , NGT   , C mbo , C m , BW , C m , PV and C m , WT are the costs of maintenance of the NGT, boiler, biomass generating unit, PVs and WTs in USD/kW respectively. C buy and C sell are the purchase and sale prices of electrical energy with the electrical network in USD/kWh. P g , buy . and P g , sell are the electrical energy import and export with the electrical network in kWh. K NGT , K bo , K BW and K g are the carbon emission constants of the NGT, boiler, biomass generating unit, and utility grid in kgCO2/kWh.
The single-objective problem has one distinct solution, but the multi-objective problem might have several solutions. Utilizing the weighted sum procedure is the generally popular approach to consolidate the multiple functions of optimization problems into one objective function. It is a very simple technique; however, the solution is extremely dependent on the weighting factors. Alternatively, the utopia point approach is applied in this analysis to assess the balanced solution where the combination of the two problems can be expressed as follows:
µ ( F 1 ) = { 1 ( F 1 max   F 1 ) ( F 1 max F 1 min ) 0   F 1     F 1 min   F 1 min     F 1     F 1 max   F 1 F 1 max .
µ ( F 2 ) = { 1 ( F 2 max   F 2 ) ( F 2 m a x   F 2 min ) 0   F 2     F 2 min     F 2 min     F 2     F 2 max   F 2     F 2 max
F 3 = ( 1   µ ( F 1 ) ) 2 + ( 1   µ ( F 2 ) ) 2
where F 1 max and F 1 min are the maximum and minimum bands of the total operating cost, respectively. F 2 max and F 2 min are the maximum and minimum bands of the total CO2 emissions.

3.2. Energy Hub Constraints

The energy generation needs to be limited within the permissible boundaries of the hub network because the rated capacity of each unit always bounds it, so that the objected functions are examined according to the system constraints given by the following equations:
0     P in ( t ) t Є T
P g , sell ( t )     P gmax   t Є T
0     P o u t , B W ( t )     P BWr   t Є T .  
0     P out , NGT ( t )     P N G T r   t Є T .
0     P NG ( t )     P NGmax   t Є T
0     α     1 t Є T
where P gmax . is the maximum limit of the energy can be bought from the electrical grid. P BWr and, P N G T r are biomass generating unit and NGT rated output power, respectively. P NGmax is the upper bound which can be purchased from the network of the natural gas.

4. Implementation of PSO
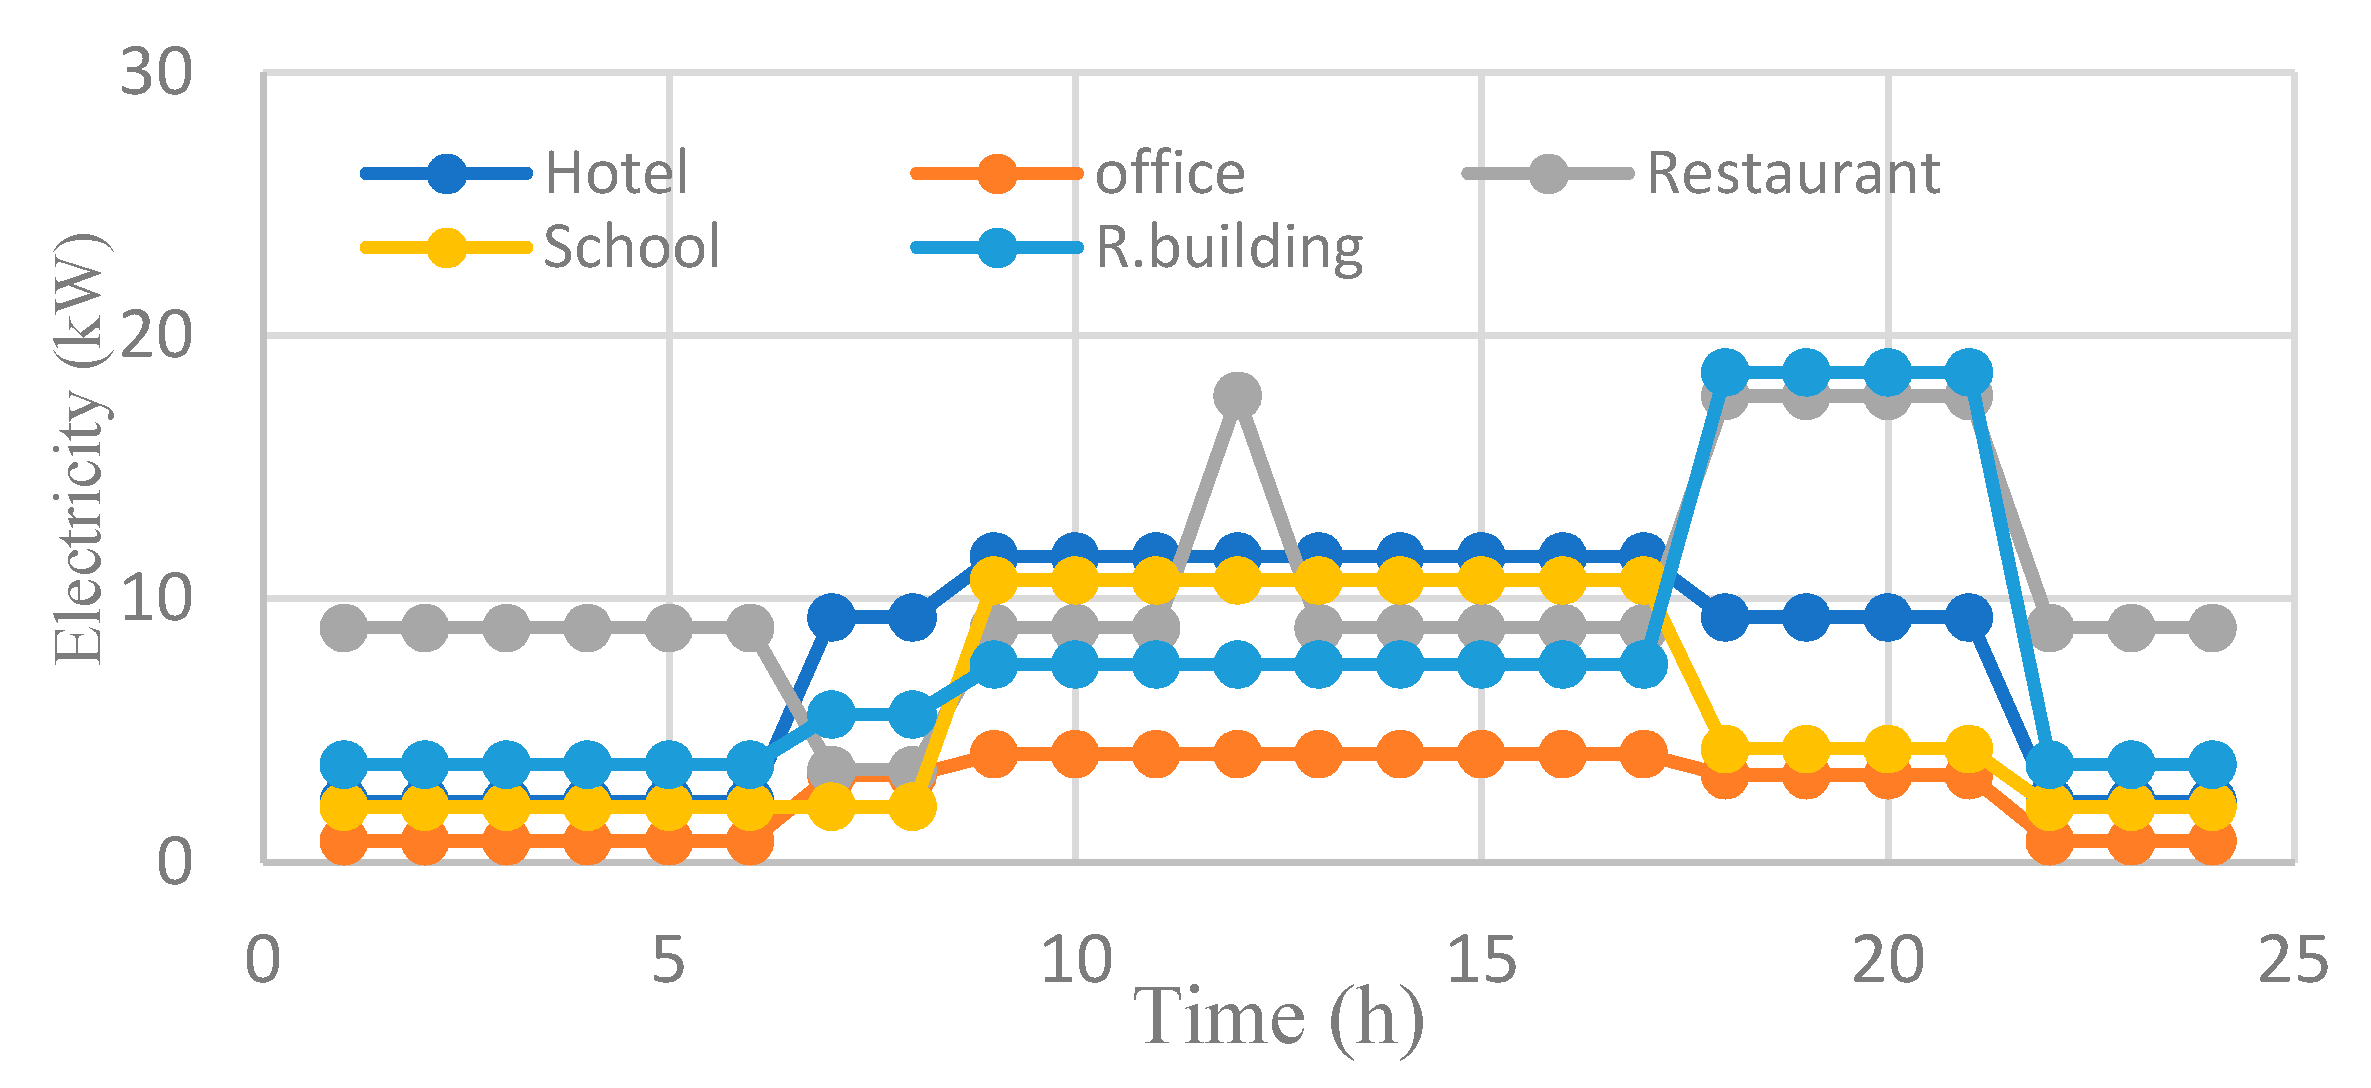
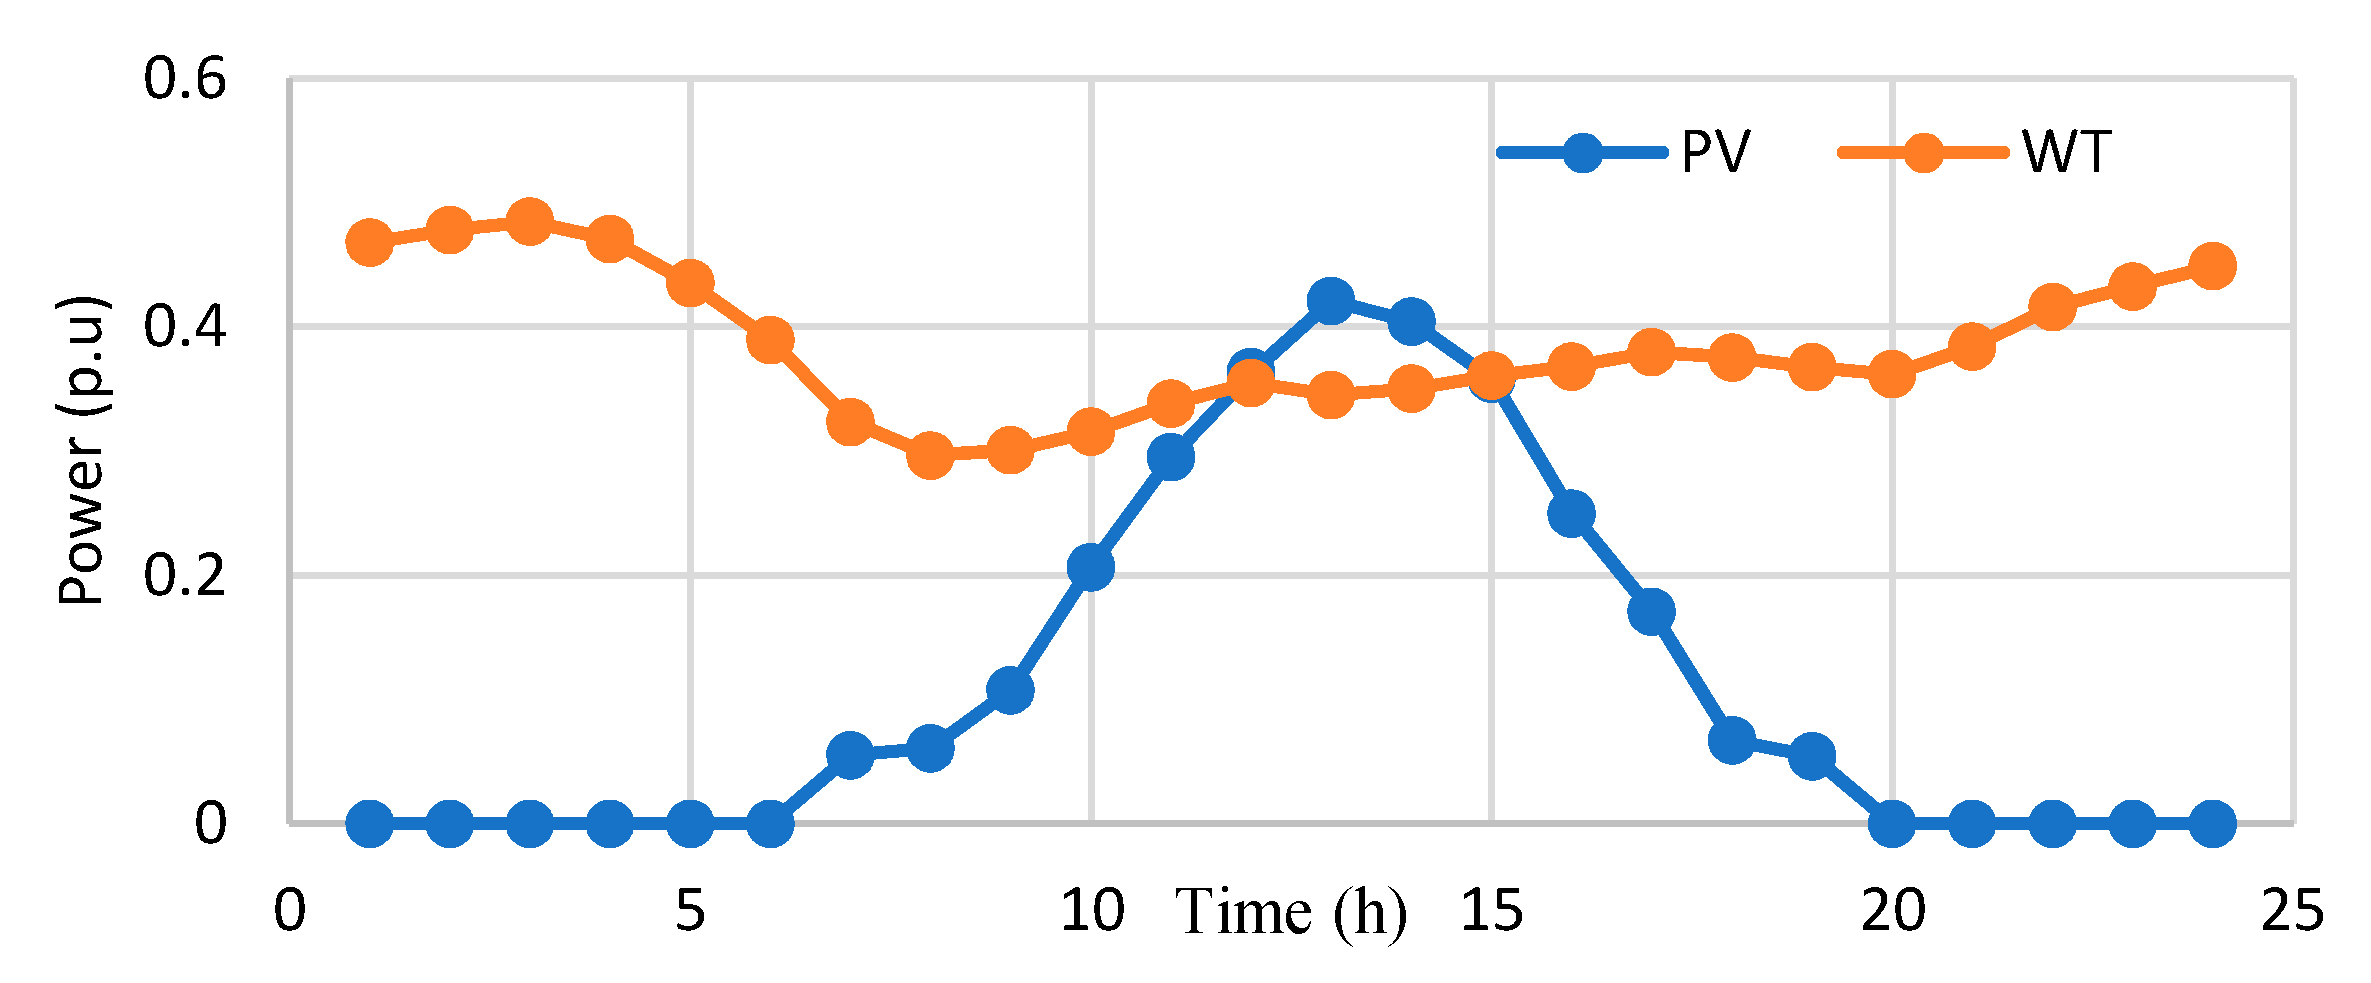
The multi objected PSO algorithm is introduced in this paper to determine the optimum scheduling of the multi-energy hub scheme. PSO is much simpler to be implemented than the genetic algorithm because it does not require mutation and crossover operators. Moreover, instead of encoding/decoding variables into binary codes such as in GA, PSO uses the random actual number and universal sharing of information between individuals in the swarm. Each individual in the swarm moves to its local best known position ( pbest i ), but it is also guided by the global better position ( gbest ) in the search space, which is the best location found by other particles in the search space [27,28]. If a particle gets a better location than the former one, it will change its location as the new best one for particle i. Let x i k and v i k be the position and velocity vector of the swarm particle at iteration k . Each particle then updates its velocity by the following equation:
v i k + 1 = v i k   + α ϵ 1 × [ gbest     x i k ]   + β ϵ 2 × [ pbest i     x i k ]
where ϵ 1 and ϵ 2 are two randomized variables. α and β are the acceleration constants, which can typically be a value of 2. pbest i is the better position for particle i, and gbest is the global better position in the search space. Each individual updates the current location x i k to the next new position x i k + 1 , according to the following equation:
x i k   + 1   =   x i k   +   v i k + 1
In this study, we need to evaluate the proper scheduling of one day, which is subdivided into 24 time intervals. Figure 3 shows the essential stages of the PSO algorithm used in this analysis. The main procedures of the proposed solution method are described as follows:
Step 1: Read the input data, including forecasted electrical and thermal demands, forecasted energy prices (electricity, natural gas, and biomass), forecasted extracted energy from PVs and WTs, number of swarm particles ( n ), and the limited number of repetition ( k ).
Step 2: Create an initial population by randomizing each particle’s velocity and position in the swarm. Then, set the initial values of Pbest as the current position of each particle. Set k = 0 .
The decision variables vector ( X ) represents the optimal output power from NGT ( P o u t , N G T ( t ) ), the optimal output power from biomass generating unit ( P o u t , B W ( t ) ) and the dispatch factor ( α ( t ) ).
X t = [ P o u t , N G T ( t )   P o u t , B W ( t )   α ( t ) ] .
Step 3: Check the energy hub constraints; then, the impracticable solutions that are out the acceptable limits are excluded from the swarm population.
Step 4: For each individual in the swarm, calculate the fitness functions using (5), (9) or (15), then, update the Pbest if the new position is better than old Pbest.
Step 5: Select the best of Pbest as gbest.
Step 6: Study the terms of convergence. When reaching stable solution in sequential iterations or reaching the limited number of iterations, then go to step 8; if not, go to step 7.
Step 7: Evaluate new population by updating the speed and location of each individual in the swarm in accordance with (22) and (23), respectively, and then, update iteration k = k + 1 , then go to step 2.
Step 8: Report the results.

5. Case Study

In this study, the energy hub serves five local sites, including campus restaurant, office building, 100 residential, school campus, and hotel. The electricity and thermal load demands of one typical day are illustrated in Figure 4 and Figure 5, respectively [29]. Figure 6 shows the p.u output power from PVs and WTs for one typical day. Table 1 and Table 2 present the energy hub parameters and the price of electricity used for estimating the running cost and CO2 emissions. The multiple energy hub is equipped with NGT, biomass generating unit, PVs, and WTs with an electrical capacity of 1900, 1900, 500, and 500 kW, respectively, whereas the thermal capacity of NGT and Biomass generating unit is 2600 and 4500 kW, respectively. The hub system is studied with and without the integration of renewable energy sources. In addition, a comparison between three cases, including single objective functions of operating expenses of the hub and total carbon emitted from the hub, and the multi-objective function of the operating expenses and carbon emissions are studied. The optimum energy hub construction and planning are achieved using a PSO algorithm for single and multi-objective functions. Table 3 shows the configuration of the studied systems. Three main objective functions are considered during the analysis of each configuration of the hub system including lessening the gross running cost (F1), lessening total system emissions (F2), and compromised solution (F3). F3 represents the compromised balanced solution (both total system expenses and CO2 emissions are used to evaluate (F3)). Instead of using a weighted sum method to obtain a single objective function, the utopia point method is used to minimize the distance between the compromised solutions and an ideal solution by using Equations (13)–(15), where the optimum solution of F1 is used to find the minimum band of the total operating expenses ( F 1 min ) and the maximum band of the total system emission ( F 2 max ). Meanwhile, the optimal solution of F2 is used to find the maximum band on the total operating cost ( F 1 max ) and the minimum band of the total system emission ( F 2 min ).
MATLAB/Simulink 2019a is used to solve the optimization problem formulated in this paper. The optimization algorithm is performed on a PC with the following specifications: Core i7-4810MQ, 2.8 GHz CPU, 16 GB RAM, and 64-bit OS. The maximum number of iterations (k) is set at 100 iterations, while the convergence tolerance was set at 10−5. It has been suggested that the two acceleration constants should be α = β = 2, while the swarm population size is assumed to have 5000 particles.

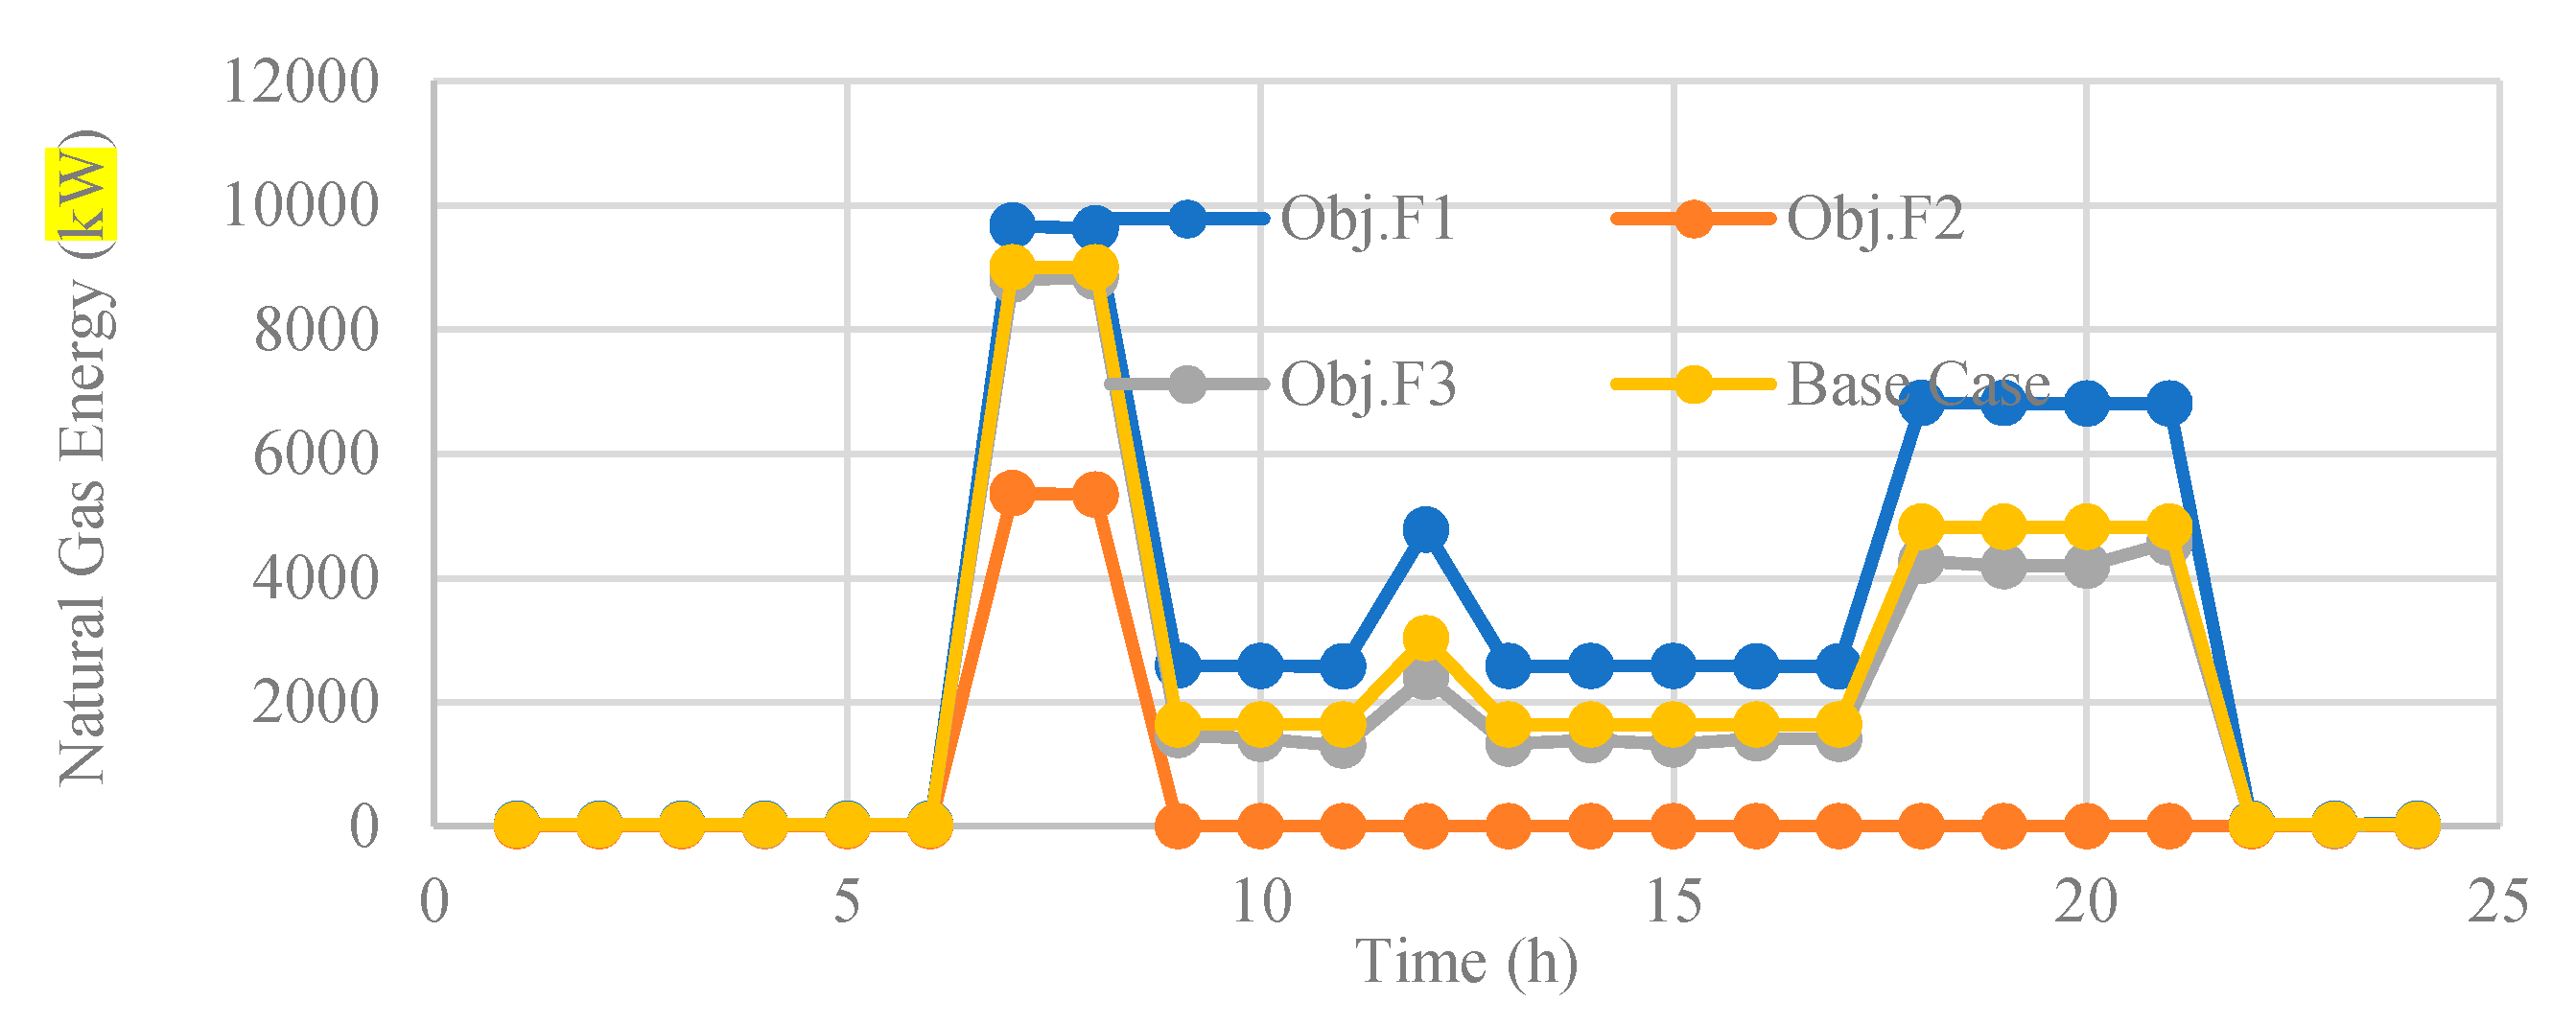
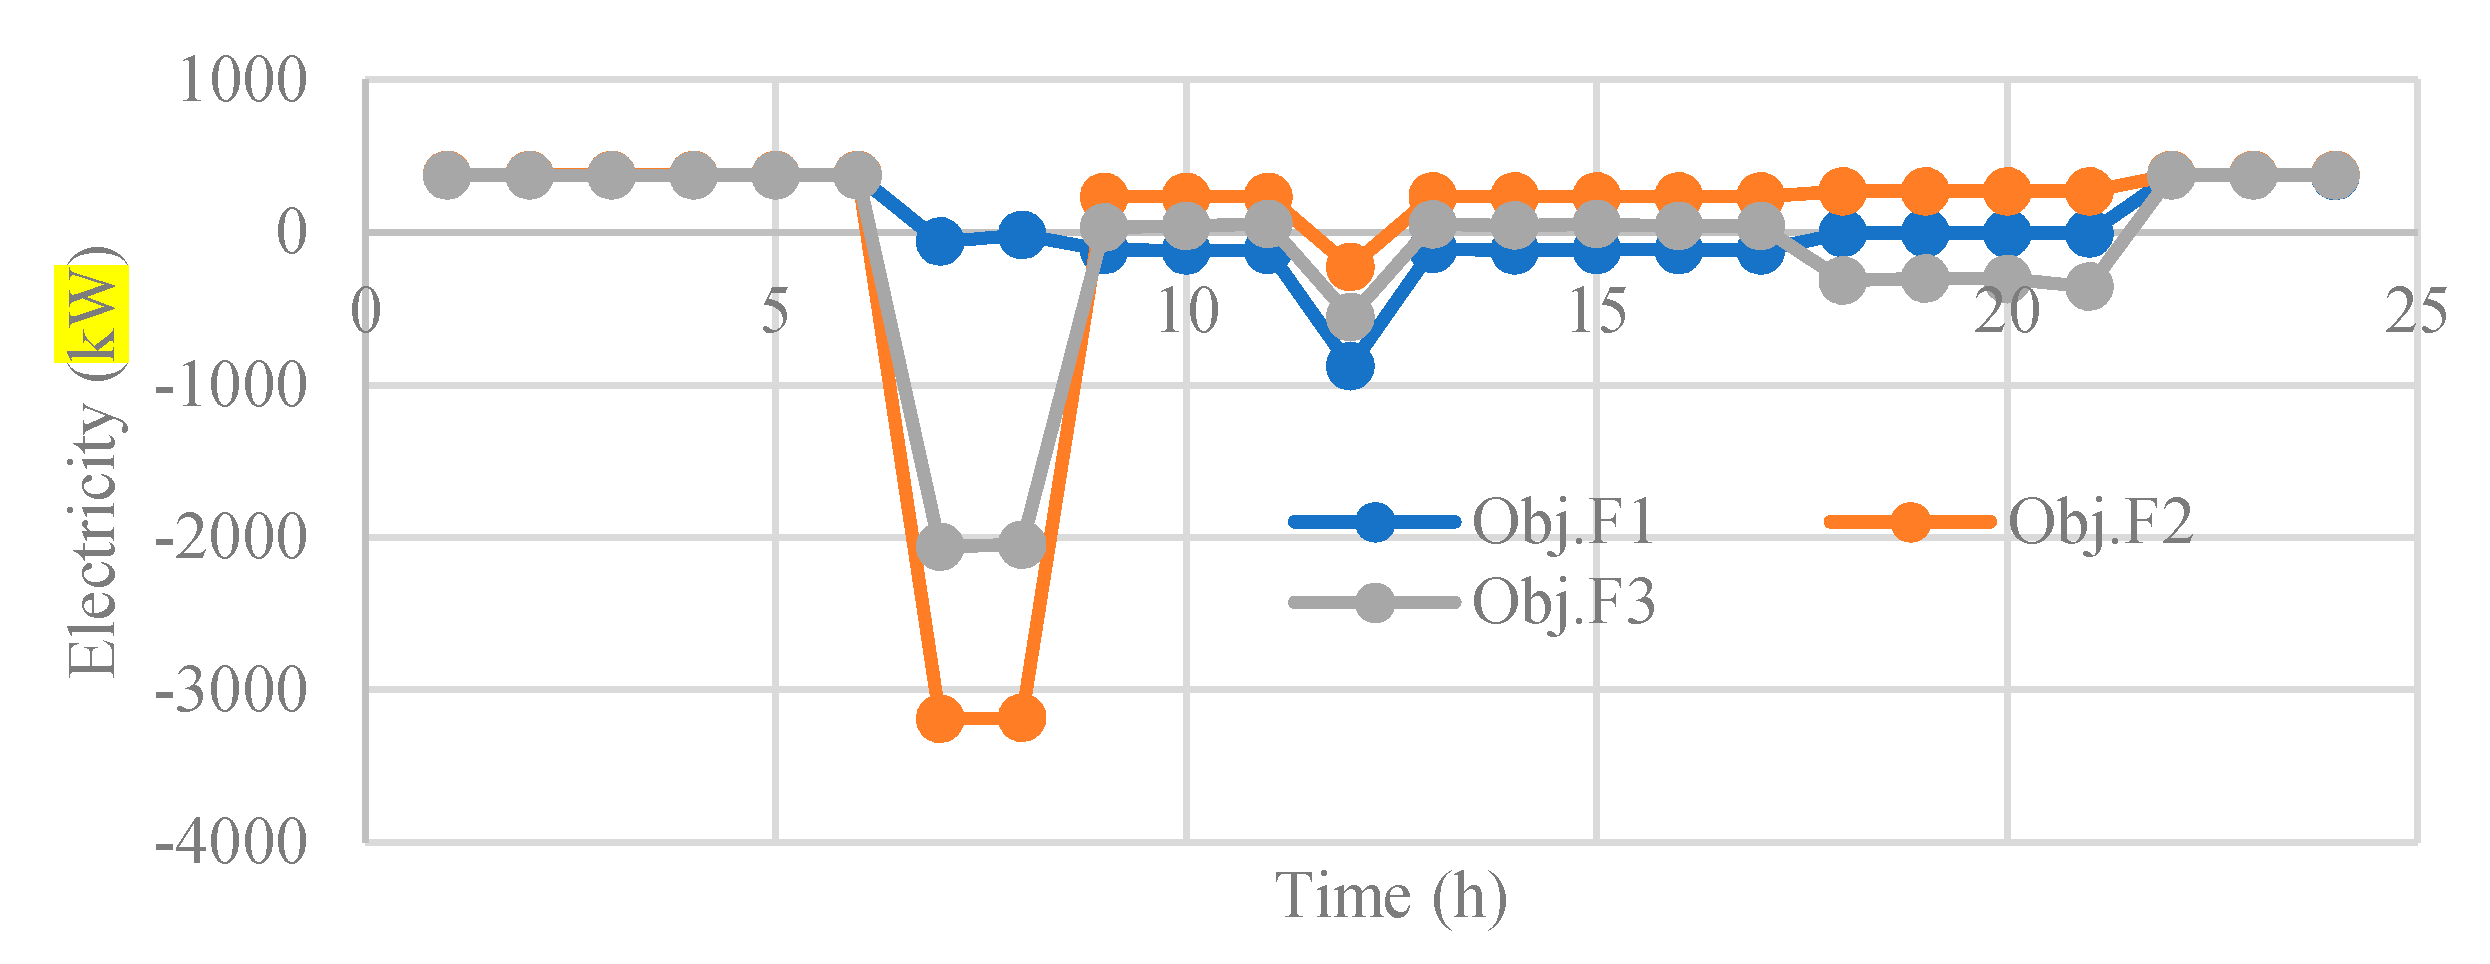
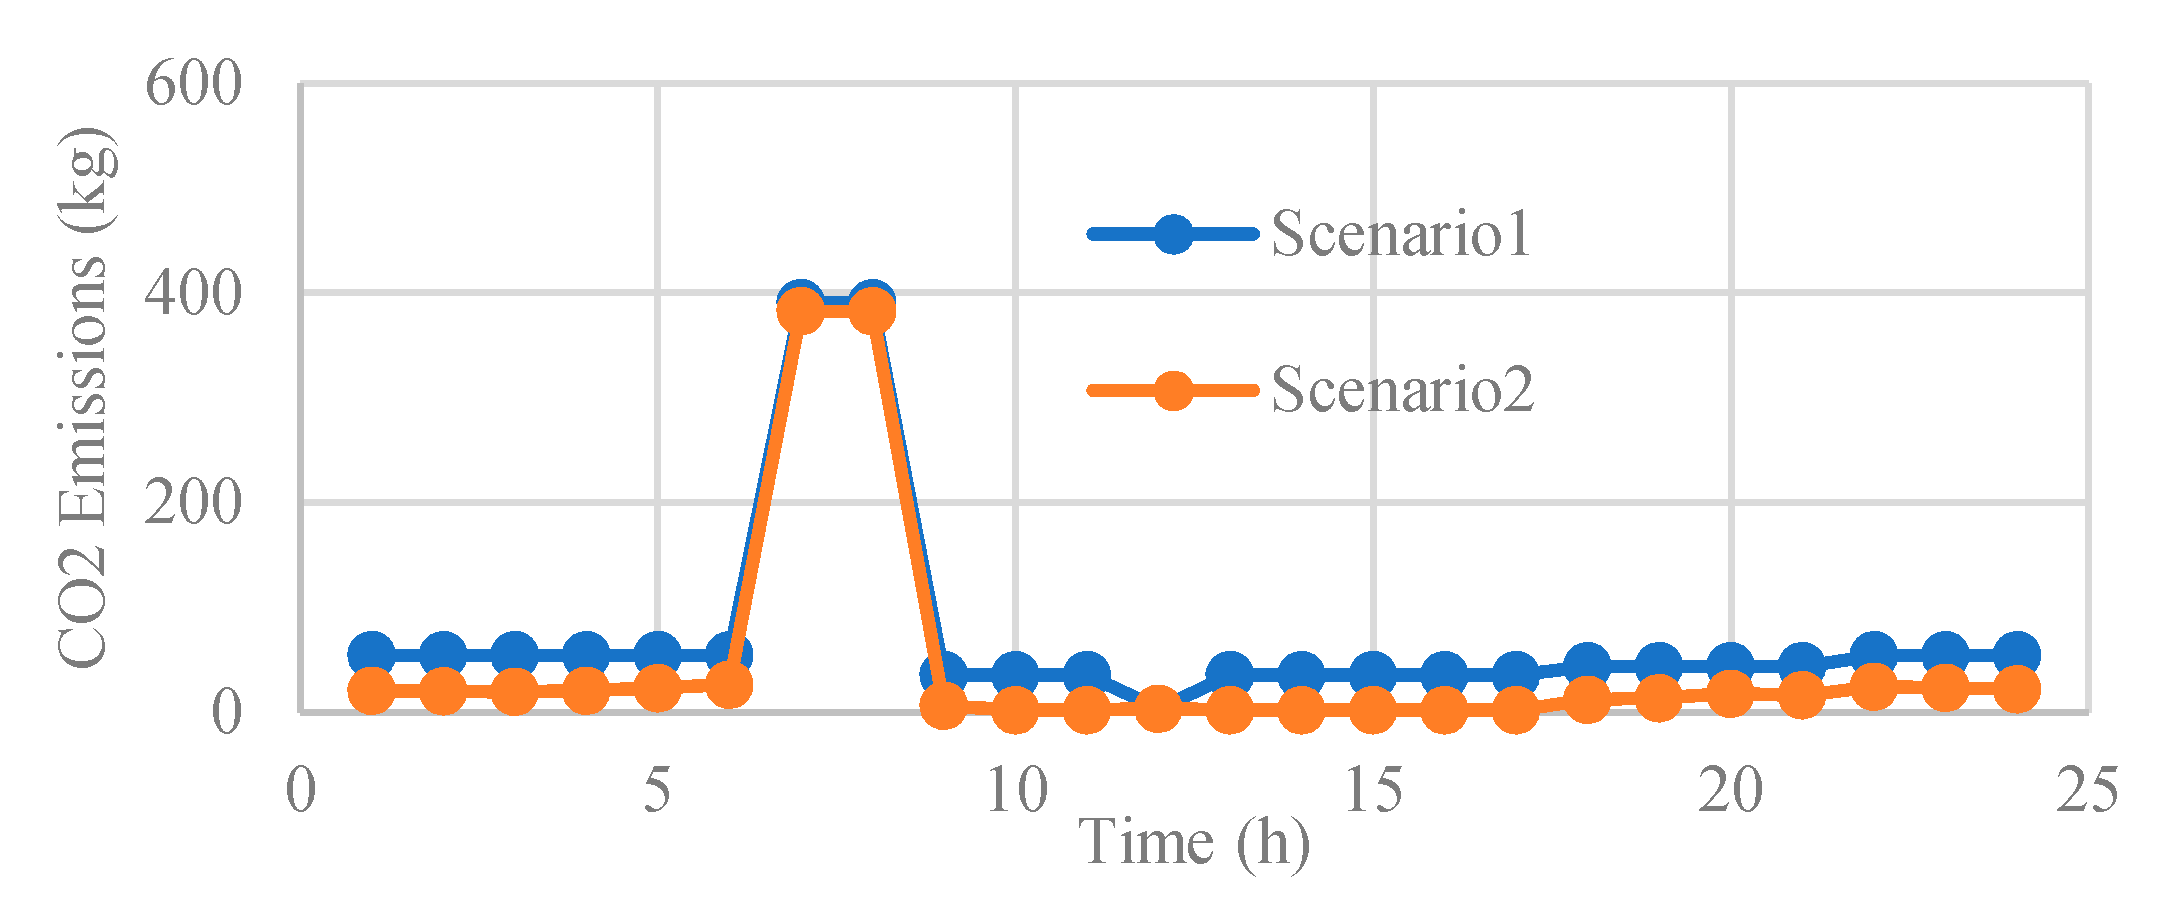
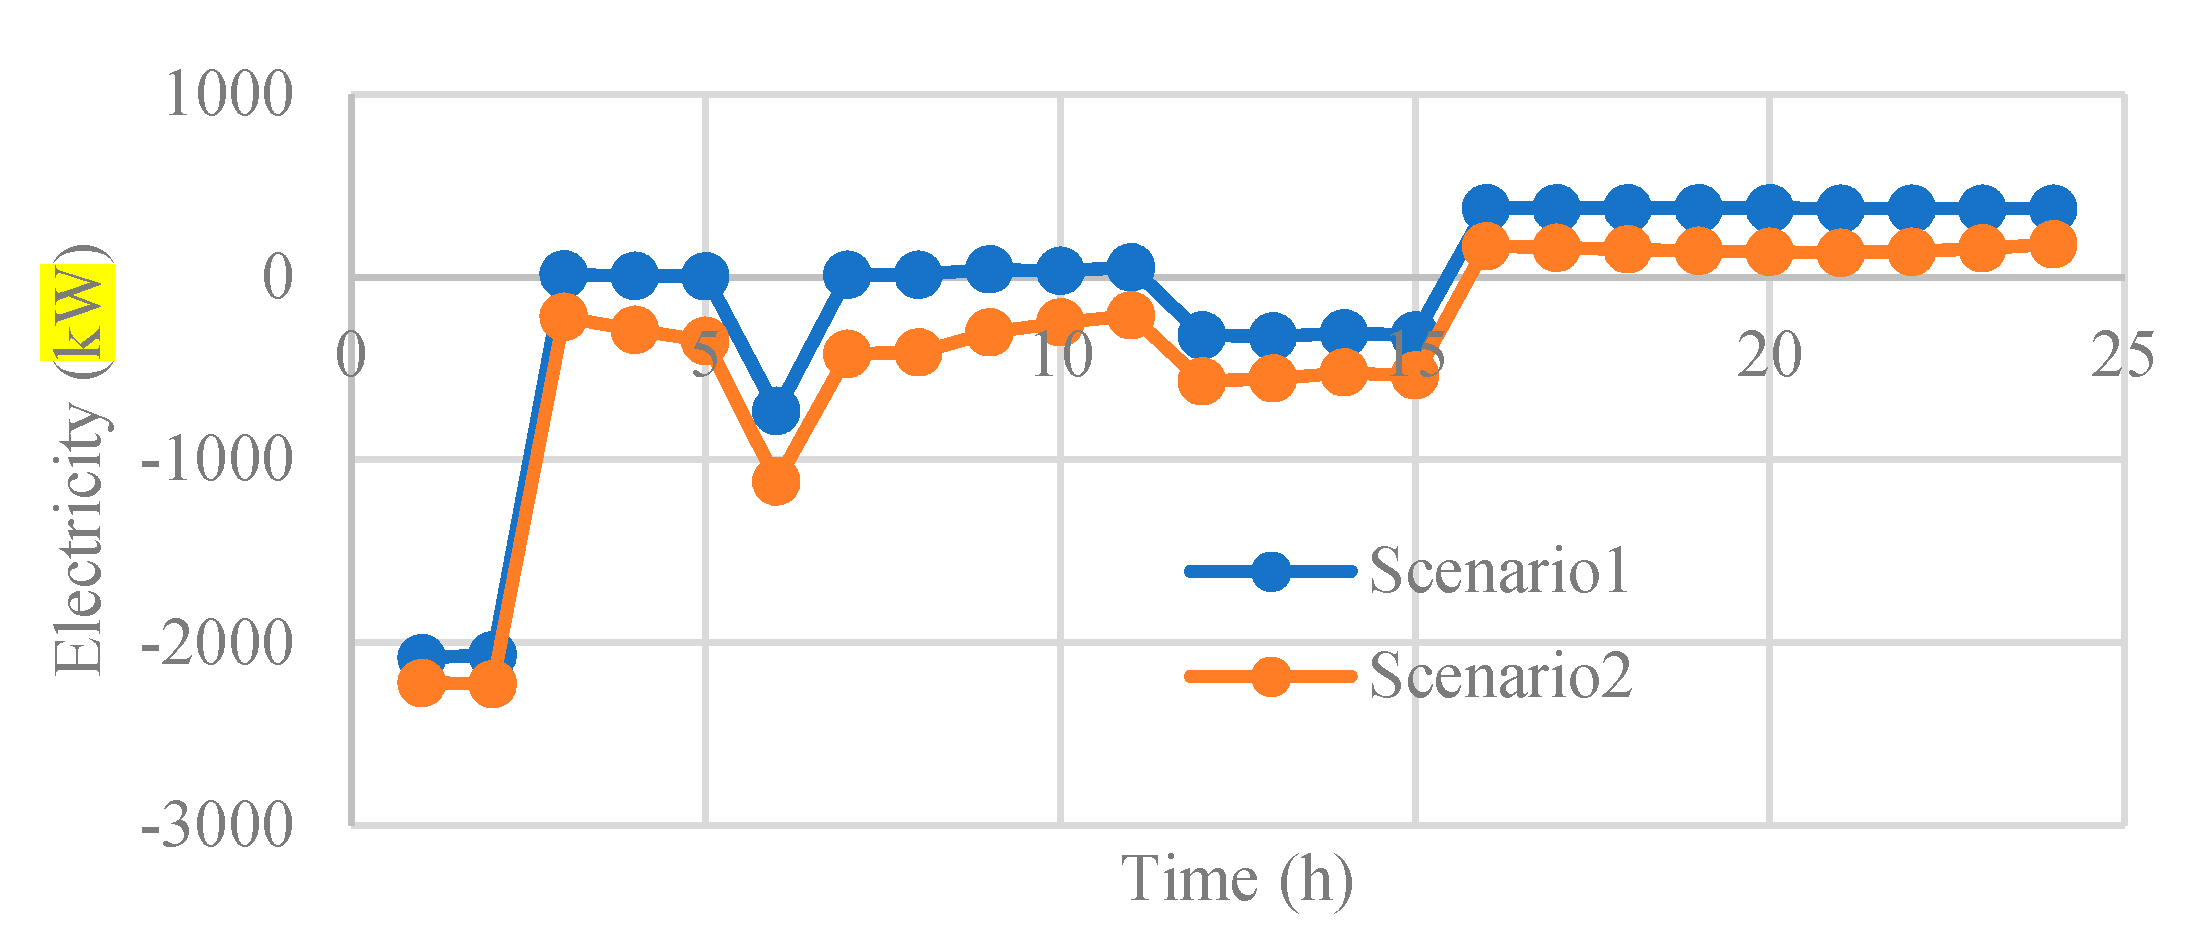
6. Results and Discussion

6.1. Base Case

In this case, there are two main sources utilized in the energy hub system, which are the natural gas boiler to achieve the thermal requirements and the electrical utility grid to supply the electrical load. In this case, NGT, wood chips biomass unit, PVs, and WTs are not integrated into the energy hub system. So that no control strategy is used in this case, the full load requirements are fulfilled by the natural gas boiler and electrical network grid. Table 4 shows the result of the hub energy in the base case. It is found that the total operating cost of the energy hub is 4871 USD. Furthermore, the total amount of CO2 emissions is 17,729 kg. From Table 4, we observed a large amount of energy drawn from the grid to cover the electrical load, about 19.3 MWh, while an enormous amount of heat energy, about 40.7 MWh, is generated from the natural gas boiler to meet the thermal load. Because of this large amount of energy that results in high CO2 emission, the effect of biomass and renewable energies is studied. The studied configurations are shown in Table 3. The following subsection illustrates the results of these studied configurations.
For the purpose of clarification and comparison, the study of the energy hub system is categorized into two main categories, the first and second scenario. In the first scenario, the optimization problem of the energy hub, which consists of a natural gas turbine and wood chips biomass generating unit, is solved without the integration of PVs and WTs, whereas in the second scenario, the study takes into account the association of PVs and WTs.

6.2. First Scenario

6.2.1. Configuration 1

In this configuration, NGT and the conventional boiler are designed to satisfy hub load demands. The excess and the deficient energy is exchanged with the utility grid. A particle swarm algorithm is applied to find the energy output for each unit to minimize the following objective functions: total operating expenses (F1), CO2 emission (F2), and the intermediate function (F3). Table 5 shows the result for configuration 1 in comparison with the base case. From this table, it is observed that the operational cost and overall hub emissions for all objectives are less than the base case. Therefore, more economical and environmental benefits are gained due to using NGT. Besides maximization, the amount of selling electricity to the utility network and diminution of the total electricity imported from the electric network for all objective functions in configuration 1, relative to the base case. From an economic perspective, the multi-carrier system based on the F1 case is the best because the total hub operating expenses lessen by 35.2% relative to the base case. The hub system based on objective function F2 is the best from an environmental perspective because it provides the minimum level of CO2 emissions relative to other objective functions F1 and F3. For objective function F2, the CO2 emission level is constringed by 47.8% in comparison to the base case. Over and above that, the multiple energy system based on F3 gives an intermediate solution, where the overall expenses are cut down by 35%, while the CO2 emissions are depressed by 45.5%.
Figure 7 shows the dispatch factor used to estimate natural gas usage. The response with objective F1 indicates the lowest dispatch factor values compared to F2 and F3 cases. Therefore, the conventional boiler consumes more natural gas to fulfill the thermal load requirements at a reasonably low price regardless of the quantities of CO2 released from the system. The natural gas boiler’s heat conversion efficiency is much greater than NGT, thus, producing more heat compared to NGT, with less amount of fuel and low price. On the other hand, the F2-based energy hub has the greatest dispatch factor values. The hub maximizes the environmental benefits from generating higher quantities of thermal energy from NGT and reduces the reliance on the boiler as it releases more carbon emissions relative to NGT. The natural gas energy trading with the natural gas supplier is shown in Figure 8. It is observed that the quantities of natural gas fuel used in the three cases are much considerably higher than that of the base case. Besides, for objective function F2, higher quantities of natural gas are utilized compared to the F1 and F3 objective cases. This is due to NGT using more fuel to generate the requirements of the load with the lowest level of emissions and reduces reliance on the boiler. Consequentially, further electrical energy is delivered to the utility grid with objective function F2 compared to other objective functions (F1and F3), as shown in Figure 9.

6.2.2. Configuration 2

The multi-carrier hub system in this configuration fulfills its load demands with the aid of a conventional boiler fueled by natural gas and a biomass generating unit beside the connection with the electrical network grid. Table 6 presents the outcomes of the optimum management problem. Energy hub system design using objective F1 is the most economical system, as it introduces a 10.2% drop in the hub’s operating expenses in comparison to the base case, whereas using F2 and F3 provides 5% and 7.8% reduction in the total operational cost of the system, respectively. On the other hand, energy hub system design with F2 introduces the lowest level of CO2 emission; it introduces an 84.1% reduction in the overall system emission relative to the base case, whereas objective F1 and F3 introduce 64.2% and 74.4% CO2 emissions reduction, respectively. The most significant quantity of natural gas is drawn from the supplier when the hub system is designed based on objective F1, as shown in Figure 10. This is because the purchasing cost of natural gas is lower than the biomass fuel. Furthermore, based on objective function F2, less quantity of natural gas fuel (as in Figure 10) and more quantity of biomass wood chips fuel (as in Figure 11) used to maximize the environmental profits of the hub system. Figure 11 shows that the F2 objective poses an additional burden on the operation of the hub system because the biomass unit at 6.00 a.m. ramps its operation to full capacity to achieve electrical and thermal load demands and in this case, the largest amount of wood chips biomass, equivalent to about 6000 kW, is consumed at the hub system input port. Finally, using the multi-objective function F3 for scheduling the hub system reflects the median solution as the overall operating expenses plummeted by 7.8%, and the whole carbon emissions dropped significantly by 74.4% in comparison to the base case. Figure 12 shows using objective function F2 results in further electrical energy offered to sell to the utility grid, while using objective F1 results in more electricity purchased from the utility grid.
By comparing the outcomes of configuration 1 and configuration 2, it is noticeable that for all objectives, configuration 1 reflects lower operating costs and more CO2 emissions than configuration 2, as displayed in Table 5 and Table 6. Because of its reasonably cheap price relative to biomass fuel, natural gas is preferable in reducing the system’s total operating costs. Furthermore, biomass fuel is favored in reducing overall hub emissions due to its beneficial impact on the environment. More collaboration occurred between the multi-carrier hub system and the utility network through the quantities of energy sold and purchased. It is observed that little amount of energy transmitted from the utility grid network to feeding the hub load, while further energy is offered to sell to the electrical network for all objective functions in configuration 1 relative to configuration 2. It is because the electrical energy generated by NGT in the three cases of configuration 1 is much greater than the electrical energy generated by the biomass generator in configuration 2, as depicted in Table 5 and Table 6.

6.2.3. Configuration 3

In this configuration, the grid-connected multi-carrier hub system is reconstructed primarily from a boiler, NGT, and biomass generator. The optimal planning outcomes are depicted in Table 7. From an economic point of view, the hub system based on F1 signifies the best case due to the total operational cost declining by 35.07% relative to the base case, as shown in Figure 13. Furthermore, from the environmental point of view, the hub system based on F1 is the worst CO2 emission case because it introduces a significant amount of pollution, as shown in Figure 14. On the other hand, the hub system based on F2 is the lowest case of the overall CO2 emissions and the most massive case of operating costs. The total CO2 emissions decreased to 9.64% relative to the base case. Table 8 shows the generated electricity and heat for configuration 3. Based on objective function F1, the energy hub relies on the energy production from NGT and the conventional boiler due to the affordable inexpensive purchasing cost of natural gas fuel relative to biomass fuel, as shown in Figure 15. While using objective function F2, the hub system primarily depends on heat and electricity produced from biomass generators. This is also clear in Figure 16. Furthermore, the energy hub based on the F3 provides a compromise case of the overall operating expenses and CO2 emissions, as depicted in Table 7. Figure 17 reveals that further electricity was bought and sold in the lowest emission case (F2) in comparison to F1 and F3 objective functions.
Table 5 and Table 7 indicate more electricity exchange with the electrical network in the third configuration compared to the first one. For example, based on objective function F2, the total energy bought from the utility grid is nearly doubled, whereas the overall electricity transmitted to the utility grid increased by 46.2% in the third configuration compared to the first one. On the other side, less electricity is purchased from the main grid. In comparison with configuration 2, there is more electrical energy transmitted to the electrical utility grid in configuration 3. For example, based on objective function F1, the total energy bought is nearly doubled in the second configuration compared to the third one. No electricity was delivered to the utility grid in the second configuration using objective function F1, while about 1.9 MWh of electricity was delivered to the utility network in the third configuration using F1. By comparing the outcomes of the above three configurations, we notice that in configuration 3, energy hub based on F1 is comparable to the same case in configuration 1 because in this case, energy hub seeks for lessening the gross operating cost function only whatever the quantity of CO2 released from the energy hub. The NGT is the preferred choice due to its lower operating cost compared to the biomass generator. The operating cost increased by 4 USD, in the third configuration compared to the first one, to achieve a 29.5 kg reduction in CO2 emissions.
Moreover, in the F2 case, the operational expenditure of the third configuration increased only 3 USD, compared to the same case in the second configuration, to achieve a 39.5% reduction in CO2 emissions. This is because the hub mainly depends on the biomass generating unit and NGT to produce most of the energy required by the load demand. As indicated in Table 7, a minimal amount of heat, about 8 kWh, is generated by the conventional boiler during this case, whereas the boiler generated more than 5 MWh in the same case of the second configuration to supply the deficient heat. Case F3 in the third configuration signifies the intermediate solution compared to the same cases in the first and second configurations. It introduces boosting of 16.4% and a reduction of 18% in total operating costs compared to the same cases in the first and second configurations, respectively. Moreover, it introduces boosting of 18.6% and a reduction of 44.2% in total CO2 emissions compared to the same cases in the first and second configurations, respectively. Comparing the outcomes of the three examined configurations in the first scenario shows that the third configuration represents the optimum combination of multi-energy hub construction. The energy hub can gain more economic and environmental profits from using mixed combination of biomass generating unit and NGT by mitigating both: overall operating expenses and CO2 released from the hub. Moreover, biomass is a clean source of energy, but it is expensive compared to natural gas.

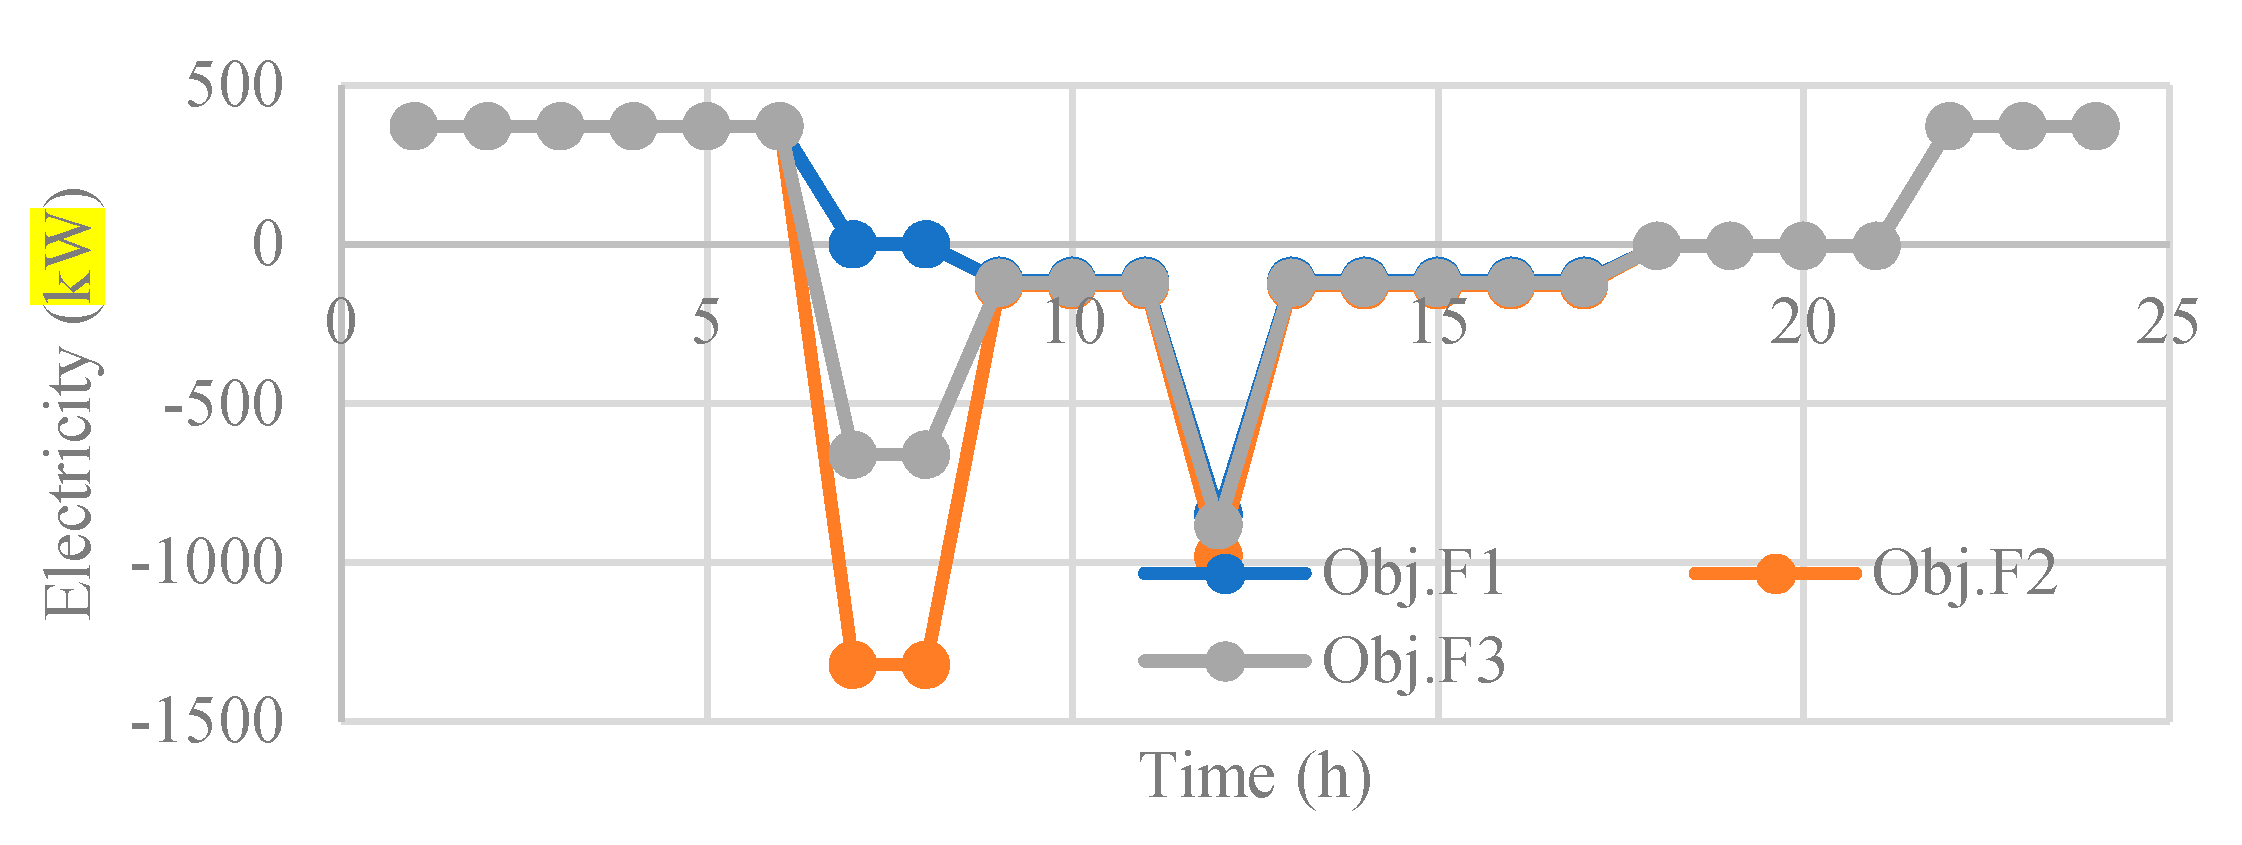
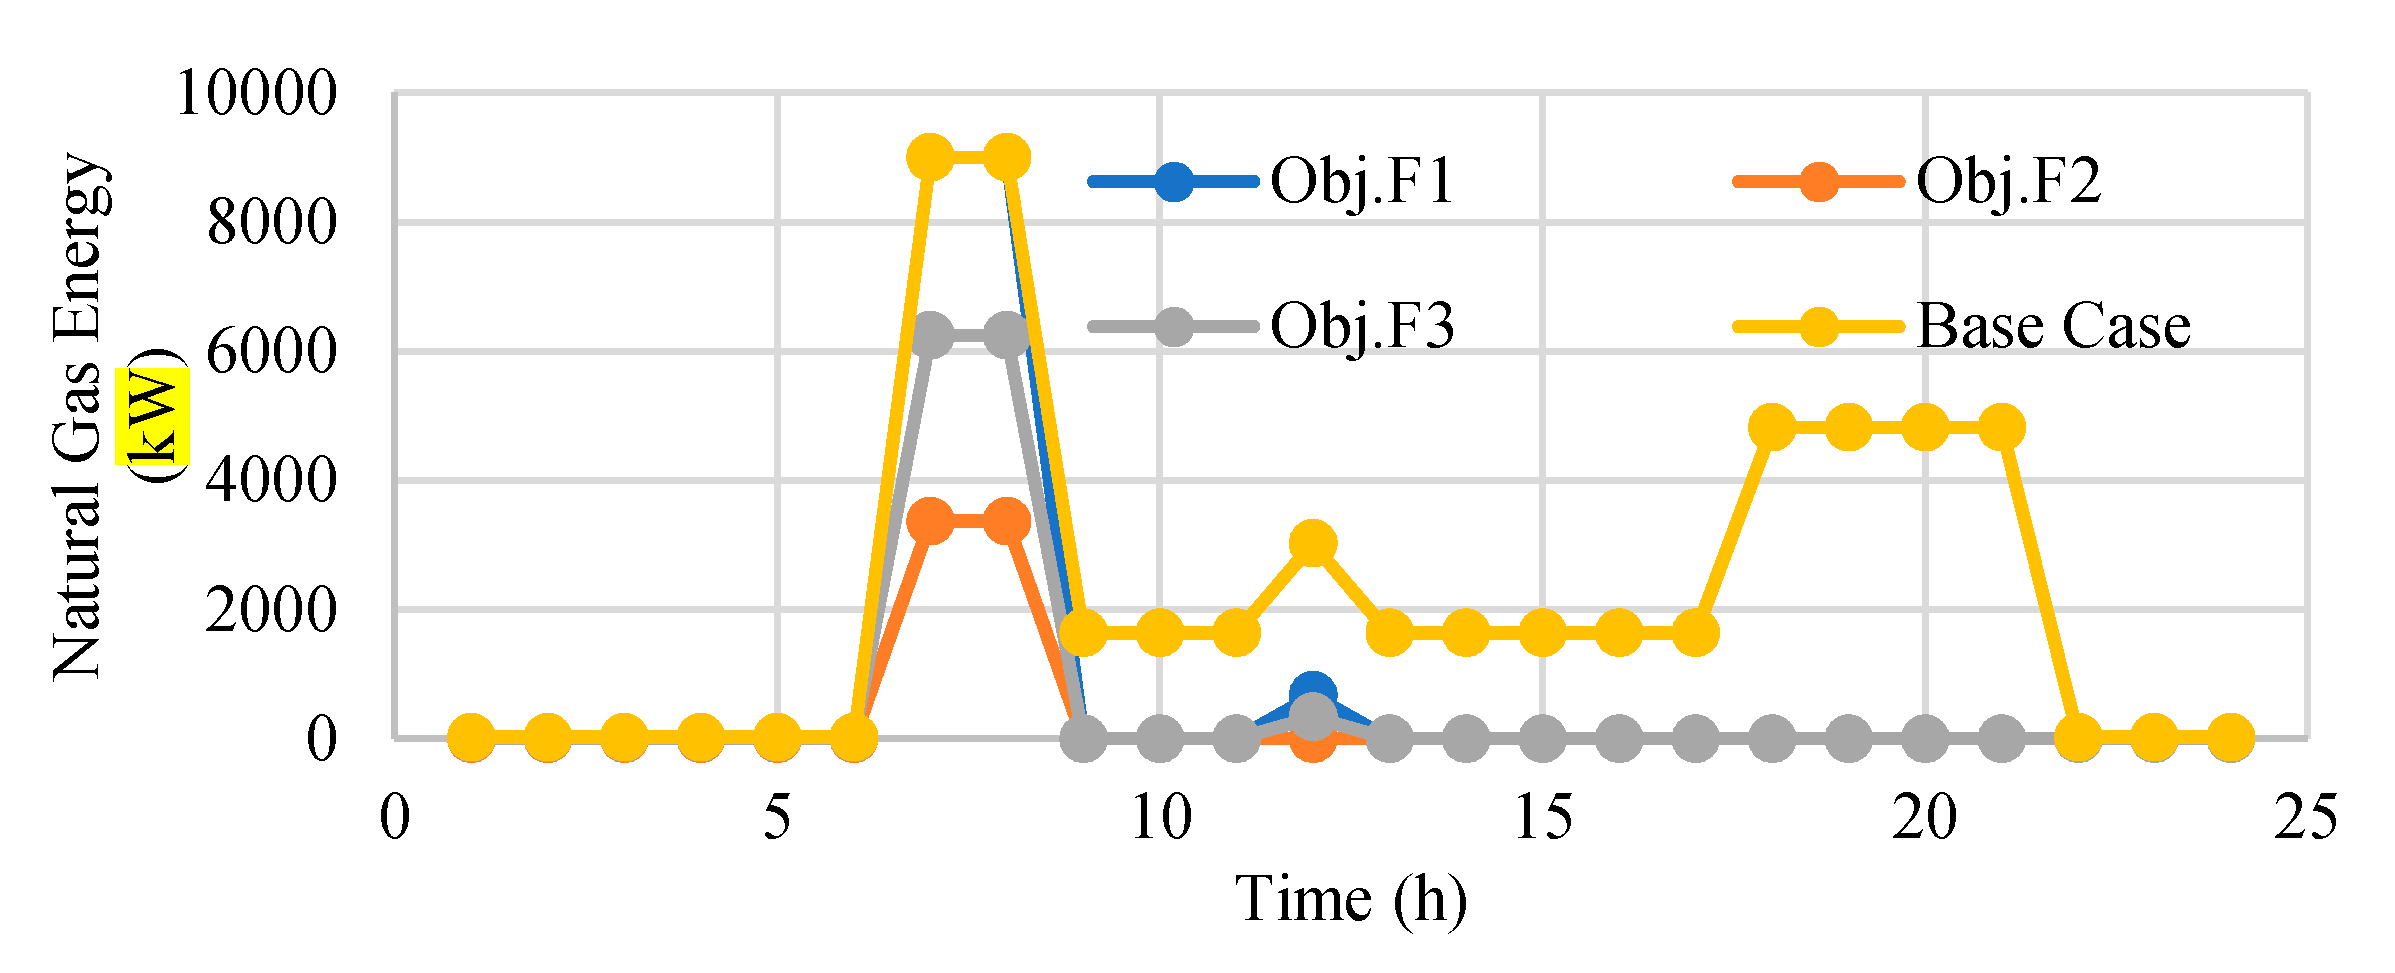
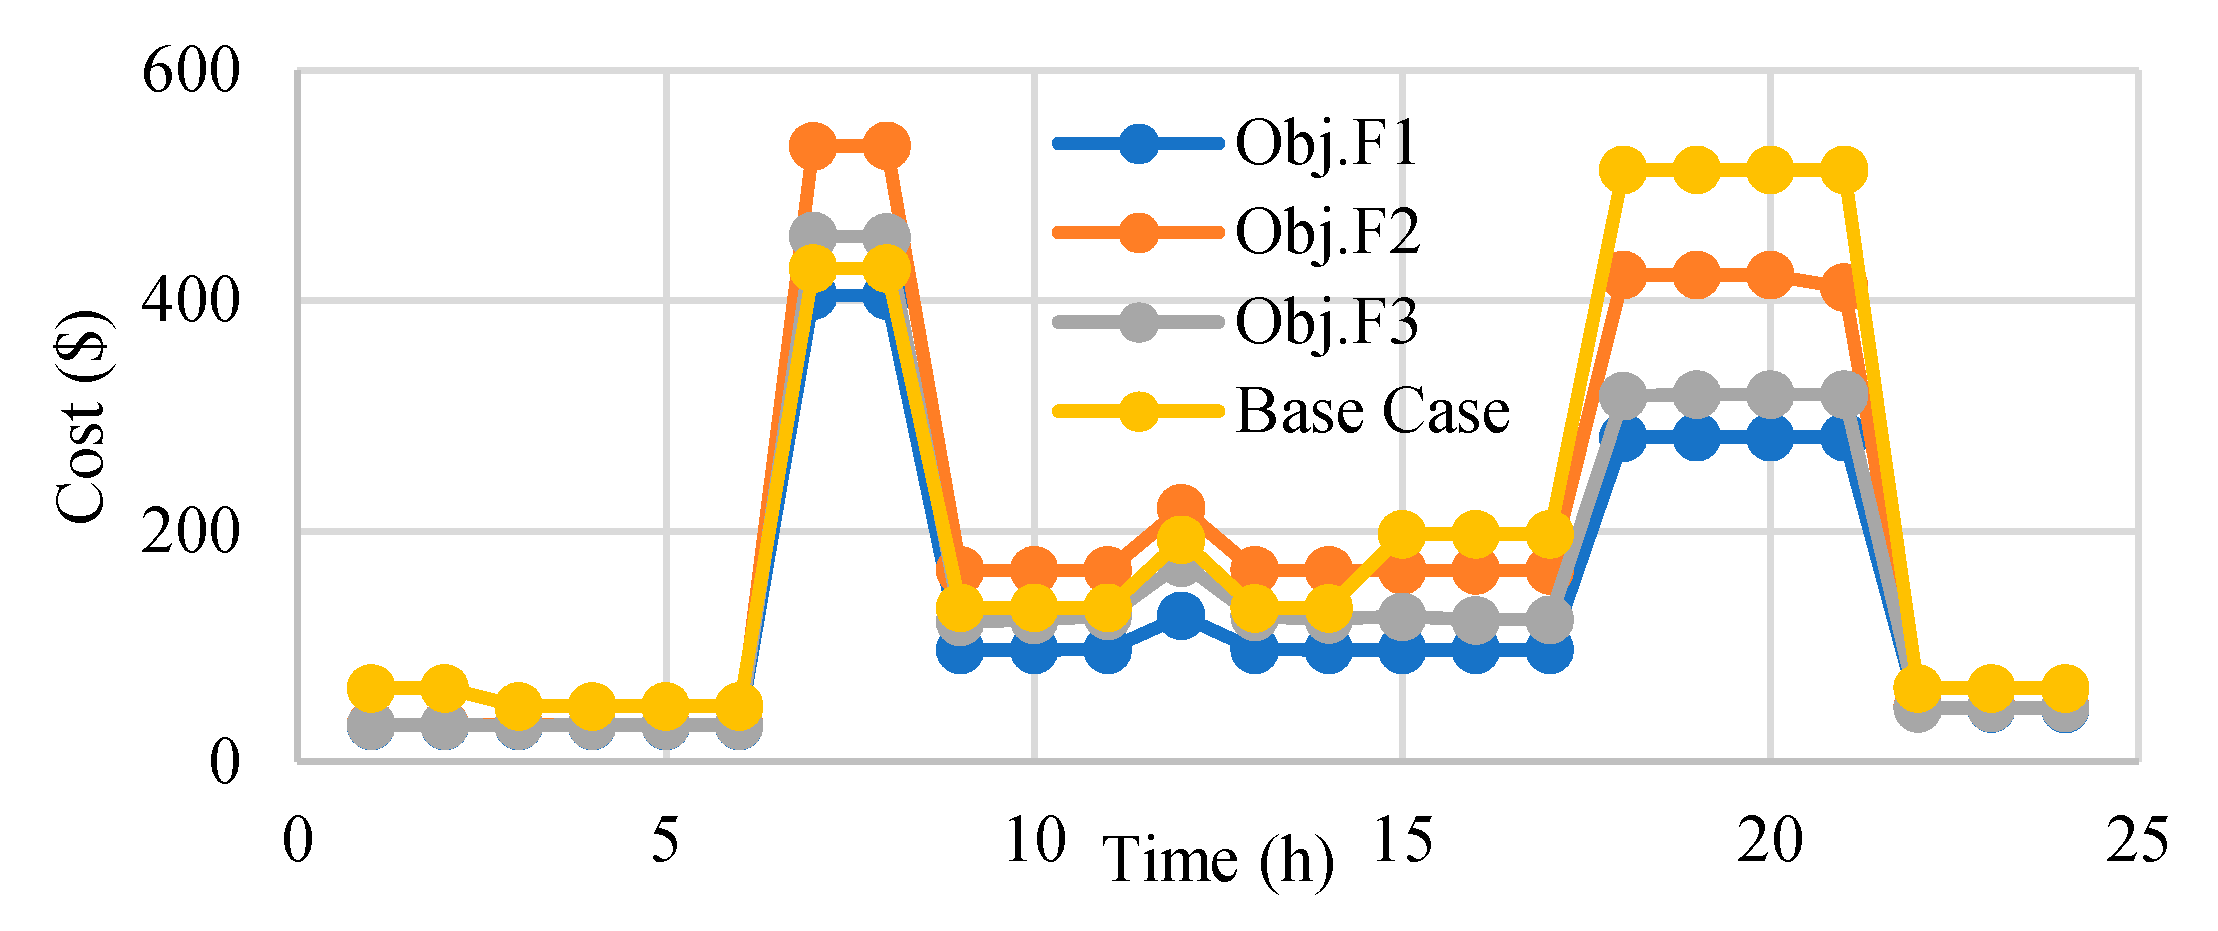
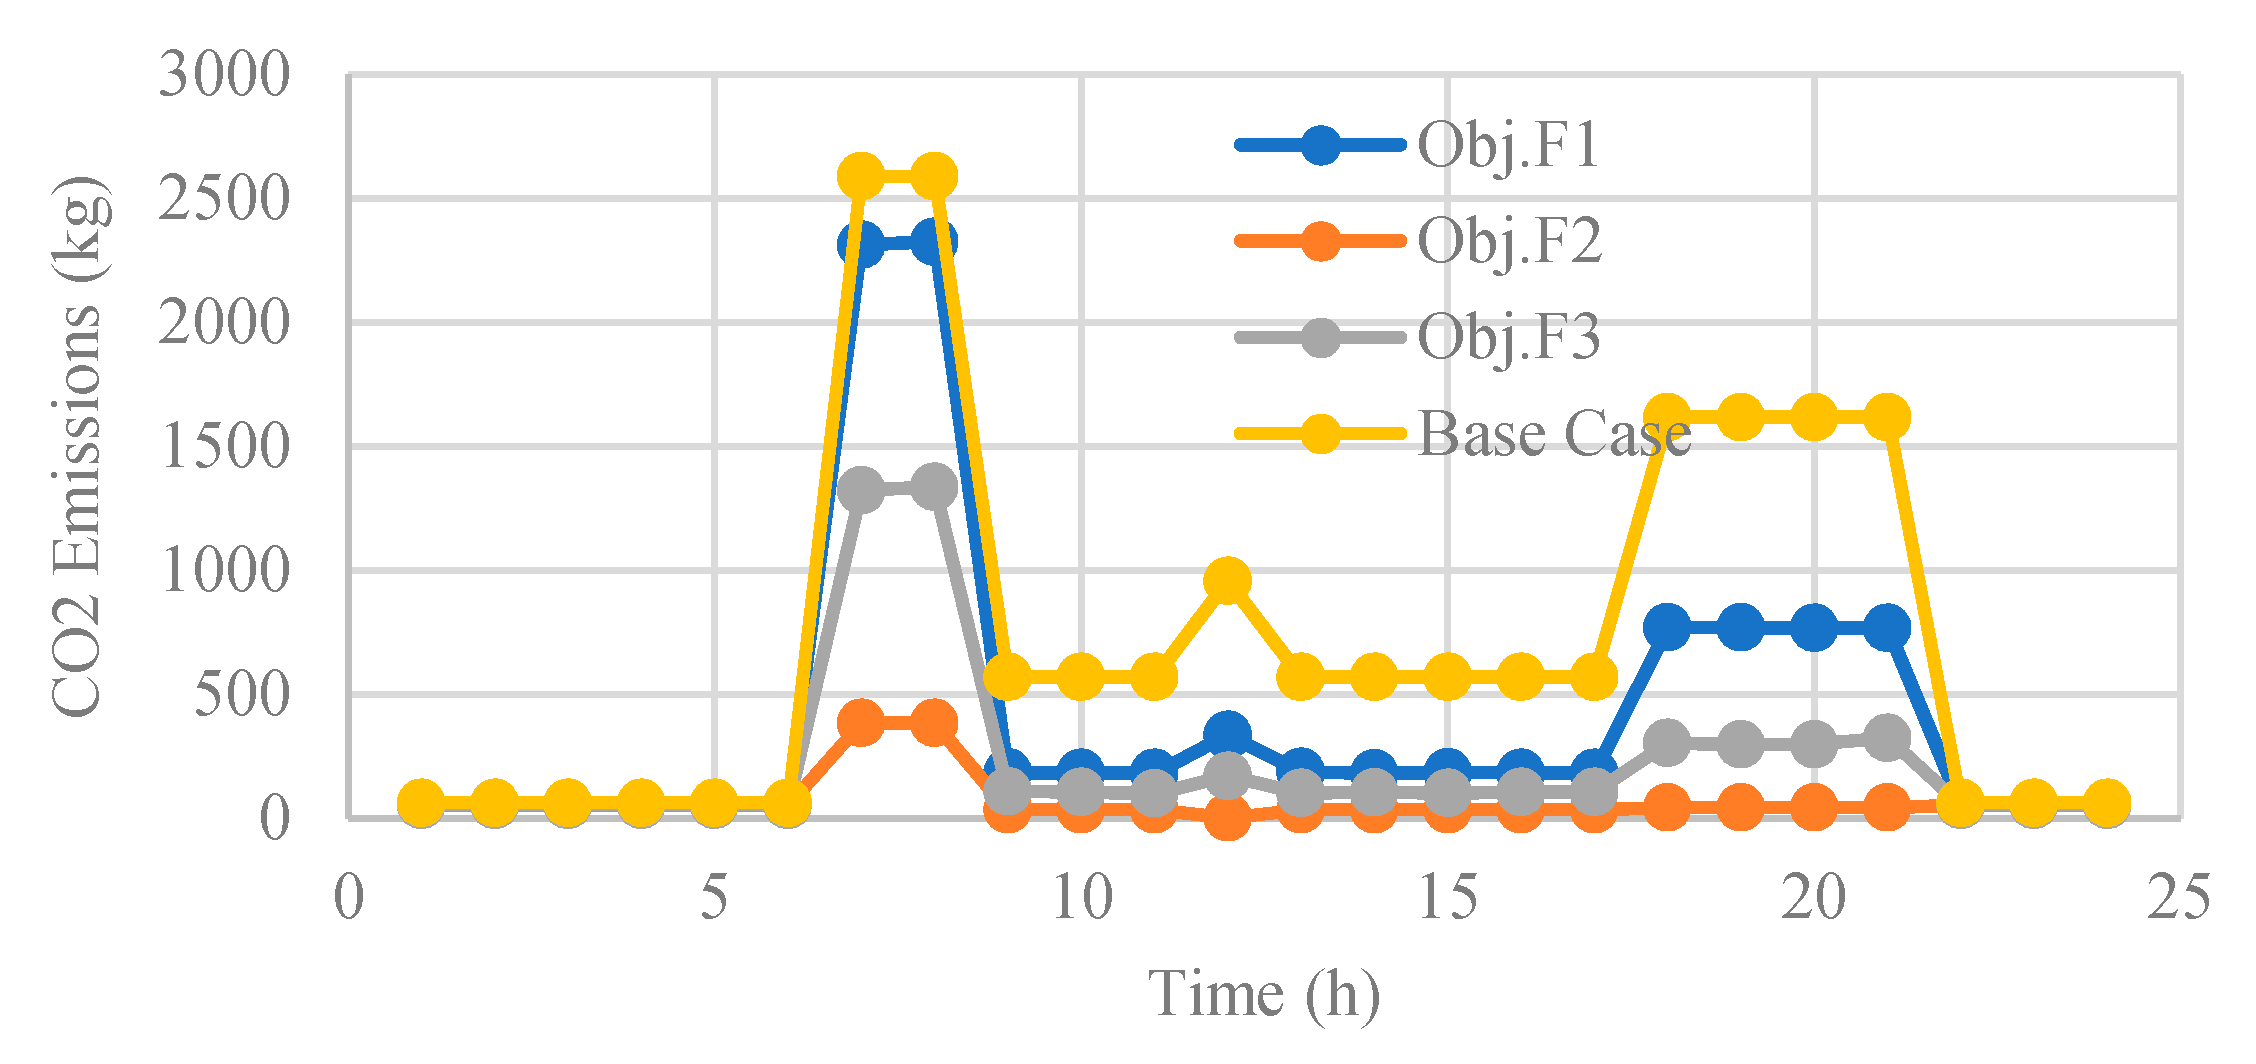
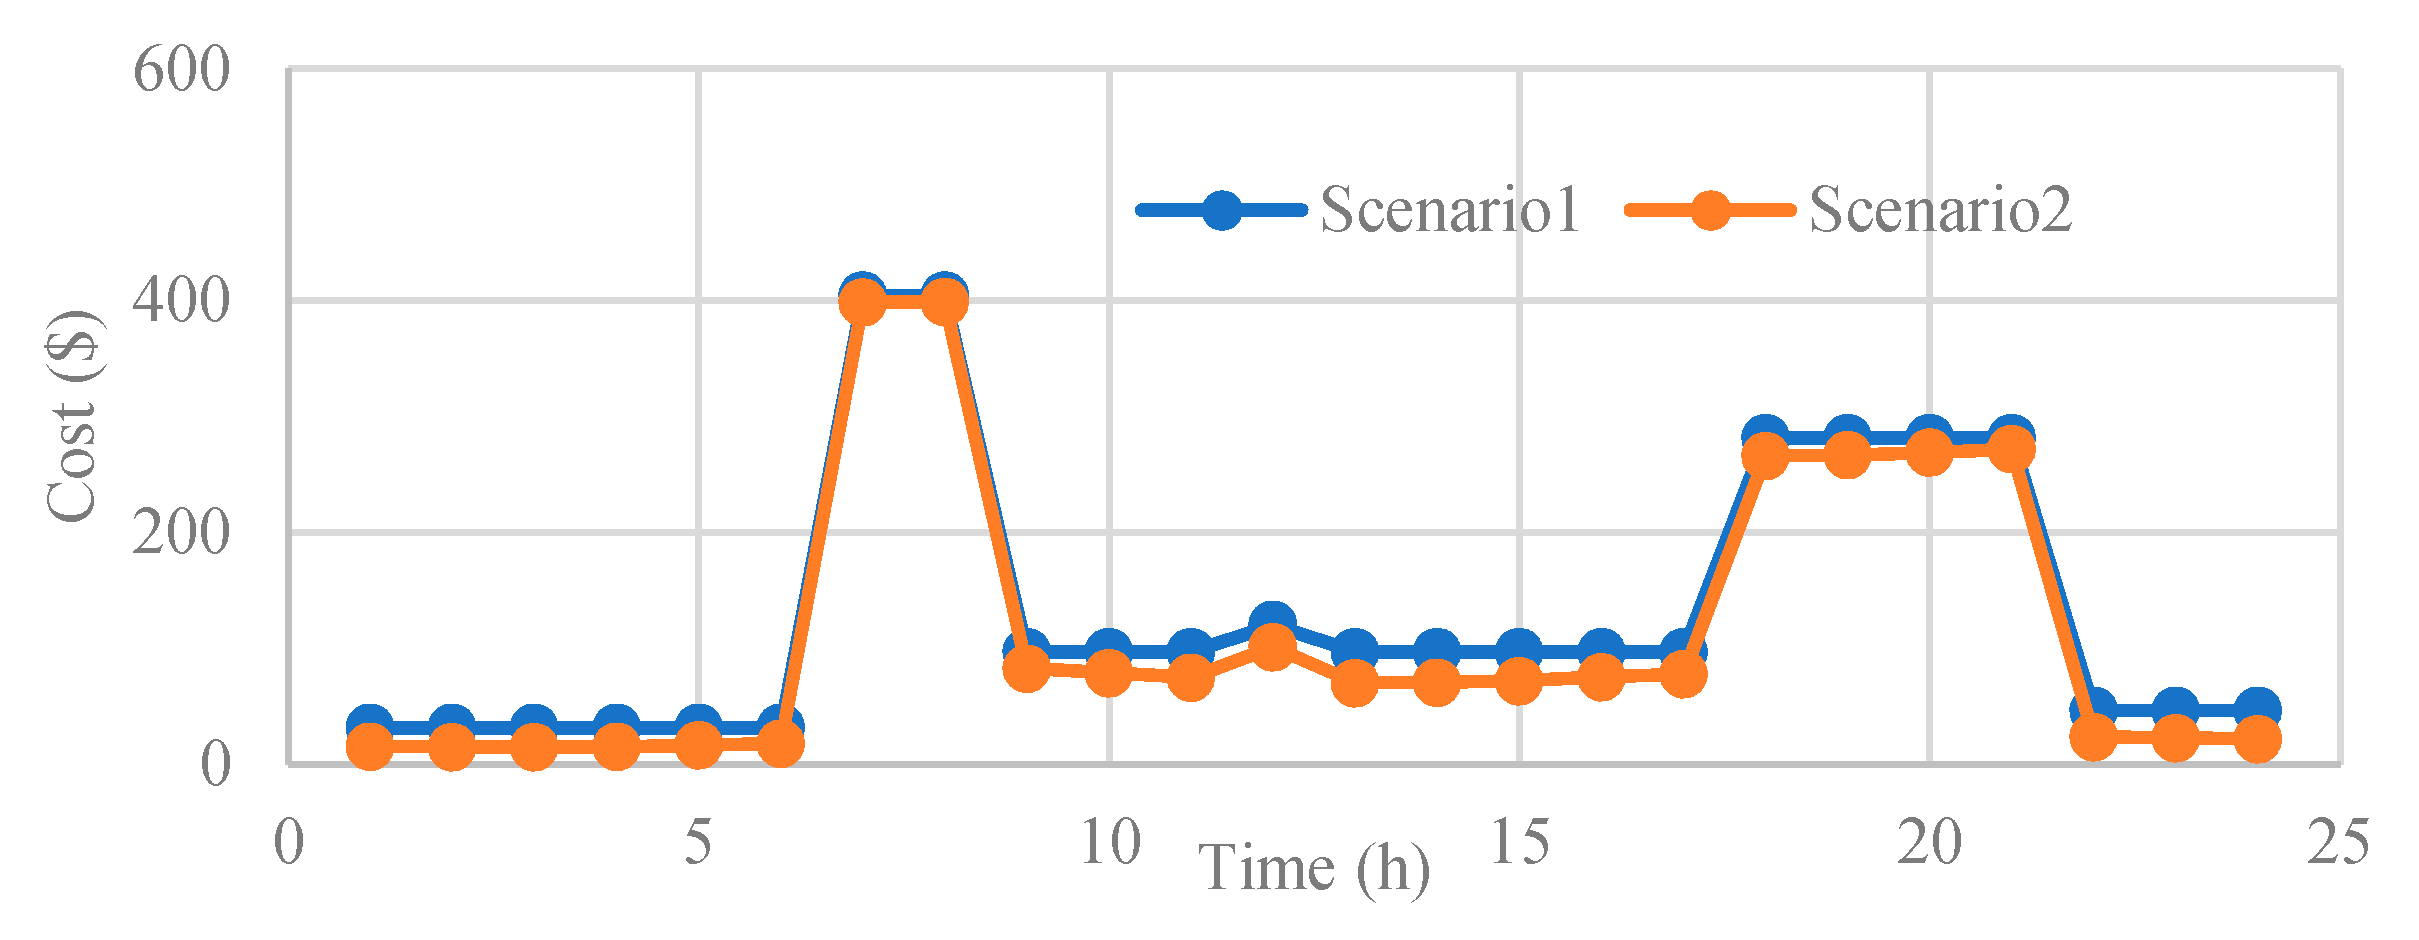
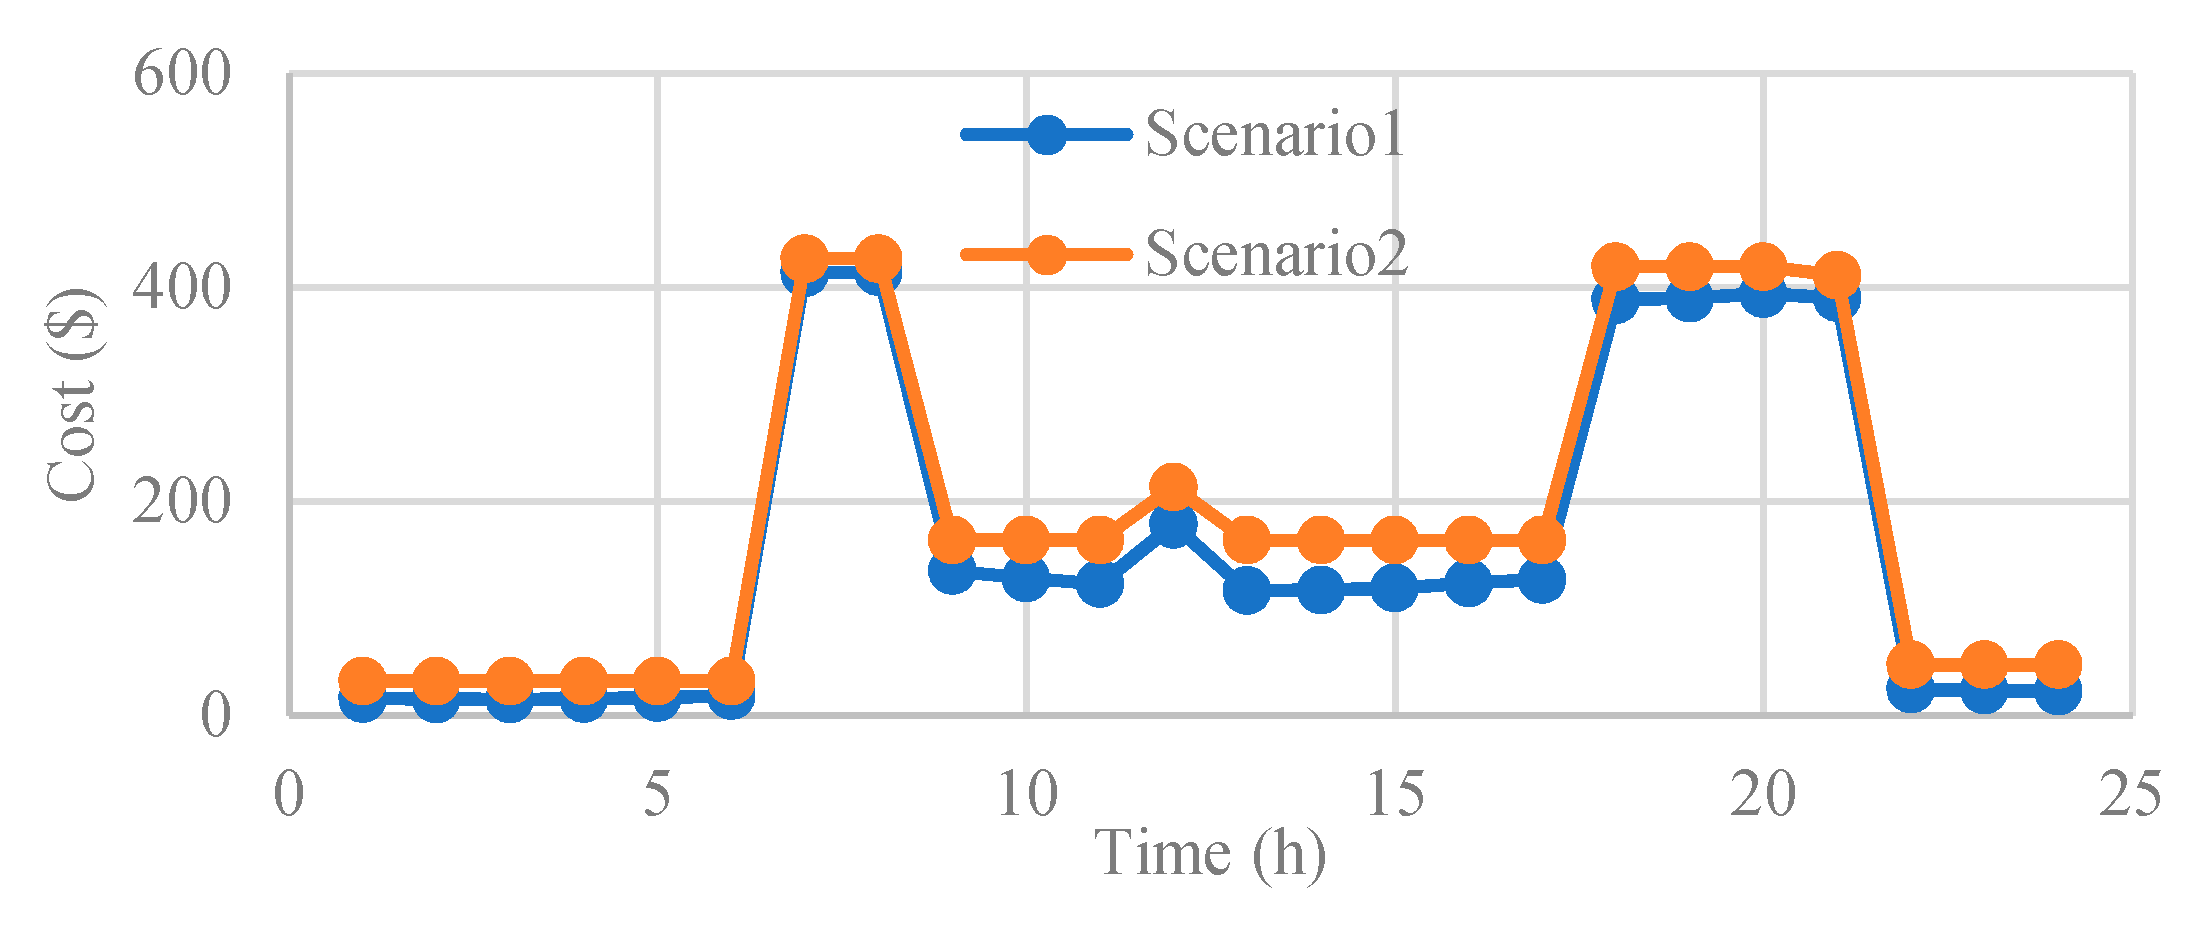
6.3. Second Scenario

In this scenario, renewable energy sources are incorporated with the energy hub system. The following subsection illustrates the operation of the energy hub system corresponding to the configurations in Table 3.

6.3.1. Configuration 1

The hub system consists of NGT and a boiler, PVs, and WTs. Table 8 illustrates the results of this configuration. Comparable to the first scenario, the energy hub based on F1 introduces the minimum operating cost of 2728.3 USD, while objective function F2 gives the minimum emitting CO2 emissions about 8960.6 kg, and finally, objective function F3 is the compromise solution. Comparing the outcomes of the multi-carrier hub network with and without renewable sources proves that the integration of PVs and WTs to energy hub enhances the energy hub effectiveness by limiting both overall operational cost and total system emissions, as shown in Figure 18 and Figure 19. Based on the objective function F2, Table 8 shows that the running cost and system emissions dropped by 13.5% and 3.1%, respectively, compared to the first scenario. Moreover, objective function F3 introduces 13.6% and 2.4% reductions in both operational cost and carbon released from the energy hub, respectively. Table 8 shows that less electricity was bought, and further electricity was transmitted to the grid for all three cases of the second scenario relative to the first one. For example, incorporating PV and WT with an energy hub system based on F1, the electricity delivered to the main electric grid was nearly tripled while the electricity bought from the main electric grid reduced by 60.2% compared to the first scenario. Furthermore, Figure 20 shows that the energy hub, subjected to compromised objective function (F3 case), delivered more electrical energy to the utility grid, whereas a smaller amount of energy was purchased from the utility grid in the same case.

6.3.2. Configuration 2

The energy hub in configuration 2 consisted of PVs, WTs, and a biomass generating unit. The deficient load heat covers by using a natural gas boiler, whereas the surplus/deficient electricity is exchanged with the main electric grid. Figure 21 and Figure 22 show the impact of integrating PVs and WTs into the multi-energy hub system in reducing both the total operating expenses and total system emissions in the second scenario in comparison with the first scenario. The total CO2 emissions for F2 dropped to 76.4%, while the operating expenditure reduced to 86.2% compared to the same case in the first scenario. However, for objective function F1, connecting PVs and WTs to the energy hub reduced the total operating cost, but there is an increase in the total CO2 emissions, as shown in Table 6 and Table 9. The running cost diminished by 14.9%, while CO2 emissions increased by 1.8% concerning the first scenario. Based on the F2 function, due to the availability of electrical energy generated by PVs and WTs, less electrical energy was generated from the biomass generator in the second scenario compared to the first one, and subsequently, a lower amount of heat produced by biomass generating unit. As a result of that, energy hub relies on producing insufficient heat required by the load from the boiler, the only available heat source. Table 9 shows that more heat generated by the boiler in the second scenario compared to the first one means more CO2 emitted in this case. Figure 23 indicates that less electrical energy was purchased from the electricity network, and further energy was delivered to the electricity network in scenario 2 in comparison to scenario 1. For example, based on F3, diminishing both running cost and emissions, the overall energy delivered to the electric utility network doubled, whereas the quantity of electricity purchased from the grid reduced to 26.6% in the second scenario compared to the first one.

6.3.3. Configuration 3

In configuration 3, the utility-interconnected energy hub fulfilled load demands with the aid of NGT, wood chips biomass generator, and renewable sources of PVs and WTs. The results for this configuration are illustrated in Table 10. Based on F1, the net operating expense and the gross CO2 released from the hub reduced by 13.6% and 1.6%, respectively, compared to the first scenario. In addition to that, with objective function F2, a reduction of 39% in the total system emissions is achieved in comparison to the hub energy system without renewable sources. Figure 24 and Figure 25 show the superiority of the hub network with renewable sources, especially in the reduction in total operation cost and CO2 emissions. From Table 10, incorporation of PVs and WTs introduce more savings in the gross operational expenses and CO2 emissions in comparison with the first scenario. Moreover, Figure 26 shows less electricity taken from the electric grid, and more electricity feeds the grid in comparison to the first scenario.
Results show that some of the presumptions taken during the analysis of the hub system for simplification affect the results of the studied optimization problem and must be considered in future work to improve the study, which are described as follows:
  • The optimization problem is based on a single day in winter, which is partitioned into 24 h intervals.
  • The optimization problem is solved only for a single winter day; the same techniques can be used to define the optimal operation of the hub system for all days of a year. It is expected that the outcomes of the other seasons of a year may be significantly different due to changing load profiles and unpredictable extracted energy from PVs and WTs. These will be profoundly affected by the electricity exchange, with the main electric grid and the generated energy from different hub elements.
  • The operation of the energy hub is assumed to be based on constant hub efficiencies.
  • It will be more realistic to consider time-varying efficiencies. It is expected the total operating expenses will be increased because efficiencies of hub devices are dropped as their consumed powers are decreased.
  • Neglecting the effect of the CO2 penalty factor on the optimization problem.
  • The penalty factor will add a further burden to the overall operating costs of the system. According to the World Bank’s Carbon Pricing Watch report, the penalty factor for CO2 emissions is about 10–15 USD/ton CO2 [34].
  • Considering only the carbon footprint evaluation to assess the environmental impacts of the hub system and neglecting the life cycle assessment (LCA = 0).
  • Carbon footprint is a monocriterion assessment that focuses on greenhouse gas emissions of the system. LCA assesses multiple environmental influences attributable to the life cycle of the materials, including greenhouse gases, acidification, particulate matter formation, resource depletion, and end-of-life disposal etc., and an LCA evaluation technique will be a useful supporting tool for identifying the gross environmental effects of the hub system.

7. Conclusions

The optimum operating condition of energy hub carriers is discussed in this paper. These options are natural gas, wood chips biomass, and renewable resources. Taking account of the specifications of the load demand and system constraints, all hub components were designed efficiently. In this study, there are two main scenarios: in the first scenario, the hub system is operated without PV and WT, while these two sources are included in the second scenario. For each scenario, three configurations of the hub are examined during the study. Moreover, three objectives are analyzed during the examination of each configuration, minimizing operating expenses, mitigating the overall CO2 released from the hub, and simultaneously lowering both operating expenses and CO2 emissions. The results revealed that due to its reasonable price, natural gas fuel is best in reducing the system’s total operating expenses. Additionally, due to its friendly impact on the environment, the biomass wood chip unit is powerful in minimizing overall CO2 emissions. Besides, NGT is a preferable option from an environmental perspective than the conventional boiler, as it lowers overall CO2 emissions. The performance of the hub is improved through lessening the total operating expenses and carbon emissions by integrating PVs and WTs into the system. Simulation results proved the effectualness of the multi-objective PSO to evaluate the optimal feature and scheduling of the hub system. The outcomes also showed that the use of a mixture of NGT biomass generating unit with the association of PVs and WTs to the hub system improved hub effectiveness by simultaneously lowering both total operating expenses and CO2 emissions. Future work can further explore this analysis by extending the study to cover a full year, considering time-varying efficiencies and partial loading conditions, and assessing LCA to determine the gross environmental effect of the hub system.

Author Contributions

Conceptualization, A.F.; Formal analysis, H.H. and A.M.M.; Supervision, A.M.A.; Writing—original draft. All authors have read and agreed to the published version of the manuscript.

Funding

This research received no external funding.

Acknowledgments

The authors would like to acknowledge Prof. Toshiya Nanahara and Kenichi Kawabe for their cooperation in this work. Also, we would like to acknowledge the Mission department of the Ministry of Higher Education (MoHE) of Egypt for providing a scholarship to conduct this study as well as the Egypt Japan University of Science and Technology (E-JUST) and Tokyo Institute of Technology for offering the facilities needed to conduct this research work.

Conflicts of Interest

The authors state no conflict of interest.

References

  1. Chung, T.; Li, X.; Ong, R.C.; Ge, Q.; Wang, H.; Han, G. Emerging forward osmosis (FO) technologies and challenges ahead for clean water and clean energy applications. Curr. Opin. Chem. Eng. 2012, 1, 246–257. [Google Scholar] [CrossRef]
  2. Bostan, A.; Nazar, M.S.; Shafie-Khah, M.; Catalão, J.P. Optimal scheduling of distribution systems considering multiple downward energy hubs and demand response programs. Energy 2020, 190, 116349. [Google Scholar] [CrossRef]
  3. Mohammadi, M.; Noorollahi, Y.; Mohammadi-Ivatloo, B.; Yousefi, H. Energy hub: From a model to a concept-a review. Renew. Sustain. Energy Rev. 2017, 80, 1512–1527. [Google Scholar] [CrossRef]
  4. Fan, S.; Li, Z.; Wang, J.; Piao, L.; Ai, Q. Cooperative economic scheduling for multiple energy hubs: A bargaining game theoretic perspective. IEEE Access 2018, 6, 27777–27789. [Google Scholar] [CrossRef]
  5. Kiciński, J. Do we have a chance for small-scale energy generation? The examples of technologies and devices for distributed energy systems in micro & small scale in Poland. Bull. Pol. Acad. Sci. Tech. Sci. 2013, 61, 749–756. [Google Scholar] [CrossRef]
  6. Segurado, R.; Pereira, S.; Correia, D.; Costa, M. Techno-economic analysis of a trigeneration system based on biomass gasification. Renew. Sustain. Energy Rev. 2019, 103, 501–514. [Google Scholar] [CrossRef]
  7. Wang, H.; Zhang, H.; Gu, C.; Li, F. Optimal design and operation of CHPs and energy hub with multi objectives for a local energy system. Energy Procedia 2017, 142, 1615–1621. [Google Scholar] [CrossRef]
  8. Wang, Y.; Zhang, N.; Zhuo, Z.; Kang, C.; Kirschen, D. Mixed-integer linear programming-based optimal configuration planning for energy hub: Starting from scratch. Appl. Energy 2018, 210, 1141–1150. [Google Scholar] [CrossRef]
  9. Jurasz, J.; Mikulík, J. Economic and environmental analysis of a hybrid solar, wind and pumped storage hydroelectric energy source: A Polish perspective. Bull. Pol. Acad. Sci. Tech. Sci. 2017, 65, 859–869. [Google Scholar] [CrossRef] [Green Version]
  10. Di Somma, M.; Yan, B.; Bianco, N.; Luh, P.B.; Graditi, G.; Mongibello, L.; Naso, V. Multi-objective operation optimization of a Distributed Energy System for a large-scale utility customer. Appl. Therm. Eng. 2016, 101, 752–761. [Google Scholar] [CrossRef]
  11. Zhong, Y.; Xie, D.; Zhai, S.; Sun, Y. Day-ahead hierarchical steady state optimal operation for integrated energy system based on energy hub. Energies 2018, 11, 2765. [Google Scholar] [CrossRef] [Green Version]
  12. Ranjbar, A.M.; Moshari, A.; Oraee, H.; Sheikhi, A. Optimal operation and size for an energy hub with CCHP. Energy Power Eng. 2011, 3, 641–649. [Google Scholar] [CrossRef] [Green Version]
  13. Qi, F.; Wen, F.; Liu, X.; Salam, A. A residential energy hub model with a concentrating solar power plant and electric vehicles. Energies 2017, 10, 1159. [Google Scholar] [CrossRef] [Green Version]
  14. Liu, J.; Li, J.; Xiang, Y.; Hu, S. Optimal Sizing of Hydro-PV-Pumped Storage Integrated Generation System Considering Uncertainty of PV, Load and Price. Energies 2019, 12, 3001. [Google Scholar] [CrossRef] [Green Version]
  15. Das, B.K.; Al-Abdeli, Y.M. Optimization of stand-alone hybrid CHP systems meeting electric and heating loads. Energy Convers. Manag. 2017, 153, 391–408. [Google Scholar]
  16. Amir, V.; Jadid, S.; Ehsan, M. Optimal Planning of a Multi-Carrier Microgrid (MCMG) Considering Demand-Side Management. Int. J. Renew. Energy Res. 2018, 8, 238–249. [Google Scholar]
  17. Malakoti-Moghadam, M.; Askarzadeh, A.; Rashidinejad, M. Transmission and generation expansion planning of energy hub by an improved genetic algorithm. Energy Sources Part A Recover. Util. Environ. Eff. 2019, 41, 3112–3126. [Google Scholar] [CrossRef]
  18. Urbanucci, L.; Testi, D. Optimal integrated sizing and operation of a CHP system with Monte Carlo risk analysis for long-term uncertainty in energy demands. Energy Convers. Manag. 2018, 157, 307–316. [Google Scholar] [CrossRef]
  19. Huang, Y.; Zhang, W.; Yang, K.; Hou, W.; Huang, Y. An optimal scheduling method for multi-energy hub systems using game theory. Energies 2019, 12, 2270. [Google Scholar] [CrossRef] [Green Version]
  20. Lorestani, A.; Pouresmaeil, E.; Nazari, M.H. Optimal sizing and techno-economic analysis of energy- and cost-efficient standalone multi-carrier microgrid. Energy 2019, 178, 751–764. [Google Scholar] [CrossRef]
  21. Moghaddas-Tafreshi, S.M.; Mohseni, S.; Karami, M.E.; Kelly, S. Optimal energy management of a grid-connected multiple energy carrier micro-grid. Appl. Therm. Eng. 2019, 152, 796–806. [Google Scholar] [CrossRef]
  22. Conti, P.; Lutzemberger, G.; Schito, E.; Poli, D.; Testi, D. Multi-Objective Optimization of Off-Grid Hybrid Renewable Energy Systems in Buildings with Prior Design-Variable Screening. Energies 2019, 12, 3026. [Google Scholar] [CrossRef] [Green Version]
  23. Huang, Y.; Yang, K.; Zhang, W.; Lee, K. Hierarchical energy management for the multienergy carriers system with different interest bodies. Energies 2018, 11, 2834. [Google Scholar] [CrossRef] [Green Version]
  24. Abdelshafy, A.M.; Hassan, H.; Jurasz, J. Optimal design of a grid-connected desalination plant powered by renewable energy resources using a hybrid PSO–GWO approach. Energy Convers. Manag. 2018, 173, 331–347. [Google Scholar] [CrossRef]
  25. Parol, M.; Rokicki, L.; Parol, R. Towards optimal operation control in rural low voltage microgrids. Bull. Pol. Acad. Sci. Tech. Sci. 2019, 67, 799–812. [Google Scholar]
  26. Moeini-Aghtaie, M.; Dehghanian, P.; Fotuhi-Firuzabad, M.; Abbaspour, A. Multiagent genetic algorithm: An online probabilistic view on economic dispatch of energy hubs constrained by wind availability. IEEE Trans. Sustain. Energy 2013, 5, 699–708. [Google Scholar] [CrossRef]
  27. Roldán-Blay, C.; Miranda, V.; Carvalho, L.; Roldán-Porta, C. Optimal Generation Scheduling with Dynamic Profiles for the Sustainable Development of Electricity Grids. Sustainability 2019, 11, 7111. [Google Scholar] [CrossRef] [Green Version]
  28. Dai, Q.; Liu, J.; Wei, Q. Optimal photovoltaic/battery energy storage/electric vehicle charging station design based on multi-agent particle swarm optimization algorithm. Sustainability 2019, 11, 1973. [Google Scholar] [CrossRef] [Green Version]
  29. Zhang, D. Optimal Design and Planning of Energy Microgrids. Ph.D. Thesis, University College London, London, UK, 2014. [Google Scholar]
  30. SENTECH Incorporated. Commercial and industrial CHP technology cost and performance data analysis for EIA. 2010. Available online: http://capabilities.itron.com/efg/2011/EIA2010ComIndCHPTechCostandPerformance0831.pdf (accessed on 2 June 2020).
  31. Wu, X.; Wang, X.; Qu, C. A Hierarchical Framework for Generation Scheduling of Microgrids. IEEE Trans. Power Deliv. 2014, 29, 2448–2457. [Google Scholar] [CrossRef]
  32. Zou, K.; Agalgaonkar, A.P.; Muttaqi, K.M.; Perera, S. Distribution System Planning With Incorporating DG Reactive Capability and System Uncertainties. IEEE Trans. Sustain. Energy 2011, 3, 112–123. [Google Scholar] [CrossRef]
  33. Clegg, S.; Mancarella, P. Integrated electrical and gas network modelling for assessment of different power-and-heat options. In Proceedings of the 2014 Power Systems Computation Conference, Wroclaw, Poland, 18–22 August 2014; pp. 1–7. [Google Scholar]
  34. ElAzab, H.-A.; Swief, R.A.; El-Amary, N.H.; Temraz, H.K. Unit Commitment Towards Decarbonized Network Facing Fixed and Stochastic Resources Applying Water Cycle Optimization. Energies 2018, 11, 1140. [Google Scholar] [CrossRef] [Green Version]
Figure 1. The General Layout of the Multi Carrier’s Hub System.
Sustainability 12 04701 g001
Figure 2. Structure of the Studied Energy Hub.
Sustainability 12 04701 g002
Figure 3. Flowchart of particle swam optimization (PSO) based Scheduling Algorithm.
Sustainability 12 04701 g003
Figure 4. Electrical Energy Demand.
Sustainability 12 04701 g004
Figure 5. Heat Energy ….
Sustainability 12 04701 g005
Figure 6. Output Power from PV and WT.
Sustainability 12 04701 g006
Figure 7. Dispatching Factor (α) in Configuration 1.
Sustainability 12 04701 g007
Figure 8. Natural Gas Energy Trade in Configuration 1.
Sustainability 12 04701 g008
Figure 9. Electrical Energy Trade in Configuration 1.
Sustainability 12 04701 g009
Figure 10. Natural Gas Energy Trade in Configuration 2.
Sustainability 12 04701 g010
Figure 11. Biomass Energy (Pwb) Scheduling in Configuration 2.
Sustainability 12 04701 g011
Figure 12. Electrical Energy Trade in Configuration 2.
Sustainability 12 04701 g012
Figure 13. Operating Cost in Configuration 3.
Sustainability 12 04701 g013
Figure 14. CO2 Emissions in Configuration 3.
Sustainability 12 04701 g014
Figure 15. Natural Gas Energy Trade in Configuration 3.
Sustainability 12 04701 g015
Figure 16. Biomass Energy (Pwb) Scheduling in Configuration 3.
Sustainability 12 04701 g016
Figure 17. Electrical Energy Trade in Configuration 3.
Sustainability 12 04701 g017
Figure 18. Operating Expenses in the First and Second Scenarios (Configuration 1, F1).
Sustainability 12 04701 g018
Figure 19. CO2 Emissions in the First and Second Scenarios (Configuration 1, F2).
Sustainability 12 04701 g019
Figure 20. Electrical Energy Trade in the First and Second Scenarios (Configuration 1, F3).
Sustainability 12 04701 g020
Figure 21. Running Cost in the First and Second Scenarios (Configuration 2, F1).
Sustainability 12 04701 g021
Figure 22. CO2 Emissions in the First and Second Scenarios (Configuration 2, F2).
Sustainability 12 04701 g022
Figure 23. Electrical Energy Trade in the First and Second Scenarios (Configuration 2, F3).
Sustainability 12 04701 g023
Figure 24. Running Cost in the First and Second Scenarios (Configuration 3, F1).
Sustainability 12 04701 g024
Figure 25. CO2 Emissions in the First and Second Scenarios (Configuration 3, F2).
Sustainability 12 04701 g025
Figure 26. Electrical Energy Trade in the First and Second Scenarios (Configuration 3, F3).
Sustainability 12 04701 g026
Table 1. Energy Hub Parameters.
Par.ValuePar.Value ($/kWh)Par.Value (kgCO2/kWh)
η N G T e 0.35 [30] C N G 0.04 [31] K g 0.143
η N G T h 0.48 [30] C B W 0.063 [32] K B W 0.003 [32]
η B W e 0.285 [32] C m , N G T 0.003 [30] K N G T 0.2016
η B W h 0.642 [32] C m , B W 0.012 [32] K b o 0.3661
η T 1.0 C m b o 0.003 [30]
η b 0.76 [33] C m , P V 0.01 [31]
Table 2. The Grid Electricity Price used in the Study [31].
Using TimeOff-Peak1
(00–08)
Peak
(08–20)
Off-Peak 2
(20–24)
C b u y ( $ / k W h ) 0.080.160.12
C s e l l ( $ / k W h ) 0.040.080.06
Table 3. Samples Configurations of the Energy Hub.
ScenarioFirst Scenario
Without PVs and WTs
Second Scenario
With PVs and WTs
Conf.123123
Boiler
NGT
Biomass
Table 4. Result for the Base Case.
Cost
($)
CO2
Emission (kg)
P N G
(MWh)
P g , b u y
(MWh)
P g , s e l l
(MWh)
H out , bo
(MWh)
487117,72953.619.27040.7
Table 5. Result for Configuration 1, First Scenario.
Obj.
fun
Cost
($)
CO2
Emission (kg)
P N G
(MWh)
P g , b u y
(MWh)
P g , s e l l
(MWh)
H out , NGT
(MWh)
H out , bo
(MWh)
base487117,72953.619.270040.7
F1315810,04272.43.341.8724.416.3
F23161924875.23.344.522812.7
F33159964573.73.343.226.614.5
Table 6. Result for Configuration 2, First Scenario.
Obj.funCost
($)
CO2 Emission (kg) P N G
(MWh)
P B W
(MWh)
P g , b u y
(MWh)
P g , s e l l
(MWh)
H out , BW
(MWh)
H out , bo
(MWh)
F14376634618.841.27.53026.414.3
F2462228256.755.56.322.8735.65.1
F34487453612.948.26.350.8230.99.8
Table 7. Result for Configuration 3, First Scenario.
Obj.
fun
Cost
($)
CO2 Emission
(kg)
P N G
(MWh)
P B W
(MWh)
P g , b u y
(MWh)
P g , s e l l
(MWh)
P out , NGT
(MWh)
P out , BW
(MWh)
H out , NGT
(MWh)
H out , BW
(MWh)
H out , bo
(MWh)
F1316210,018.572.30.13.341.917.80.0324.40.0716.25
F246251708.810.755.466.326.63.7415.815.135.60.008
F336765382.448.524.273.75.914.66.92015.585.16
Table 8. Result for Configuration 1, Second Scenario.
Obj
fun
Cost
($)
CO2
Emission (kg)
P N G
(MWh)
g b u y
(MWh)
P g , s e l l
(MWh)
H out , NGT
(MWh)
H out , bo
(MWh)
F127289865.4721.335.5323.916.8
F227318960.6751.338.542812.7
F32730941373.61.33725.914.8
Table 9. Result for Configuration 2, Scenario 2.
Obj.
fun
Cost
($)
CO2
Emission
(kg)
P N G
(MWh)
P B W
(MWh)
P g , b u y
(MWh)
P g , s e l l
(MWh)
H out , BW
(MWh)
H out , bo
(MWh)
F13721645821.837.62.51024.1316.57
F23985216067.455.51.674.2435.65.1
F33836428714.446.41.691.6829.810.9
Table 10. Results of Configuration 3, Scenario 2.
Obj.
fun
Cost
($)
CO2
Emission (kg)
P N G
(MW)
P B W
(MWh)
P g , b u y
(MWh)
P g , s e l l
(MWh)
P out , NGT
(MWh)
P out , BW
(MWh)
H out , NGT
(MWh)
H out , BW
(MWh)
H out , bo
(MWh)
F127329857.371.80.1141.315.517.40.0323.80.0716.83
F239881043.610.755.51.677.983.7415.815.135.60.008
F332055117.349.123.71.359.6414.776.7620.315.25.2

