Article

Measuring Human-Scale Living Convenience through Multi-Sourced Urban Data and a Geodesign Approach: Buildings as Analytical Units

1
State Key Laboratory Cultivation Base of Geographical Environment Evolution, Nanjing Normal University, Nanjing 210023, China
2
Jiangsu Center for Collaborative Innovation in Geographical Information Resource Development and Application, Nanjing Normal University, Nanjing 210023, China
3
College of Architecture and Urban Planning, Tongji University, Shanghai 200092, China
4
International Joint Research Laboratory of Ecological Urban Design, Tongji University, Shanghai 200092, China
*
Author to whom correspondence should be addressed.
Sustainability 2020, 12(11), 4712; https://doi.org/10.3390/su12114712
Submission received: 21 April 2020 / Revised: 23 May 2020 / Accepted: 4 June 2020 / Published: 9 June 2020
(This article belongs to the Section Sustainability in Geographic Science)

Abstract

:
Living convenience, as a perceptual quality of life, is gradually playing an increasingly important role in the context of seeking livable cities. A high degree of living convenience positively affects urban vitality, livability, and daily physical activities. However, it is hard to achieve a quantitative measurement of this intangible, subjective issue. This study presents a data-informed analytical approach to measuring the human-scale living convenience using multi-sourced urban data and geodesign techniques. Firstly, according to classical theories, living convenience is translated as the co-presentation of accessed number and diversity of urban facilities. Based on that, this study applies multi-sourced urban data, including points of interest (PoIs), buildings, and street networks, to compute the living convenience of each building in the 15 min community–life circle. Through the geoprocessing tools developed by ArcGIS API for Python (ArcPy), the living convenience of millions of buildings in an entire city can be computed efficiently. Kaifeng City from Henan Province, China, is selected as the case study, and the verification from local experts in urbanism shows high accuracy. The capacity to measure intangible perception exhibits the potential for this analytical approach in urban planning practices. Several explorations have been conducted in this direction, including analyzing the spatial heterogeneity in Kaifeng City and planning decision support for bus station arrangement. In short, this study contributes to the development of human-centered planning by providing continuous measurements of an ‘unmeasurable’ quality across large-scale areas. Insights into the perceptual-based quality and detailed mapping of living conveniences in buildings can assist in efficient planning strategies toward more livable and sustainable urbanism.

1. Introduction

1.1. Human-Scale Living Convenience: An Emerging Trend

Human-scale living convenience, or convenience of living, is a perceptual quality of life. Human scale mainly refers to a fine scale related to the human body and human behaviors, which people can see, touch, and perceive in their daily lives [1]. The study of this issue has a long history that can be traced back to the 1980s. Myers [2] mentioned the importance of convenience as a part of the sustainable development of community and public wellbeing. Tian [3] proposed the concept of the daily life circle, which focuses on easy access to various daily requirements, e.g., shopping, leisure, and commuting. As stated by Carmona et al. [4], there are six key dimensions affecting the creation of attractive urban places—the social, visual, perceptual, temporal, morphological, and functional dimensions. Of these, the morphological and functional dimensions play a more important role [5,6]. Following this trend, studies have been conducted to create attractive places with living convenience by analyzing the relationship between residents’ behaviors and the morphological and functional fabrics of the urban form [7,8,9]. Many empirical studies reveal that areas with different functions will help satisfy the needs of people in their daily lives [10,11]. In addition, the positive impacts of spatial design characteristics on the social life of the streets and the willingness to visit have been well discussed [12]. Some studies also have recognized the positive influence of the convenience of destinations that lies in encouraging physical activities and slow traffic [13,14]. Appleyard’s renowned study on livable streets and traffic volumes provides insights in this direction [15].
The rapid urbanization in China is entering its latter stage with a call for balancing the speed and quality of development. Promotion of the people-oriented construction of the built environment has been common in this new stage of urbanization. There is an increasing concern for measuring intangible characteristics of quality, vitality, and diversity to achieve the efficient promotion of these public benefits [16,17,18,19]. In this context, the Shanghai Master Plan (2017–2035) introduced the concept of the 15 min community–life circle in China to promote the quality of life, regarding living convenience as a key index. The 15 min community–life circle means that residents can live, work, rest, and study within a 15 min walk. This initiative matches the call for sustainable mobility and environmentally friendly policies in the “New Urban Agenda” claimed at the United Nations Conference on Housing and Sustainable Urban Development (UN-Habitat III) [20]. Following this trend, many other Chinese megacities are also adding this concern to their master plans, which raises a call for upgrading the quality of life and performing efficient measurements on living convenience.

1.2. New Potentials via Multi-Sourced Urban Data and Geodesign Approach: Measuring Perceptual-Based Feelings that Are Difficult to Measure

As an essential indicator of the 15 min community–life circle and the quality of the built environment, the significance of living convenience is becoming increasingly prominent in urban planning practices. Convenient retail stores and well-connected streets encourage community residents to walk and obtain daily life needs in a more sustainable way [21]. However, living convenience as a non-physical perception of residents is difficult to collect efficiently and to quantify. As Glaster indicated, a high-quality and convenient neighborhood community is a place that can be quickly identified but which is hardly defined with precision [22].
The emergence of new urban data and geodesign considerations is bringing new potentials to address this challenge. On the one hand, the emergence of multi-sourced new urban data provides a series of new data for describing non-physical entities, such as quality and vitality [23]. In particular, refined, open, and accessible road network data, points of interest (PoIs) data, and building data provide the foundation for measuring living convenience. On the other hand, geodesign has recently emerged as a method for incorporating geographical analyses into the built environment domain, thereby complementing the growth of geographic information systems (GIS) as a foundational digital platform [24]. As Steinitz [25] stated, geodesign provides a framework linking geography with design by tightly coupling urban design and planning strategies with impact simulations informed by geographic techniques and data. It helps to evaluate current complex situations and seek the optimal solution for spatial challenges in the built environment. Landscape architects initially adopted geodesign for mapping the geographical contexts of their sites, and urban planners gradually followed to address conflicts and facilitate correspondence amongst different characteristics [26]. In this context, secondary development based on Python and ArcGIS provides a quick approach to analyzing substantial amounts of data. This combined application of newly emerging data and geodesign technologies may exhibit new potentials to solve the challenges of measuring living convenience, which may have been easy to perceive, but was previously difficult to measure.
Following this trend, this paper is targeted at developing a data-informed analytical approach to measuring the human-scale living convenience using multi-sourced urban data and the geodesign approach. An efficient but highly detailed evaluation of human-scale living convenience can be provided to facilitate better understanding for urban planners, designers, and policymakers, and, finally, to contribute to the benefits for the public.

2. Related Studies

The essence of living convenience lies in the balance of the space used in the daily lives of residents, including living, working, and leisure. Related studies have exerted efforts to quantify living convenience from varying spatial scales and methods (Table 1) [27,28,29,30,31,32,33,34,35,36,37].
Living convenience is generally regarded as a kind of jobs–housing balance at the macro-scale [27]. High jobs–housing balance decreases the commuting time of workers and thus increases the perceived living convenience. Researchers used the jobs–housing ratio (JHR), the ratio of jobs and housing units at the level of spatial units, such as the zip code area and traffic analysis zone (TAZ), to measure the degree of balance between employment and residence [28,29]. Recent studies at the macro-scale have added the concern of personal income and housing prices because several researchers [30] argued that affordable housing has a positive influence, particularly for low-income earners.
Several researchers [21] have explored living convenience and focused on how people use public facilities around their neighborhoods at the meso-scale. On the one hand, researchers [31] have used the subjective survey to assess the experience and satisfaction of residents through interviews and questionnaires. On the other hand, an objective daily activity index was established to measure how people are residing, traveling, and entertaining. Moreover, spatial analyses based on geographic information systems (GIS) have been widely used in this direction to evaluate the balance and accessibility of facility distribution. Consequently, combining subjective and objective methods has become a comprehensive approach to the analysis in this study. Explorations have been made to measure the spatial accessibility of public service facilities based on the potential model and the two-step floating catchment area method [32]. Space syntax, as a set of techniques and theories for analyzing spatial configuration and human activity patterns, provides a human-oriented measurement of spatial accessibility [33,34]. The combination of space syntax and GIS has been applied in the assessment of lively and convenient street networks [35]. The comprehensive spatial accessibility of residents to various public services helps to reveal the overall attractiveness of a certain area from their perspective of living convenience. Nevertheless, the analytical unit of spatial accessibility is often limited to district scales due to the limitation of data and techniques.
At the micro-scale, the community and street block is frequently used as the analytical unit for measuring living convenience [36,37,38]. Zhang et al. [36] introduced communities as the analysis unit for measuring living convenience, but the spatial boundaries of communities are difficult to define. Bonaiuto et al. [37] integrated 11 different spatial scales related to the living environment, including the street block scale. Huang et al. [38] applied classical methods, including a questionnaire survey and behavioral mapping, to evaluate the change in living convenience among residential neighborhoods after urban interventions.
In short, current studies lack the analysis of living convenience from the perspective of the human scale. Most of the adopted data involved in the measurement of living convenience are focused on population economic census data and layout of public facilities [27,28,29,30,31,32,33]. The remainder are usually based on community or block scales, with a size larger than several hectares [38], which is challenging when used for human-orientated analysis. The research to date leaves unanswered the following key question: How do we quantitatively measure convenient daily life from the perspective of the human scale? To address this research gap, this study explores the new research potential arising from newly emerged urban data to achieve a fine-scale measurement and assessment of living convenience.

3. Materials and Methods

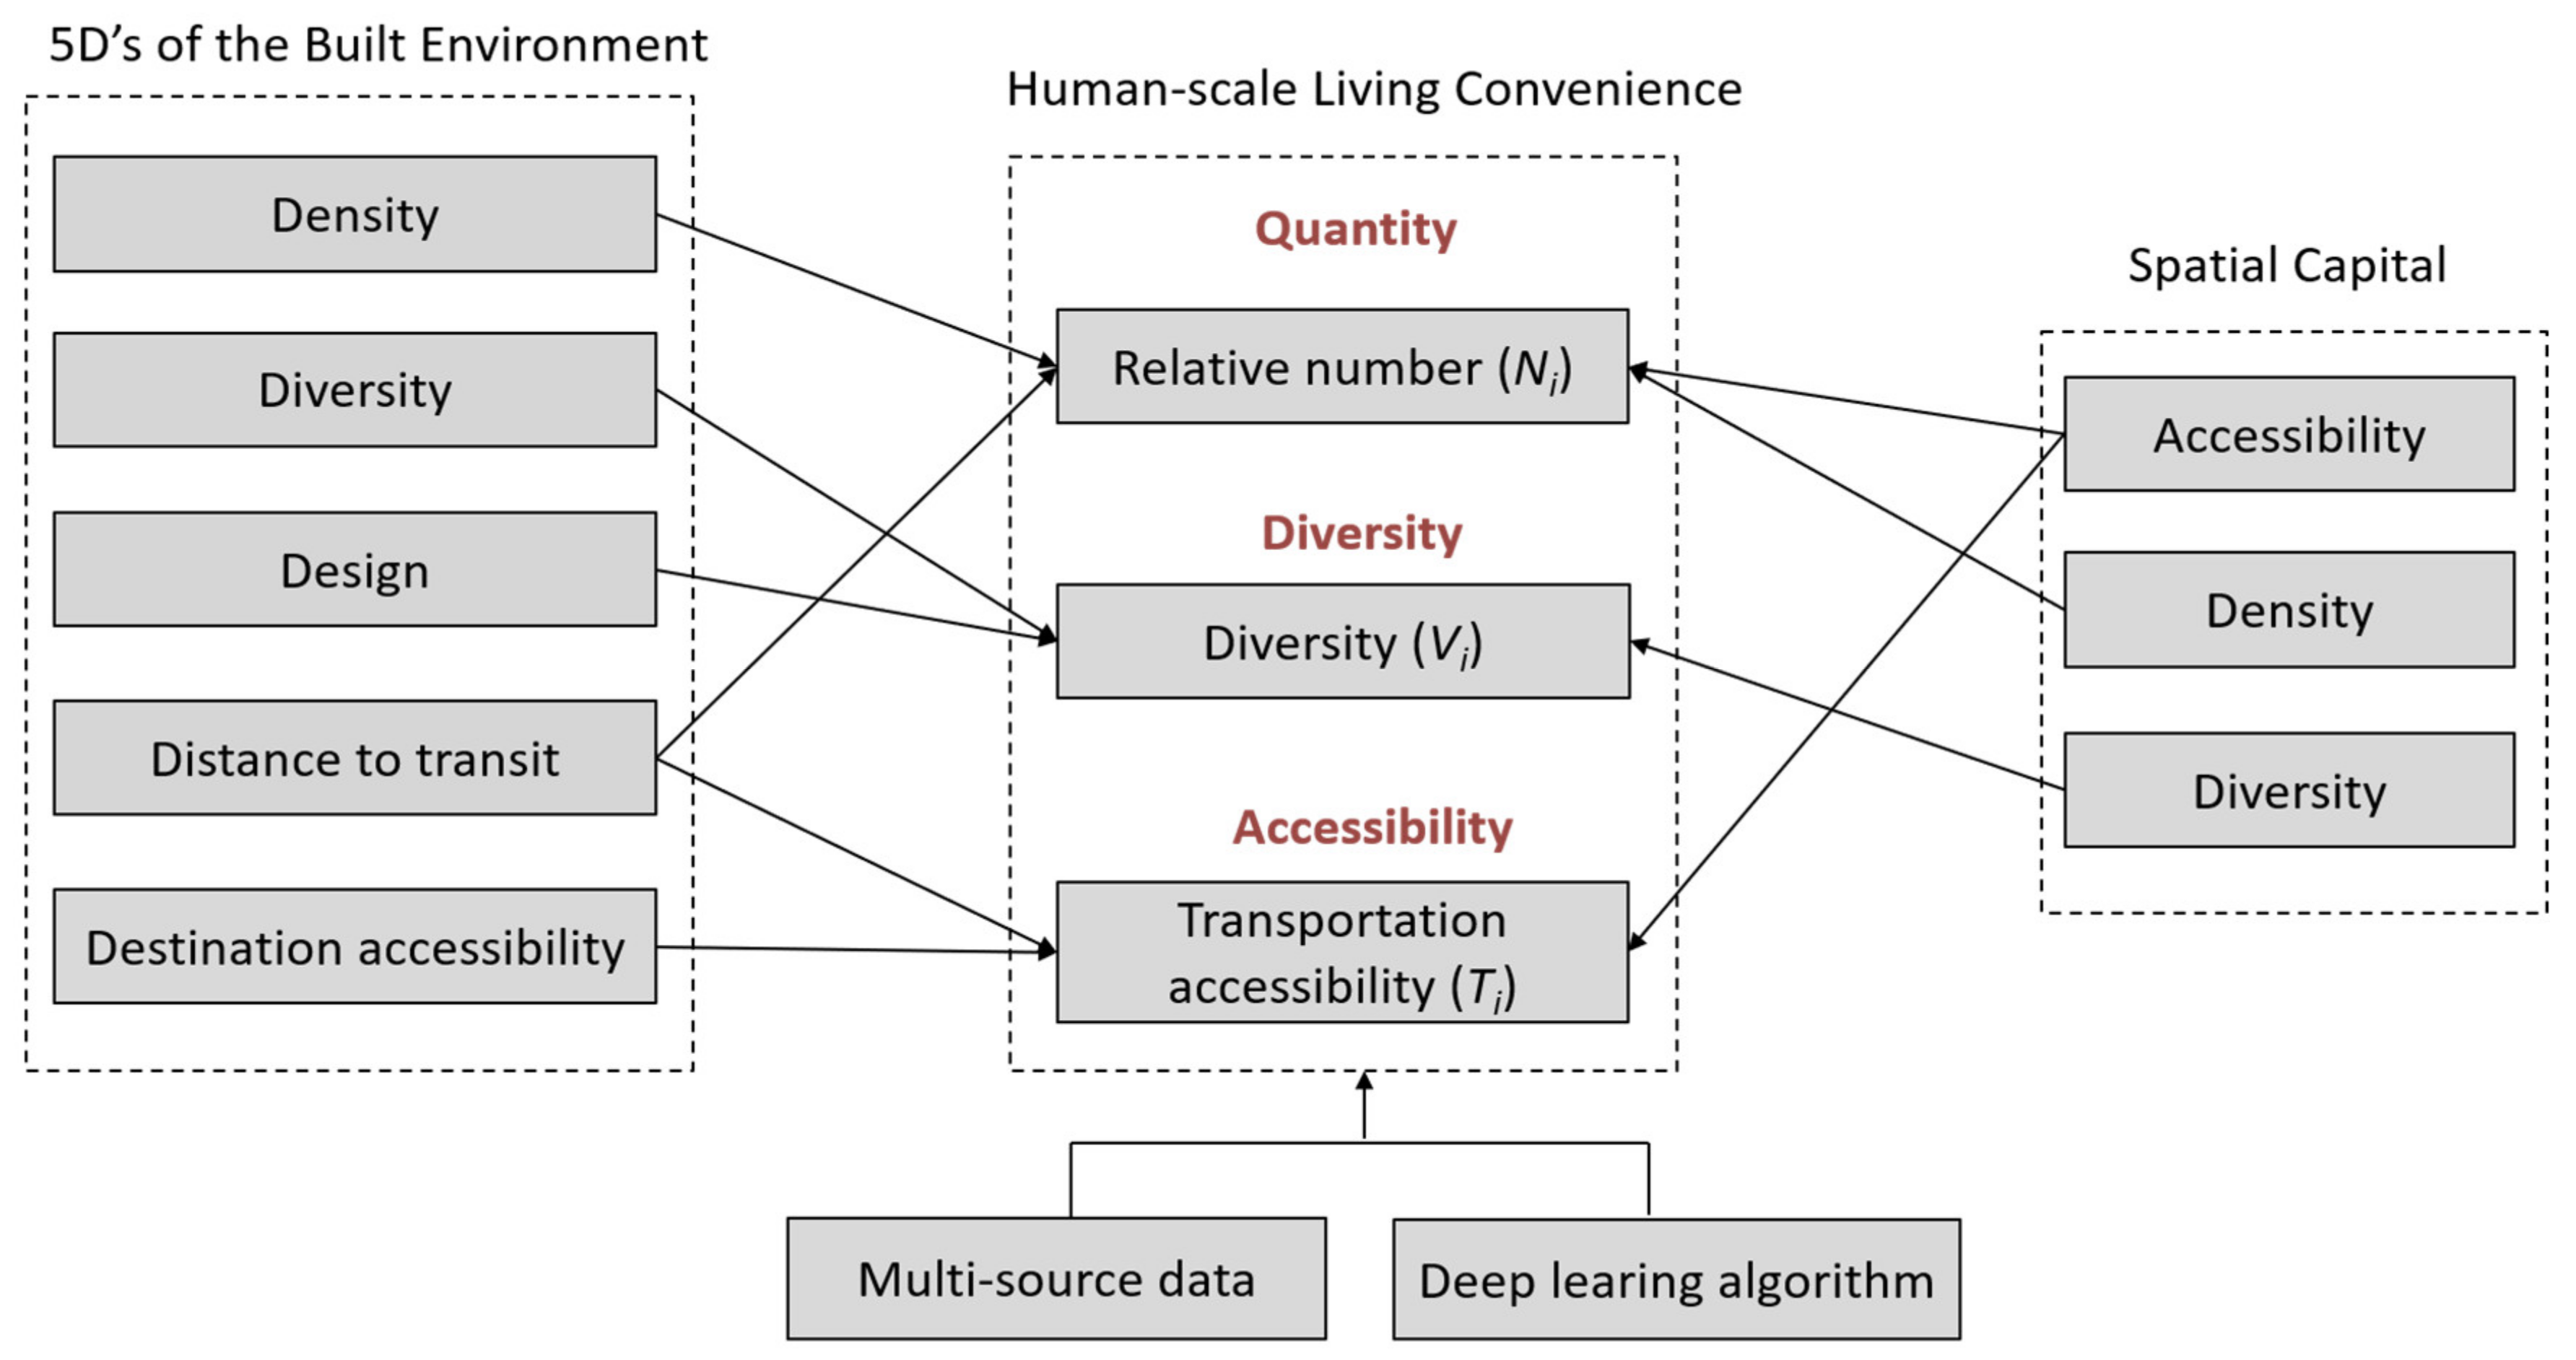
3.1. Conceptual Framework: Living Convenience as Accessed Number and Diversity of Urban Facilities
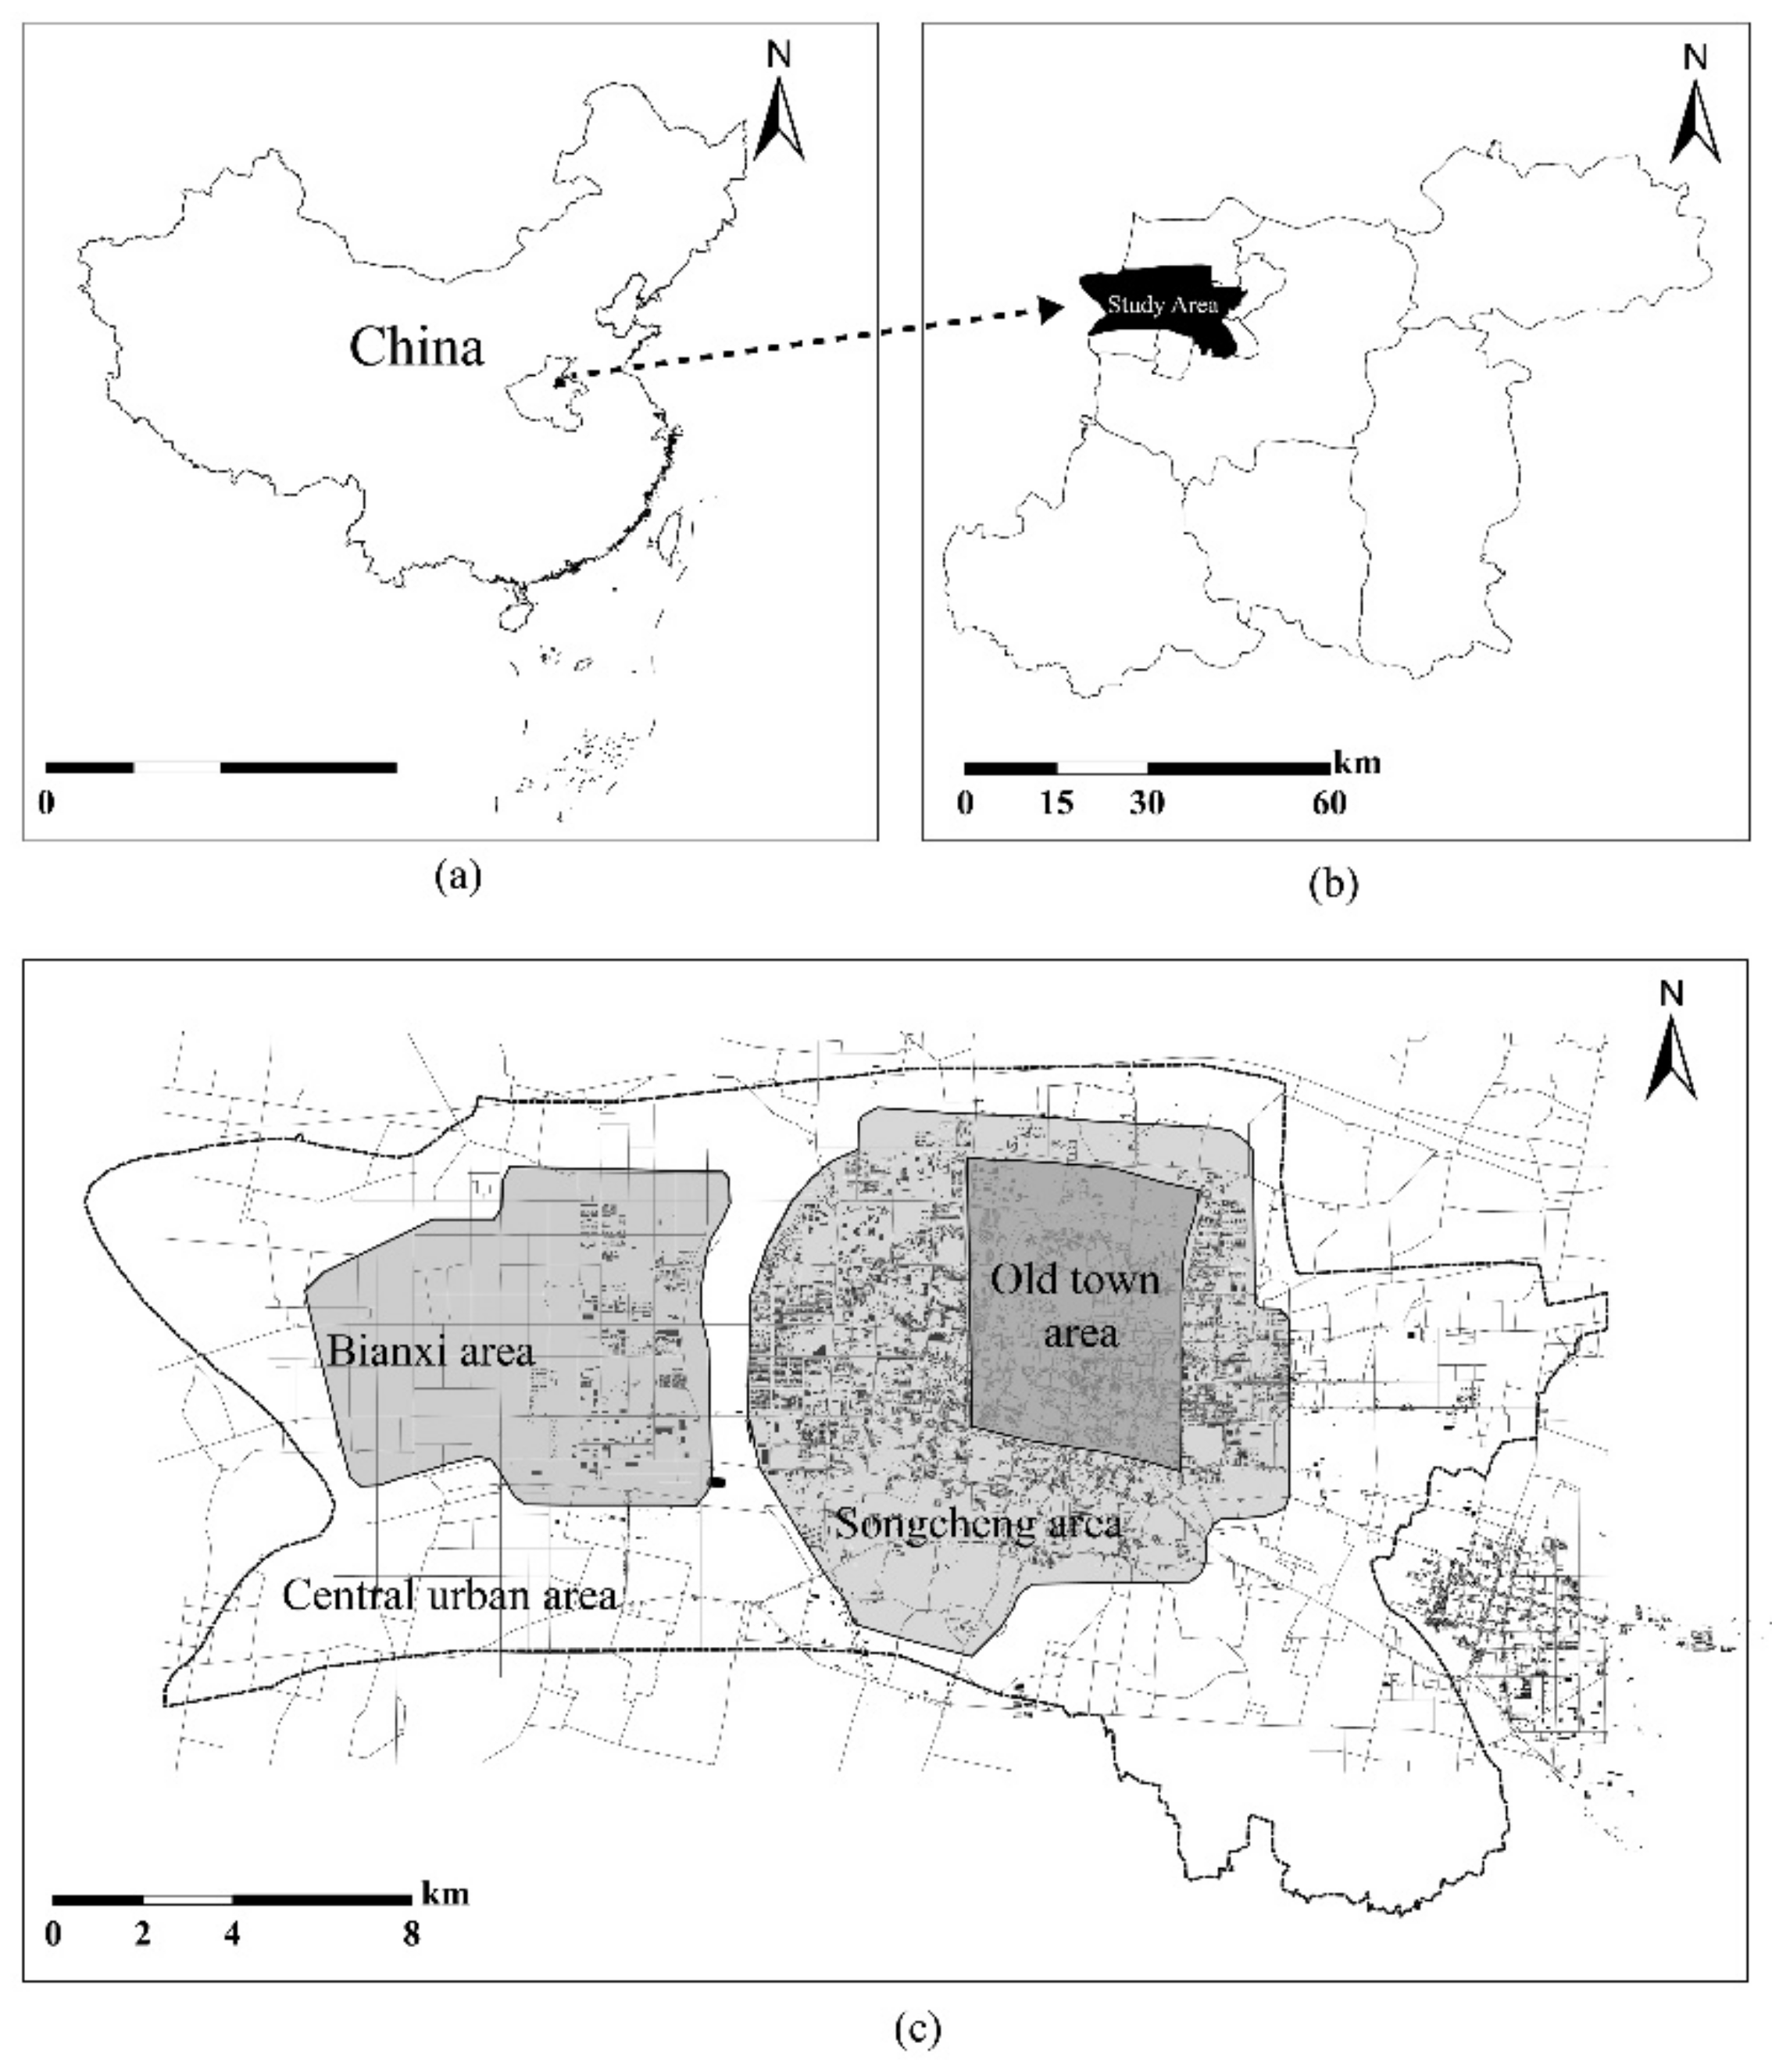
The theoretical measurement of living convenience at the human scale can be constructed on the basis of daily life experience. Residents often perceive the convenience in daily life according to the satisfaction with primary living demands, such as employment, leisure, services, and transportation. Therefore, we could propose a hypothesis based on our daily life experience that living convenience is determined by the accessed number and diversity of urban facilities. In other words, the relative number of facilities and the diversity of facilities that the residents can easily access within a pedestrian distance considerably reflect perceived living convenience.
This hypothesis matches with classical urbanism theories. As Ewing and Cervero’s 5D theory [39] asserts, an attractive and convenient high-quality built environment has five essential elements, namely, density, diversity, design, distance to transit, and accessibility based on the designed network. Marcus’ spatial capital theory [40] further indicates that this kind of attractive and convenient quality is mainly generated from accessed density and diversity. As shown in Figure 1, both of the two classical theories can be translated as the three key issues identified in our hypothesis.
Therefore, from the perspectives of both the personalized daily life experience and classical urbanism theories, we are able to translate the human-scale living convenience from a kind of perception towards the measure of the accessed number and diversity of urban facilities from any building on a walking scale. Based on this understanding, we are able to construct an analytical framework of living convenience, including the three components of ‘accessibility’, ‘quantity’, and ‘diversity’ on the basis of the aforementioned understanding.
Specifically, the term ‘accessibility’ in this study consists of two sub-concepts. One is the range of space covered by sufficient walking time; the other is the accessibility to public transportation facilities, such as bus and subway stations. The former reflects the contact of residents with surrounding facilities during their daily activities, which is often measured as the daily walking range, i.e., 1000 m or 15 min walking distance [41]. The latter reflects the contact of residents with distant urban facilities through the pedestrian-integrated public transportation system. Close bus stations indicate easy access to other urban facilities and improve the living convenience of residents.
This study defines ‘quantity’ as the relative number of facilities in the daily accessible area after distance decay is considered. The ‘quantity’ herein cannot be simply equated to the total number of facilities in the accessible area because the effect of the road network structure and the travel distance should also be considered. For example, residents feel different degrees of convenience for the same facility if it is within 1000 m or 100 m.
This study defines ‘diversity’ as the Shannon–Wiener Index of different kinds of PoIs in the daily accessible area. ‘Diversity’ is different from the functional mix in urban planning, which is based on the composition of land uses. This kind of functional mixture with a top-down perspective lacks behavioral consideration at the human scale and thus hardly satisfies the needs of refined, humanized, and daily behavior-oriented measurements of living convenience. However, ecological scholars have proposed a variety of computational indices for species diversity, such as the Berger–Parker Index [42], the Shannon–Wiener Index [43], and the Simpson Index [44]. This study selects the Shannon–Wiener Index to measure diversity because it has been used in previous research on the built environment [45,46].
In summary, the measurement formula of the living convenience of a building unit can be described as
L C i = N i × V i × T i ,
where LCi represents the value of living convenience of a building i; Ni represents the relative number of PoIs after distance attenuation is considered in the daily accessible area; Vi represents the diversity of PoIs in the daily accessible area, which is calculated using the Shannon–Wiener Index; and Ti represents the accessibility of transportation facilities in the daily accessible area. It is necessary to mention that the normalization of the three key elements is not applied herein.

3.2. Case Study

This study was conducted in Kaifeng City, Henan Province, China (Figure 2). The old town area, including the Gucheng district, is recognized for its long history of nearly 4000 years. The new district in Kaifeng (Bianxi area) has recently been built up to meet the demand of fast urbanization in China. The high-rise urban development in Kaifeng increases the requirement for quality and living convenience in civic life. This case can be regarded as a good representation of many contemporary Chinese cities that comprise historical districts and large newly built areas. Therefore, exploring the study area, in this case, may bring insights for addressing living convenience in many other Chinese cities.

3.3. Analytical Framework

We measure living convenience using the building as the analytical unit. A building unit is defined as a single building that is physically separated from other buildings. Buildings are treated as a single building unit if they are intersected. The road–building connection path is the shortest path from the building unit to the road, which is generated by linking the geometric center of the building unit and its nearest road point (Figure 3).
The calculation of living convenience involves four main phases (Figure 4):
(1)
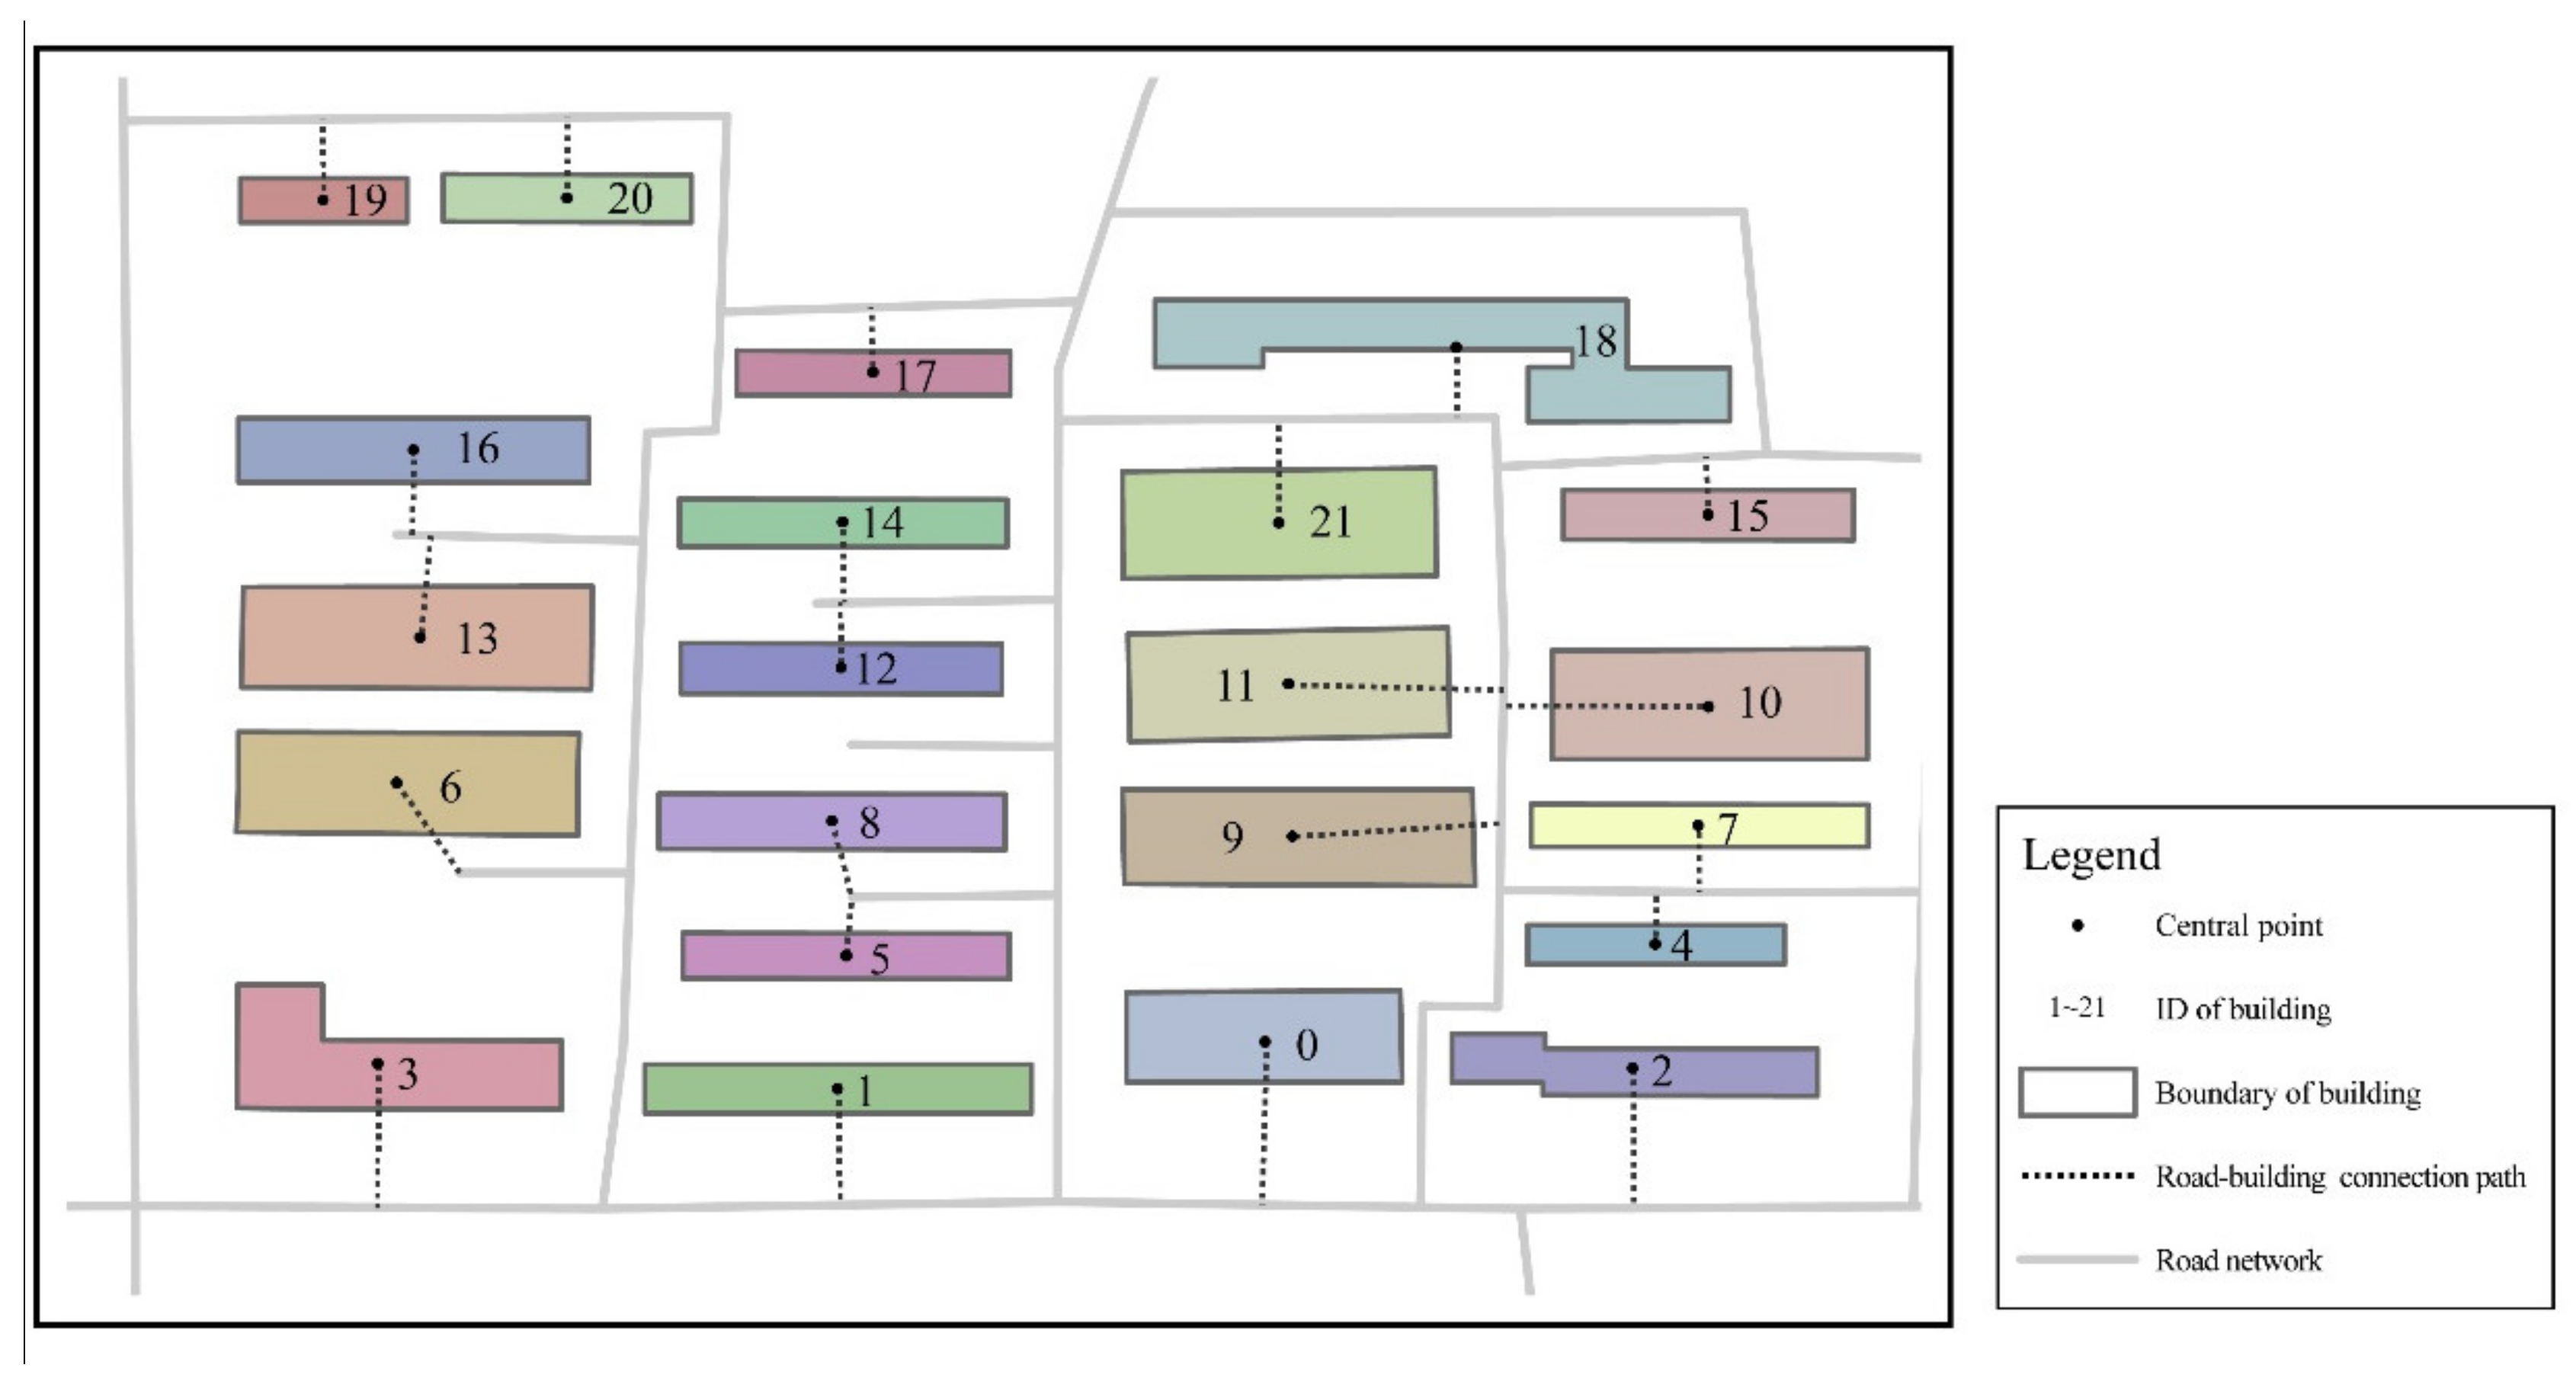
Data collection: We collected, processed, and converted the PoI, road, and building data into the corresponding PoI points, road network, and building points.
(2)
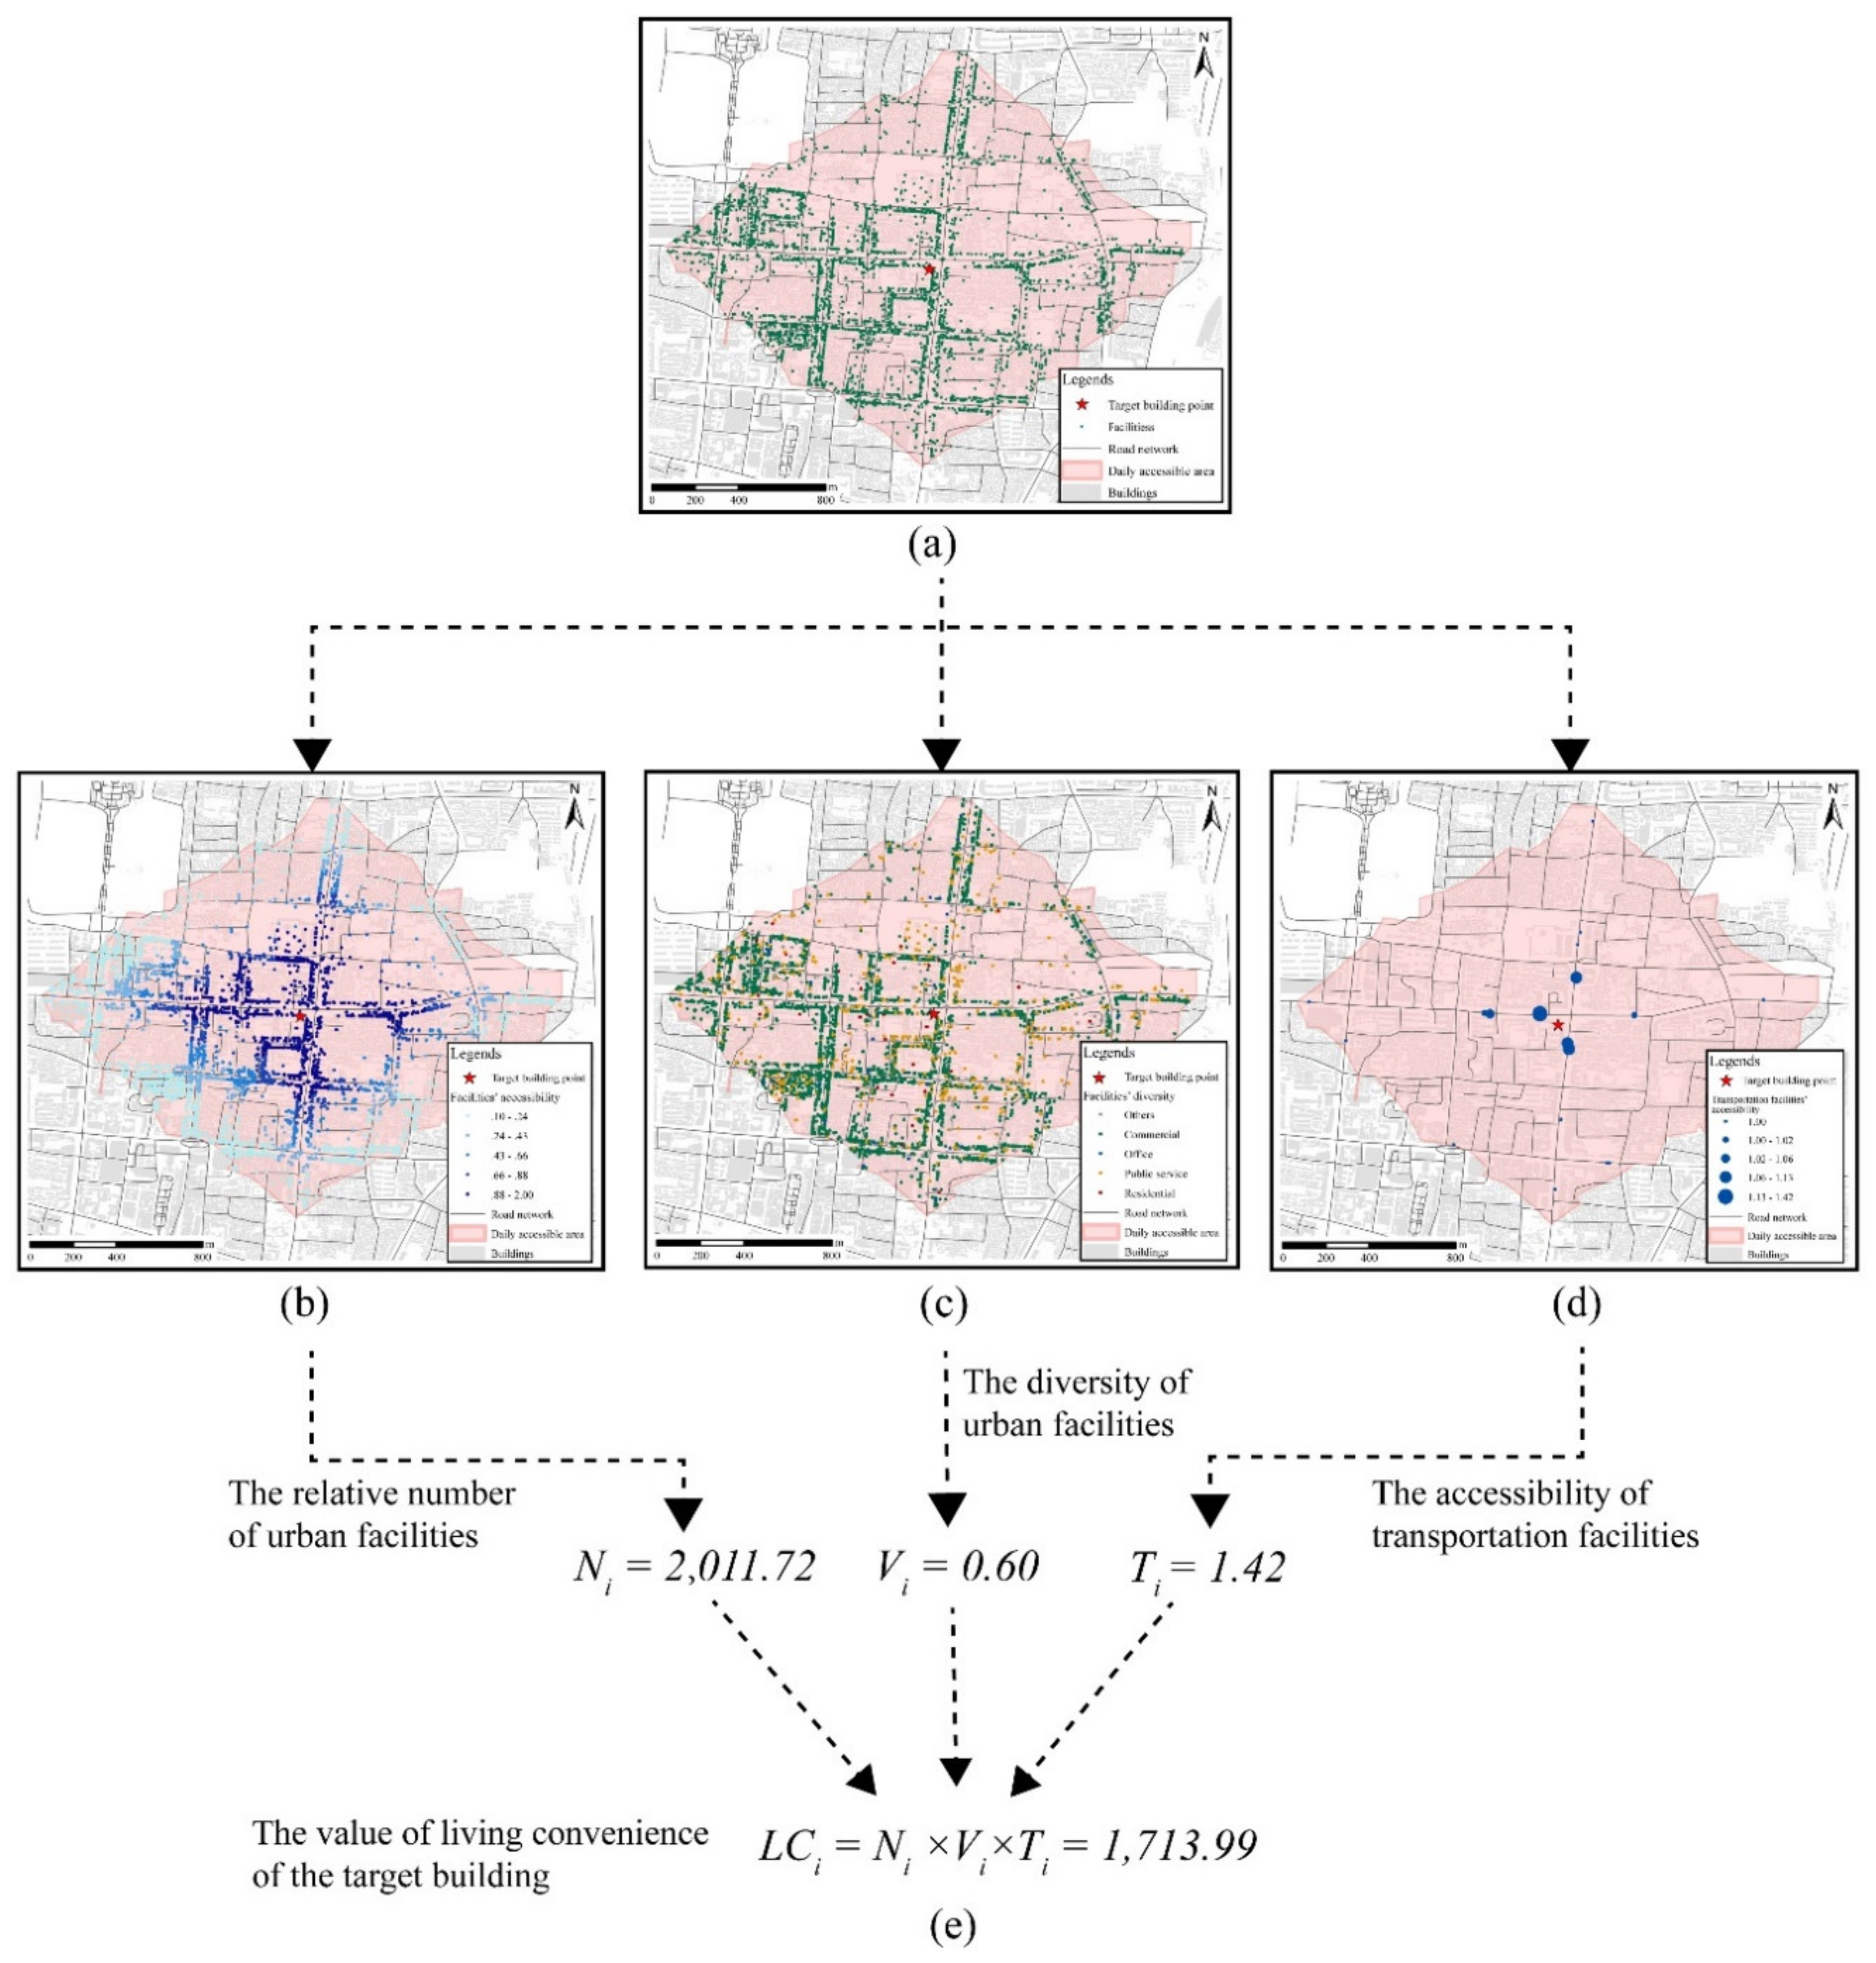
Measurement of living convenience: We calculated living convenience on the basis of the relative number and diversity of PoIs and the accessibility of transportation facilities within the daily accessible data of the building.
(3)
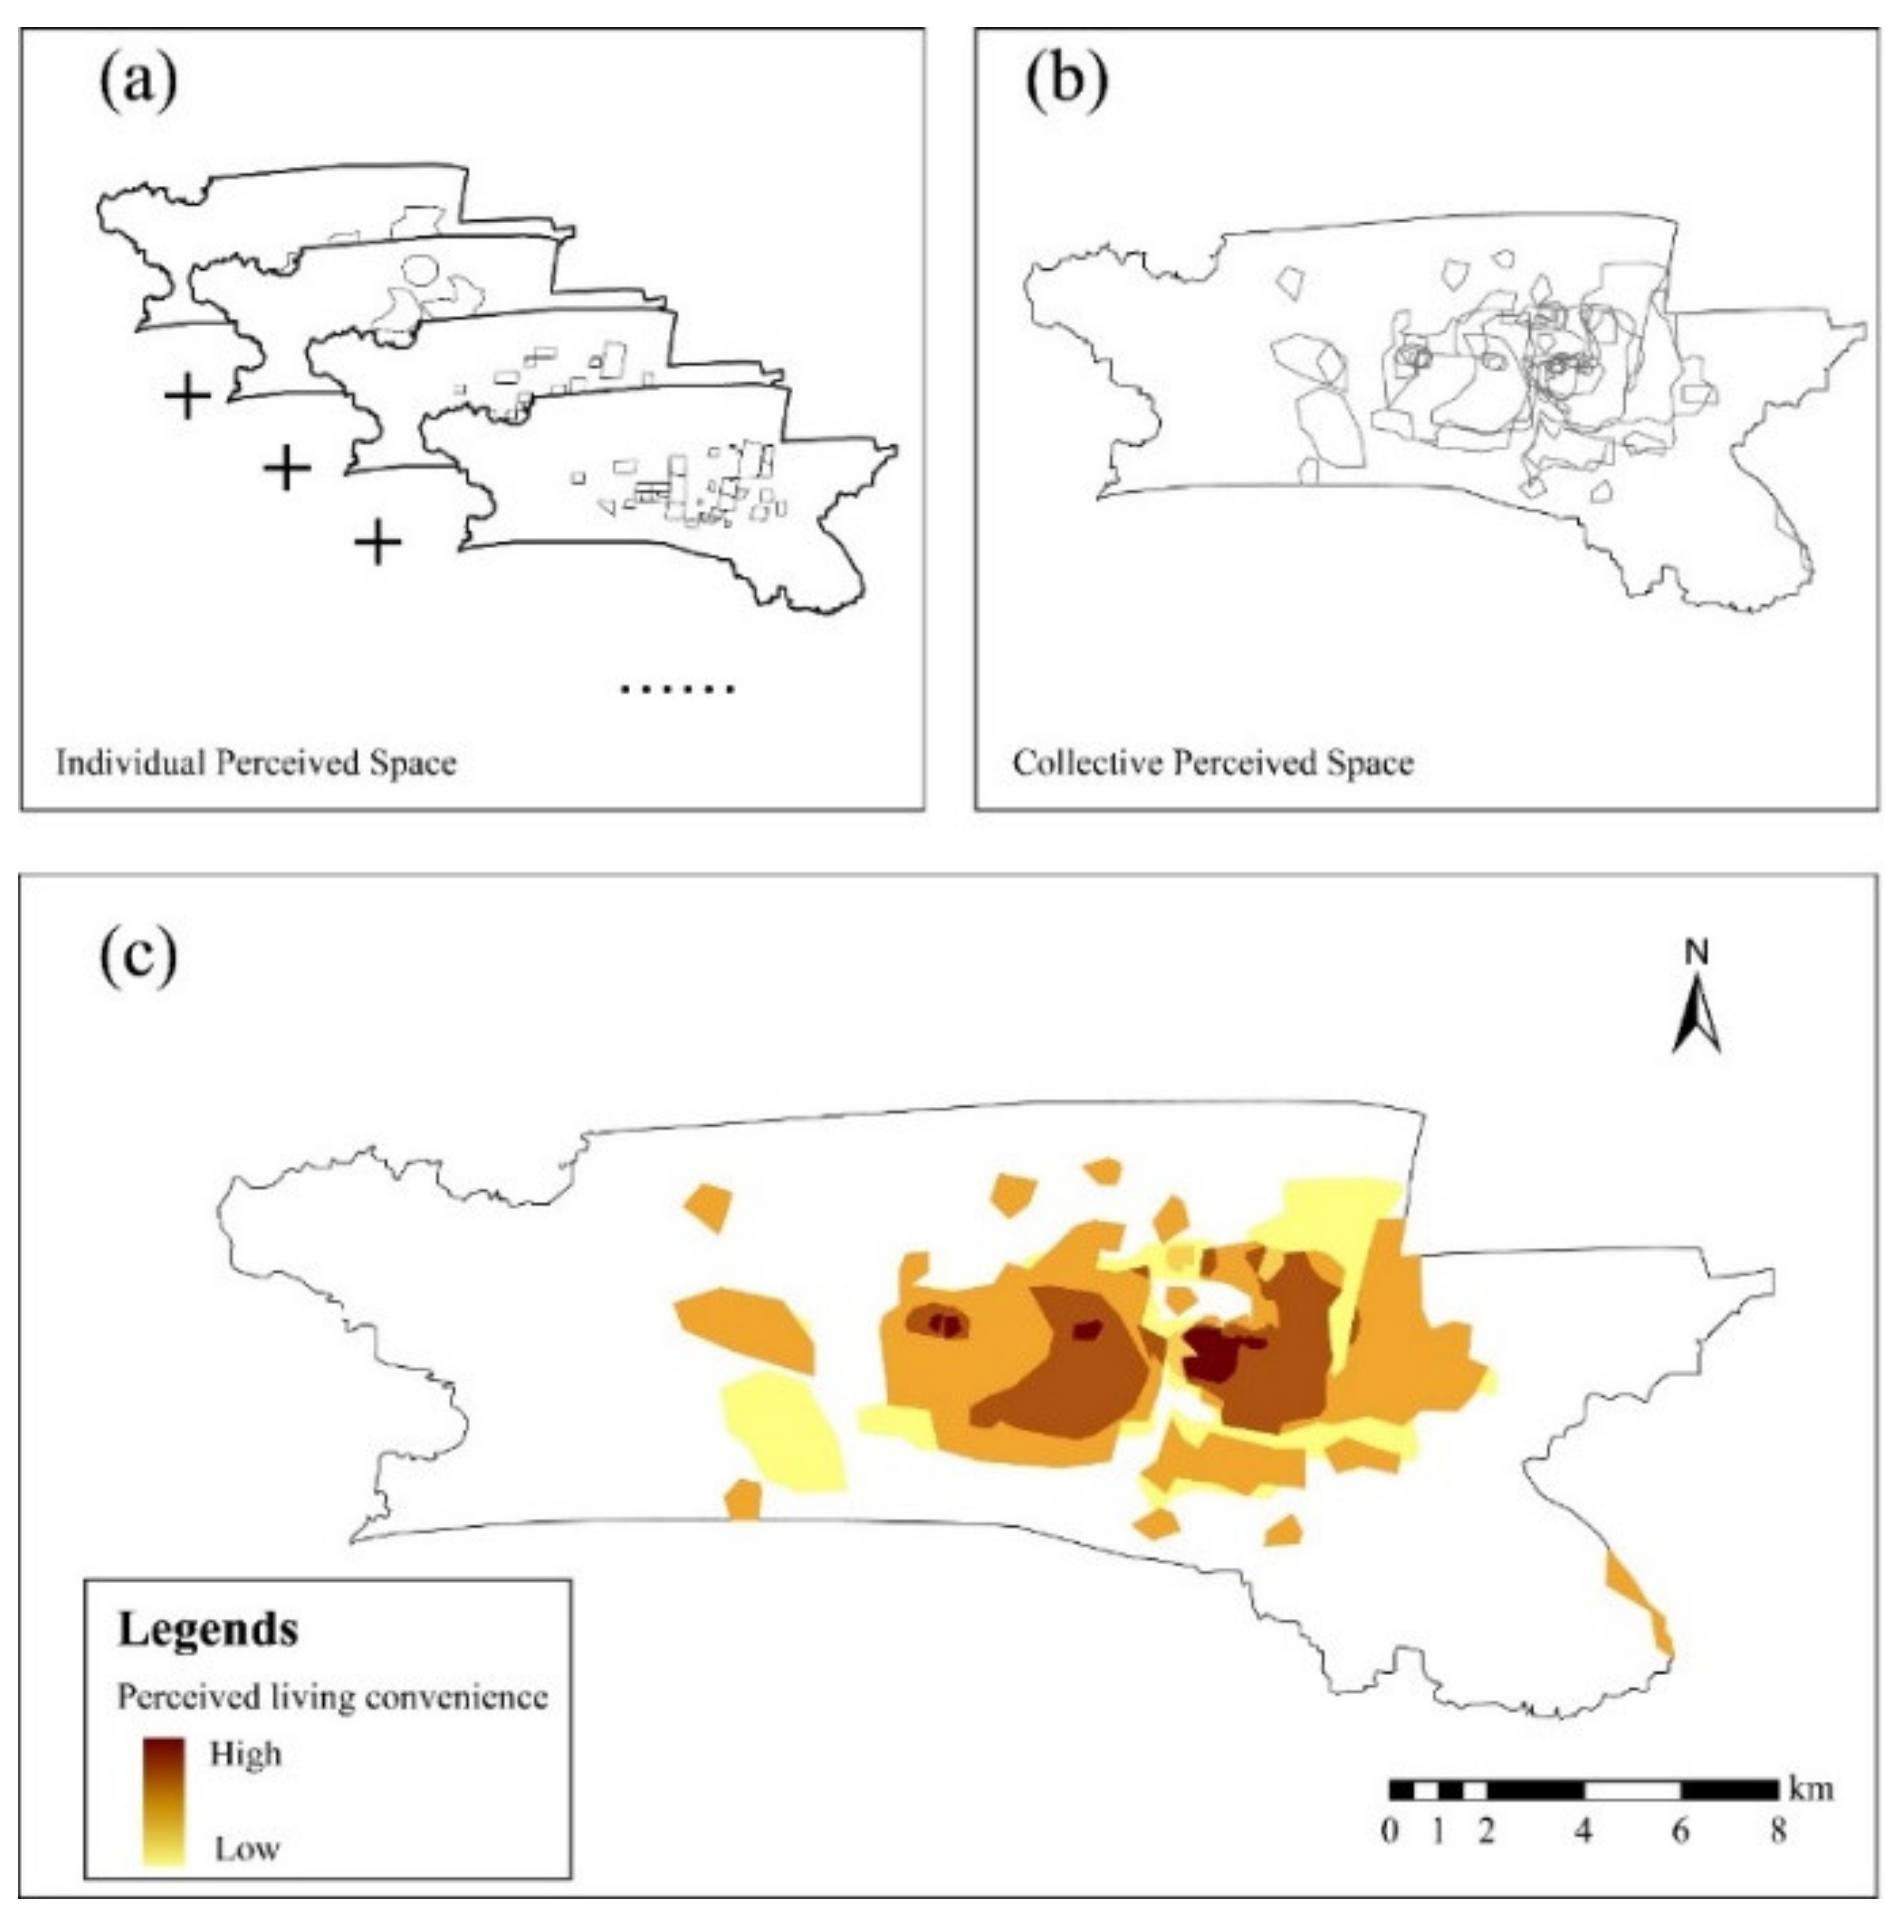
Verification of the measurement: We compared living convenience calculated by our approach with that calculated by the experts to verify the result.
(4)
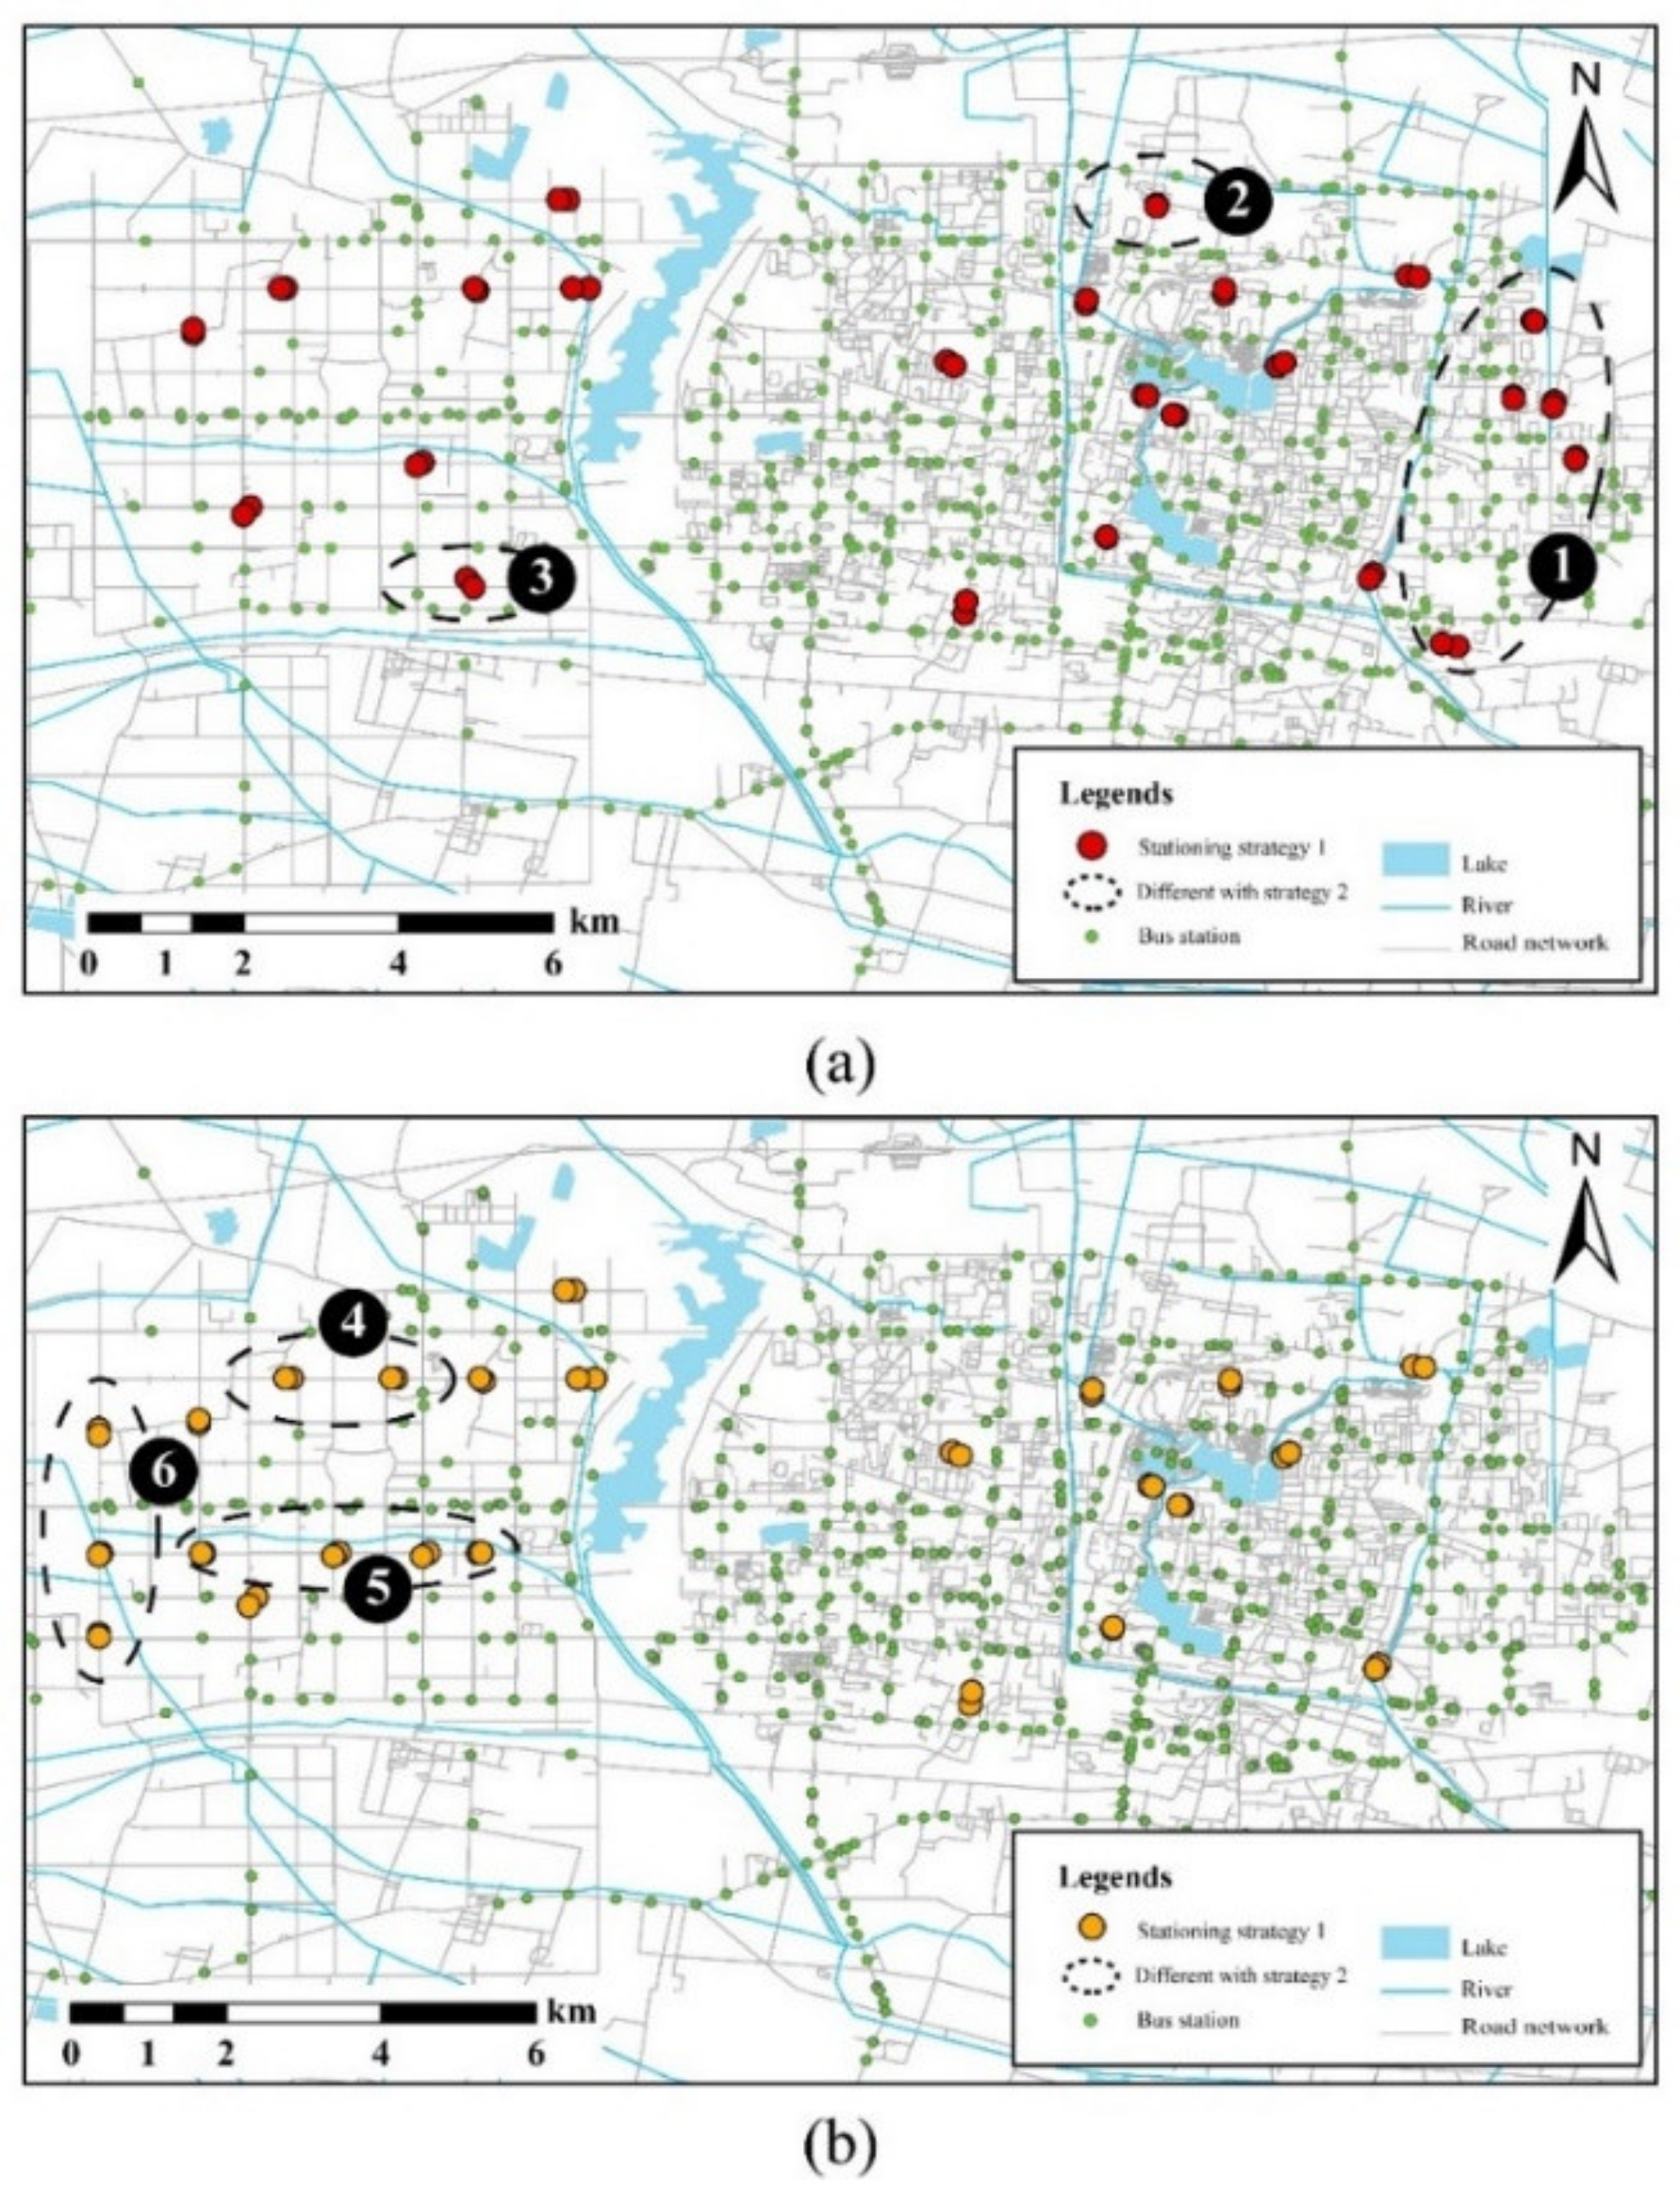
Strategy support: The differences of living convenience in the region were applied to analyze the spatial heterogeneity. In addition, we proposed optimized strategies to improve the living convenience amongst the regions.

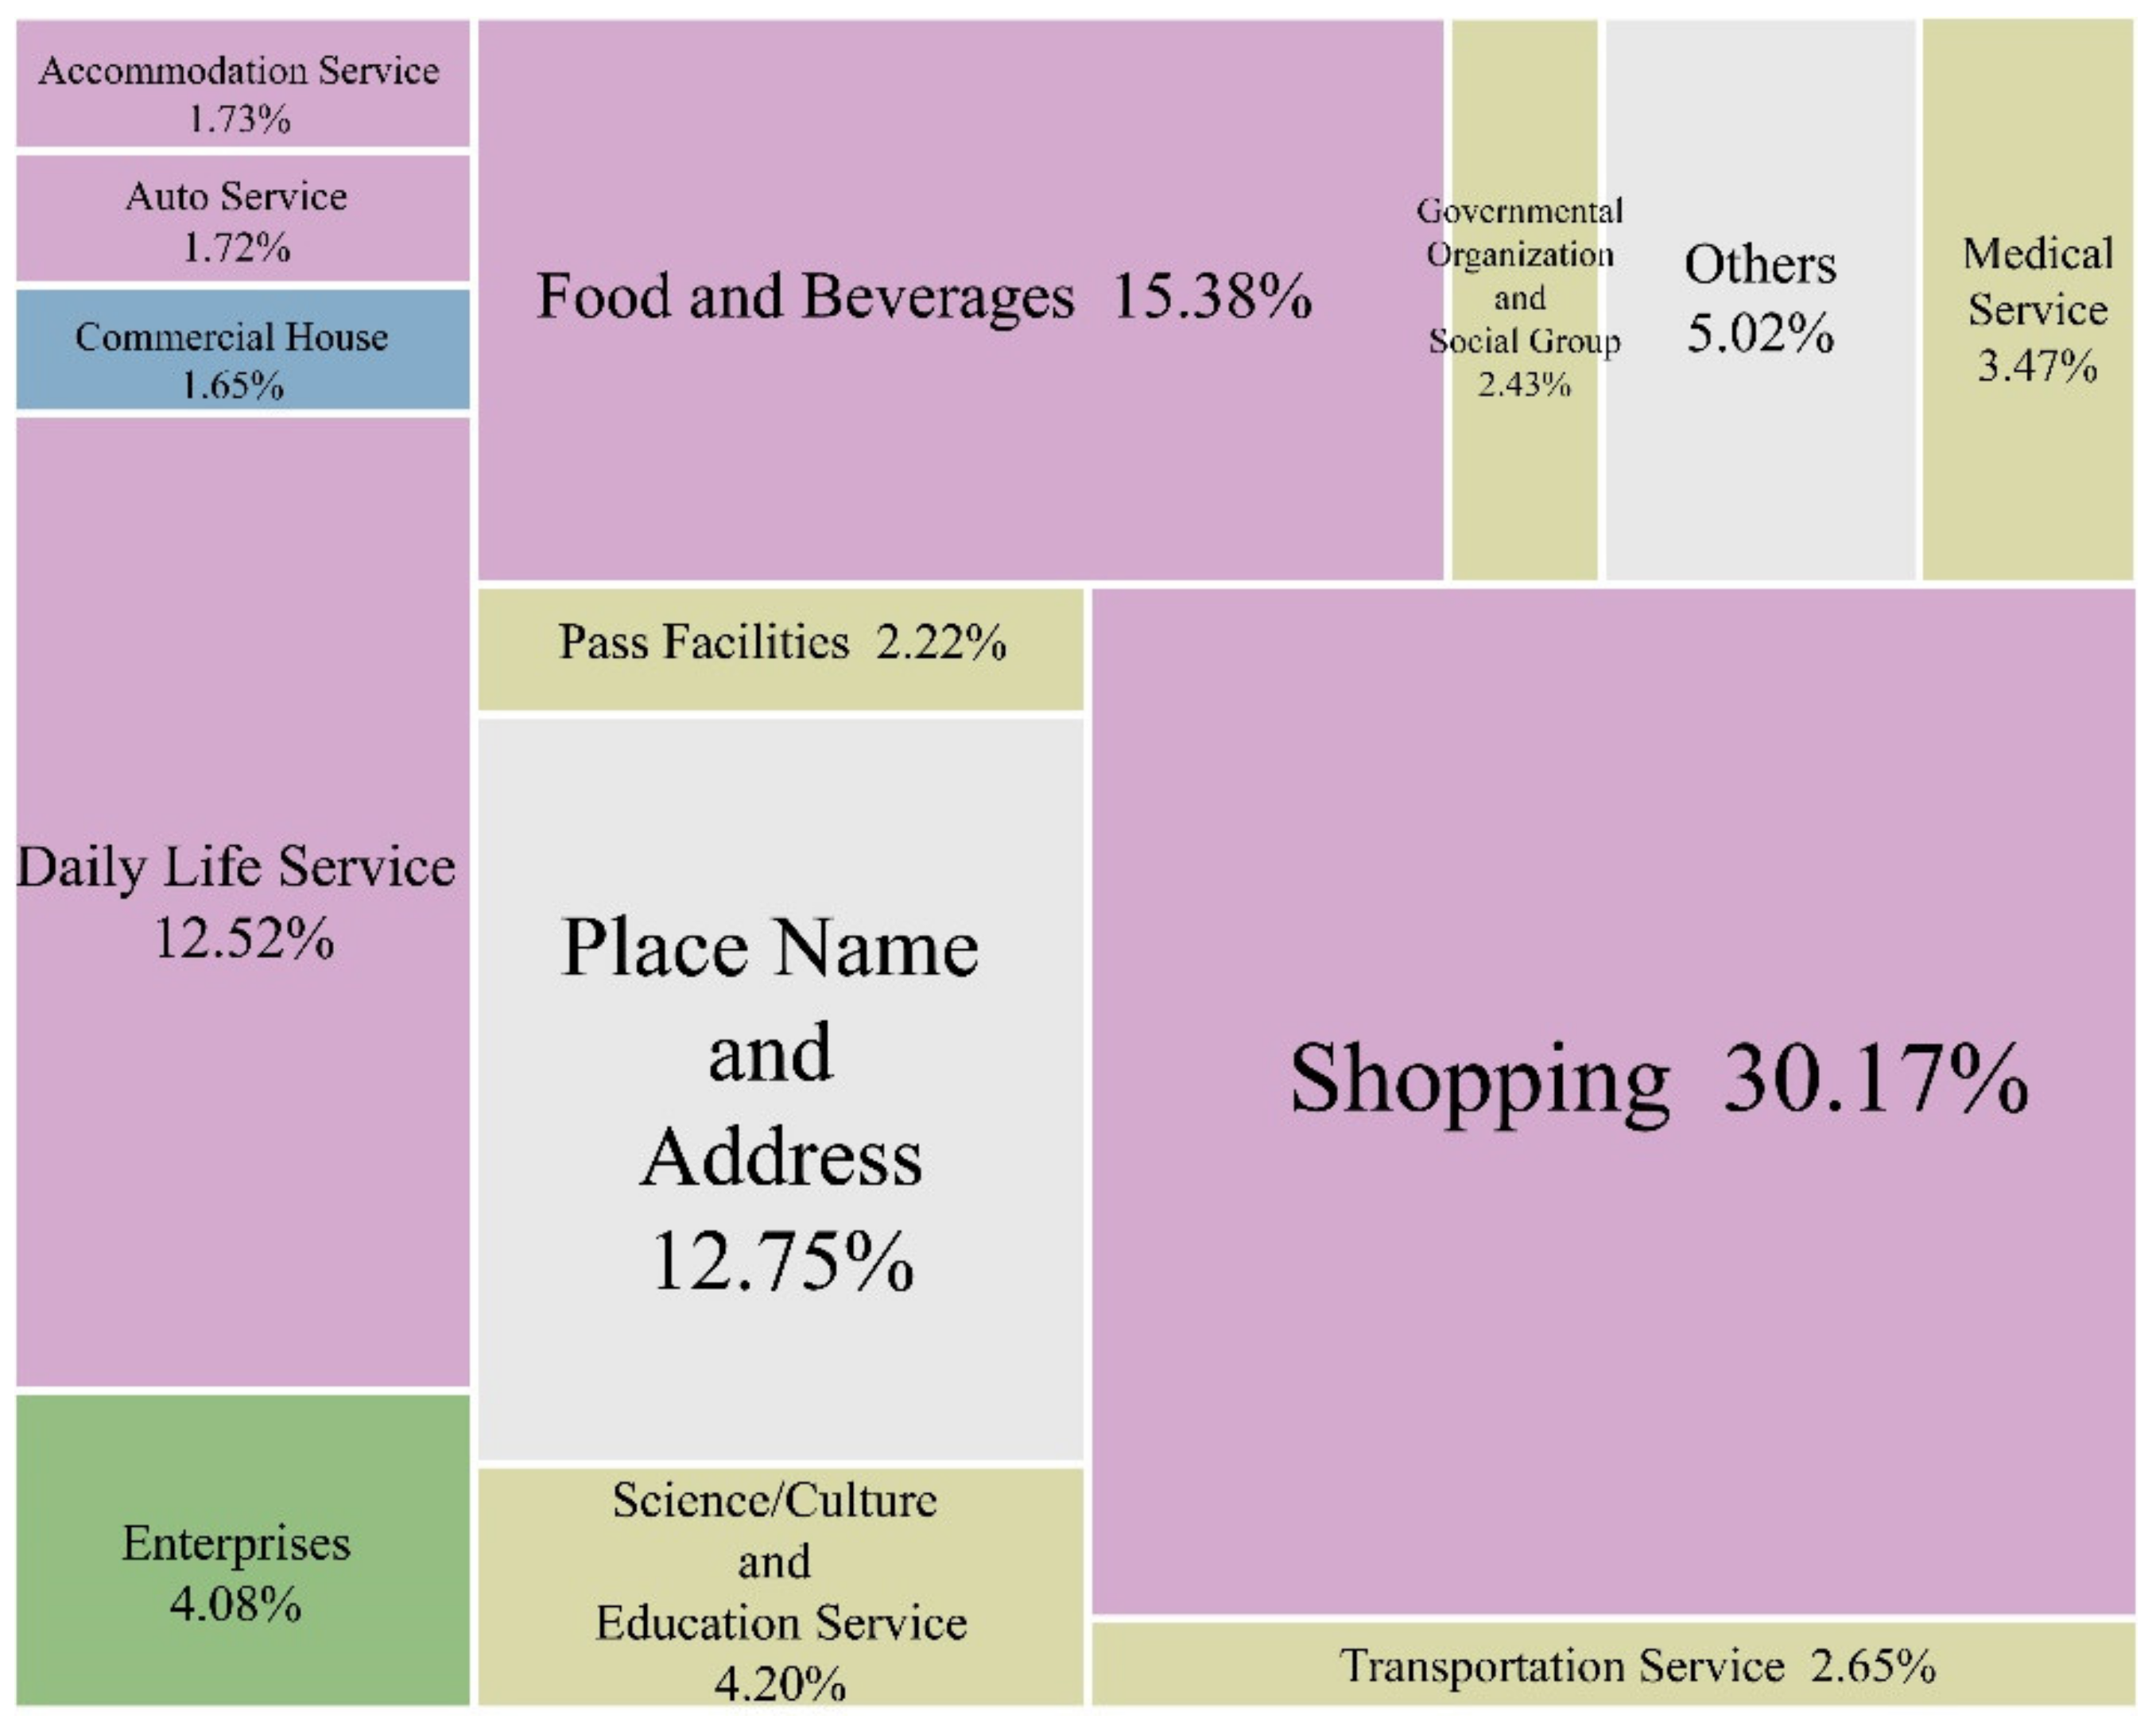
3.3.1. Data Collection

This study collected three kinds of data, namely, building, road, and PoI data, through Web crawling based on Python. More than 100,000 PoIs and 20,000 buildings were collected. Specifically, the building and road data were scraped from a Baidu map by transforming the grid into a vector. PoI data with 23 classes (Figure 5) were captured from the Amap Open Platform (https://lbs.amap.com), which is one of the largest map service providers in China. In 23 classes, 20 classes were further merged into four categories, namely, commercial use (pink), office use (green), public service use (brown), and residential use (blue). The remaining 3 of the 23 classes are related to addressing information. Hence, these three classes were excluded from our analysis.
This study collected a total of 431 buildings, 8837 roads, and 91,814 PoIs from Kaifeng City (long. 114°9′38.0298″–114°29′14.0238″, lat. 34°42′56.3328″–34°51′9.0426″). We processed road data into the road network and transformed the building data into a building point on the basis of its geometric center.

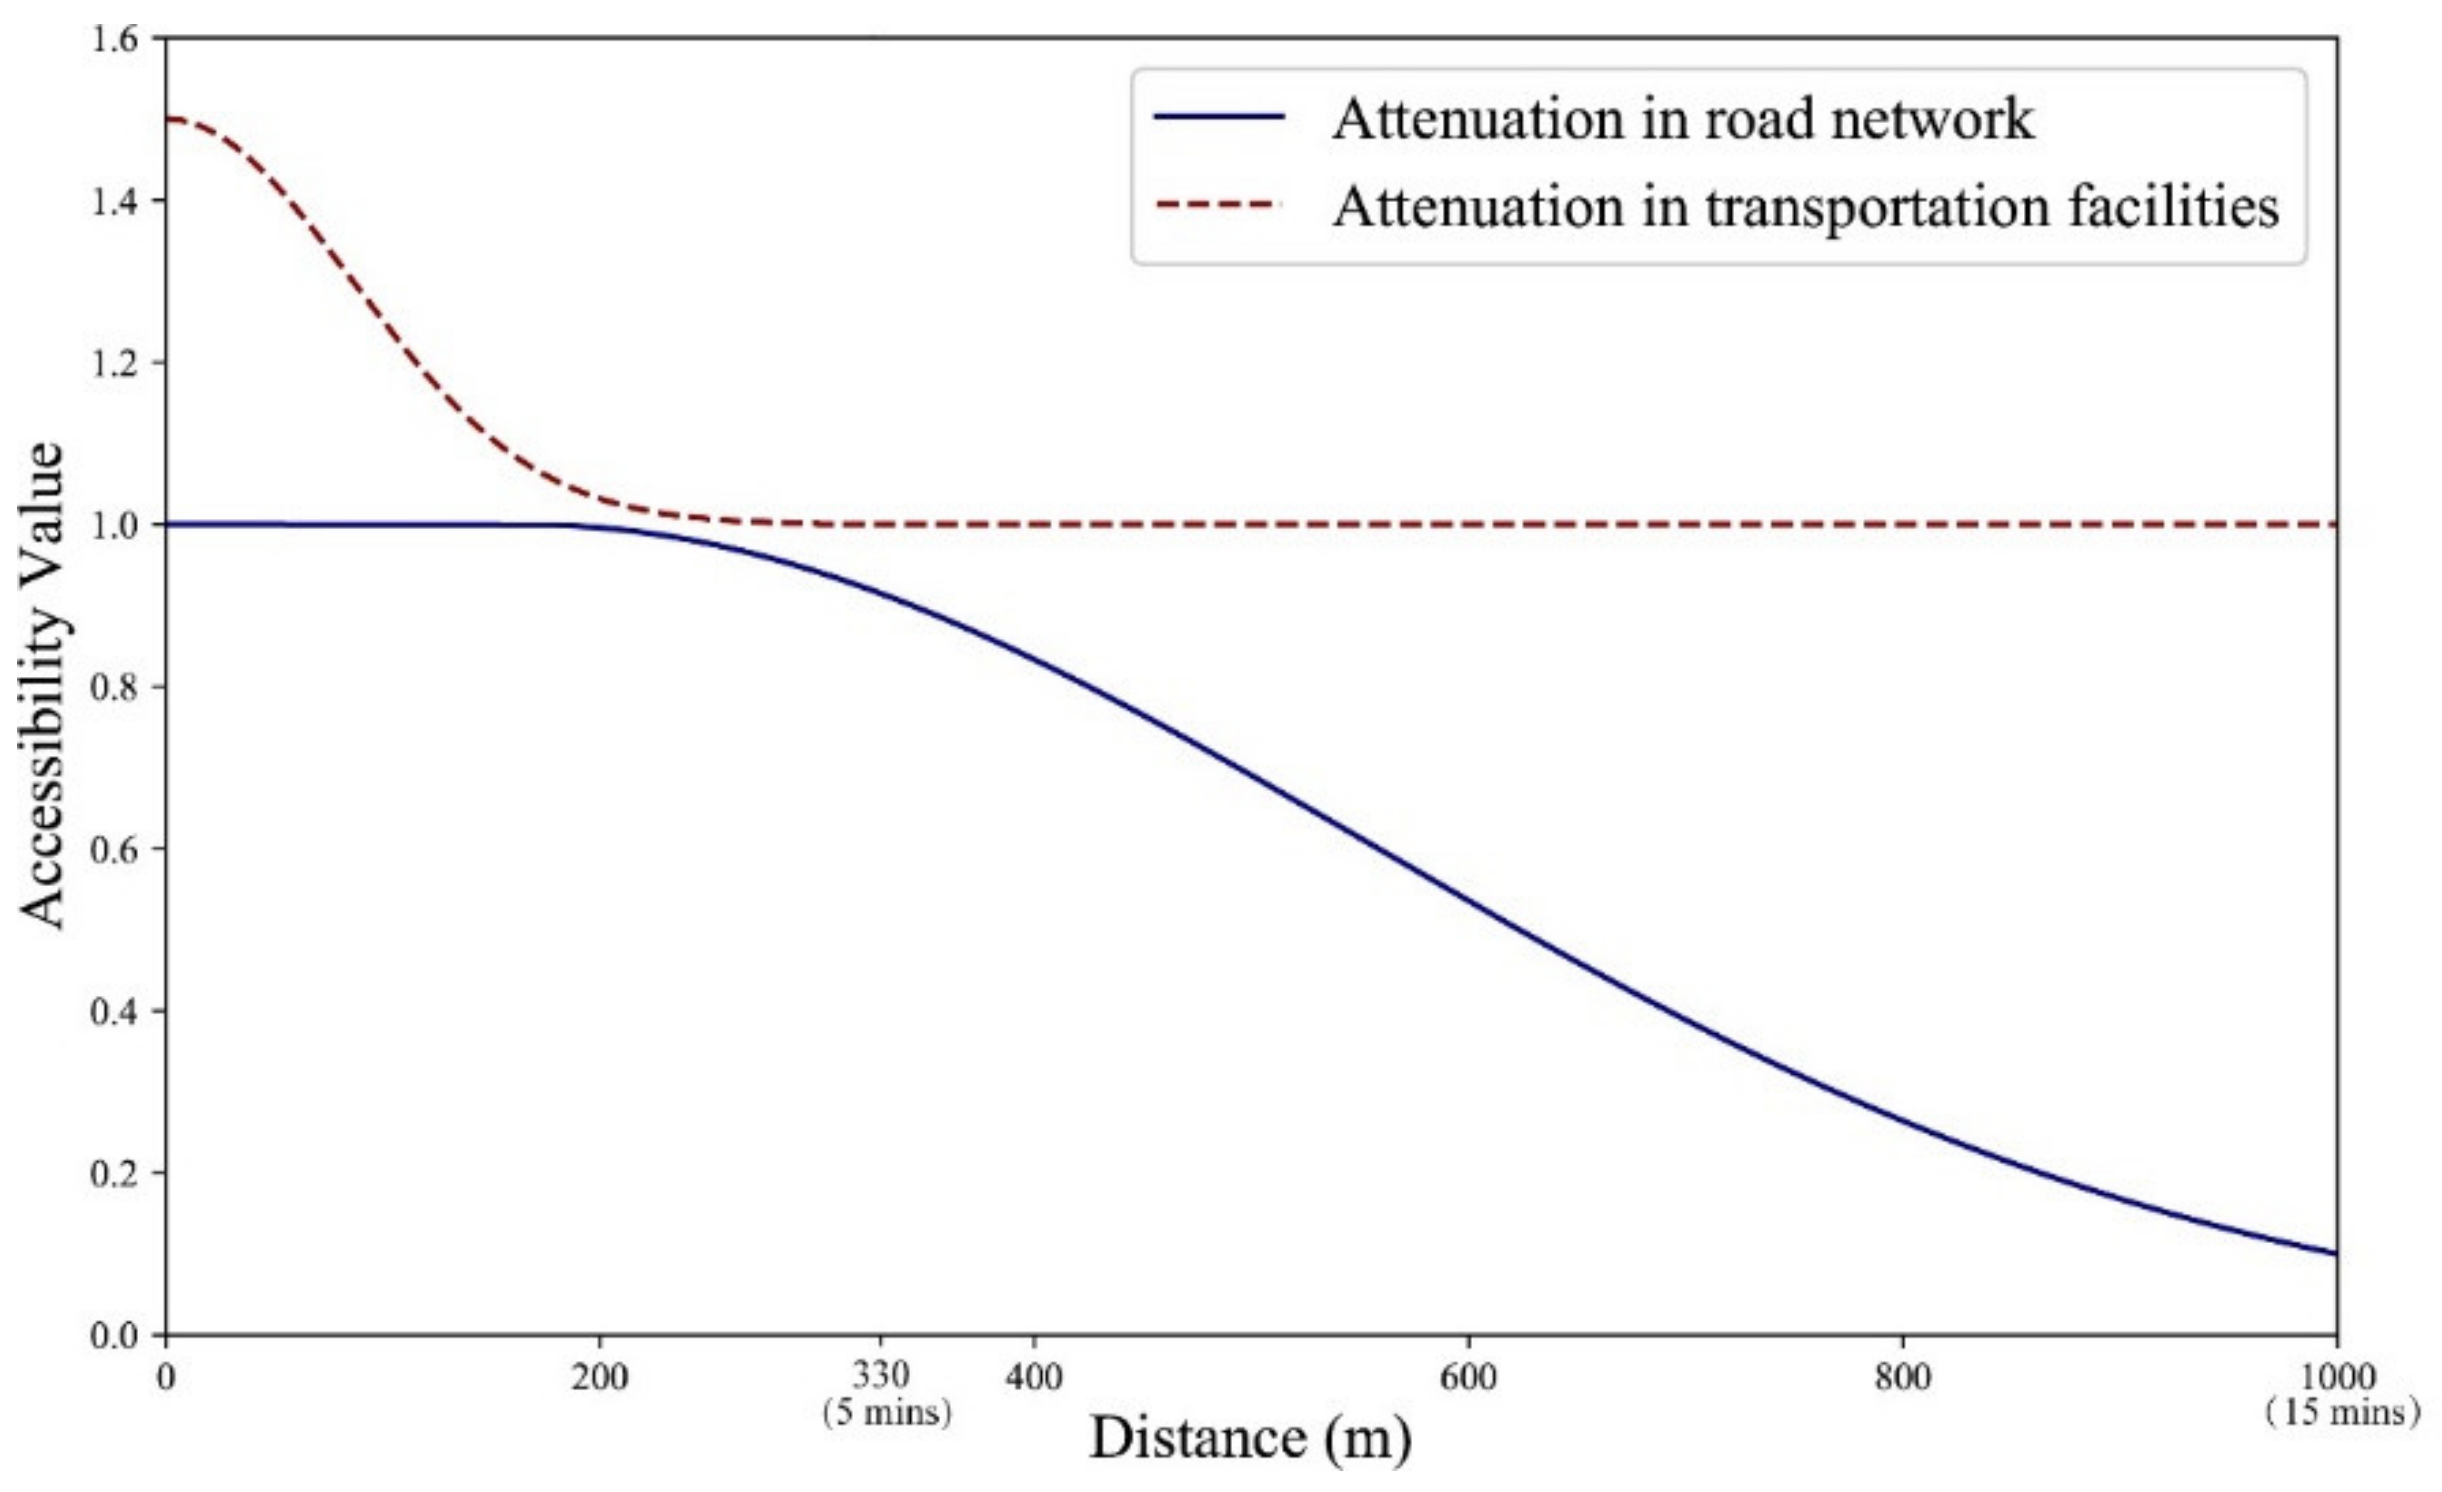
3.3.2. Key Measurements of Living Convenience

According to the conceptual framework mentioned above [33,34], the living convenience based on building units can be measured according to the accessed number and diversity of urban facilities. In turn, living convenience can be equalized to the combination of four key measurements: (1) Daily accessible area, (2) relative number of urban facilities in the daily accessible area after distance decay, (3) diversity of urban facilities in the daily accessible area, and (4) accessibility of transportation facilities in the daily accessible area.
The overall operation of the living convenience calculation of one building is explained as follows (Figure 6). Firstly, the daily accessible area of the target building was calculated using the origin–destination (OD) cost matrix, which was constructed on the basis of the road network data. Herein, the daily accessible area is defined as the region wherein residents can reach the road network within 15 min, i.e., 1 km.
Then, based on the PoIs in the computed daily accessible area of the target building, the relative number of urban facilities (N), the diversity of urban facilities (V), and the accessibility of transportation facilities (T) were calculated. The PoIs herein include not only urban facilities inside the buildings, but also urban areas such as green parks, campuses, and rivers. The value of living convenience (LC) of the target building was calculated on the basis of N, V, and T (Figure 6b–d).
The detailed calculation involves the following three steps:
Firstly, the relative PoI number (N) is defined as the sum of the accessibility of PoIs that a single building can reach within the daily accessibility area. The calculation formula is defined as
N i = j = 1 n A i j ,
where
  • Ni represents the relative number of PoIs for building i.
  • n represents the number of all facilities that can be reached within the daily accessible area of building i.
  • Aij indicates the accessibility of building i to facility j.
Specifically, facility accessibility (A) refers to the cost that residents must incur to reach a specific facility. It is the result of the distance from the building point to the facility point after distance decay, and the corresponding weight of the facility is considered. The calculation formula is expressed as
A i j = G a u s s ( D i s t i j ) × W j ,
where Distij indicates the distance from building i to facility point j along the network. The unit of measurement is the meter. Wj is the weight value of the jth facility point and represents the different importance of the various classes of facility points. The detailed weightings were set following the methodology used in Walkscore [47].
The Gaussian function was used to calculate the distance decay. Compared with the rectangular and exponential functions, the attenuation form of the Gaussian function can better reflect the interactions of residents with facilities at different distances in their daily activities. For instance, facilities within a 5 min walking distance (330 m) from the building are used most frequently. By contrast, the frequency beyond a 15 min walking distance (1 km) lies at a deficient level. Thus, Gaussian attenuation can better describe the changing tendency (blue line in Figure 7) compared with other functions.
The Gauss kernel function, which defines the core characteristics of attenuation, is expressed as follows:
G a u s s K e r n e l ( d ) = e 1 2 ( d σ ) 2 0 d r ; 0 o t h e r w i s e .
Here, σ is the adjustment factor that can alter the form of the Gauss attenuation curve, with a default value of 0.5.
Secondly, the PoI diversity (V) is measured based on the Shannon–Wiener index, which reflects the richness of facility types within the daily accessible area. The calculation formula of the PoI diversity is expressed as
V i = i = 1 n p i l n p i ,
where
  • Vi indicates the PoI diversity of building i,
  • n is the number of facility types within the daily accessible area of building i, and
  • pi indicates the proportion of facility type in building i relative to all facility points within the daily accessible area.
Thirdly, the accessibility of transportation facilities (T) reflects the improvement of transportation facilities provided for living convenience. The maximum of the accessibility of transportation facilities from the building to the bus station and other transportation facilities, e.g., bus–rail transit and light rail stations, was calculated. The calculation of traffic accessibility Aij was set according to an empirical survey in Kaifeng, which shows that the positive effects of bus stations and other transportation facilities on perceptual convenience are commonly between 1.2 and 1.8. Specifically, the weighting of a normal bus station is set to 1.5, while bus–rail transit and light rail stations are set to 1.8. The distance attenuation reaches the maximum at a distance of 300 m, which represents the 5 min walking distance (red line in Figure 7).
The specific calculation formula is defined as
T i = m a x ( A i j ) .
After the results of the relative PoI number (N), the PoI diversity (V), and the transportation facilities’ accessibility (T) of the target building point are calculated, the living convenience (LC) of the target building can be obtained as follows:
L C i = N i × V i × T i .

4. Results

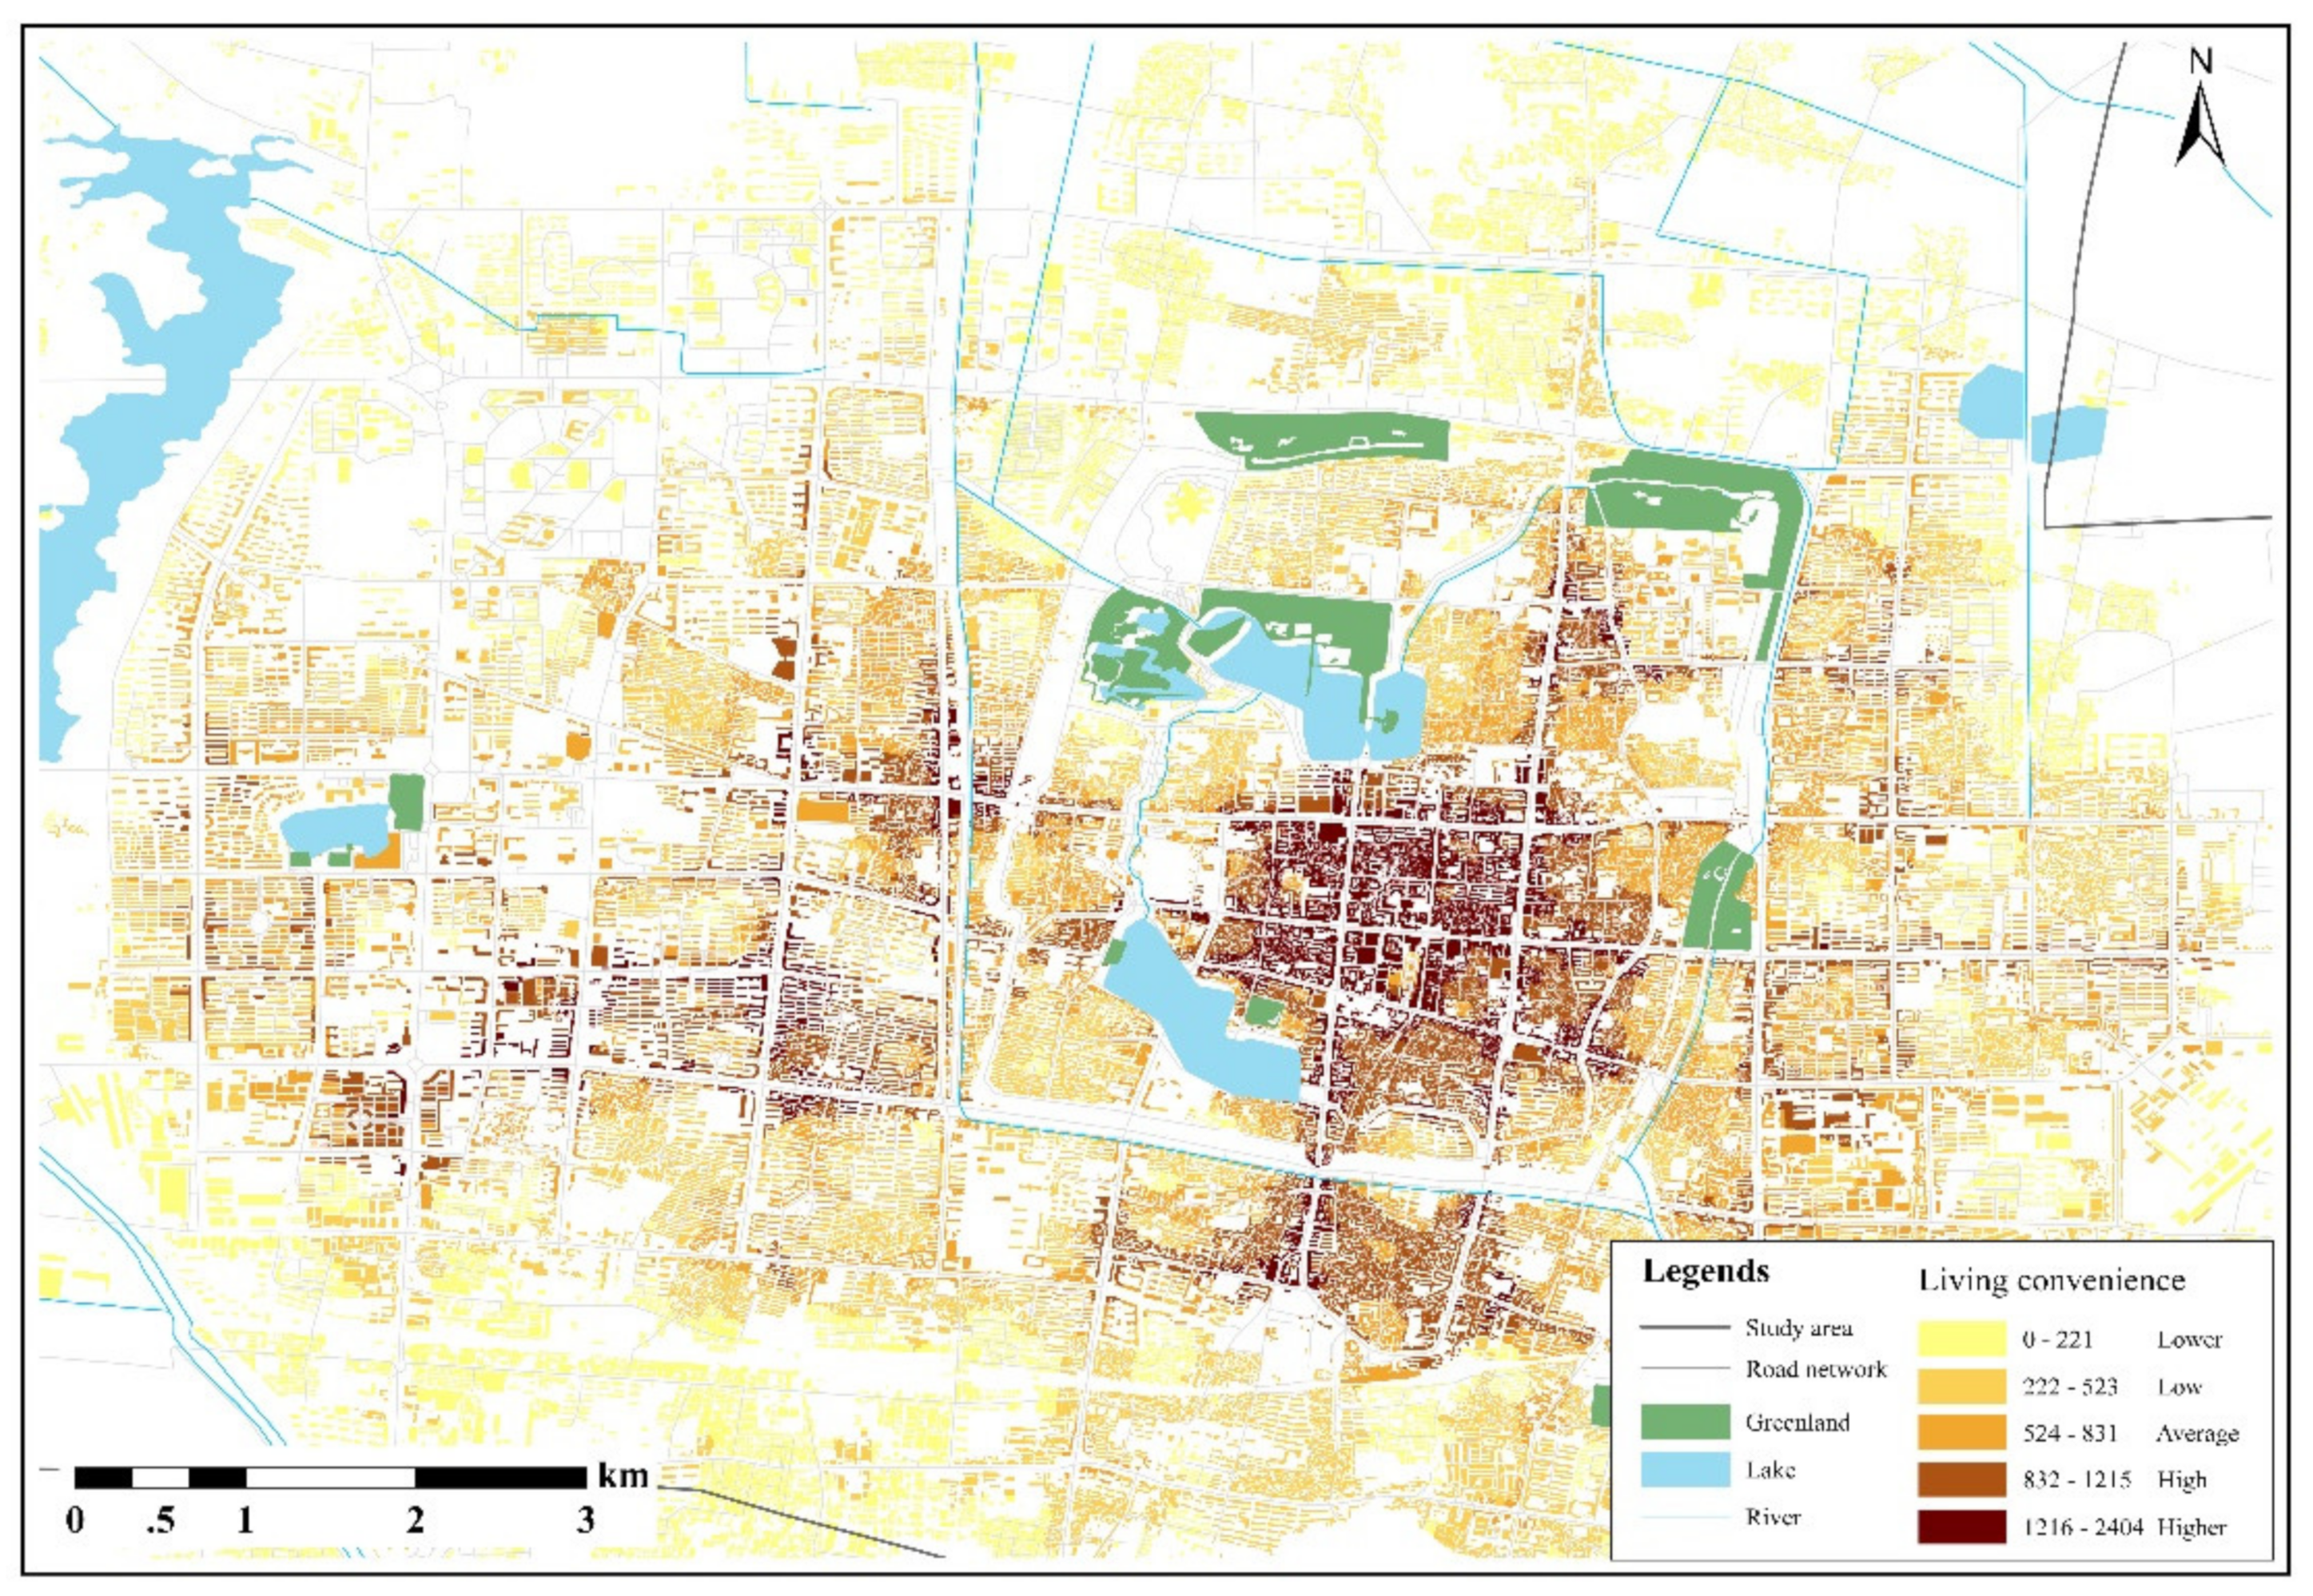
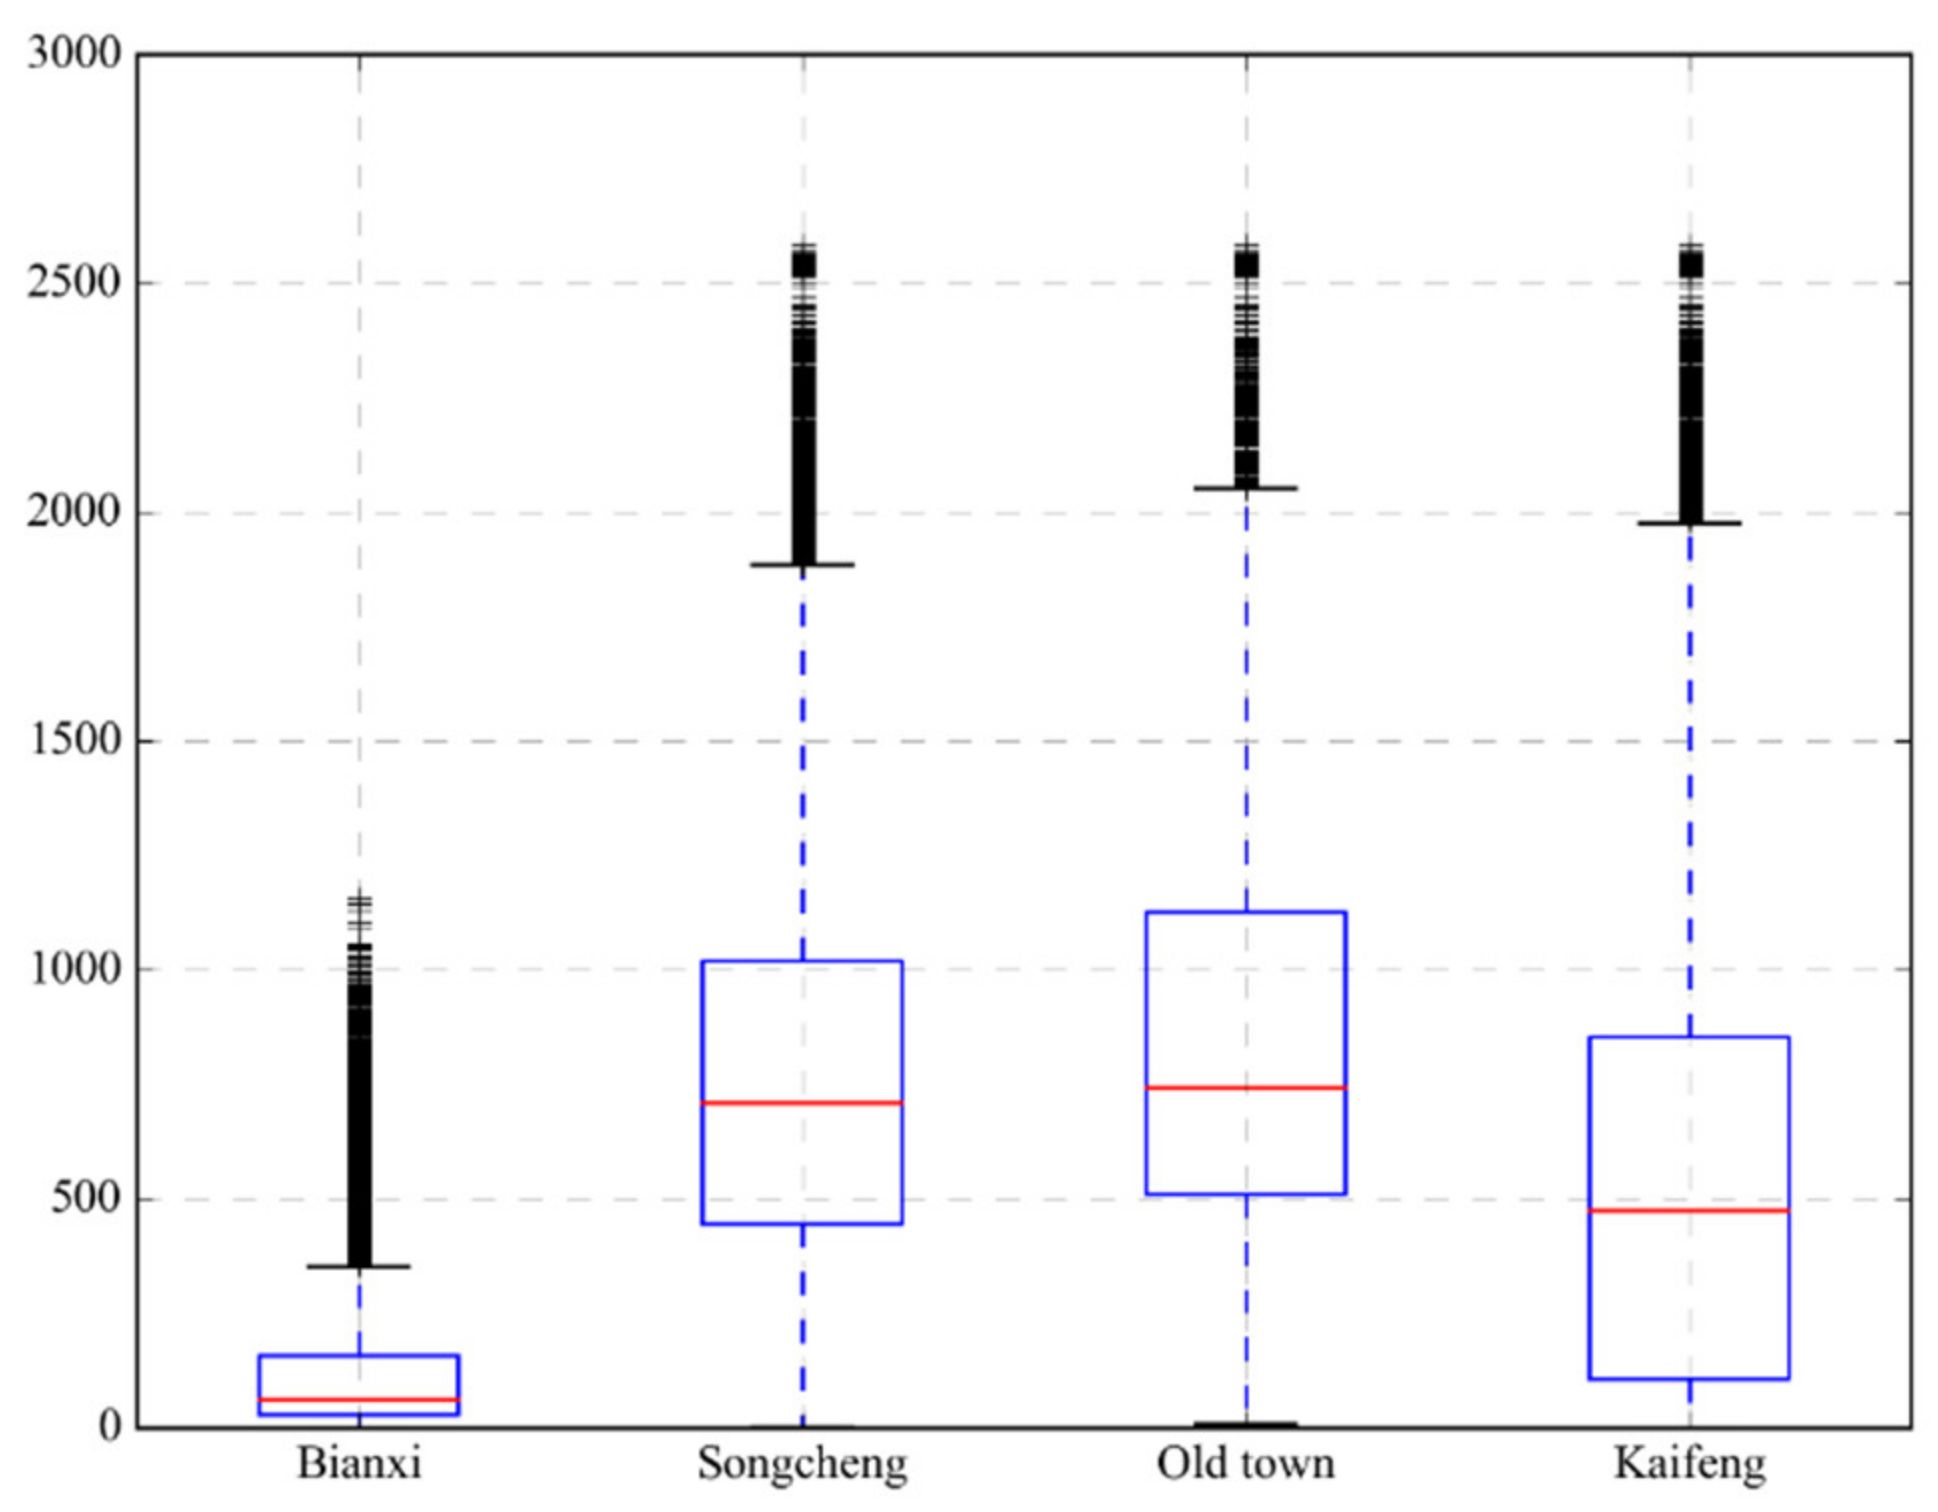
4.1. Analytical Results of Current Living Convenience

According to the method mentioned above, we were able to achieve the calculation and visualization of living convenience in the case study area, using buildings as the analytical unit (Figure 8). In order to run this large amount of computation efficiently, relevant techniques in urban computing were introduced [48]. Techniques including parallel computing, memory computing, multi-level cache, and dynamic scheduling are used to ensure efficient large-scale processing of massive amounts of data. The Hadoop architecture is applied as the computing architecture, and a secondary distributed index of spatial data is established for various basic data, such as buildings, roads, and PoIs, to improve the efficiency of calling. Specifically, this study used the GIS Tools for Hadoop toolkit in ArcGIS to leverage the Hadoop framework to complete spatial analysis. In this toolkit, the Geoprocessing Tools for Hadoop are used to connect spatial data between ArcGIS and Hadoop. The Hadoop cluster was developed with Hadoop 2.7.3 based on the CentOS 7.2 operating system. The massive amount of PoI, road, and building data was formatted to a remote Hadoop Distributed File System (HDFS) of Hadoop. The spatial analysis was conducted through the ArcGIS API for Python (ArcPy) based on a registered big data file share stored in an HDFS with Python scripts. We thus achieved efficient computing of living convenience. The results are illustrated in Figure 8.
Different from previous analytical approaches, which are only able to provide results based on communities, this study makes a significant advance by providing human-scale analysis. As shown, the living convenience of each building can be measured and visualized. It appears that several renowned historic streets in the old town center, e.g., Zhongshan Road and Jiefang Road, obtain the highest living convenience. Two sub-centers have high living convenience, i.e., Jingming Avenue and Zhengzhou-Kaifeng Avenue, and emerge close to the historic town. In short, the co-presence of human-scale resolution with a city-scale picture helps to explore in-depth understandings that were previously hard to achieve.

4.2. Result Verification

Result verification is applied herein to test the reliability of this newly developed analytical approach. As an intangible and perceived quality, the common sense of local urbanists could be a good validator to verify the accuracy of computed living convenience. Therefore, a questionnaire was designed to collect local experts’ judgements on their perceived living convenience. Twenty-three experts were involved in total. The detailed questionnaire adopted in this study is explained as follows (Figure 9).
The definition of living convenience was firstly explained to each expert. Subsequently, each expert digitized the area with high living convenience. All of these results were then collected and converted into a GIS platform. Finally, the correlation between the living convenience computed in our analytical approach and the subjective judgment given by local experts was analyzed.
It is clear that the perceived living convenience from local experts manifested consistently with the computed results to a certain degree, as shown in Figure 8 and Figure 9. The old town neighborhoods obtain high living convenience in both approaches. To remove the uncertainty due to the involvement of different experts, the buildings that were rated more than seven by local experts were selected to conduct a correlation analysis between computed results. The Pearson correlation coefficient value was 0.61, which reflects a high correlation between local experts’ perceptions and computed results. This statistical result shows that this newly developed analytical approach can measure living convenience accurately and quantitatively.

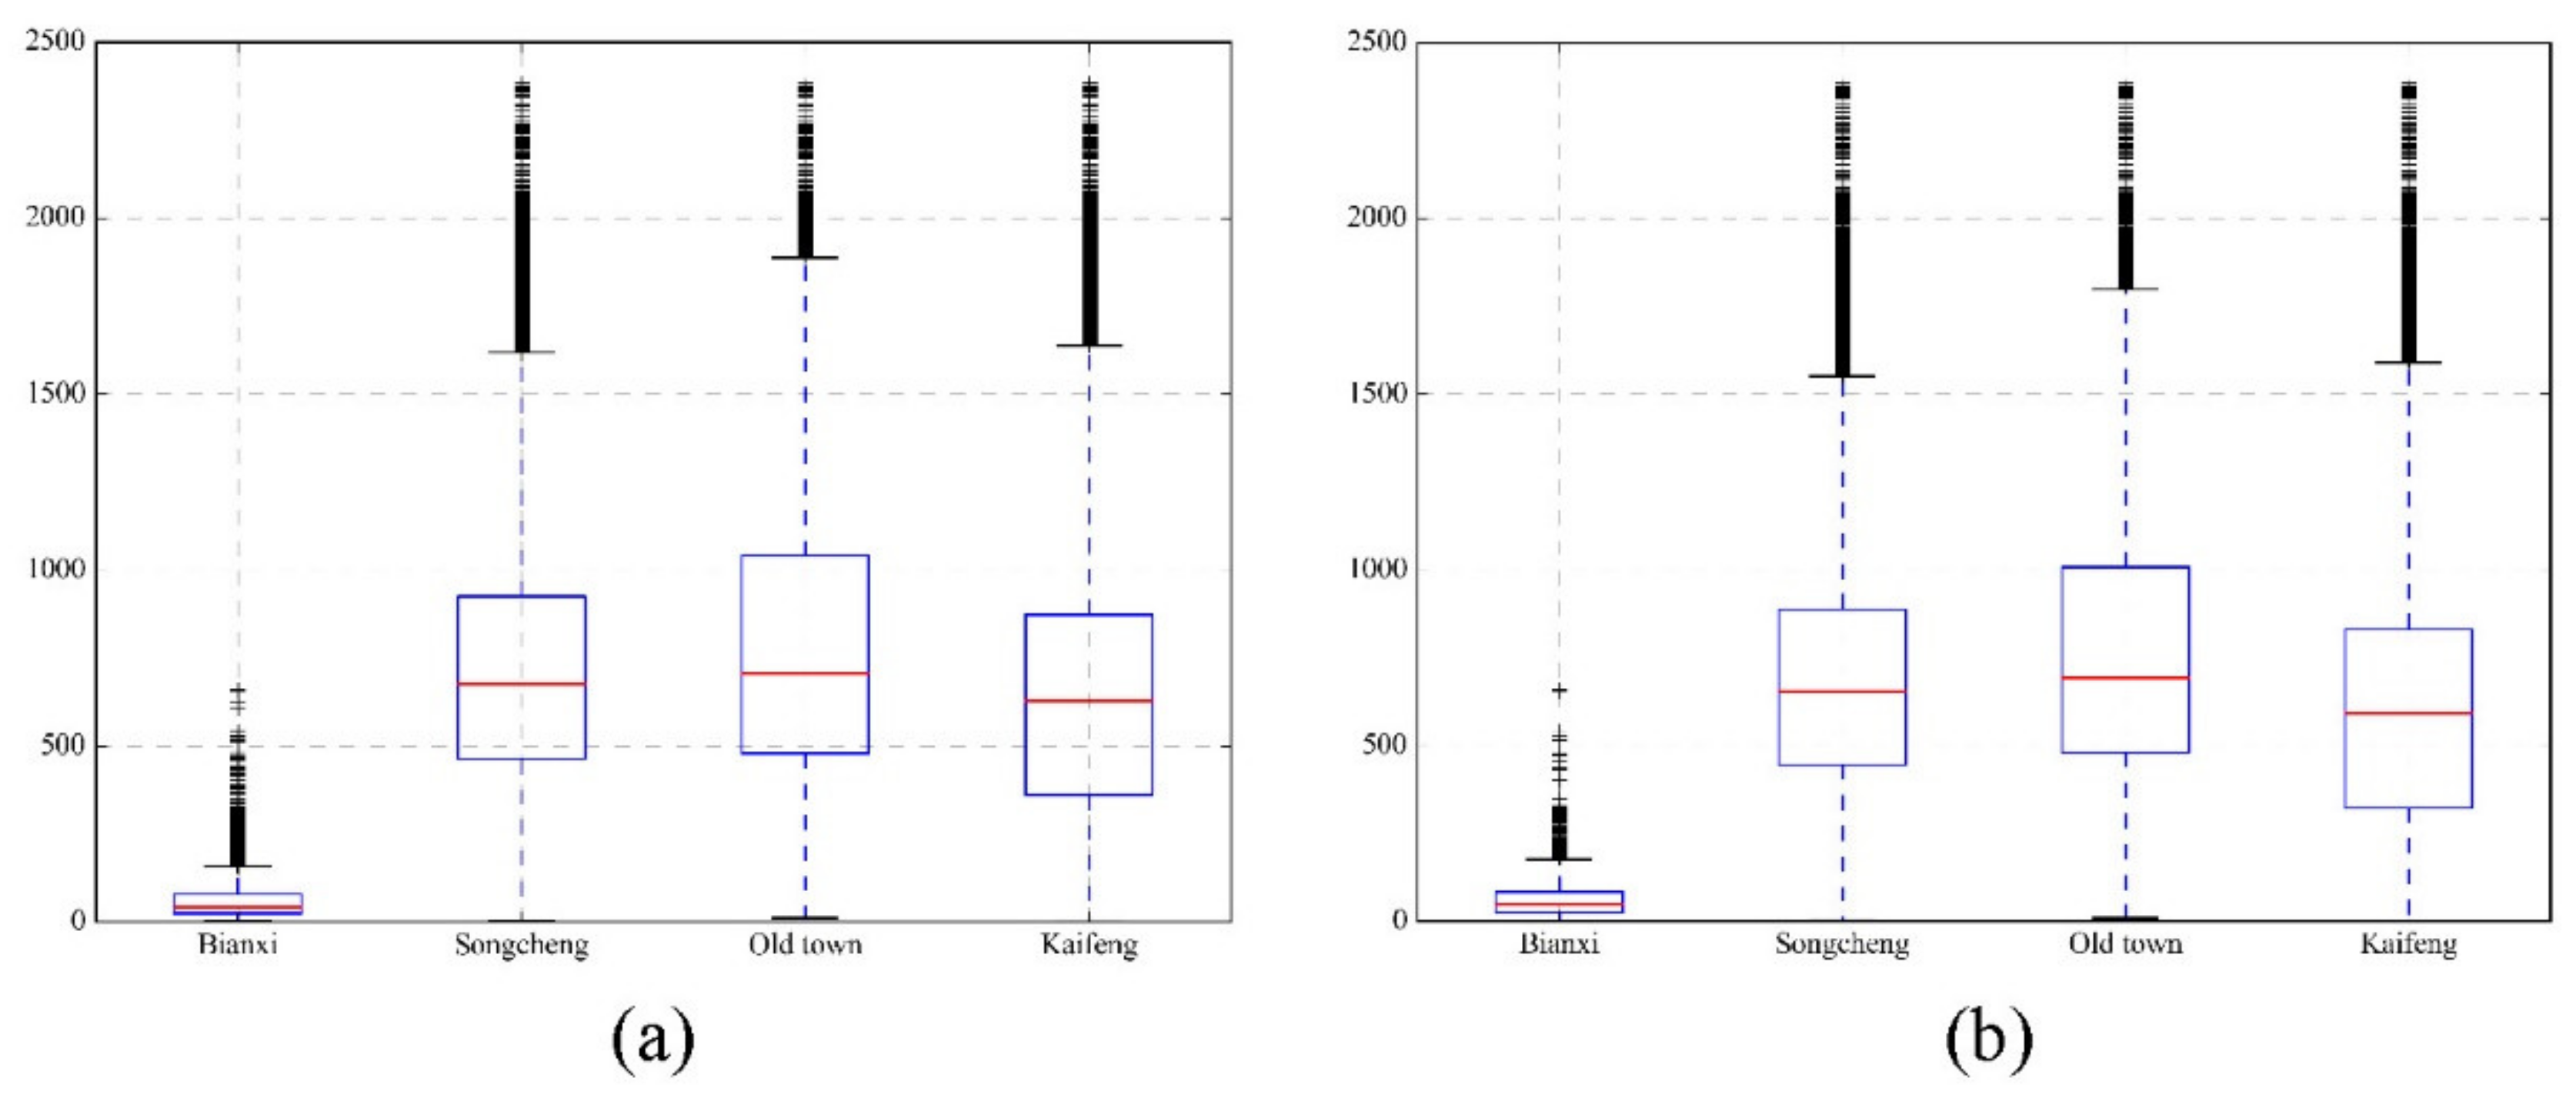
4.3. Supporting Urban Planning Decisions via the New Analytical Approach

This analytical approach has the potential to provide planning decision support in a quantitative way, since it is able to measure the ‘unmeasurable’ perception of living convenience.
First of all, it helps to reveal the distribution of the value of living convenience as evidence for exploring spatial heterogeneity and regional inequality. As shown in Figure 10, the mean value of living convenience in the entire Kaifeng City is 541. The Songcheng area (mean living convenience is 752.8), and the old town (mean living convenience is 835.03) are above the average living convenience in Kaifeng (Table 2). In particular, the old town area holds a higher living convenience than any part of Kaifeng City. In contrast to the above results, the new town, Bianxi area (mean living convenience is 153.3), has lower living convenience than any part of the city, and is merely 18% of that of the old town area. In addition, the standard deviation of living convenience in the Bianxi area is also the lowest in all areas. Therefore, the living convenience in the Bianxi area is low, with less variation. There are two main causes of the unusually low living convenience in the Bianxi area. Firstly, the Bianxi area, as a newly built area, is highly affected by urban planning restrictions on functional division and large street blocks, which have a negative impact on living convenience. Secondly, a high degree of living convenience as the result of a place-shaping continuum is usually time-costing [49]. Compared with the Songcheng area, and particularly the old town that has had a considerably longer development period, the time left to trigger high convenience in the Bianxi area is shorter.
Secondly, it helps to support urban planning decisions on promoting living convenience and sustainable urbanism scientifically. This new approach has been applied in comparing two bus station arrangement strategies (stationing strategies 1 and 2) as an illustration. The first strategy (Figure 11a) aims to supplement an aspect of living convenience by adding bus stations in low-living-convenience-value areas. The second strategy (Figure 11b) focuses on strengthening the connection between the new and old towns, i.e., the Bianxi area and the Gucheng area, by adding bus stops along the main streets. It was previously difficult to compare the intangible effects of these types of strategies. Nevertheless, the new analytical approach proposed in this study provides the potential to measure their effects directly.
As shown in Figure 12, under the two stationing strategies, the average living convenience was increased, and the standard deviation was reduced. Both stationing strategies positively affect the process of improving the convenience of urban life, and they reduce the uneven distribution to a certain extent. Both strategies could increase the willingness of people to go out through walking or public transportation, which is beneficial for sustainable development.
Specifically, the average value of living convenience in Kaifeng City increased by 7.9 under stationing strategy 1 (Figure 12a,b and Table 3). According to the statistics of the second stationing strategy, the mean value of the living convenience increased by 6.9, which was lower than the increase due to strategy 1. Therefore, stationing strategy 1 obtained a higher efficiency in promoting living convenience than strategy 2, which provides an important reference for urban planners.

5. Discussion

5.1. Measuring the Unmeasurable: A Quantitative and Objective Measurement of Intangible Living Convenience

A key highlight of this paper is the development of an analytical approach for measuring intangible living convenience, which was previously regarded as unmeasurable. As a perceptual quality of life, living convenience has been regarded as an important issue for community planning, urban micro-renewal, and sustainable urbanism in recent years. Due to the limitations of analytical techniques and available data, it was difficult to achieve a quantitative and efficient measurement of this human-scale perception. To solve the difficulties mentioned above, an efficient analytical approach for measuring the convenience of life is proposed in the current study based on emerging multi-source urban data and geodesign.
This new approach exhibits the advantages of objectivity compared with traditional subjective approaches relying on a questionnaire survey and expert scoring. Firstly, based on the analysis of classical urbanism theories, this approach translates the intangible perception of living convenience into measurable variables, i.e., accessed number and diversity of urban facilities. Secondly, this approach creates a human-scale perspective focusing on daily life scenarios with the consideration of walking distance and facility proximity. Such an approach suits the daily experiences of residents. Thirdly, our analysis framework benefits from the popularity and easy access of urban data, thereby displaying a good universality for other cities and regions. In other words, it has the potential to be applied within different contexts, but still obtains high accuracy and efficiency.

5.2. The Co-Presence of Large-Scale Analyses with Human-Scale Measurements

The co-presence of large-scale investigation and human-scale analysis is another highlight of this study. Urban-scale investigations [27,28,29,30,31,32,36,37] rarely consider analysis results at the human scale. The minimum analytical units applied in previous studies have been neighborhoods or street blocks [36,37], due to prohibitive workload and time cost. Conventional human-scale analysis, relying on a questionnaire survey [38], is time- and labor-intensive, and can thus only be carried out at small scales. Applying such an approach at the urban scale is challenging and extremely time-consuming. This dilemma has brought about considerable limitations for the practice of community planning and urban micro-renewal, which must carry out analysis at district or city scales whilst considering the human scale.
The new approach proposed in this study is capable of providing high-precision results for city-scale analyses and displaying the macro picture without losing details, thus allowing the excavation of certain details that were difficult to previously explore.

5.3. Assisting More Scientific Decision Support in Urban Planning for Promoting Living Convenience

Promotion of the 15 min community–life circle and micro-scale urban renewal faces complex situations and various requirements. Therefore, in the past, related planning strategies and decisions usually relied on professionals’ experiences. With the emergence of new urban data, including PoIs, street networks, and buildings, as well as geodesign thinking, this analytical approach expands the potential for providing greater scientific decision support in three ways. First, it is capable of evaluating current living convenience and identifying problematic areas in a visualized approach. Second, the high or low values of living convenience components, i.e., the relative number of facilities, their diversity, and the accessibility of transportation facilities, help to identify the efficient intervention directions for promoting living convenience. For instance, improving different kinds of urban facilities would be the most efficient intervention if a low value of diversity causes low living convenience. Third, the quantitative and fast computing of living convenience creates the potential to simulate the effects of different urban strategies and then enable greater scientific decision support.
In short, new and emerging urban data and geodesign techniques have generated new quantitative possibilities to address human-scale qualities. An increasing scholarly interest is evident to introduce a new quantitative approach from the previously qualitative and intuition-based fields. This study represents an attempt to combine science and urban planning practices, particularly in the improvement of living convenience.

5.4. Limitations and Future Steps

The measurement approach for living convenience presented in this study remains at the beginning stage. Fine-tuning and improvements are still needed. First of all, the relative impacts of different urban facilities in the specific calculation should be further explored. Current relative impacts used herein follow the methodology proposed in Walkscore, which might not match with the Chinese context. Stated-preference surveys with the support of multi-source spatiotemporal data could be applied to compute the relative impacts to promote higher accuracy. In addition, the spatial accessibility in the current analytical framework is mainly based on physical distance. The potential impacts of the spatial configuration of the street network have not been included yet. Adding the space syntax’s geometric distance based on angular changes might help to yield a more human-oriented measure of living convenience. In addition, the potential impact of the design characteristics of the streetscape and public squares was not considered in the current analysis. High design quality would urge the public to visit a place and to express a specific behavior. Including these kinds of characteristics is an aim for our future explorations. Moreover, result verification in the current work revealed several differences between the calculation results and experts’ judgments in several areas. A large-scale public survey could be conducted to collect local residents’ preferences, and the survey results could be combined with our analytical approach.

6. Conclusions

This study is an attempt to develop a systematic measure of living convenience. Based on the conceptual framework of living convenience generated from classical urbanism theories, our study sets the groundwork for future research to measure the ‘unmeasurable’ concept of living convenience using multi-source urban data and a geodesign approach. This would be fundamental to urbanism professionals for promoting a 15 min community–life circle and livable cities. This analytical approach can be used in many phases of urban planning and management. On the one hand, it helps to answer the questions of ‘where’ and ‘how’ in promoting a higher degree of living convenience. On the other, it is also able to answer the ‘what-if’ question by providing simulations of the effects of planning strategies.
Moreover, this methodology, including data processing protocols, measures, and modeling, provides a benchmark for studies of living convenience. As a simple, accurate, and universal method, it has the potential to be applied in different contexts. Considering the availability of urban data, it is possible to utilize this method not only for Chinese cities, but also for cities in many other countries.
In addition, the quantified results achieved in this study help to study the association between living convenience and related social–economic performance, e.g., physical activity, housing prices, and healthy behaviors. The behavioral, economical, and healthy impacts of living convenience can now be analyzed with further insights. Findings in this direction would help to explore the underestimated effects of living convenience from many perspectives. The findings will finally make living convenience an important issue in urban policy-making and contribute to a healthier and more sustainable urbanism.

Author Contributions

Conceptualization, Y.Y.; methodology, T.Z. and G.L.; software, T.Z. and X.Z.; validation, H.T. and X.Z.; formal analysis, T.Z., G.L., and X.Z.; investigation, H.T.; resources, H.T.; data curation, X.Z.; writing—original draft preparation, T.Z., G.L., and X.Z.; writing—review and editing, Y.Y.; visualization, X.Z.; supervision, T.Z., G.L., and Y.Y.; project administration, T.Z., Y.Y., and G.L.; funding acquisition, Y.Y. and T.Z. All authors have read and agreed to the published version of the manuscript.

Funding

This research was funded by the National Key R&D Program of China, grant number 2017YFB0503500, the Open Projects Fund of Key Laboratory of Ecology and Energy-Saving Study of Dense Habitat (Tongji University), Ministry of Education, grant number 2019020102, and the National Natural Science Foundation of China, grant numbers 51708410 and 41930648.

Acknowledgments

We want to thank the editor and the two anonymous referees for their kind help. We also thank Rong Huang and Yinhui Chen for their assistance in data preparation.

Conflicts of Interest

The authors declare no conflict of interest.

References

  1. Long, Y.; Ye, Y. Measuring human-scale urban form and its performance. Landsc. Urban Plan. 2019, 191, 103612. [Google Scholar] [CrossRef]
  2. Myers, W. Building Knowledge about Quality of Life for Urban Planning. J. Am. Plan. Assoc. 1988, 54, 347–358. [Google Scholar] [CrossRef]
  3. Tian, Y.; Kong, X.; Liu, Y. Combining weighted daily life circles and land suitability for rural settlement reconstruction. Habitat Int. 2018, 76, 1–9. [Google Scholar] [CrossRef]
  4. Carmona, M.; Heath, T.; Tiesdell, S.; Oc, T. Public Places, Urban Spaces: The Dimensions of Urban Design; Routledge: London, UK, 2003. [Google Scholar]
  5. Ye, Y.; van Nes, A. Quantitative tools in urban morphology: Combining space syntax, spacematrix and mixed-use index in a GIS framework. Urban Morphol. 2014, 18, 97–118. [Google Scholar]
  6. Ye, Y.; Yeh, A.; Zhuang, Y.; Van Nes, A.; Liu, J. “Form Syntax” as a contribution to geodesign: A morphological tool for urbanity-making in urban design. Urban Des. Int. 2017, 22, 73–90. [Google Scholar] [CrossRef]
  7. Carmona, M. Sustainable Urban Design: Definitions and Delivery. Int. J. Sustain. Dev. 2009, 12, 48–77. [Google Scholar] [CrossRef]
  8. Jacobs, A.; Appleyard, D. Toward an Urban Design Manifesto. J. Am. Plan. Assoc. 1987, 53, 112–120. [Google Scholar] [CrossRef] [Green Version]
  9. Pacione, M. Urban environmental quality and human wellbeing—A social geographical perspective. Landsc. Urban Plan. 2003, 65, 19–30. [Google Scholar] [CrossRef]
  10. Zhang, M. Intercity Variations in the Relationship between Urban form and Automobile Dependence. Transp. Res. Rec. J. Transp. Res. Board 2005, 1902, 55–62. [Google Scholar] [CrossRef]
  11. Algers, S.; Eliasson, J.; Mattsson, L.-G. Is it time to use activity-based urban transport models? A discussion of planning needs and modelling possibilities. Ann. Reg. Sci. 2005, 39, 767–789. [Google Scholar] [CrossRef]
  12. Kyriakidis, C.; Bakogiannis, E. How the physical characteristics may affect the social life of streets in Athens, Greece? Eur. J. Soc. Sci. Educ. Res. 2018, 5, 15–23. [Google Scholar] [CrossRef]
  13. Handy, S.L.; Clifton, K. Local shopping as a strategy for reducing automobile travel. Transportation 2001, 28, 317–346. [Google Scholar] [CrossRef]
  14. King, W.C.; Brach, J.S.; Belle, S.; Killingsworth, R.; Fenton, M.; Kriska, A. The relationship between convenience of destinations and walking levels in older women. Am. J. Health Promot. 2003, 18, 74–82. [Google Scholar] [CrossRef] [PubMed]
  15. Appleyard, D. Livable Streets: Protected Neighborhoods? Ann. Am. Acad. Polit. Soc. Sci. 1980, 451, 106–117. [Google Scholar] [CrossRef]
  16. Ye, Y.; Li, N.; Liu, X. How block density and typology affect urban vitality: An exploratory analysis in Shenzhen, China. Urban Geogr. 2017, 39, 631–652. [Google Scholar] [CrossRef]
  17. Ye, Y.; Richards, D.; Lu, Y.; Song, X.P.; Zhuang, Y.; Zeng, W.; Zhong, T. Measuring daily accessed street greenery: A human-scale approach for informing better urban planning practices. Landsc. Urban Plan. 2019, 191, 103434. [Google Scholar] [CrossRef]
  18. Ye, Y.; Zeng, W.; Shen, Q.; Zhang, X.; Lu, Y. The visual quality of streets: A human-centred continuous measurement based on machine learning algorithms and street view images. Environ. Plan. B Urban Anal. City Sci. 2019, 46, 1439–1457. [Google Scholar] [CrossRef]
  19. Ewing, R.; Handy, S. Measuring the Unmeasurable: Urban Design Qualities Related to Walkability. J. Urban Des. 2009, 14, 65–84. [Google Scholar] [CrossRef]
  20. Satterthwaite, D. A new urban agenda? Environ. Urban. 2016, 28, 3–12. [Google Scholar] [CrossRef] [Green Version]
  21. Hewko, J.; Smoyer-Tomic, K.E.; Hodgson, M.J. Measuring Neighbourhood Spatial Accessibility to Urban Amenities: Does Aggregation Error Matter? Environ. Plan. A Econ. Space 2002, 34, 1185–1206. [Google Scholar] [CrossRef]
  22. Galster, G. On the Nature of Neighbourhood. Urban Stud. 2001, 38, 2111–2124. [Google Scholar] [CrossRef]
  23. Batty, M. The New Science of Cities; MIT Press: Cambridge, MA, USA, 2013. [Google Scholar]
  24. Flaxman, M. Geodesign: Fundamental Principles and Routes Forward; GeoDesign Summit ESRI: Redlands, CA, USA, 2010. [Google Scholar]
  25. Steinitz, C. A Framework for Geodesign: Changing Geography by Design; Esri Press: New York, NY, USA, 2012. [Google Scholar]
  26. Batty, M. Defining Geodesign (= GIS + Design?). Environ. Plan. B Plan. Des. 2013, 40, 1–2. [Google Scholar] [CrossRef]
  27. Cervero, R. Jobs-Housing Balancing and Regional Mobility. J. Am. Plan. Assoc. 1989, 55, 136–150. [Google Scholar] [CrossRef]
  28. Cervero, R. Jobs-Housing Balance Revisited: Trends and Impacts in the San Francisco Bay Area. J. Am. Plan. Assoc. 1996, 62, 492–511. [Google Scholar] [CrossRef]
  29. Zhao, P.; Lu, B.; De Roo, G. Impact of the jobs-housing balance on urban commuting in Beijing in the transformation era. J. Transp. Geogr. 2011, 19, 59–69. [Google Scholar] [CrossRef]
  30. Benner, C.; Karner, A. Low-wage jobs-housing fit: Identifying locations of affordable housing shortages. Urban Geogr. 2016, 37, 1–21. [Google Scholar] [CrossRef] [Green Version]
  31. Leyden, K.M. Social Capital and the Built Environment: The Importance of Walkable Neighborhoods. Am. J. Public Heal. 2003, 93, 1546–1551. [Google Scholar] [CrossRef]
  32. Song, Z.; Chen, W.; Zhang, G.; Zhang, L. Spatial accessibility to public service facilities and its measurement approaches. Prog. Geogr. (Chin.) 2010, 29, 1217–1224. [Google Scholar] [CrossRef]
  33. Hillier, B. Space is the Machine: A Configurational Theory of Architecture; Cambridge University Press: Cambridge, UK, 1996. [Google Scholar]
  34. Hillier, B. Studying cities to learn about minds: Some possible implications of space syntax for spatial cognition. Environ. Plan. B Plan. Des. 2012, 39, 12–32. [Google Scholar] [CrossRef]
  35. Li, X.; Lv, Z.; Zheng, Z.; Zhong, C.; Hijazi, I.H.; Cheng, S. Assessment of lively street network based on geographic information system and space syntax. Multimedia Tools Appl. 2015, 76, 17801–17819. [Google Scholar] [CrossRef]
  36. Zhang, X.; Du, S.; Zhang, J. How do people understand convenience-of-living in cities? A multiscale geographic investigation in Beijing. ISPRS J. Photogramm. Remote. Sens. 2019, 148, 87–102. [Google Scholar] [CrossRef]
  37. Bonaiuto, M.; Fornara, F.; Bonnes, M. Perceived residential environment quality in middle- and low-extension italian cities. Eur. Rev. Appl. Psychol. 2006, 56, 23–34. [Google Scholar] [CrossRef]
  38. Huang, C.; Zhan, B.; Lu, J.; Deng, F. The governance of sealing up “holes in the wall”: A multi-perspective study on historical town of Beijing. Beijing Planning Rev. (Chin.) 2018, 3, 13–19. [Google Scholar]
  39. Ewing, R.; Cervero, R. Travel and the Built Environment. J. Am. Plan. Assoc. 2010, 76, 265–294. [Google Scholar] [CrossRef]
  40. Marcus, L. Spatial capital. J. Space Syntax 2010, 1, 30–40. [Google Scholar]
  41. Zhang, L.; Ye, Y.; Zeng, W.; Chiaradia, A.J.F. A Systematic Measurement of Street Quality through Multi-Sourced Urban Data: A Human-Oriented Analysis. Int. J. Environ. Res. Public Health 2019, 16, 1782. [Google Scholar] [CrossRef] [PubMed] [Green Version]
  42. May, R.M. Patterns of species abundance and diversity. In Ecology and Evolution of Communities; Cody, M., Diamond, J., Eds.; Harvard University Press: Cambridge, MA, USA, 1975. [Google Scholar]
  43. Shannon, C.E. A mathematical theory of communication. Bell Syst. Tech. J. 1948, 27, 379–423. [Google Scholar] [CrossRef] [Green Version]
  44. Simpson, E.H. Measurement of Diversity. Nature 1949, 163, 688. [Google Scholar] [CrossRef]
  45. Van Eggermond, M.; Erath, A. Quantifying Diversity: An Assessment of diversity indices and an application to Singapore. FCL Mag. Spec. Issue Urban Breed. Grounds 2016, 4, 30–37. [Google Scholar] [CrossRef]
  46. Ye, Y.; Xie, H.; Fang, J.; Jiang, H.; Wang, D. Daily Accessed Street Greenery and Housing Price: Measuring Economic Performance of Human-Scale Streetscapes via New Urban Data. Sustainability 2019, 11, 1741. [Google Scholar] [CrossRef] [Green Version]
  47. Walk Score, Walk Score Methodology. Available online: https://www.walkscore.com/methodology.shtml (accessed on 27 March 2020).
  48. Zheng, Y. ACM Transactions on Intelligent Systems and Technology (TIST). ACM Trans. Intell. Syst. Technol. 2015, 7, 1–55. [Google Scholar] [CrossRef]
  49. Carmona, M. The Place-shaping Continuum: A Theory of Urban Design Process. J. Urban Des. 2013, 19, 2–36. [Google Scholar] [CrossRef]
Figure 1. Conceptual framework for measuring living convenience.
Sustainability 12 04712 g001
Figure 2. Study area: (a) The location of Kaifeng City within China, (b) the location of the study area within Kaifeng, and (c) the illustration of the study area.
Sustainability 12 04712 g002
Figure 3. An illustration of building unit examples.
Sustainability 12 04712 g003
Figure 4. Analytical framework of living convenience measurement at the building unit scale.
Sustainability 12 04712 g004
Figure 5. The composition of points of interest (PoIs) and their four main categories in the study area.
Sustainability 12 04712 g005
Figure 6. Illustration of key measurements of living convenience based on building unit: (a) The PoIs in the daily accessible area of the target building point; (b) the relative number of urban facilities in the daily accessible area after distance decay; (c) diversity of urban facilities in the daily accessible area; (d) the transportation facilities’ accessibility of the target building point; and (e) the formula of computing living convenience of the target building point.
Sustainability 12 04712 g006
Figure 7. Value attenuation with distance in the road network and traffic point.
Sustainability 12 04712 g007
Figure 8. Living convenience of Songcheng area in Kaifeng City.
Sustainability 12 04712 g008
Figure 9. Perceived living convenience in Kaifeng City: (a) the illustration of individual perceive space with high living convenience, (b) the collective perceive space with high living convenience based on the survey from a series of local experts; (c) the final result achieved through overlay analysis.
Sustainability 12 04712 g009
Figure 10. Living convenience boxplot in different areas and the entire Kaifeng City.
Sustainability 12 04712 g010
Figure 11. Stationing strategy: (a) Stationing strategy 1 and its difference with stationing strategy 2; (b) stationing strategy 2 and its difference with stationing strategy 1.
Sustainability 12 04712 g011
Figure 12. Living convenience of two stationing strategies in different areas and the entire city: (a) Boxplot of stationing strategy 1; (b) boxplot of stationing strategy 2.
Sustainability 12 04712 g012
Table 1. Representative studies about measuring living convenience at different spatial scales.
Spatial ScaleRepresentative Studies
Macro-scaleCervero, 1989 [27]; Cervero, 1996 [28]; Zhao et al., 2011 [29]; Benner and Karner, 2016 [30];
Meso-scaleLeyden, 2003 [31]; Song et al., 2010 [32]; Hillier, 1996 [33]; Hillier, 2012 [34]; Li et al., 2017 [35];
Micro-scaleZhang et al., 2019 [36]; Bonaiuto et al., 2006 [37]; Huang et al., 2018 [38]
Table 2. Living convenience in different areas and the whole city.
Name25%50%75%MeanMaxStd
Bianxi28.463.0159.1153.31157.0211.8
Songcheng444.9709.81021.1752.82583.8410.9
Old town510.0744.71126.6835.02583.8443.1
Kaifeng106.3475.4854.8541.02583.8459.1
Table 3. Statistical description of living convenience of two stationing strategies.
Name25%50%75%MeanStdStrategyName25%50%75%MeanStd
Bianxi20.744.878.66360.3NoneBianxi20.341.973.262.166.6
Kaifeng316.7574.7828606.7394.3Kaifeng354.4610.6871.1640.2400.5
Old town452.7692.61008751.7403.6Old town448.77061040761.7413.7
Songcheng421.9642.4887.3683.1371.5Songcheng443.6668.4924.9710.5374.8
Bianxi24.647.885.966.760.312Bianxi26.843.879.166.766.7
Kaifeng323.4592830.8614.6391.8Kaifeng362628.3872.7647.1398.3
Old town480.56931009759399.5Old town478.6707.51042769.4409.3
Songcheng446652.8888.8691.3367.6Songcheng463.4675.4926.2717.7371.5

