Practical Head-Outflow Relationship Definition Methodology That Accounts for Varied Water-Supply Methods


1
School of Civil, Environmental and Architectural Engineering, Korea University, Seoul 02841, Korea
2
Department of Civil Environmental Engineering, The University of Suwon, Gyeonggi-do 18323, Korea
*
Author to whom correspondence should be addressed.
Sustainability 2020, 12(11), 4755; https://doi.org/10.3390/su12114755
Submission received: 18 May 2020
/
Revised: 4 June 2020
/
Accepted: 8 June 2020
/
Published: 10 June 2020
(This article belongs to the Special Issue Safety in the Operation of Water Supply Systems)
Abstract
:Achieving reliable pressure-driven analysis (PDA) results that account for anomalies within water-pipe networks requires a head-outflow relationship (HOR) model that can calculate supply flow rate according to the supply pressure at each node. Many studies have suggested HOR models, but a methodology to define HORs that considers the actual residential environment of users and differing water-supply methods for residential buildings has not yet been proposed. This study considered water-use data from buildings and actual differences in residential environments in a surveyed area (including building heights, topography, and water systems within buildings) and water-supply methods (indirect/direct water supply, existence of a pump within buildings) to develop a methodology and derive a representative HOR for the target area for PDA. Further, a representative HOR was determined for each block by applying the developed methodology for two blocks with similar residential environments but different water-use patterns. It confirmed that the HOR induced through this process could provide high water-supply performance despite a low supply head and needed to reflect the diversity of the water-supply method. The proposed HOR-definition methodology can be easily applied in water-pipe network design and operation processes and ensure objectivity and rationality of HOR selection to yield reliable PDA results.
1. Introduction
Water-pipe networks are an essential component of social infrastructure, and their design and operation must be carefully calibrated to supply users with the desired amount of clean water at the necessary locations. With the recent development of society, water usage has increased significantly compared to the past, and service satisfaction levels have also increased. Therefore, the efficient design and optimized management of water supply systems are becoming increasingly important.
Accurate hydraulic analysis of water-supply networks is essential in optimizing their design and management. Such analysis methods are classified as demand-driven analyses (DDAs) and pressure-driven analyses (PDAs). Among these, PDA methods have the advantage of simulating actual flow rates within water-pipe networks, as they calculate the supply flow rate based on the pressure conditions at a given node, unlike DDA methods in which the flow rate at each node is considered fixed. In particular, PDA methods are essential for simulating abnormal situations within pipe networks, such as limited flow supply and pressure (head) decline phenomena.
To perform PDA, the head-outflow relationship (HOR) must first be determined, as it enables the supply flow rate to be calculated based on characteristic node heads. Since the selected HOR greatly impacts PDA results, it is important for the HOR to optimally reflect the characteristics of each node. Thus, many studies and experiments have attempted to define representative HORs for water-pipe networks; their proposed methodologies can broadly be divided into conceptual, experimental, and hydraulic approaches.
First, the conceptual HOR definition method selects a pressure that can meet the flow rate required by the consumer and divides it into three states: supply available, incomplete supply, and supply unavailable; it then suggests a supply flow rate relative to the pressure at each node in water-pipe networks through various HORs [1,2,3,4,5,6,7,8,9,10,11]. Recently, Giustolisi and Walski [11] defined the HOR according to supply conditions, considering that the supply characteristics of water at a given pressure differ depending on the equipment to which the water is supplied; however, it remains unfeasible to define a representative HOR that considers all the characteristics of each device to conduct PDA, so an effective approach to determine a representative HOR is still necessary.
Second, experimental HOR definition studies have evaluated the applicability of conceptual HORs using measurement data to support the generalization of pressure and flow measurement equipment or in the context of parameter correction [12,13,14]. For example, Chang et al. [14] adopted a block as one node and evaluated the relationship between the pressure in pipes and the flow rate of the discharge device in a simplified water-pipe network. This allowed the conceptually determined HOR parameters to be corrected based on experimental results, but it still did not reflect the diversity of the water-supply methods employed by users in the block, i.e., the actual water-use pattern.
Third, studies employing a hydraulic approach to the HOR definition considered the residential environment of users in terms of the secondary water-pipe network [15,16]. A secondary water-pipe network is a collection of small water pipes in the block where the consumer resides. In a representative study, Ciaponi et al. [16] concluded that the nodes (secondary water-pipe networks) in the block were best described by different HORs due to their differing topographic characteristics (mountainous/flat) and residential environments (building heights). Further, they developed a methodology that could define the representative HORs by reflecting topographic factors of each building and hydraulic conditions that may arise during the water supply process. These were determined from water-usage patterns that reflected the geographic conditions of the node and building sizes that were similar to those of the actual water-pipe network. However, the assumption that the supply flow rate at all nodes can be determined based on the pressure associated with a single water-supply method does not reflect what occurs in reality. In general, for high-rise buildings with five or more floors, water is supplied indirectly to all floors via a pump installed in an underground water tank; therefore, it is more important that the pressure (head) value that can supply water to the water tank itself is satisfied than the pressure that can deliver water throughout the building. On the other hand, low-rise buildings with four floors or less adopt a direct water-supply method that relies on the pressure within the pipes themselves; thus, the required pressure from the supply source is directly affected by the pressure conditions of the secondary water-pipe network, which is based on the building height.
In this study, a methodology to define the representative HOR of a supply region that reflected differences within the residential environments of the secondary water-supply networks and the water-supply method of each building was developed to reliably and efficiently calculate the supply flow rate of each demand node in the water-supply network. The proposed model was developed by considering two relatively similar residential blocks: one that featured a high concentration of low-rise buildings and one that featured a high concentration of high-rise buildings. Thus, a representative HOR for each block was derived, and differences between the HORs could be analyzed.
While many studies have proposed HORs, the process of selecting a HOR representative of the demand–supply characteristics of nodes in a block in the context of PDA remained highly subjective. However, this study suggests a methodology to derive a representative HOR that considers the water supply methods and water-usage data of each building based on the actual residential environment in a surveyed area, thus improving not only the reliability of the PDA results but also standardizing and refining the HOR definition process.
2. A Review of Methods for Defining HORs
2.1. Theoretical Considerations of HORs
Various models have been developed to conduct PDA; those employing HORs differ depending on which HOR is chosen to model the supply flow rate at each node. HORs can broadly reflect three scenarios. The first is when the available head at node j is less than the minimum head necessary to supply water at the node. At this time, the supply flow rate at the node is determined to be 0. The second is when the available head is less than the required head that can meet the desired supply rate at the node. Thus, it is determined that the supply flow rate of the node only partially satisfies the required water supply. The third scenario is when the head at node j is greater than . Then, it is determined that the supply flow rate at the node fully satisfies the required supply rate .
Table 1 summarizes the HORs suggested in previous studies according to the head condition of the nodes. When defining a HOR for use in PDA, the most important consideration is that it reasonably reflects the supply flow rate according to the head conditions in the actual residential environments of consumers.
2.2. Definition of Building–Node HOR Based on Water-Supply Method
Differences in water-supply methods based on a user’s residential environment significantly impact HOR selection. Typically, high-rise buildings have water tanks and supply water to consumers on each floor via a high-pressure pump; thus, such consumers are not significantly affected by the pressure conditions present in the secondary water-pipe network. However, for detached houses and low-rise buildings, the supply flow rate is determined by the pressure of the secondary water-pipe network, and therefore, it is directly affected by the pressure of the secondary water-pipe network.
2.2.1. Definition of High-Rise Building HOR
In most high-rise buildings, the water tank is installed in the basement level of the building and receives water from a water-supply network via a valve that can be switched on or off to maintain a specific water level. If the head of the water pipe connected to the building is more than the critical head needed to supply water to the building water tank, the water tank can be filled to capacity in a short time. Conversely, if the pressure is insufficient compared to the critical head, it takes a relatively long time for the tank to fill to capacity. Giustolisi and Walski [11] classified nodes according to volume-based demand conditions (e.g., the filling of water tanks), and considered that demand was met as in orifice-type models, in which the supply flow rate varies depending on the pressure. If the head conditions of the secondary water-pipe network are greater than the minimum head of the water-tank inlet pipe, water can be supplied to the tank. Although the of each water tank differs by building, the can be adequately determined based on the head loss that occurs at the minimum head of the water-tank inlet pipe in the pipe connecting the tank to the secondary water-pipe network.
Korea's Water Supply Facility Standard [17] suggests that the determination of the minimum hydrodynamic pressure of the water-supply network and the direct water-supply target range account for the distribution of buildings and regional characteristics. In this study, a direct water-supply method was considered possible for buildings with four floors or less, and buildings with five floors or higher were classified as high-rise buildings that relied on indirect water-supply methods. Through interviews with design and construction personnel associated with a high-rise multi-family apartment building, it was confirmed that the diameter of the connecting pipe between the exterior water-pipe network and the building water tank was 80–150 mm and that the water tank experienced no issues with flow rate supply when the minimum pressure at the water-tank inlet was over 1 kgf/cm2 (head: 10 m). Thus, in this study, the HOR of a water tank in a high-rise building with volume-based demand conditions was defined as in Equations (1) to (3).
where
- is the available pressure head at the delivery pipe (m),
- is the flow actually delivered to the storage tank (L/s),
- is the required flow to the storage tank (L/s),
- is the pressure head required to meet the required demand (m), and
- is the minimum pressure head below which the flow delivered to the storage tank is 0 (m).
In case of high-rise building, water tanks are installed to ensure constant water supply to consumers at each floor. Such installation not only prevents damages to the water pipe under excessive pressure condition at the lower floors, but it also maintains the water pressure and constant water supply beyond the tanks even when the external pressure of the water pipe fluctuates [17]. Therefore, consumers on each floor of a high-rise building are supplied with the required flow rate via an inverter pump installed in the outlet pipe of the water tank. Figure 1 is one of the water supply methods to operate the water storage tank, and illustrates the method of supplying water directly from the water storage tank through an inverter pump. The inverter pump operates when the pressure of the water supply pipe is slightly different from the constant operation pressure due to water usage by a consumer in the building. It operates at a high pressure, allowing water to be supplied with sufficient pressure even to users on the highest floor, and a pressure reducing valve is installed in the household inlet pipe to maintain an inlet pressure of 2–3 kgf/cm2 (20–30 m) according to a minimum pressure of water supply pipe [17]. Therefore, for high-rise buildings, if the flow rate into the water tank is sufficient, the demand for each floor can be satisfied through the pump operation. Since the external pressure of the water supply system does not change the supply flow rate for each floor, setting users on each floor as individual nodes and defining the HOR based on such nodes is not an advisable approach for PDA. In other words, in a secondary water-pipe network containing various residential conditions, a hydraulics analysis method that reflects the actual water-supply method will consider the water tank in the high-rise building as single node and define the HOR accordingly. The base assumptions held in defining the HOR for high-rise building nodes are as follows.
- The head loss that arises from the secondary water-supply network supply system is ignored.
- The base demand for each floor can always be met through the operation of the inverter pump installed on the outlet of the water tank.
- The head loss that occurs in the connecting pipe between the water-supply node and the building water tank is the sum of the pipe friction loss of the connecting pipe and the loss due to the installed valve. is determined based on the pipe type and diameter, number of valves, and presence of vertical piping; in this study, a value between 3–10 m was utilized. Therefore, the critical head of the water tank can be expressed as .
Once the HOR for a high-rise building is determined, it is possible to calculate the supply flow rate of nodes according to the supply head of the secondary water-pipe network according to the physical properties (, ) of each building. The flow rate ratio of each building is defined as vector X as shown in Equation (4).
2.2.2. Definition of Low-Rise Building HOR
End users in low-rise buildings with four floors or less that do not operate water tanks are directly affected by the pressure of the secondary water-supply network. For low-rise buildings, the head required to satisfy the base demand for each floor is determined based on the sum of the potential head, head loss, and pressure head. The required head is relatively larger for higher floors in low-rise buildings. If each household on each floor is recognized as an individual node, these nodes can be treated as orifices in which the supply flow rate of each node's HOR varies according to the available pressure [16]. Thus, HOR for each node based on hydraulic conditions can be defined by Equations (5)–(7) proposed by Wagner et al. [2].
where is the available pressure head at the building (m), is the flow actually delivered to the node (L/s), is the flow required at the node (L/s), is the pressure head required to meet the required demand (m), and is the minimum pressure head below which the flow delivered to users on the ith floor is 0 (m).
Ciaponi et al. [16] distinguished each floor in the building as an individual node and determined the required head for each node as in the conceptual diagram shown in Figure 2. The required head of each node rationally reflected the physical properties (, ) of the water supply system from the external water-pipe network to the faucets of households on each floor of the building, and the supply flow rate of each node was calculated according to the suppliable head of the secondary water-pipe network through the HOR. This approach reflects the building’s actual characteristics and topographical environment rather than relying on assumptions. When all available flow rates for each floor are summed, it is possible to calculate the supply flow rate of the entire building as in Equation (8). The base assumptions, such as the topography conditions where the low-rise building is located, the base demand for each floor, the internal conditions of the building, and the head loss in the process of water supply, are as follows.
- The supply head of the building is directly affected by the secondary water-pipenetwork without any additional power from the building.
- The height of the story is constant at 3 m.
- The base demand for each floor is the same as the total base demand of the entire building divided by the number of floors ().
- The pressure head required at each floor node (faucet) is constant at 5 m, and the faucet is assumed to be located 1 m above the household floor.
- The head loss that occurs in the building pipe includes loss due to vertical pipe friction and valve operation. The is different for each building and floor but is judged to have a relatively minor impact on HOR definition and is thus set within a reasonable range (3–10 m).
- Head loss that occurs in the secondary water-pipe network is ignored.
- The required head of each floor node is equal to the sum of the floor height (), the head loss () occurring in the pipe, a 5 m pressure head, and a 1 m potential head at the faucet ().
3. Methodology for Representative HOR Development
3.1. Representative HOR Definition Procedure Development
Various residential environments exist within blocks where the water supply is directly generated by secondary water-pipe networks. From detached houses to high-rise buildings with various numbers of floors, each building type is associated with different requirements to meet end-user demands. The difference between the actual and the base demand due to building water-supply methods is an essential factor that must be considered in the HOR definition process. In addition, depending on the area in which a block is located, the difference between the water-supply node and the elevation of each building's ground floor can vary considerably. In this study, a virtual secondary water network model was constructed to develop a representative HOR definition methodology. The virtual secondary water-pipe network was composed of buildings with various numbers of floors, and the base demand for each building was determined not only according to the number of floors based on actual data but also in consideration of the topographical characteristics that impacted the physical structure of the building. The characteristics of high-rise and low-rise buildings on the block were classified and are shown in Table 2 below.
Buildings in the virtual secondary water network can be classified according to their type. The classification factors, or vectors, include the number of floors, ground height, head loss, and base demand, and various buildings in the virtual secondary water network were simulated through a combination of each of the vectors. Vectors F, Z, L, and D are described in sections a–d below.
(a) Vector F: number of building floors
For the number of floors in a virtual building (), the fifth floor is set as the highest possible floor () to reflect differences in the water-supply method, and the number of floors in each building was determined by random numbers between 1 to 5 floors. Buildings with 1 to 4 floors use the direct water-supply method and five-floor buildings use the indirect water-supply method. The random numbers were determined based on the uniform distribution method:
(b) Vector Z: ground height
The elevation difference () between the location of the buried water-supply node and the ground floor of each building varies depending on the topography in which the building is located. For buildings located in mountainous areas, the range of will be large, and for those located on flat land, the range of will be relatively small. In this study, the range of Zg was determined based on the topographical characteristics of the area where a building was located, and random numbers were determined via the uniform distribution method below:
For high-rise buildings, the difference in elevation between the location of the buried water-supply node and the location of the water-tank inlet differed from the condition of low-rise buildings. Most of the water tanks surveyed were installed on the lowest basement floor of the building. Therefore, in this study, it was decided that even though the values of low- rise buildings and of high-rise buildings differ in reality, these differences were not meaningful and thus, was reflected in same condition with the .
(c) Vector L: head loss
In practice, it is difficult to accurately calculate the head loss arising from water supply systems within buildings. The environment varies from building to building due to factors such as the following: different types of water pipes installed within a building, the number of valves installed, and vertical pipe installation. Therefore, the head loss () in this study was set within 3–10 m for low-rise buildings, and the values of high-rise buildings were set within the same conditions. Random numbers were assigned via the uniform distribution method.
(d) Vector D: base demand by buildings
The virtual buildings simulated in this study could be assigned characteristics according to their type as shown in Equation (12), including the number of floors (), the location of the buried water-supply node, the elevation difference () between the ground floor of each building and the buried water-supply node, and the head loss () of each building as vectors.
In the study of Ciaponi et al. [16], however, the geometric probability distribution method was adopted to allocate the base demand for each building, and 90% of the total base demand was given to the tallest building and the remaining base demand was distributed to the remaining buildings. This reflects the general condition that high-rise buildings use greater amounts of water than low-rise buildings, but this distribution ratio may be overly skewed. Therefore, in this study, we investigated the number of floors and the amount of water used by each actual residential building within two blocks of a surveyed city (Yangpyeong, Korea). As shown in Figure 3, Yangpyeong is a small- to medium-sized city with a population of 100,000 people and has a residential environment characterized by a mixture of high-rise buildings like apartment complexes and low-rise buildings including detached houses and multi-family low-rise buildings. Block A had 552 total buildings and a relatively high proportion of single-story detached buildings. Block B had a total of 143 buildings and a higher proportion of low-rise buildings with 2–4 floors compared to those in Block A. Water usage by each household was summed to calculate the water usage by building, and the ratio of water usage between low- and high-rise buildings was analyzed. For high-rise buildings with five or more floors, the water usage of the building was determined based on water-usage data measured by water-tank meters. Table 3 and Table 4 show the number of buildings (classified according to number of floors) and the ratio of the water usage between low- and high-rise buildings for each block.
Although low-rise buildings with four floors or less represented 97% of the total number of buildings in Block A, the water usage by high-rise buildings with five or more floors accounted for 49% of the total water usage. In Block B, low-rise buildings with four floors or less also account for 97% of the total buildings, but the water usage of high-rise buildings with five or more floors accounted for only 9% of the total water usage. Thus, the approach that distributes 90% of the total base demand of the block to high-rise buildings is not reasonable, and the distribution was found to vary widely between the two surveyed blocks. The most appropriate method would be to directly set the base demand ratio of the buildings based on the number of floors. A uniform distribution method was adopted for the building base demand distribution of buildings simply according to the number of floors, and information on which floor users resided was lacking.
The D1 vector in Equation (13) refers to the ratio of the base demand of buildings classified by the number of floors to the total base demand in the virtual secondary water-pipe network. The sum of the ratios of the base demand of each building type is 1, as shown in Equation (14). Here, refers to the condition of the buildings with different numbers of floors.
Vector D1
Even buildings with the same number of floors may show a difference in base demand based on the elevation difference () between the location of the buried water-supply node and the elevation of the ground floor of the building or of the water-tank inlet (). The D2 vector refers to the difference in the base demand according to topographical conditions and is defined as Equation (15). The base demand of each building considering its topographical context was assigned a random value through the uniform distribution function, and the sum of the total base demand of vector D2 is 1, as shown in Equation (16). Here, k refers to buildings with the same number of floors but with different topographical contexts.
Vector D2
Internal head loss can differ even in buildings with the same number of floors and similar topographical settings. The D3 vector refers to the difference in the base demand according to head loss and is defined as Equation (17). A random number was assigned to account for the base demand of buildings considering the head loss condition through the uniform distribution function, and the sum of the total base demand for vector D3 equals 1 as shown in Equation (18). Here, l refers to the condition in which buildings have the same number of floors and the same topographical contexts but different internal head losses.
Vector D3
Finally, each building can be classified according to the base demand allocated based on the type classification. Vector D refers to the base demand of each building with different physical properties within the block as a whole and can be defined as Equation (19).
3.2. Representative HOR Definition Modeling Method
In Section 3.1., we reviewed the definition of HORs for buildings with different water-supply methods, base demand distribution methods, and building-type classifications. In this section, we will describe a procedure to define the representative HOR of a secondary water-pipe network by calculating the supply flow rate according to the head condition at the nodes of each building based on the following relationship: , which represents the ratio of the supply flow rate to the total base demand of the block when the supply pressure of the block under each scenario. Figure 4 presents a flowchart that describes the modeling process, and the detailed procedure is as follows.
1. Choose a random number within the assumed range of the supply head () in the block for a given scenario (the total number of scenarios and the supply head in the block is determined by the person performing modeling).
2. Determine the total number of buildings on the block, and determine vectors F, Z, and L for each building.
3. If the number of floors on the building is less than four determined by vector F, determine the , which is the head that can meet the base demand of the building for each floor; Hreq reflects the number of floors (), the elevation difference between the location of the buried water-supply node and the ground floor of each building (), the network head loss inside the building (), the minimum required pressure head (5 m), and the faucet location on each floor (1 m), as shown in Equation (20).
On the other hand, if a building contains five floors as determined by vector F, it is classified as a high-rise building and is determined; Hthreshold is the head that can meet the base demand of the building's water tank, which is based on the elevation difference (), between the water-supply node and the water-tank inlet, the 10 m minimum required pressure head of the water tank inlet, and the head loss () that occurs between the connecting pipes, as shown in Equation (21).
The representative required head of the secondary water-pipe network selects the larger value between the required head () calculated based on low-rise buildings and the threshold head () calculated based on high-rise buildings; this term is then unified as the required head ().
4. Calculate vector X of each building by comparing the supply head () of the secondary water-pipe network and the of each node of each building.
5. Determine vectors D1, D2, and D3 for each building type by referring to vectors F, Z, and L.
6. Calculate vector D ( or ) for each building according to its classification using Equation (19), and normalize the base demand such that the sum of the distributed vector D of each building becomes 1. Follow the same approach to calculate and , and unify the term to .
7. Multiply vector X of each building (calculated in step 4) with the base demand vector D (as calculated in step 6) as shown in Equation (22) to find ; determine the of the block by summing the of each building.
8. Calculate according to the of the block as many of the generated suppliable head () for a given scenario and retain the values according to each .
9. Repeat steps 1–8 for each potential scenario and retain the values for each . Graph the saved values according to each to define the representative HOR of the secondary water-pipe network.
4. Results and Discussion
In this study, we developed a methodology to define the representative HOR of a block that considered the diversity of water-supply methods within users’ residential environments and attempted to define the representative HOR for each target block based on the actual base demand data by building floors in surveyed areas. To confirm the effect of the different water-supply methods, Blocks A and B of Yangpyeong, Korea, which have similar building type composition ratios but different low-rise:high-rise water-usage ratios, were selected for the study and the developed representative HOR definition methodology was applied for these blocks.
As survey data were available for the targeted areas, their actual topographical conditions and building properties were reflected in the modeling. For some unmeasured and uncertain factors, assumed values within a reasonable range were applied as described below.
- A standard high-rise building consists of five floors, and water is supplied to consumers in high-rise buildings via the operation of an inverter pump installed at the water-tank outlet. Water is supplied to consumers under the pressure conditions of the secondary water-pipe network in low-rise buildings.
- Blocks A and B of Yangpyeong are both located on flat land; and were determined to be between −2 and 2 m, and 30 total random numbers were applied.
- For low-rise buildings, a value between 3 and 10 m was used for the head loss within the building. The same range was used for loss in the connecting pipes of high-rise buildings. Thirty random numbers were applied.
- The supply head of the secondary water-pipe network was set as 40 m, which is the management operation head of Yangpyeong’s water-pipe network. Thus, values between 0 and 40 m were selected, and 30 random numbers were applied.
- One hundred possible scenarios existed, and there were 30 supply head values per scenario. Thus, the total number of values according to was 3000.
- There are cases in which does not equal 0 even though is 0. This is because and are distributed as values between −2 and 2 m, allowing to be obtained for below-ground floors of buildings and for water tanks.
For Block A, although 97% of the total buildings were low-rise buildings with four floors or less, water usage by high-rise buildings with five or more floors accounted for 49% of the total. In this block, if the supply head of the secondary water-pipe network is greater than or equal to the critical head of the water tank, the demand of the water tank can be met. Therefore, although the value was near 0.5, was found to be close to 1, as shown in Figure 5a. However, in Block B, although low-rise buildings with four floors or less also accounted for 97% of the total buildings, the water usage of high-rise buildings represented less than 10% of the total. In this block, the supply flow rate of nodes for each floor of each building was determined based on the supply head of the secondary water-pipe network. Therefore, tended to increase gradually as increased, as shown in Figure 5b.
A representative HOR of the block derived in consideration of diverse water-supply methods, as shown in Figure 6, can have a relatively low supply head compared to that required in the HORs derived by Tanyimboh and Templeman [10] and Ciaponi et al. [16], while still demonstrating high water-supply performance. This is attributable to the model’s consideration of water-supply methods regardless of the proportion of the total base demand attributable to the demand of high-rise buildings. Since actual high-rise buildings can receive a lot of water even with a low supply head in the process of supplying water from the tank, this result reflects the realistic water-supply status that exists based on buildings’ differing water-supply methods.
For areas where the majority of buildings, including high-rise buildings, apply a direct water-supply method, representative HORs similar to those determined by Ciaponi et al. [16] are expected. However, the use of water pipes with heads that actually meet the required heads of the highest floor of a high-rise building is associated with maintenance issues and high initial costs, as the risk of water leakage increases and the selected pipes must be highly durable. Therefore, this practice reflects inefficient water management; in fact, many cities are striving to reduce water leakage rates by lowering the operating pressure of water pipes. Thus, in designing a pipe network, there are clear advantages to consider the differences between water-supply methods based on building types.
Though both studied blocks had similar residential environments, the representative HORs for Block A, which was characterized by a high base demand from high-rise buildings, and for Block B, which was characterized by a relatively high base demand from low-rise buildings, differed and are shown in Equations (23) and (24), respectively.
Representative HOR regression equation for blocks with high base demand from high-rise buildings:
Representative HOR regression equation for blocks with high base demand from low-rise buildings:
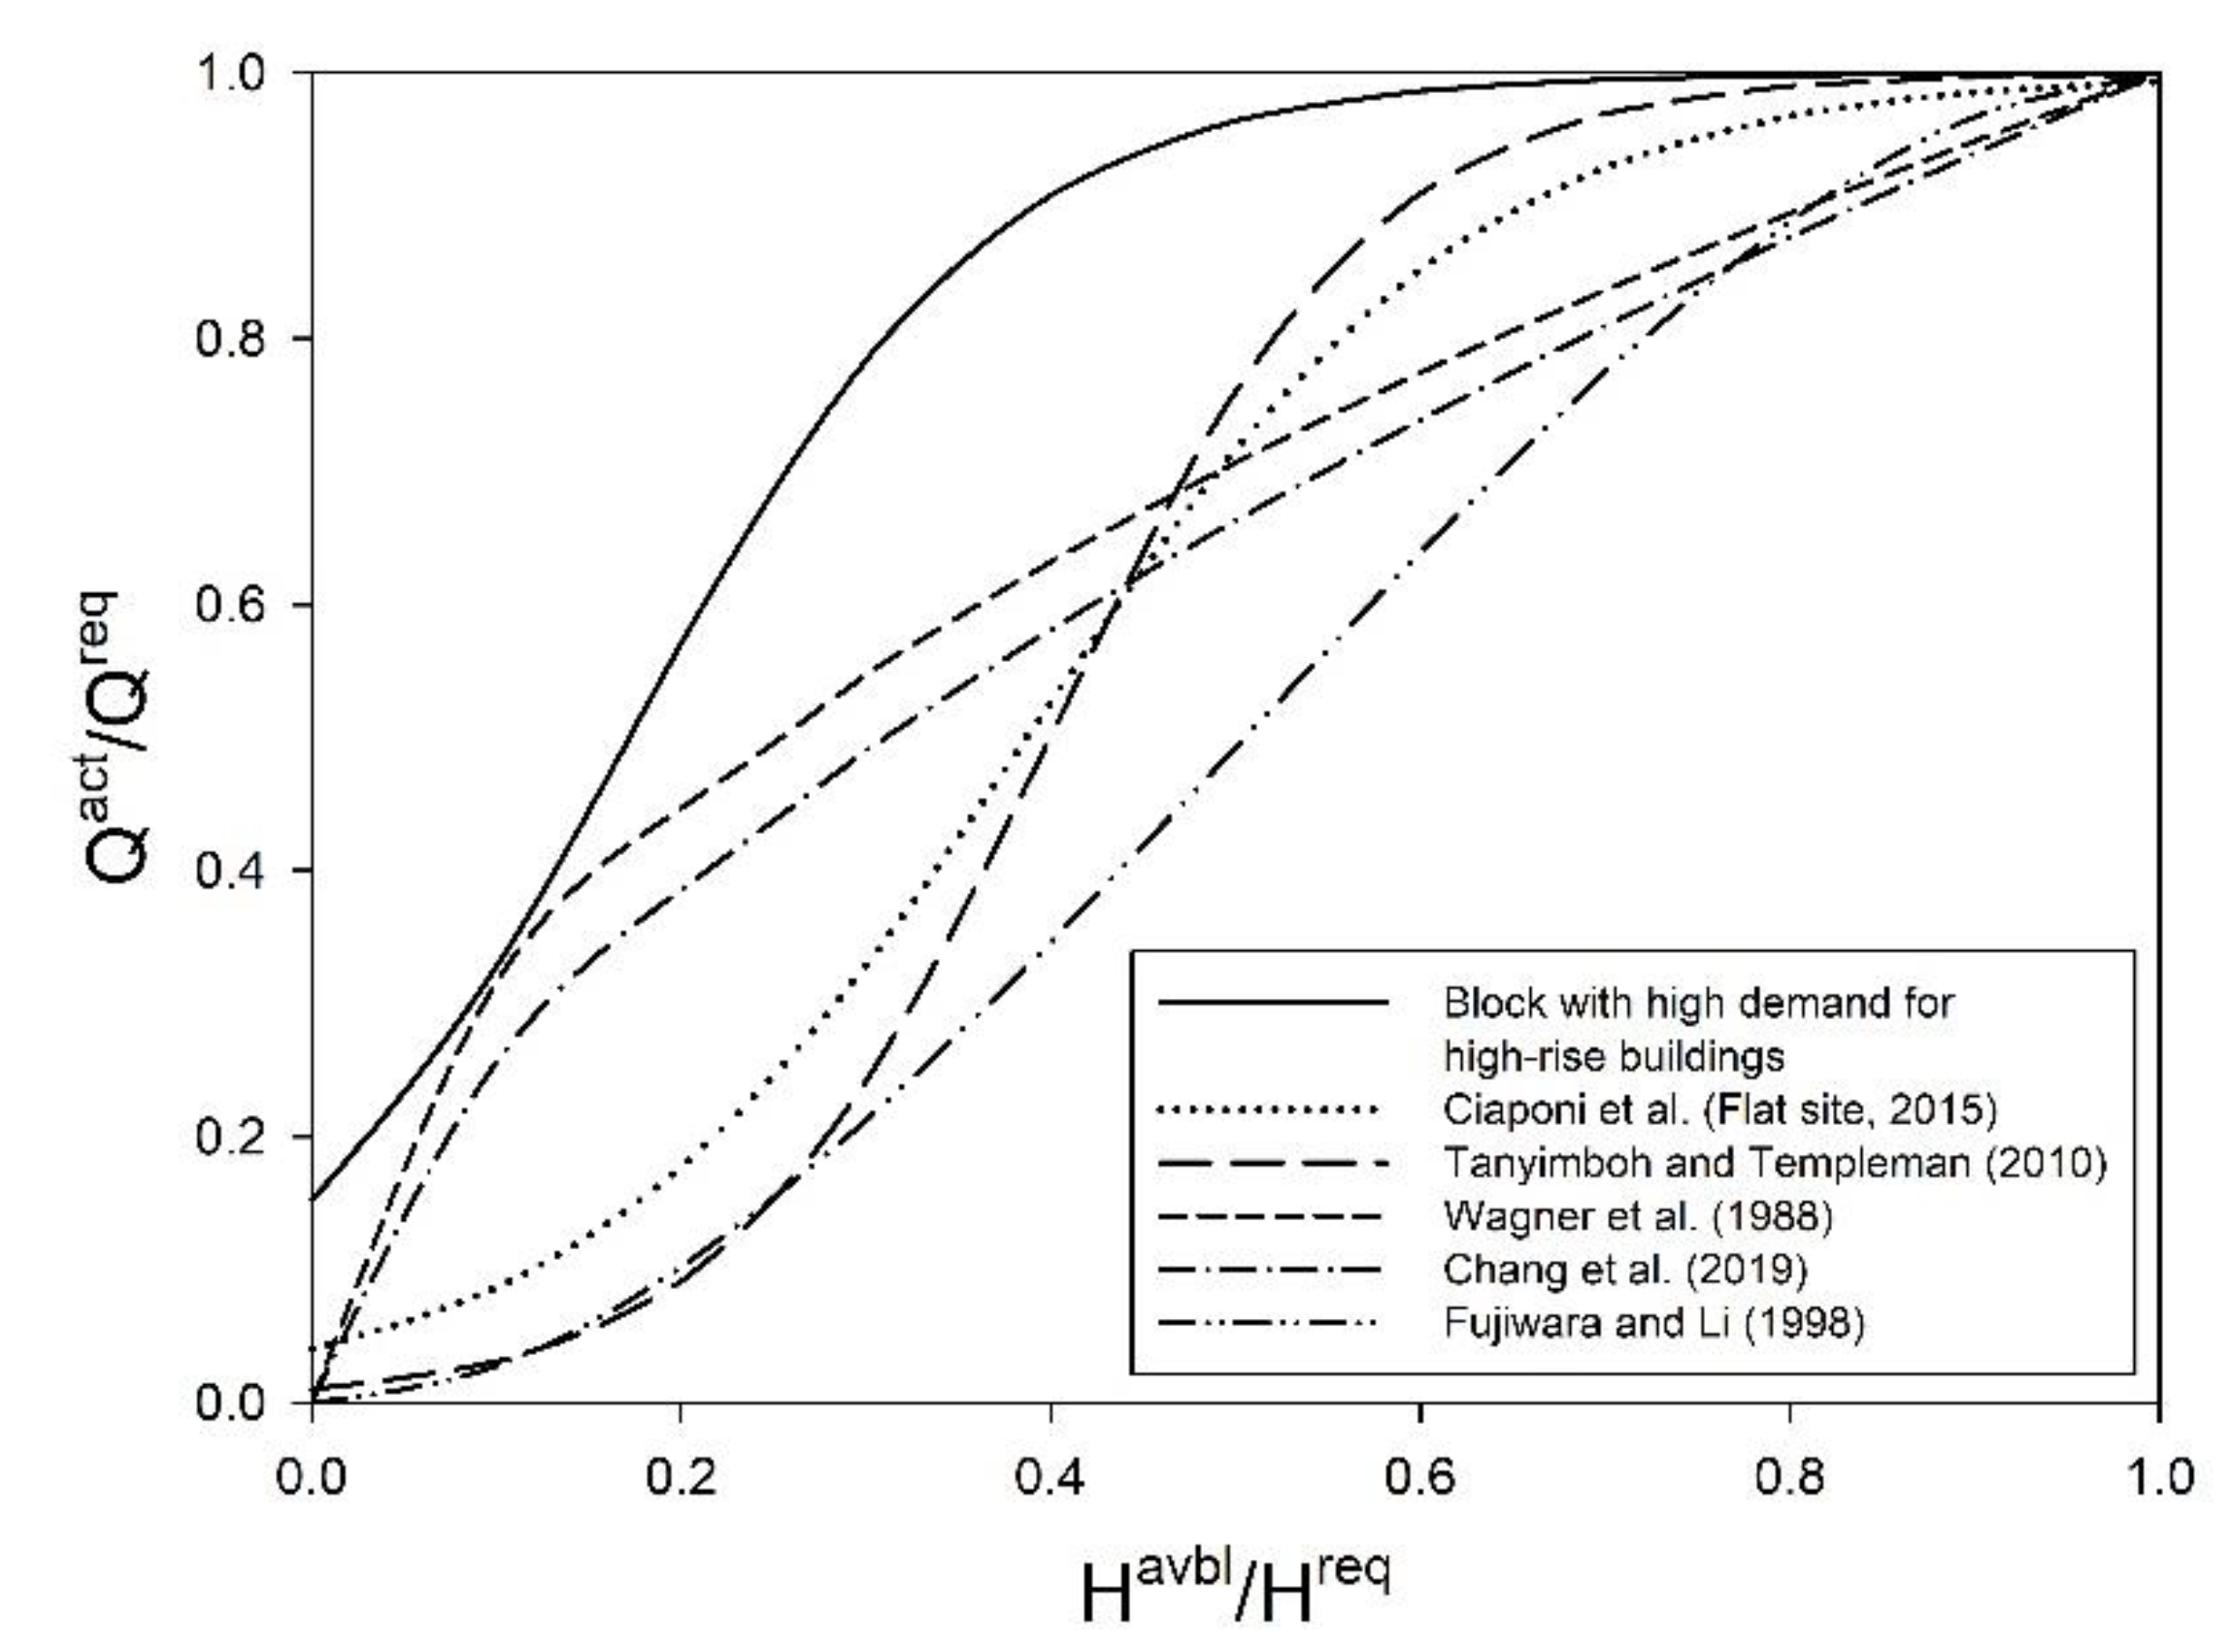
Many existing studies have derived various HORs through conceptual, experimental, and analytical methods as seen in Figure 7 and have discussed the suitability of each HOR. Among the proposed HOR formats, that derived by Wagner et al. [1] is widely applied, but it is difficult to verify if this approach adequately reflects the actual characteristics of a targeted block. Therefore, the present study sought to determine the representative HOR of a targeted block by reflecting the different water-supply methods employed by each building and the actual residential environments of users on the block based on survey data. Thus, an objective and reasonable HOR determination methodology can be applied in PDA, and the reliability of PDA results can be improved.
5. Conclusions
This study developed a methodology to define the representative HOR for a block through an approach that reflected the block’s residential environment, the differing water-supply methods employed by buildings, and actual water-usage data by buildings to realistically and efficiently calculate the supply flow rate for each demand node in the target area. Therefore, PDA that accounts for anomalous conditions within a water-supply network could be performed. Blocks with similar residential environments but differing base demand distributions between high-rise and low-rise buildings were selected to derive representative HORs that could reflect the different tendencies of diverse water-supply methods and water-usage patterns. Through comparison with various HORs proposed in the literature, the need to reflect differences in water-supply methods when defining a HOR was confirmed.
An analysis of the representative HORs derived in this study found that a high water-supply performance could be attained, even if the supply head was low compared to that found to be required by existing HORs. This phenomenon reflects the fact that high consumer water demands can be met in actual high-rise buildings, even with low supply heads, as water is supplied indirectly via a water tank and pump method; this finding was possible in the proposed HOR, as it considers the water-supply status based on the differences in the water-supply methods of each building. Thus, a representative HOR should be defined by utilizing actual data from target blocks determined via hydraulic-based analyses, as the water-supply method for each building and the proportion of the base demand attributable to various building types differs by block. The methodology developed through this study has the advantage of easy applicability based on data that can be secured in the design and operation processes of water-pipe networks. Finally, the process of selecting HORs for PDA has typically been highly subjective. The representative HOR definition methodology developed in this study may allow HORs to be selected in an objective and rational manner, thus improving the reliability of PDA results.
Author Contributions
Conceptualization, D.E.C. and D.G.Y.; methodology, D.E.C.; software, D.E.C.; validation, D.E.C., D.G.Y., and J.H.K.; formal analysis, D.E.C.; investigation, D.E.C.; resources, D.E.C.; data curation, D.E.C.; writing—original draft preparation, D.E.C.; writing—review and editing, J.H.K.; visualization, D.E.C.; supervision, D.E.C.; project administration, J.H.K.; funding acquisition, J.H.K. All authors have read and agreed to the published version of the manuscript.
Funding
This research was funded by the Korea Ministry of Environment as a “Global Top Project (2016002120004)”.
Conflicts of Interest
The authors declare no conflict of interest.
References
- Bhave, P.R. Node flow analysis of water distribution systems. Trans. Eng. J. ASCE 1981, 107, 457–467. [Google Scholar]
- Wagner, J.M.; Shamir, U.; Marks, D.H. Water distribution reliability: Simulation methods. J. Water Resour. Plan. Manag. 1988, 114, 276–294. [Google Scholar] [CrossRef] [Green Version]
- Germanopoulos, G. A technical note on the inclusion of pressure dependent demand and leakage terms in water supply network models. Civ. Eng. Syst. 1985, 2, 171–179. [Google Scholar] [CrossRef]
- Reddy, L.S.; Elango, K. A new approach to the analysis of water starved networks. J. Indian Water Works Assoc. 1991, 23, 31–38. [Google Scholar]
- Chandapillai, J. Realistic simulation of water distribution. J. Transp. Eng. 1991, 117, 258–263. [Google Scholar] [CrossRef]
- Fujiwara, O.; Ganesharajah, T. Reliability assessment of water supply systems with storage and distribution networks. Water Resour. Res. 1993, 29, 2917–2924. [Google Scholar] [CrossRef]
- Gupta, R.; Brave, P.R. Comparison of methods for predicting deficient network performance. J. Water Resour. Plan. Manag. 1996, 122, 214–217. [Google Scholar] [CrossRef]
- Udo, A.; Ozawa, T. Steady-state flow analysis of pipe networks considering reduction of flow in the case of low water pressures. In Water Software Systems: Theory and Applications; Research Studies Press: Taunton, UK, 2001; Volume 1, pp. 73–182. [Google Scholar]
- Wu, Z.Y.; Wang, R.H.; Walski, T.M.; Yang, S.Y.; Bowdler, D. Extended global-gradient algorithm for pressure-dependent water distribution analysis. J. Water Resour. Plan. Manag. 2009, 135, 13–22. [Google Scholar] [CrossRef]
- Tanyimboh, T.T.; Templeman, A.B. Seamless pressure deficient water distribution system model. J. Water Manag. ICE 2010, 163, 389–396. [Google Scholar] [CrossRef] [Green Version]
- Giustolisi, O.; Walski, T.M. Demand components in water distribution network analysis. J. Water Resour. Plan. Manag. 2012, 138, 356–367. [Google Scholar] [CrossRef]
- Shirzad, S.; Tabesh, M. Study of pressure-discharge relations in water distribution networks using field measurements. In Proceedings of the IWA World Water Congress and Exhibition, Busan, Korea, 16–21 September 2012. Manuscript 8328. [Google Scholar]
- Shirzad, A.; Tabesh, M.; Farmani, R.; Mohammadi, M. Pressure-discharge relations with application to head-driven simulation of water distribution networks. J. Water Resour. Plan. Manag. 2013, 139, 660–670. [Google Scholar] [CrossRef]
- Chang, D.; Lee, H.; Yoo, D.; Kim, J. Quantification of the head-outflow relationship for pressure-driven analysis in water distribution networks. KSCE J. Civ. Eng. 2019, 23, 3353–3363. [Google Scholar] [CrossRef]
- Tucciarelli, T.; Criminisi, A.; Termini, D. Leak analysis in pipeline systems by means of optimal valve regulation. J. Hydraul. Eng. 1999, 125, 277–285. [Google Scholar] [CrossRef]
- Ciaponi, C.; Franchioli, L.; Murari, E.; Papiri, S. Procedure for defining a pressure-outflow relationship regarding indoor demands in pressure-driven analysis of water distribution networks. Water Resour. Manag. 2015, 29, 817–832. [Google Scholar] [CrossRef]
- Ministry of Environment. Water Supply Facility Standard Management and Maintenance; Ministry of Environment: Seoul, Korea, 2010.
Figure 1.
Conceptual diagram of the water-supply method of high-rise buildings; = number of floors; = available pressure head at the water-supply node (m); = flow actually delivered to the storage tank (L/s); = required flow to the storage tank (L/s); = pressure head required to meet the demand (m); = elevation of storage tank top above delivery nodal level (m); = head loss from water-supply node to storage tank (m). Figure 1 was made by referring to Figure 9.1.2 presented in Korea’s Water Supply Facility Standard [17].

Figure 2.
Conceptual diagram of the water-supply method of low-rise buildings. = number of floors; = index of the generic floor (i = 1, ); = ground floor elevation above delivery nodal level (m); = elevation of ith floor above the ground floor level (m); = available pressure head at the delivery node (m); = available pressure head at the building pipe network connection point (above the ground floor level, m); = flow actually delivered to users within the building (L/s); = flow required by the users (L/s); = flow actually delivered to the users on the ith floor (L/s); = flow required by users on the ith floor (L/s); = pressure head necessary to meet the required demand (m); = minimum pressure head below which the flow delivered to users on the ith floor is 0 (m); = head loss within the indoor plumbing system (from connection point to faucets). Figure 2 was made by referring to Figure 1 of Ciaponi et al. [16].

Figure 3.
Locations of Blocks A and B in Yangpyeong, Korea.

Figure 4.
Representative HOR definition determination process.
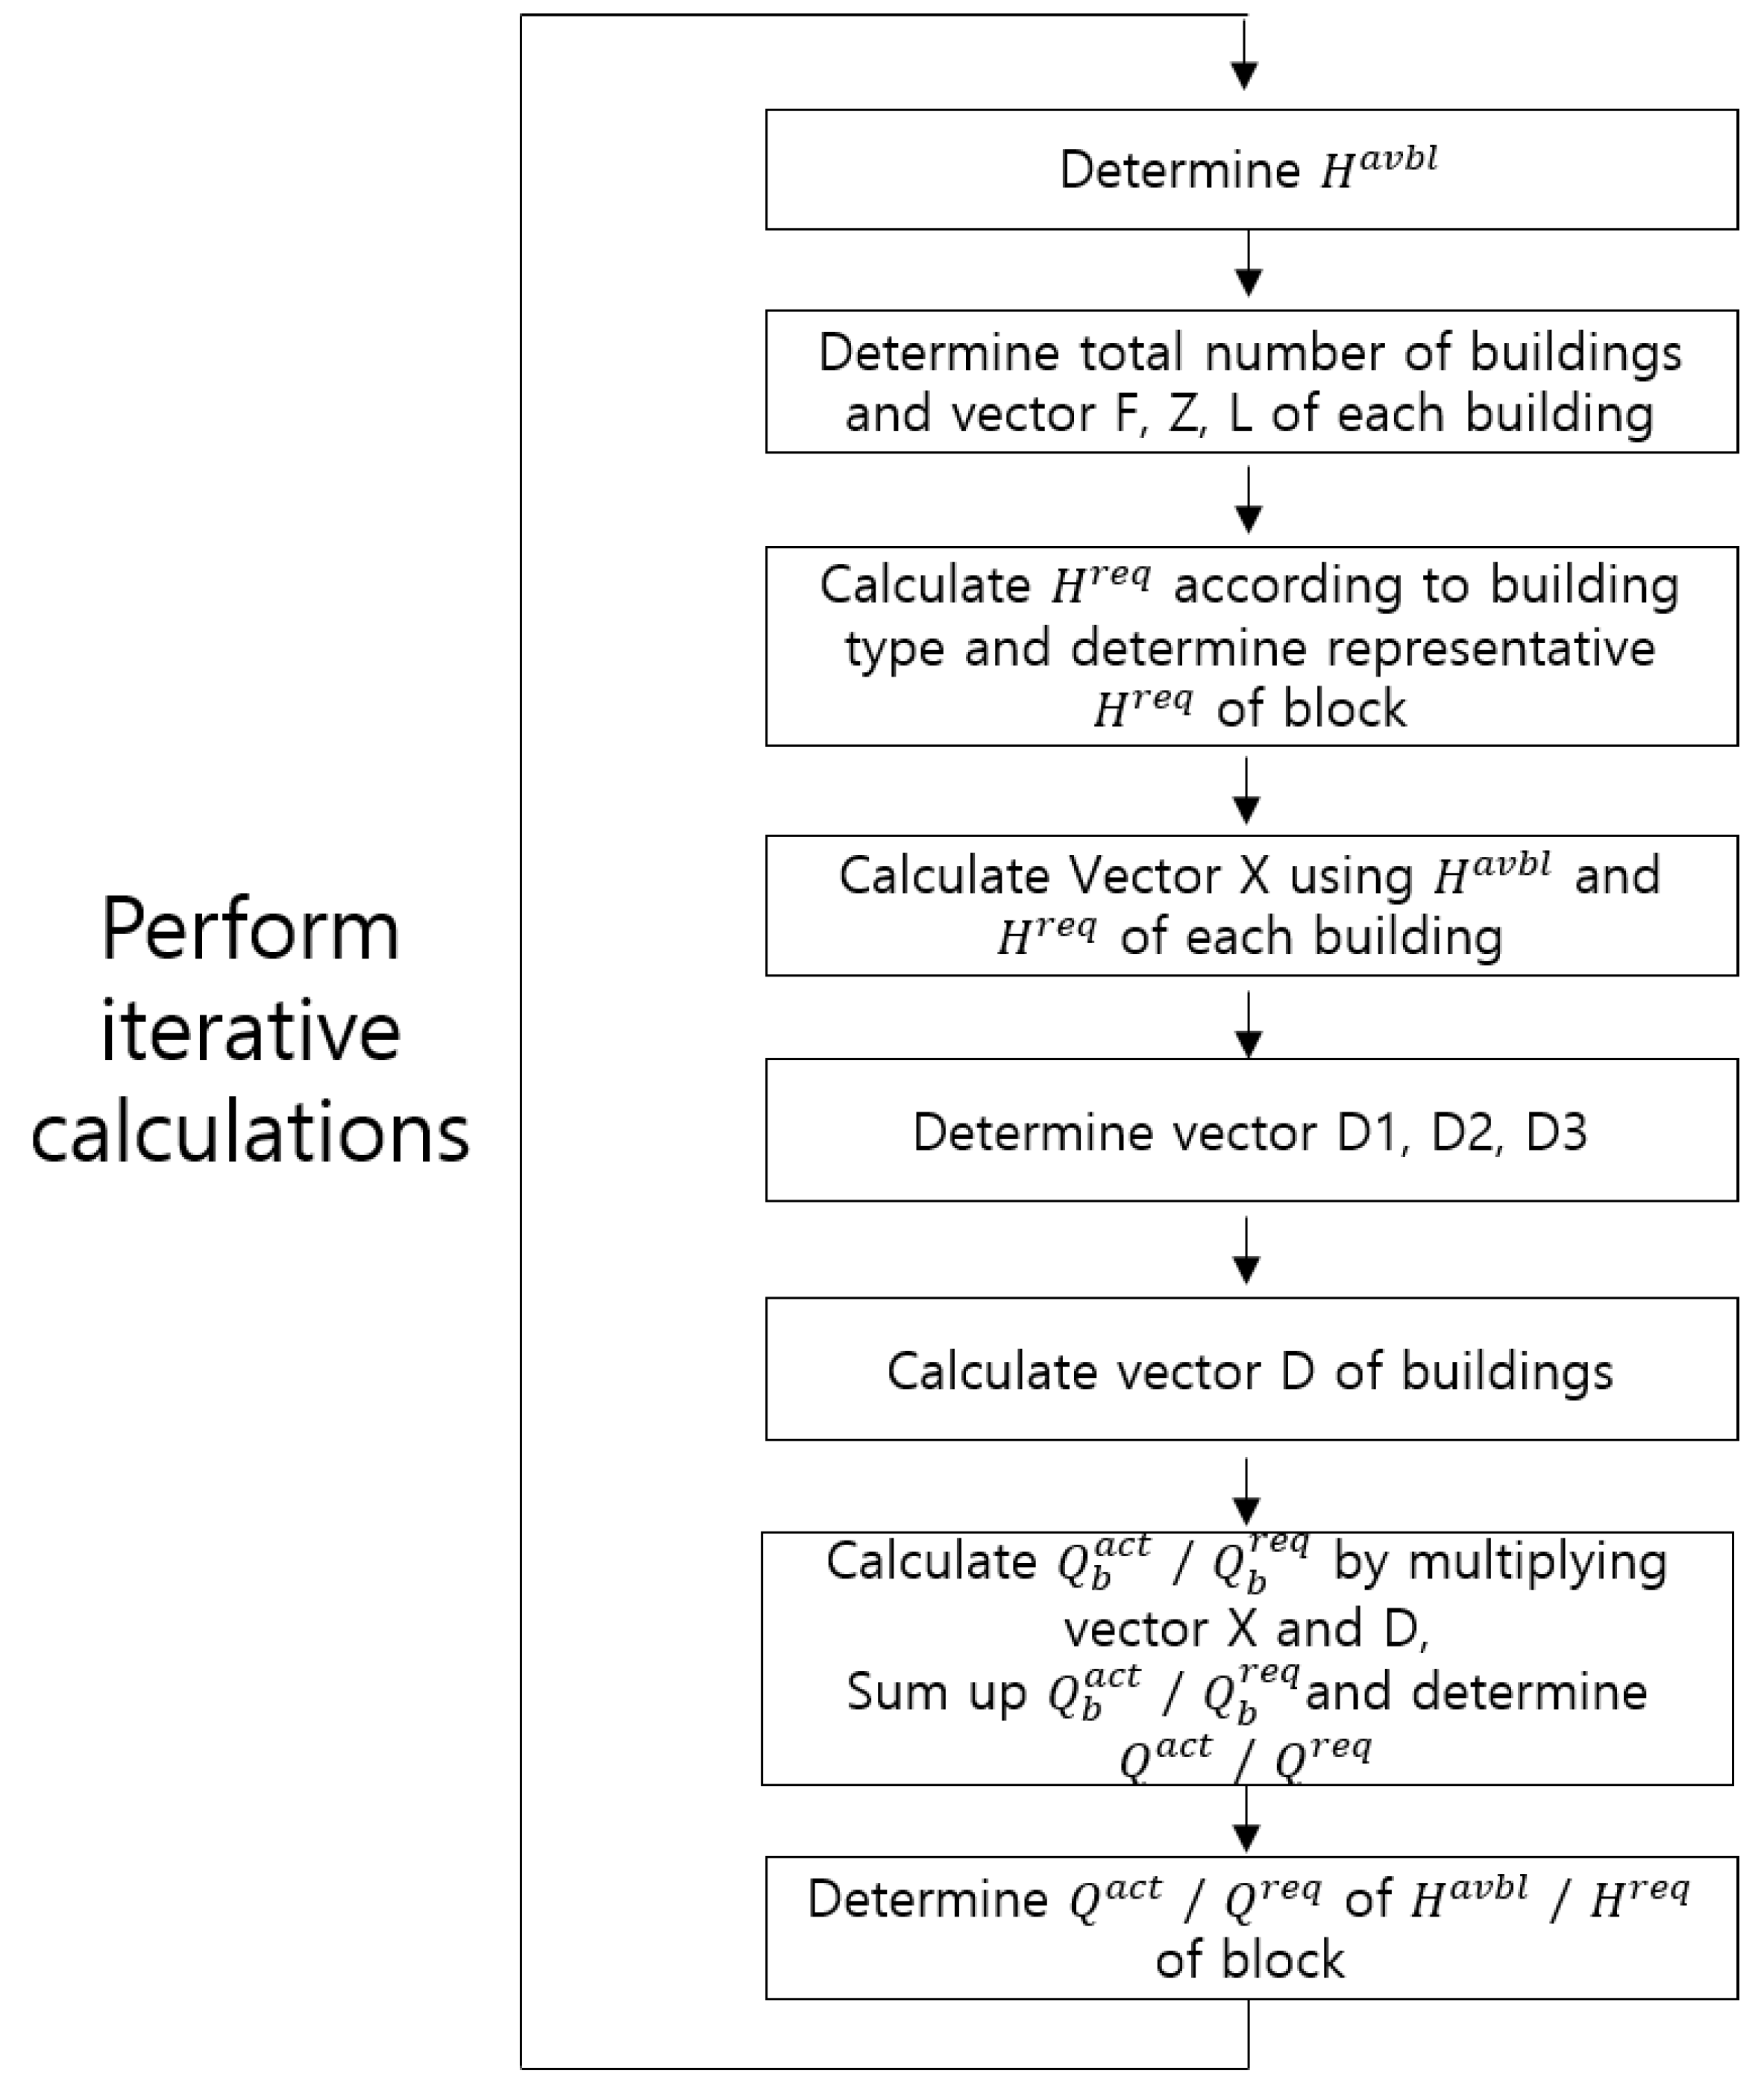
Figure 5.
Derivation of representative HOR considering the diversity of water-supply methods and the water usage proportion by building. (A) Representative HOR of Block A with a high proportion of water usage in high-rise buildings. (B) Representative HOR of Block B with a low proportion of water usage in high-rise buildings.

Figure 6.
Representative HOR of Block A, in which high-rise buildings accounted for a large proportion of water usage.
Figure 6.
Representative HOR of Block A, in which high-rise buildings accounted for a large proportion of water usage.
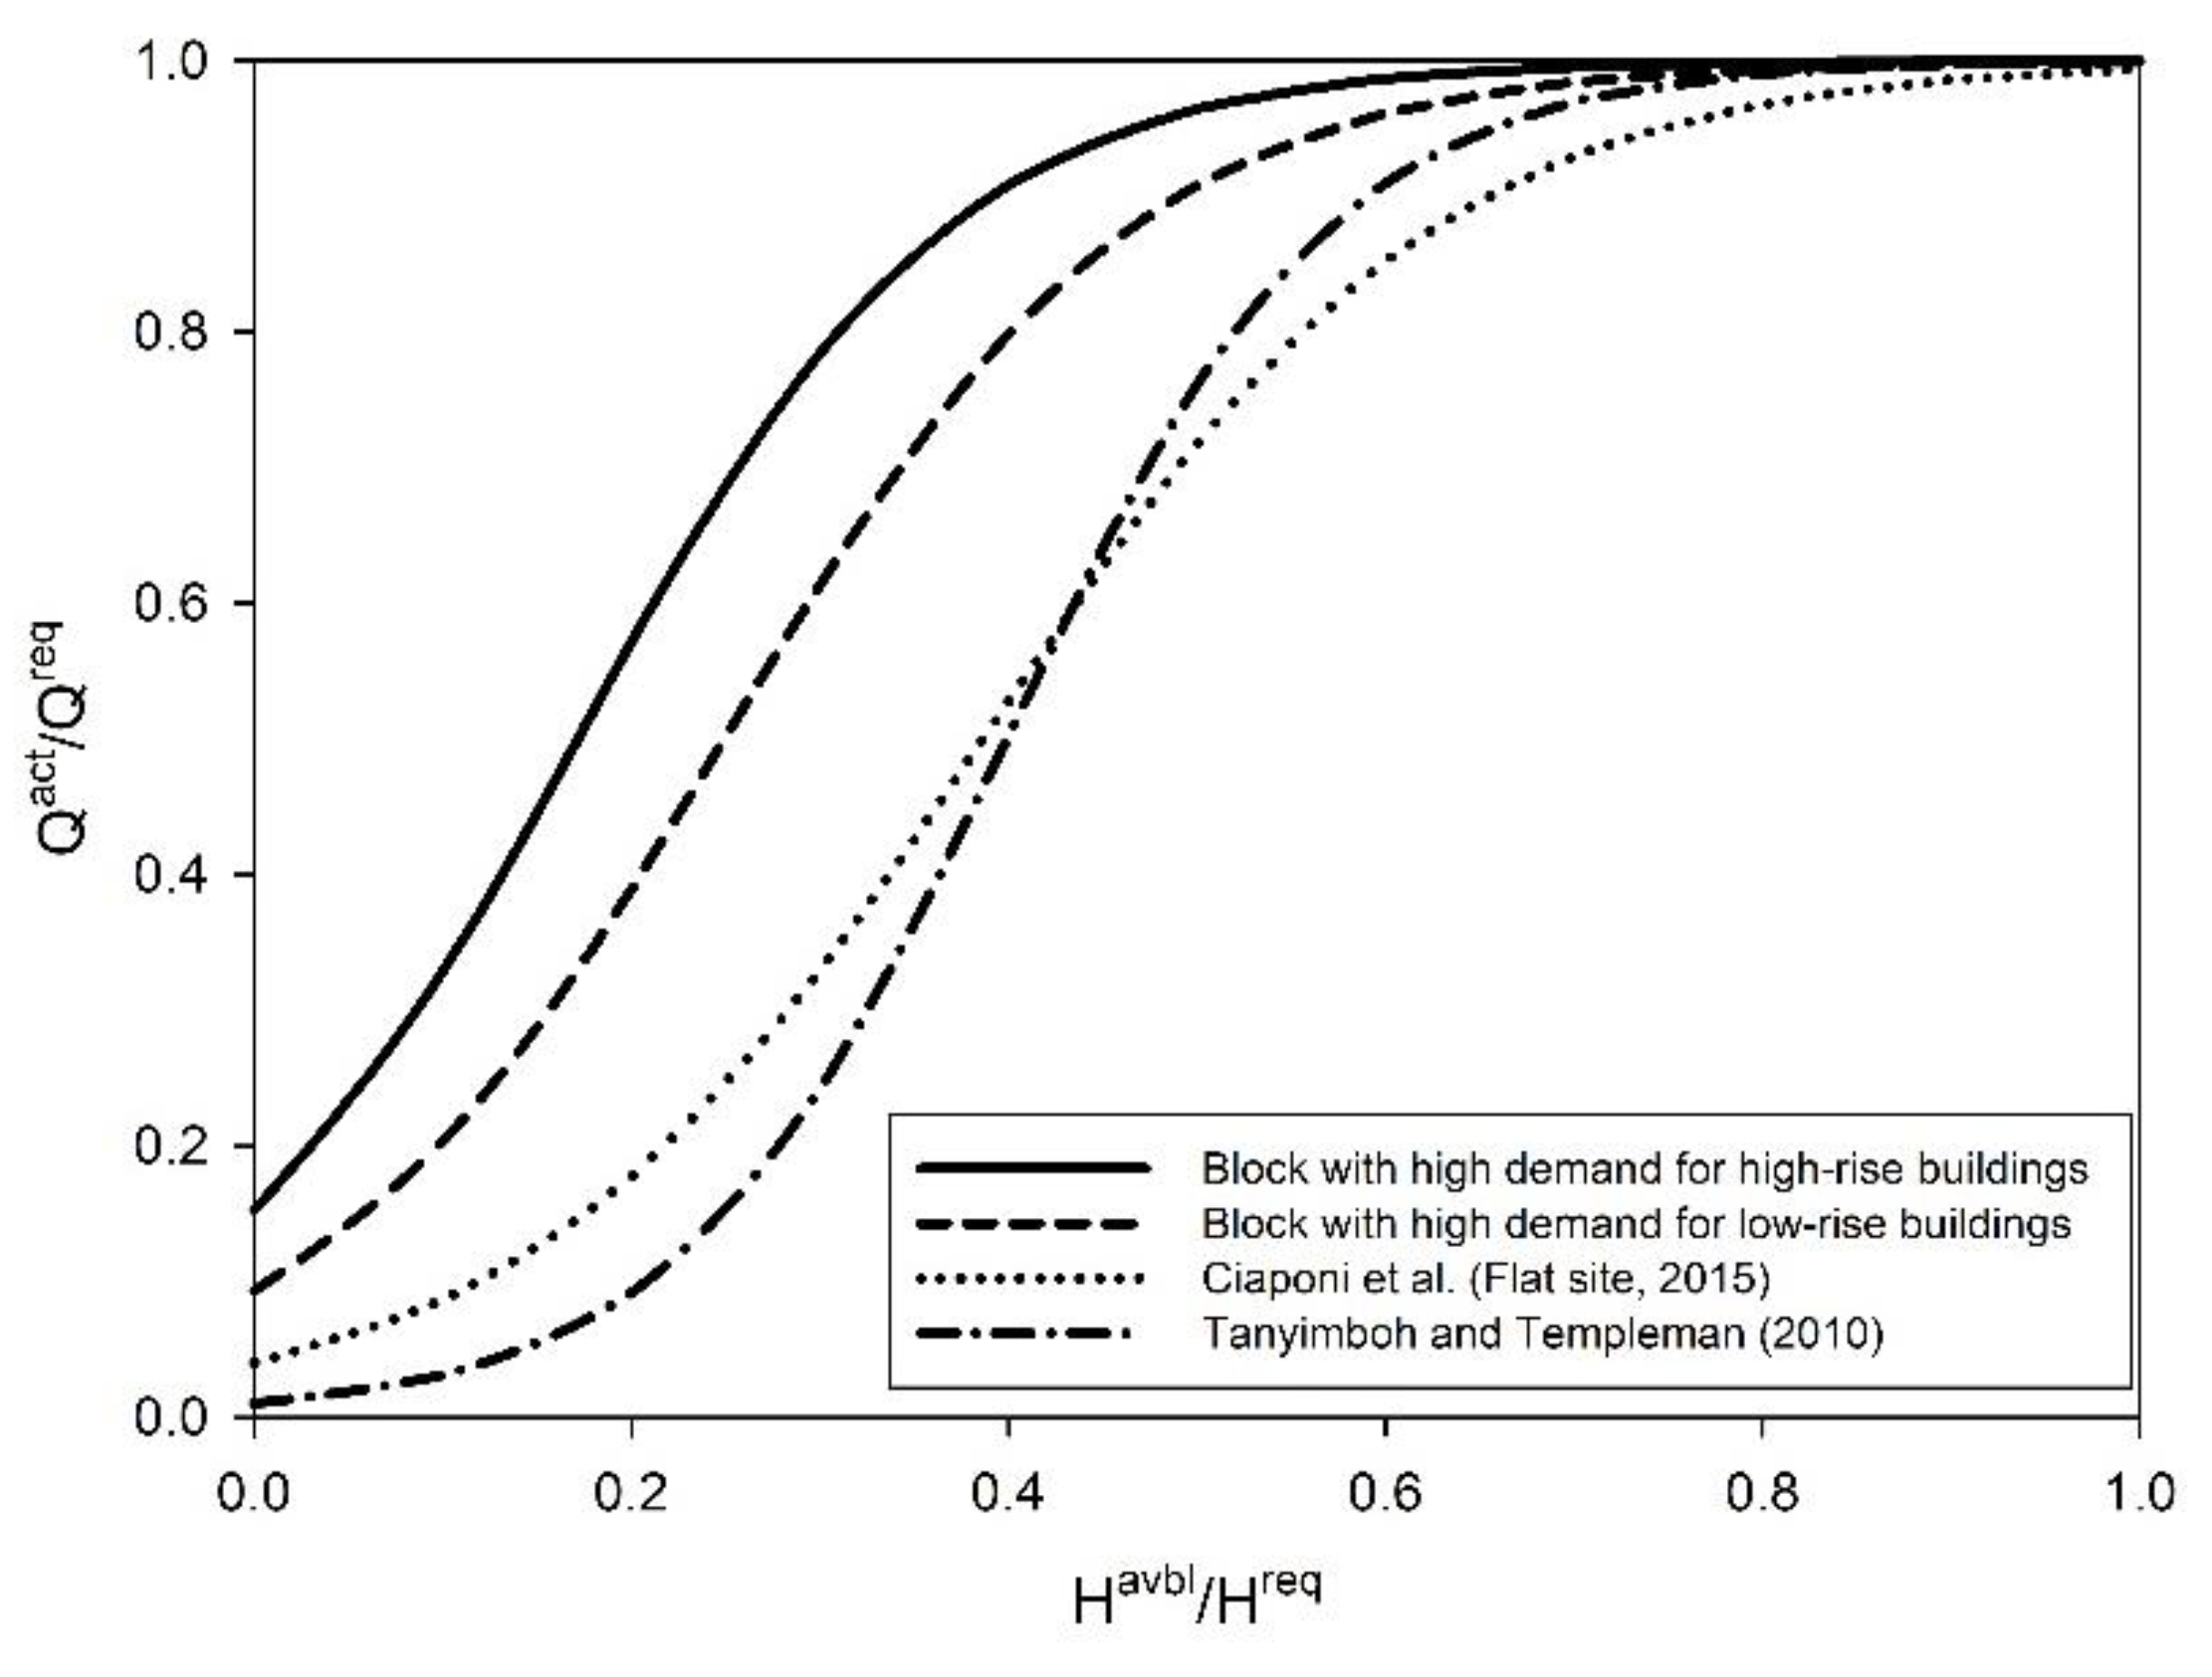
Figure 7.
Comparison of various head-outflow relationship models.

Table 1.
Head-outflow relationships (HORs) proposed in previous studies.
| Reference | Relationship of Available Outflow Discharge to Nodal Pressure |
|---|---|
| Bhave [1] | |
| Germanopolous [3] | |
| Reddy and Elango [4] | |
| Fujiwara and Ganshraja [6] | |
| Gupta and Bhave [7] | |
| Wagner et al. [2] | |
| Tucciarelli et al. [15] | |
| Wu et al. [9] | |
| Tanyimboh and Templeman [10] | |
| Shirzad et al. [13] | |
| Ciaponi et al. [16] | Flat site: Hilly–mountainous site: |
| Giustolisi and Walski [11] | |
| Chang et al. [14] | m = 2.35, to minimize the uncertainty of total outflow of the entire water distribution system. m = 1.69, to minimize the uncertainty of available flow rate of a particular node that requires intensive monitoring. |
Table 2.
Classification of low-rise and high-rise building properties.
| Building Type | Low-Rise Building | High-Rise Building |
|---|---|---|
| Node | Each floor by building | Water tank |
| Number of floors | 1–4 | 5 or more (unified as 5 floors) |
| Ground-level difference | The difference between the water-supply node of the building and ground level | The difference between the water-supply node and the top of the building water tank |
| Head loss | Reflects only the loss within water pipes inside the building | Reflects loss in the connecting pipe from the water-supply node to the water tank |
| Base demand per building within the block | The water usage rate according to the height of actual buildings in the survey area is applied. | |
Table 3.
Characteristics of buildings in Block A.
| Condition | Block A | |||
|---|---|---|---|---|
| Number of Buildings | Ratio (%) | Water Usage (m3/month) | Ratio (%) | |
| One floor | 449 | 81 | 15,979 | 28 |
| Two floors | 20 | 4 | 1459 | 3 |
| Three floors | 40 | 7 | 8098 | 14 |
| Four floors | 24 | 4 | 3216 | 6 |
| Five or more floors | 19 | 3 | 28,053 | 49 |
| Total | 552 | 100 | 56,805 | 100 |
Table 4.
Characteristics of buildings in Block B.
| Condition | Block B | |||
|---|---|---|---|---|
| Number of Buildings | Ratio (%) | Water Usage (m3/month) | Ratio (%) | |
| One floor | 77 | 54 | 2058 | 17 |
| Two floors | 19 | 13 | 1615 | 13 |
| Three floors | 31 | 22 | 5268 | 42 |
| Four floors | 10 | 7 | 2359 | 19 |
| Five or more floors | 5 | 3 | 1171 | 9 |
| Total | 143 | 100 | 12,471 | 100 |
© 2020 by the authors. Licensee MDPI, Basel, Switzerland. This article is an open access article distributed under the terms and conditions of the Creative Commons Attribution (CC BY) license (http://creativecommons.org/licenses/by/4.0/).
Share and Cite
MDPI and ACS Style
Chang, D.E.; Yoo, D.G.; Kim, J.H. Practical Head-Outflow Relationship Definition Methodology That Accounts for Varied Water-Supply Methods. Sustainability 2020, 12, 4755. https://doi.org/10.3390/su12114755
AMA Style
Chang DE, Yoo DG, Kim JH. Practical Head-Outflow Relationship Definition Methodology That Accounts for Varied Water-Supply Methods. Sustainability. 2020; 12(11):4755. https://doi.org/10.3390/su12114755
Chicago/Turabian StyleChang, Dong Eil, Do Guen Yoo, and Joong Hoon Kim. 2020. "Practical Head-Outflow Relationship Definition Methodology That Accounts for Varied Water-Supply Methods" Sustainability 12, no. 11: 4755. https://doi.org/10.3390/su12114755
Note that from the first issue of 2016, this journal uses article numbers instead of page numbers. See further details here.