Article

An Evaluation System for Sustainable Urban Space Development Based in Green Urbanism Principles—A Case Study Based on the Qin-Ba Mountain Area in China

1
School of Architecture, Chang’an University, Xi’an 710061, China
2
Electric Power Division, Photometry Laboratory, School of Electrical and Computer Engineering, National Technical University of Athens, 15780 Athens, Greece
*
Authors to whom correspondence should be addressed.
Sustainability 2020, 12(14), 5703; https://doi.org/10.3390/su12145703
Submission received: 4 June 2020 / Revised: 4 July 2020 / Accepted: 13 July 2020 / Published: 15 July 2020
(This article belongs to the Special Issue Sustainability Assessment)

Abstract

:
Since the 20th century, the deterioration of the ecological environment around the world has challenged urban space construction. With the development of urbanization, the consumption of resources and energy has increased, the level of biodiversity has decreased, environmental pollution is approaching the critical level, and the contradiction between human habitat activity and ecological environment has become increasingly prominent. The sustainable development of urban space along with its economic and social benefits, taking into account the quality of life and ecological environment, has become a new and important subject that needs to be explored. In this study, the indices of the evaluation system for sustainable urban spatial development in regions with underdeveloped economies but rich in ecological resources are arranged in sequence through the systematic coupling analysis of collaborative evaluation information and a quantitative analysis. The influences of urban space elements on sustainable urban development are disclosed. On the basis of the generated data, an evaluation system for sustainable urban spatial development with a complete set of information is proposed. The proposed system is applicable to urban spatial development evaluation in regions in China with underdeveloped economies but rich in ecological capital. First, the basic concept of system coupling is introduced, and a coupling relationship between urban sustainable development and urban space is proposed. Second, the elements of urban space and the sustainable development in the Qin-Ba mountain area are extracted, and the precedence diagram method is used to construct a sustainable evaluation system for urban space development in the Qin-Ba mountain area. Third, the sustainable evaluation process of urban spatial development is proposed. Finally, the sustainable evaluation system for urban spatial development in the Qin-Ba mountain area is applied to evaluate the urban spatial development in Shangluo, Qin-Ling Mountains, China. The results show that, among the investigated 14 indicators, the proportion of industrial land use mainly influences sustainable urban spatial development. As for the rest of the index factors, per capita green land area and green coverage ratio of built-up areas, per capita urban construction land area, proportion of forestry area, greening rate of built-up areas, total industrial dust emission density, proportion of cultivated area, and average volume fraction of residential areas are the secondary influencing factors of sustainable urban spatial development. The evaluation system in this research is constructed with the three aspects of “green coordination”, “green development”, and “green sustainability” of sustainable urban spatial development, and it complements the evaluation contents of urban–rural ecological space coordination, land resource protection, and green development community, and so on. The conclusion of this study not only can provide a useful reference for urban spatial development planning for underdeveloped ecological capital areas of China but also can provide a theoretical basis for the management and control policy of sustainable urban spatial development.

1. Introduction

The deterioration of the ecological environment around the whole world has brought great challenges to the construction of human settlements since the 20th century. With the increase in population scale as a result of the rapid urbanization and expansion of urban lands, the contradiction between human activities and the ecological environment has become increasingly prominent. In particular, although the average ecological footprint remains to be under an ecological surplus in the urban space of ecological capital regions, urban development has led to various problems, such as increasing resource and energy consumption, decreasing biodiversity levels, environmental pollution approaching the critical value, a mismatch between the growth of social–economic benefit and the growth of ecological environmental benefit, and contradictions between urban material spatial development and urban functions. The proportion of primary energy consumption of Chinese cities in terms of global consumption increased from 11% in 2000 to 20.3% in 2010. Such growth accounted for 53% of the global growth of energy consumption [1]. A sustainable development conference held in 2012 proposed an evaluation of natural capital and ecological service values in economic accounting [2], in which environmental protection was viewed as a new development mode and an important support mechanism to sustainable development [3,4], combined with higher productivity and innovation ability with much lower cost and negative environmental impact [5,6,7,8]. Urban development plans needed to be attached to higher levels of sustainability of urban spatial development, thereby requiring a series of scientific and reasonable evaluations to reasonably orient and quantify urban spatial development. However, the sustainability of urban spatial development involves many complicated elements, including the urban environment, urban economy, urban land, urban development policies, etc. [9]. Sustainable development factors and urban space elements differ from each other. Moreover, evaluation systems for the sustainability of urban development generally lack the indices related to urban spatial construction, resulting in limitations on urban spatial development assessments. For example, the evaluation indices of urban–rural ecological spatial collaboration, construction of urban human settlement, land resource protection, green buildings, and green development communities, among others, are lacking. Moreover, traditional evaluation systems are difficult to apply in the assessment of urban spatial development in economically underdeveloped ecological capital regions, as they do not simultaneously consider sustainable urban economic development and sustainable urban spatial development. Hence, an evaluation system for the sustainability of urban spatial development should be developed to realize the scientific and accurate processing of urban spatial construction assessment information.
The limitations of evaluation systems for urban spatial development are mainly a result of two aspects. The first concern is the evaluation object. A complicated urban system involves environmental, economic, social, and other factors. As a material carrier, the urban space is faced with various uncertain factors in the development and construction process. The second aspect is about the evaluation experts of sustainable development. In the past, economists were the main evaluators, but they lacked complete professional knowledge of urban spatial construction and the relevant experience in managing complicated heterogeneous urban spaces. Consequently, the evaluators could wrongly decide or hardly offer accurate assessments, which could then lead to incomplete evaluation results. The DFSR (Driving Force–State–Response) model can be applied to realize a comprehensive evaluation system for sustainable development [10]. The major indices of the DFSR model cover four aspects, namely, the social, economic, environmental, and institutional indices. However, the causal relation between social and economic indices is not evident in the DFSP model. The ambiguous classification of “driving force indices” and “state indices” leads to missing information, thus influencing the reasonability and accuracy of the evaluation results. In this study, the indices of the evaluation system for sustainable urban spatial development in regions with underdeveloped economies but rich in ecological resources are arranged in sequence through the systematic coupling analysis of collaborative evaluation information and a quantitative analysis. The influences of urban space elements on sustainable urban development are disclosed. On the basis of the generated data, an evaluation system for sustainable urban spatial development with a complete set of information is proposed. The proposed system is applicable to urban spatial development evaluation in regions in China with underdeveloped economies but rich in ecological capital.

2. State of the Art

The sustainability evaluations for urban spatial development have been supplemented and extended by combining models focused on green urban development space with “garden city” and “ecological city” [11,12,13]. Searn [14], by using a case study of Denver, USA, pointed out that the sustainable development of green urban spaces is a development mode integrating economic, appreciation, and social benefits based on the natural environment and one that fully and reasonably uses existing ecological resources. In response to deal with the risks related to flooding, climate change, and broader sustainability objectives, some scholars proposed to balance the potential trade-off between these risks and vulnerability, so as to maximize the synergy of urban space [15,16]. The studies on urban development evaluation cover habitable city evaluation [17], ecological city construction evaluation [18,19], low-carbon city evaluation [20,21], and forest city evaluation [22]. All of these evaluations mainly take the form of a standard analysis and lack the utilization of empirical data and quantitative evaluation methods.
On the basis of the abovementioned gaps, scholars introduced quantitative evaluation standards for urban development. The Economist Intelligence Unit [23] was used to construct a green city index system that covered environmental health, resource savings, low-carbon development, livability, and so on. Richardson et al. [24] measured green development levels by using the land use data of 49 big cities in the USA and verified the relations of green development levels with incidence rates of heart diseases, diabetes, and lung cancer. With the development of low-carbon technology and Internet technology, Stanford University [25] launched the project called “smart green cities” as a means of decreasing the carbon emissions of cities based on quantitative assessments. There are also some scholars who evaluated the sustainability of enterprises and society [26]. The abovementioned index systems were mainly independent studies on the evaluation of sustainable urban development, but they lacked a deep analysis of the relationship between urban space and urban development.
The United Nations Commission on Sustainable Development proposed a comprehensive sustainable development evaluation system that covered four aspects (social, economic, environmental, and institutional indices) of the evaluation indices. Moreover, 28 level-1 indices and 131 level-2 indices were considered. This system inherited the Pressure State Response (PSR) model and changed the word “pressure” into “driving force” in accordance with the needs of sustainable development, and formed the DFSR model. Driving force indices reflected the role of human activities or policies on economic and social conditions. The system emphasized the causal relationship between the pressure on the environment and environmental degradation, which made the relationship between environmental goals very close. However, the causal relation between the social and economic indices was not evident. The classifications of “driving force indices” and “state indices” were also ambiguous. For example, the indicator of sustainable development policy was an obvious driving force, but the indices of poverty eradication and consumption pattern changing made it difficult for people to understand whether they were driving force indices or state indices. These gaps could lead to missing information and influence the reasonability and accuracy of the evaluation results. In 2010, the China Economic Monitoring Center established a green development monitoring index system and an index measurement method from the perspectives of greening of economic growth, bearing potentials of resource environment, and gaining support through government policies [27]; this system helped create the existing China green development index. This index system currently highlights the characteristic indices deserving special attention in the sustainable urban development domain, including air quality evaluation. The selection of certain index types highlights the importance of the bearing potentials of the resource environment to urban development. Chinese scholars have also proposed quantitative assessments of urban development sustainability with respect to the construction of typical cities, including the evaluation index system for a green city construction in Nanjing City [28]; evaluation indices for sustainable urban construction in Xiamen City [29]; urban development situations and comprehensive effect evaluation in Fujian Province [30]; and an urban green production, green consumption, and ecological environmental sustainable development purpose system in Beijing [31]. Environmental, economic, and political factors are important components in the existing studies on evaluation systems for sustainable urban development. Relatively complete indices on environmental pressure, state actions, and economic and social development levels can be used in these evaluation systems. Moreover, the proportions of energy-saving and environmentally friendly industries in the economic activities are highlighted. In these existing evaluation systems, the indices closely related to urban space concentrate on infrastructure and resource abundance, and they account for 5%–13% of the total indices. The indices have been chosen according to the urban space and public transport network of Greenland. However, these index systems generally lack the indices concerning urban–rural ecological spatial collaboration and urban human settlement construction. Moreover, the indices about land resource protection, green building, and green development community are not highlighted. The existing index systems mainly focus on the evaluation of economic industries [32] but ignore the structural elements concerning the spatial dependence on sustainable urban development. As a result, the scopes of the practical application of these evaluation index systems are limited, and the evaluation index systems are inapplicable in evaluating the sustainability of urban spatial development of regions that are economically underdeveloped but rich in ecological resource. Consequently, an integral and effective evaluation system for sustainable urban spatial development needs to be proposed as a means of comprehensively solving the urban economic space assessment problem.
The evaluation systems for sustainable urban development cannot solve the limitations of evaluation information, and they cannot be easily applied to practical situations. The evaluation results may also deviate from practical situations, thus the difficulty in assuring a reasonable and accurate evaluation. Hence, a sustainability evaluation system for urban spatial development is proposed in this study from the perspective of system coupling. The driving force is reflected through the factors of economic system and social system, and the state is reflected through the factors of ecological environmental system. The aim is to solve the relevant evaluation limitations in a reasonable and effective manner. The research conclusions can provide references to the management and decision making of sustainable urban spatial development.
The remainder of this paper is organized as follows. In Section 3, we introduce the basic concept of systematic coupling and propose a coupling relation between sustainable urban development and urban spatial factors. Moreover, the evaluation index system for the sustainability of urban spatial development in the Qin-Ba mountain area is considered. In Section 4, we prove the feasibility and validity of the constructed evaluation system based on a case study on Shangluo City in the Qin-Ba mountain area. In Section 5, we summarize the relevant conclusions.

3. Methodology

3.1. Preliminary Concepts

Coupling refers to degree of association among different factors in a system [33]. It is the phenomenon in which factors between two systems or among many systems connect together through mutual interaction or influences; thus, coupling can be used as a standard to measure coordinated relations among different systems.
The concept of system coupling covers five aspects, namely, integrity, association, diversity, coordination, and dynamics. These characteristics demonstrate that the elements of different systems are connected according to certain structures and rules, thus forming a benign integrity. Coupling degree is an important index corresponding to the mutual influence degree among different systems or factors. The studies on the maturity degree of evaluation projects and organizations are optimization methods based on the abovementioned theory, and they are implemented to decrease the risks to be faced by the project or organization [34].
The function of coupling degree (C) is defined as follows:
C = { ( u 1 × u 2 × u 3 × u n ) [ ( u i + u j ) ] } 1 n
where C is the coupling degree, u represents the index values in the evaluation system, and ui and uj (i = 1,2,...,n; j = 1,2,...,n; i ≠ j) are the contribution degrees of the subsystem i and j to the overall system. The value of C ranges between 0 and 1. The higher the value of C, the higher the coupling degree of the different systems. When 0 < C ≤ 0.3, the coupling degree of the different systems is at the low-level stage. When 0.3 < C ≤ 0.5, the coupling degree of the different systems is at the antagonistic stage. When 0.5 < C ≤ 0.8, the coupling degree of the different systems enters into a breaking-in stage. When 0.5 < C < 1, the coupling degree of the different systems enters into a high-level coupling stage. When C = 1, two systems form a structural combination or the influencing level is the best and reaches the benign resonance coupling level. When C is 0, two systems have not formed a coupling [35,36]. The studies on the maturity degree of evaluation projects and organizations are optimization methods based on the abovementioned theory as a means of decreasing the risk of the project or organization.

3.2. Precedence Chart

The principle of the precedence chart (PC) is to carry out a pairwise analysis of the importance degrees of different factors relative to the purpose of the matrix diagram representation. PCs are conducted to provide decision-making references to managers.
Many researchers have proposed methods, such as the analytic hierarchy process [37], comprehensive index method, TOPSIS method, etc., to calculate the importance of influencing factors. However, these methods often encounter problems in practical applications, as the judgment matrix usually fails in the consistency test due to inadequate associated knowledge of investigators, further influencing the accuracy of the evaluation results. The PC approach presents higher reliability of results compared with the other methods [38,39].
PC entails a tessellated pattern (Table 1). Suppose n is the number of indices for comparison, and n × n spaces are presented. The left columns in the table refer to the comparison indices, while the upper rows are the compared indices. During a pairwise comparison, 1 refers to “better” or “more important”, 0 refers to “poorer” or “less important”, and 0.5 refers to “equally important.”
The PC method is used to divide the frequency of occurrence of different indices by the total frequency of occurrence of all indices. As the different experts in this study could offer different opinions on the importance of the different indices and the different authority coefficients, a multi-input-weighted PC method was applied. Objective sampling method is adopted to select experts. For example, in the study, experts meeting the following inclusion criteria were selected in the Qin-Ba mountain area: 1—engaged in urban planning, ecological protection, urban construction and management for more than 10 years; 2—with at least a master’s degree; 3—with at least a senior professional title; 4—from colleges with postgraduate training qualification; and 5—informed consent and willing to cooperate with this study. The authority coefficient was calculated by 20% of each item. Exclude corresponding experts on condition of the following cases: 1—submitting incomplete questionnaire and no response after contacting experts; 2—failing to respond to the questionnaire within the specified time. The authority coefficients of the experts, which were calculated in the first round, were assigned (0.95 = 6, 0.90 = 5, 0.85 = 4, 0.80 = 3, 0.75 = 2, and 0.70 = 1). The comparative results of the indices from the experts were multiplied by the corresponding authority coefficients of the experts, and a weighted PC pattern could then be obtained. The calculated PC patterns of each expert were combined, and a multi-input-weighted PC pattern was further derived. Through organization and statistical analysis, the weights of the level-1 indices were finally determined. Meanwhile, the experts’ scores for the importance of level-2 indices were divided by the total scores of all level-2 indices under the level-1 index, and the weight coefficients of the level-2 indices were derived. Both the weight coefficients of the level-1 and level-2 indices were multiplied to obtain a proportion of the relevant level-2 indices in all level-2 indices, which corresponded to the weight combination.

3.3. Evaluation System of Sustainability of Urban Spatial Development Based on System Coupling

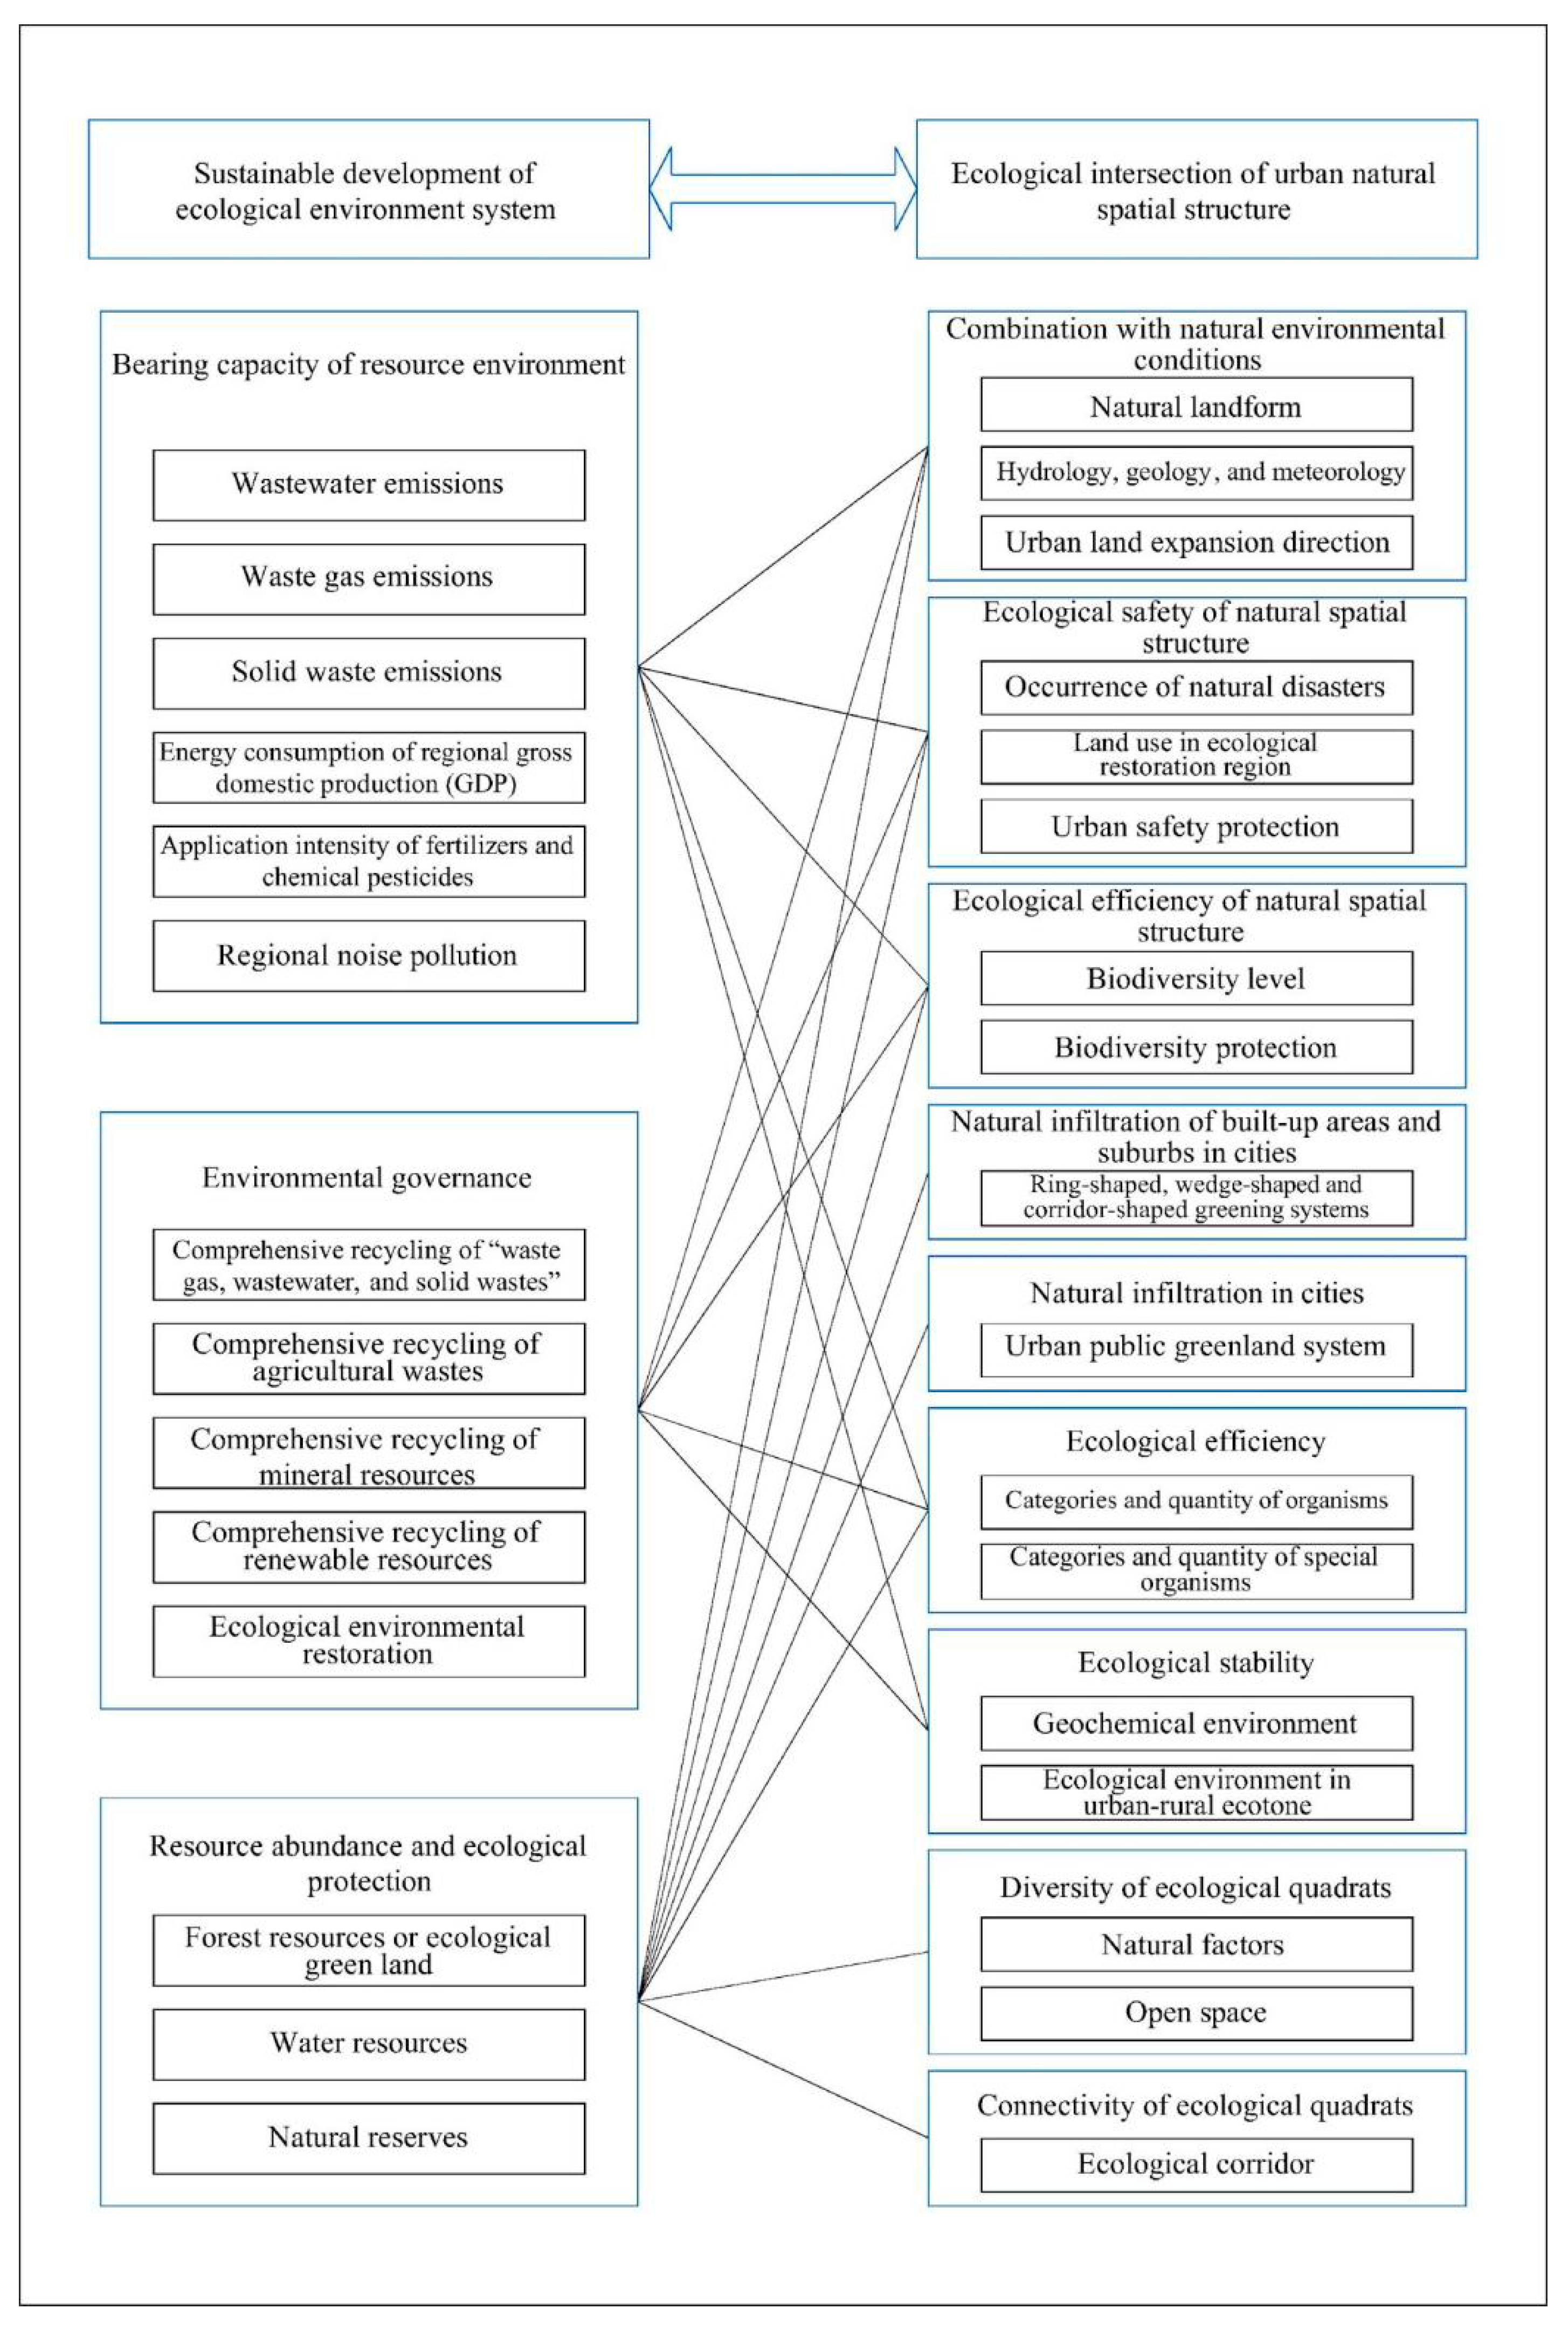
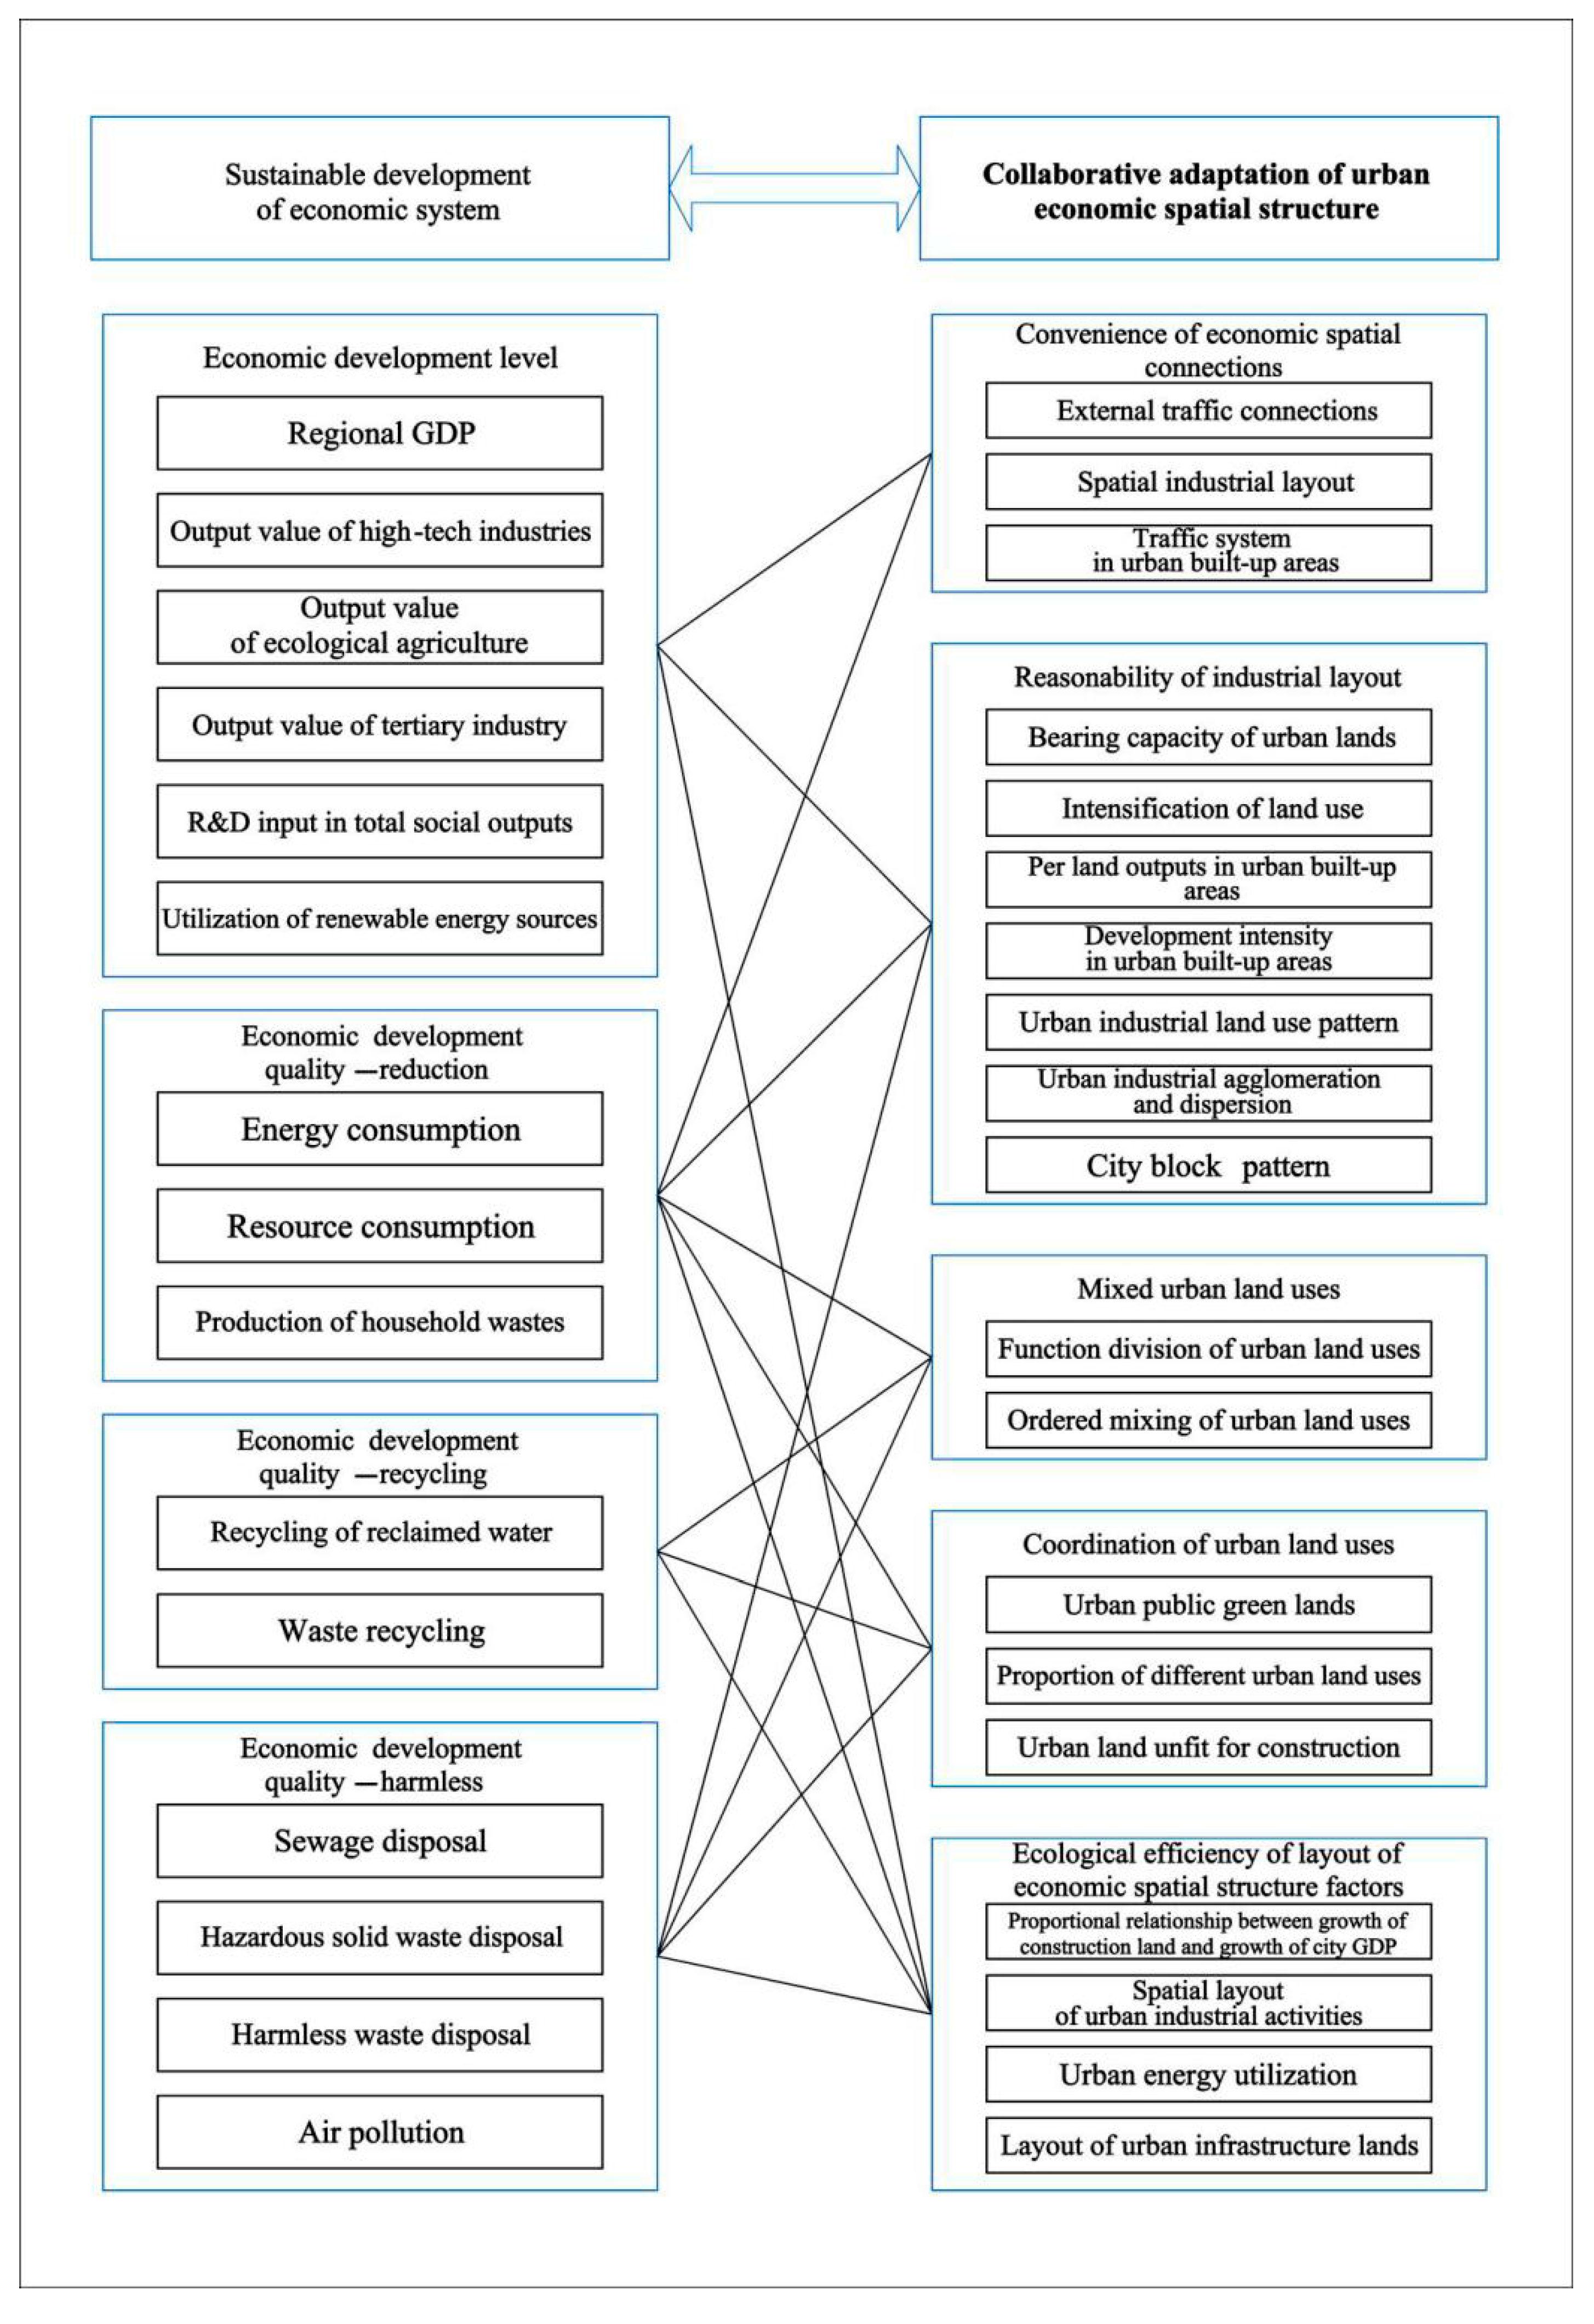
3.3.1. Coupling Relations between Urban Spatial Structural Factors and Sustainable Development Factors

The direct purpose of sustainable urban spatial development is to realize a balanced development of protection and growth by controlling and guiding urban ecology and the structural relation between economic and social systems. Establishing the coupling relations between the urban spatial structure and sustainable development factors can lay a foundation for the selection of target factors and the analysis of an index set for the evaluation systems.

Sustainable Urban Development Factors

Sustainable development advocates that economic development should be fully cautious about the carrying capacity of natural resources, which is not only a development strategy, but also a development goal within a predictable period. Its goal is summarized as the relationship among economy, society, and environment. Although this development concept is progressive, it has not formed a global action to reverse the traditional development model in practice. Since the 21st century, climate change has become a potential threat to countries worldwide. The goal of world economic development is to improve welfare and social equity, and reduce environmental and ecological risks. In June 2012, the Conference on Sustainable Development proposed the theme of “green economy”. Green economy is an economic way to reduce environmental risks and promote the overall development of society. Therefore, various countries began to pay attention to strong sustainable development with “non-reduction of natural capital” as the goal, and formed the consensus of green city in urban development. A sustainable development evaluation system with the perspective of green urbanism covers the following factors: ecological environmental subsystem, economic subsystem, and social subsystem. In this study, a statistical analysis of the different indices is carried out, and the sustainable urban development factors were determined according to statistics of the index settings (Table 2).

Urban Spatial Structural Factors

The connotation of urban spatial development is to reach the overall coordination of urban ecological space, economic space, and social space through artificial efforts. Urban spatial development is reflected by the ecological interaction of urban–natural spatial structures, adjustment and perfection of the economic spatial structure, and evolutionary updating of the social–spatial structure. The connotation of urban spatial development is also characterized by the evolution of the overall urban spatial structure. The urban spatial structural factors in the present study are thus analyzed and determined on the basis of the connotations of urban spatial development, as shown in Table 3.

Coupling between Urban Spatial Structural Factors and Sustainable Urban Development Factors

On the basis of the interpreted connotations of urban spatial development, the ecological environment system, economic system, and social system in the context of sustainable development purpose can then be used to represent the ecological interaction of urban–natural spatial structures, collaborative adjustment of economic spatial structures, and evolutionary updating of social–spatial structures, respectively. Their coupling relations are established.
In the sustainable development of the ecological environmental system, the resource abundance and ecological protection purpose is mainly closely related to the ecological interaction of urban–natural spatial structures. The continuity of natural spaces and the ecological efficiency of natural and artificial environmental edges exert prominent influences on the sustainable development purpose of ecological environmental systems (Figure 1).
In the sustainable development of the economic system, the purpose of economic development quality (including reduction) is mostly closely related to urban economic spatial structures. For an urban spatial structure, the factors on the reasonability of industrial layout, the mixing and coordination of urban land uses, and the ecological efficiency of economic spatial structural layout exert relatively prominent influences on the sustainable development purpose of the economic system (Figure 2).
In the sustainable development of the social system, infrastructure is closely related to urban management, realization of green investment for social development, and evolutionary updating of urban social–spatial structures. For an urban spatial structure, the matching between population size and spatial scale and the convenience of using urban spatial resources are the primary influencing factors of the sustainable development purpose of the social system. The evolutionary updating of urban social–spatial structures can significantly influence the realization of the purpose of green investment purpose for social development (Figure 3).
The comprehensive function of the urban spatial development factors can lead eventually to the evolution of the overall urban spatial structures. The sustainable urban spatial development purpose needs to pay special attention to the development purposes of the ecological environmental system and the economic system. Moreover, an adaptation between urban spatial scale and natural environmental capacity and the spatial–temporal coordination of urban spatial structures are important directions of sustainable urban development (Figure 4).
In view of the connections between the urban spatial structural factors and sustainable urban development factors, the urban ecological environment, land use, traffic network, and spatial layout can significantly promote sustainable urban development. The connection intensity and effective collaboration of these factors can influence directly the sustainable urban spatial development.
Sustainable development is to ensure that natural assets can provide various resources and environmental services for human happiness and promote the growth and development of social economy. The benefit analysis of land use in Qin-Ba mountain area shows that in the process of rapid urbanization, economic benefits become the main part of social development, and urban spatial growth ignores the environmental quality improvement of sustainable development. Therefore, the sustainable development of urban space should seek the coupling of economic benefits and ecological environmental benefits, and attach importance to the protection of cultivated land and the transformation of green economy. Therefore, within the framework of urban spatial structure, constructing the theoretical model between urban spatial elements and sustainable development elements is conducive to the transformation of urban space into a compact and efficient development mode.

3.3.2. Interpretation of Urban Spatial Structure Based on “Green Coordination”, “Green Development”, and “Green Sustainability”

An urban spatial organization of sustainable development is employed to construct a spatial structure of “ordered, efficient, coexisting, and sustainable” development and improve the ability of the urban spatial structure to self-organize organically, realize coordination and coexistence of urban spatial factors, and achieve a continuous dynamic optimization of various “flows”.
Spatial structures in sustainable development require a type of spatial organization that considers the coupling relations of different factors from the perspectives of urban ecological environmental construction, urban economic development, and urban social progress. This approach is manifested by the quality of the urban environment, quantity of economic development, and time dimension of social development. Therefore, this study aims to establish the “green coordination”, “green development”, and “green sustainability” of urban spaces, thereby reflecting the connotations of sustainable urban spatial structural development.

Interpretation of “Green Coordination” for Urban Spatial Structures

The sustainable development of urban spaces emphasizes the coexistence between urban space and nature, increase in quality of the urban environment, and improvements of the regional ecological environment. The connotation of “green coordination” for urban spaces can be summarized as having urban ecological spatial layouts, urban environmental safety, and urban environmental biodiversity maintenance. Spatial development is aimed at establishing a logical relationship between the overall urban space and the structural factors, thus realizing diversity and coexistence of overall urban spaces, improving the self-organizing ability, and reflecting the overall environmental quality of the urban spaces.

Interpretation of “Green Development” for Urban Spatial Structures

Urban production and life activities, in the perspective of sustainable development, not only are specific manifestations of urban settlement functions but should also reflect the performance of urban spaces in carrying out various natural and social energy flows. In an urban space system, the balance between the material and energy inputs and the product and waste outputs is realized through a metabolism in the energy flow process. “Green development” starts from various flow factors of an urban space system in the metabolism process and reflects the matching between the urban spatial development scale and social–economic development situations.
Energy efficiency, which is produced by various flow input and outputs in an urban metabolism system, can reflect the dynamic foundations of urban green development and prevent cities from being at risk of high-emission and high-pollution environmental conditions. The high-efficiency resource and energy utilization of an urban metabolic system is reflected by the mutual association and cooperation of urban space elements. Urban productivity and living quality can be improved, and the transition from a blind low-efficiency expansion of an urban space to a rational sustainable development can be promoted.

Interpretation of “Green Sustainability” for Urban Spatial Structures

On the basis of comprehensive consideration of the social progress level in cities, “green sustainability” is used to determine whether establishing a spatial structure can be achieved along with the matching between urban spatial layout and functions, in which the “environment—economy—society” chain is combined from the perspectives of population quality level, infrastructure perfection, healthy living mode, and social management efficiency. This approach can reflect the time dimension requirements that demonstrate the ability and potential of sustainable urban spatial development, and it can realize the updating from a quantitative expansion to quality changes in urban spatial structures.

3.3.3. Evaluation System for Sustainable Urban Spatial Development

Relevant indices were selected on the basis of the coupling relation between urban spatial structure and sustainable urban development. The target factor set of sustainable urban spatial development was determined by sending questionnaire surveys to experts.
The selection of the target factor set was divided into the primary selection stage and the refined selection stage. The primary selection stage was based on the review analysis of associated and repeatable index systems implemented worldwide, while similar indices and other indices that cannot be operated at the urban space level were eliminated with reference to the valuable indices found in a sustainable development index system. The rest of the associated indices were used to form the primary factor set, which was based on the coupling relation between urban spatial structural factors and sustainable urban development factors. Subsequently, the factors conforming with the sustainable urban spatial development purpose for the Qin-Ba mountain area were selected, and different local land use statuses were combined. In this study, 200 questionnaires were sent to experts of urban–rural planning and administrative staff and practitioners of environmental protection and ecology. The indices in the primary selection scope were determined on the basis of the PC method, and they were used as the factor set of the sustainable urban spatial development purpose system. The purpose layer was composed of a prior purpose (ecological environment system), a key purpose (economic system), and a supporting purpose (social system). The quantitative indices concerned with green coordination, green development, and green sustainability were applied. The following 10 factors were considered: biodiversity protection, ecological space construction, urban environmental safety, economic development level, intensive land use, economic development quality, population quality level, infrastructure perfection, healthy mode of life, and social management efficiency. The index layer covered 33 indices (Table 4).

3.3.4. Evaluation Process of Sustainable Urban Spatial Development

Step 1: Two hundred experts were invited to score different evaluation indices with reference to the steps to be implemented in this research. Then, a comprehensive evaluation was carried out, and a judgment matrix was constructed for the scale comparison (1 to 9). Fourteen matrixes were constructed and arranged in order to obtain the weights of the single sequences. The fourteen matrixes are P A 1 - A 3 , A 1 B 1 - B 3 , A 2 B 4 - B 6 , A 3 B 7 - B 10 , B 1 C 1 - C 2 , B 2 C 3 - C 9 , B 3 C 10 - C 15 , B 4 C 16 - C 17 , B 5 C 18 - C 22 , B 6 C 23 - C 26 , B 7 C 27 , B 8 C 28 - C 29 , B 9 C 30 - C 31 , B 10 C 32 - C 33 .
Take the matrix P A 1 - A 3 as an example.
P A 1 - A 3 = ( 1 3 5 1 / 3 1 3 1 / 5 1 / 3 1 )
The eigenvector W = [ 0.636986 , 0.258285 , 0.104729 ] T of the judgment matrix P A 1 - A 3 is calculated. The maximum characteristic root ( λ max ) of P A 1 - A 3 is 3.038511, which passes the consistency check. Similarly, the obtained C R A 1 - A 3 = C I R I = 0.0192555 0.58 = 0.033199 < 0.1 passes the test.
The list of eigenvectors of P A 1 - A 3 can then be obtained, as shown in Table 5.
Step 2: The results of the different single-sequenced layers were obtained with references to the abovementioned calculation process. The weight of A to P is W A i ( i = 1 , 2 , 3 ). The weight of B to A is W B i ( i = 1 , 2 ,     , 10 ). The weight of C to B is W C i ( i = 1 , 2 ,     , 33 ). After performing a consistency test of all the 14 matrixes, the weights of the indices of the purpose system can then be obtained, as shown in Table 6.
Step 3: The evaluation indices of the sustainable urban spatial development purposes included a forward-purpose trend and a backward-purpose trend. The purpose index was calculated as follows. If the practical value of, C-i index is X-i, then its standard value and evaluation purpose index are, Y-i and P-i If the forward index uses “qualification” as the standard value, then, P-i = 1 when X-iY-i, whereas, P-i = X-i/, Y-i, when X-i < Y-i If the backward index uses “qualification” as the standard value, then, P-i = 1 when X-iY-i, whereas, P-i = Y-i/, X-i when X-i > Y-i. Moreover, the urban spatial system needs to be considered comprehensively. Thus, the comprehensive purpose value of each single index was calculated. The calculation formula is:
P = i = 1 n P i × W i
where P is the comprehensive purpose evaluation value, n is the number of indices, P i is the purpose index of the various indices, and W i represents the weights of the different indices. Higher scores of P reflect better green development situations of urban spaces, suggesting that sustainable urban spatial development is closer to the purpose. The calculated results are shown in Table 7.

4. Result Analysis and Discussion

4.1. Case Study

Shangluo City is located in the Qin-Ba mountain area in the southern region of Shaanxi Province. The city has an urban construction land scale of 24.21 km2 and a per capita construction land area of 99.38 m2/person. From 1990 to 2015, the total urban land area in the downtown area increased 4.38 times, from 5.53 km2 to 24.21 km2, indicating a rapid urban economic development resulting from the rapid expansion of the urban construction land area. The proportion of the industrial land area decreased year by year, whereas the proportion of the residential land area increased continuously from 1990 to 2009 and stabilized thereafter. The population of Shangluo City increased from 52,000 in 1990 to 243,600 in 2014. At that time, the per capita construction land area experienced a development stage from significant shrinking to reasonable growth. From 1990 to 2000, a mismatch between urban construction land area growth and population growth was observed. Urban construction land growth was compensated from 2000 to 2010, and the urban construction land scale tended to be stable after 2010.
The evaluation experts in this research were composed of 52 urban–rural planning experts, 34 environmental protection experts, 18 ecological experts, 26 urban construction managers, and 70 urban residents. After a careful analysis of the urban spaces, the evaluation group was instructed to assess 33 indices. On the basis of the characteristics of the PC method, the evaluators were asked to give satisfaction scores (A) and dissatisfaction scores (B) in addition to their assessment information as a means of preventing any missing data that might be caused by the different scales. A and B took the form of integers in the range of 0 to 10; thus, 0 ≤ A + B ≤ 10. A total of 200 questionnaires were collected, including 194 effective ones. The data of the evaluation group were through the matrix method. Finally, evaluation information about sustainable urban spatial development in Shangluo City was determined according to a voting model [40].
In consideration of the composition of the evaluation system on sustainable urban spatial development, ecological space construction and urban environmental safety (green coordination), intensive land use (green development), and infrastructure perfection (green sustainability) were selected as the major investigation factors, and the relations of the sustainable urban spatial development factors were analyzed. Among the indices of these factors, population density sequence ( x 0 ( k ) sequence) in the downtown area was used as the mother factor sequence. The following sequences were chosen as the sub-factor sequences: proportion of cultivated area ( x 1 ( k ) sequence), proportion of forestry area ( x 2 ( k ) sequence), greening rate of built-up areas ( x 3 ( k ) sequence), green coverage ratio of built-up areas ( x 4 ( k ) sequence), per capita green land area ( x 5 ( k ) sequence), harmful disposal of household wastes ( x 6 ( k ) sequence), total industrial wastewater emission density ( x 7 ( k ) sequence), total industrial dust emission density ( x 8 ( k ) sequence), proportion of construction land area ( x 9 ( k ) sequence), average volume fraction of residential areas ( x 10 ( k ) sequence), per capita urban construction land area ( x 11 ( k ) sequence), proportion of industrial land use ( x 12 ( k ) sequence), coverage rate within 500 m of bus stations ( x 13 ( k ) sequence), and coverage rate of accessible public service facilities in 5 min ( x 14 ( k ) sequence). Gray association analysis was carried out for the relations between the main factor sequence and the sub-factor sequences [41], and the influences of the different factors on sustainable urban spatial development were investigated. The association degrees of the various index factors were calculated. The results are shown in Table 8.

4.2. Result Analysis

According to the calculated results obtained from the association degree analysis, the sub-factor on proportion of industrial land use mainly influenced sustainable urban spatial development among all of the 14 index factors. As for the rest of the index factors, per capita green land area and green coverage ratio of built-up areas, per capita urban construction land area, proportion of forestry area, greening rate of built-up areas, total industrial dust emission density, proportion of cultivated area, and average volume fraction of residential areas were secondary influencing factors of sustainable urban spatial development. However, coverage rate within 500 m of bus stations, coverage rate of accessible public service facilities in 5 min, harmful disposal of household wastes, proportion of construction land area, and total industrial wastewater emission density could also have influenced sustainable urban spatial development but only slightly.
Moreover, this study found that the proportion of industrial land use was the primary influencing factor in the proposed evaluation system. This finding was verified by the urban residents and the expert groups. In addition to the influences of the natural environment on cities, we found that industrial enterprises could neither properly follow the pollution emission standards nor regularly check and repair their pollutant disposal facilities. Therefore, education and training on environmental protection need to be strengthened among the industrial enterprises, towards instilling environmental awareness among urban residents [42] and accomplishing a gradual independence from the fossil fuels based on ongoing exploitation of renewable energy sources [43]. The indices of proportion of forestry area and proportion of cultivated area reflected the coordinated development of urban and rural areas. Restricted by the natural environment, the city scale of Qin-Ba mountain area is small. The rural economic development is relatively backward, the cultivated land area is insufficient, and the industrial mode is single. This shows that the government should consider the coordinated development of urban and rural integration in the formulation of sustainable development policies, and give more support policies to the ecological agricultural production. In summary, the consistency between evaluation results and practical situations verifies the feasibility and validity of the proposed evaluation system for sustainable urban [44] and rural spatial development [45].

5. Conclusions

The existing evaluation of sustainable urban spatial development has some limitations, which may cause the non-completion of evaluation results. The reasonability and accuracy of the evaluation results need to be protected from missing information. Thus, a comprehensive evaluation system for sustainable urban spatial development was proposed in this study. The feasibility and validity of the proposed system were verified by the case study of Shangluo City in the Qin-Ba mountain area. The major conclusions can be drawn as follows:
  • The evaluation system for sustainable urban spatial development based on system coupling can reflect and overcome the limitations of missing evaluation information. The system can also overcome the shortages of conventional sustainability evaluation systems, as they cannot be applied directly to urban spatial development.
  • The evaluation system was constructed with the three aspects of “green coordination”, “green development”, and “green sustainability” of sustainable urban spatial development, and it complements the evaluation contents of urban–rural ecological space coordination, land resource protection, and green development community, and so on.
  • The results of the proposed evaluation system conformed with practical urban spatial development situations. Among the investigated 14 indicators, the proportion of industrial land use mainly influenced sustainable urban spatial development. As for the rest of the index factors, per capita green land area and green coverage ratio of built-up areas, per capita urban construction land area, proportion of forestry area, greening rate of built-up areas, total industrial dust emission density, proportion of cultivated area, and average volume fraction of residential areas were the secondary influencing factors of sustainable urban spatial development. This study can provide a feasible and effective evaluation system for sustainable urban spatial development.
  • The proposed evaluation system can be used to assess the urban spatial development of regions with complicated characteristics, such as underdeveloped economies but abundant ecological capital.
The limitations of the study are reflected in the following two aspects. First, due to equipment, communication, and other reasons, abnormal data were generated in the system, and sometimes missing data; these factors had a certain impact on the quality of data. Second, there are many cities in Qin-Ba mountain area, and the urban sustainable development policies of different administrative regions were diverse. Therefore, the linkage between an evaluation system and urban policy instruments is insufficient.
Compared with conventional evaluation techniques, the proposed evaluation system for sustainable urban spatial development can reflect comprehensively the sustainability of urban spatial development and provide decision-making references for managers aiming to achieve sustainable urban spatial development and urban–rural integration development. The evaluation method of sustainable urban spatial development depends on gray association analysis, but it lacks the full utilization of the Internet and big data. An exploration that combines the advantages of using machine learning will be considered in future studies.

Author Contributions

All authors contributed equally to this work. All authors have read and agreed to the published version of the manuscript.

Funding

This research was supported by the 2020 Key Research and Development Plan of Shaanxi Province (No. 2020SF-397).

Acknowledgments

We are indebted to the anonymous reviewers and editor.

Conflicts of Interest

The authors declare no conflict of interest.

References

  1. The BP Group. BP Statistical Review of World Energy; BP: London, UK, 2011. [Google Scholar]
  2. Pushpam, K. The Economics of Ecosystems and Biodiversity: Ecological and Economic Foundations; UNEP/Earth print: Nairobi, Kenya, 2012. [Google Scholar]
  3. Al-hagla, K.S. Sustainable urban development in historical areas using the tourist trail approach: A case study of the Cultural Heritage and Urban Development (CHUD) project in Saida, Lebanon. Cities 2010, 27, 234–248. [Google Scholar] [CrossRef]
  4. Hatami, A.; Firoozi, N. A dynamic stakeholder model: An Other-oriented ethical approach. Bus. Ethics Eur. Rev. 2019, 28, 349–360. [Google Scholar] [CrossRef]
  5. United Nations Environment Programme (UNEP). Towards a Green Economy: Pathways to Sustainable Development and Poverty Eradication; Report, United Nations Environment Programme: Nairobi, Kenya, 2011. [Google Scholar]
  6. Simpson, R.; Zimmermann, M. The Economy of Green Cities: A world Compendium on the Green Urban Economy; Springer: Dordrecht, The Netherlands, 2013. [Google Scholar]
  7. Martin, G. Assessing and managing sustainability in international perspective: Corporate sustainability across cultures–towards a strategic framework implementation approach. Int. J. Corp. Soc. Responsib. 2019, 4, 1–34. [Google Scholar]
  8. Lee, J.W.; Zhang, L.; Dallas, M.; Chin, H. Managing relational conflict in Korean social enterprises: The role of participatory HRM practices, diversity climate, and perceived social impact. Bus. Ethics Eur. Rev. 2019, 28, 19–35. [Google Scholar] [CrossRef] [Green Version]
  9. Bogadi, A. The prospects for ecosystem services provision in fragile states’ urban areas. Teh. Glas. 2018, 12, 44–49. [Google Scholar] [CrossRef]
  10. United Nations. Indicators of Sustainable Development Framework and Methodologies; United Nations: New York, NY, USA, 1996. [Google Scholar]
  11. Badiu, D.L.; Loja, C.; Patrorscu, M.; Breuste, J.; Artmann, M.; Nita, M.R.; Gradinaru, S.R.; Hossu, C.A.; Onose, D.A. Is urban green space per capita a valuable target to achieve cities’ sustainability goals? Romania as a case study. Ecol. Indic. 2016, 70, 53–66. [Google Scholar] [CrossRef]
  12. Kuai, P.; Li, W.; Cheng, R.; Cheng, G. An application of system dynamics for evaluating planning alternatives to guide a green industrial transformation in a resource-based city. J. Clean. Prod. 2015, 104, 403–412. [Google Scholar] [CrossRef]
  13. Wolch, J.R.; Byrne, J.; Newell, J.P. Urban green space, public health, and environmental justice: The challenge of making cities ‘just green enough’. Landsc. Urban Plan. 2014, 125, 234–244. [Google Scholar] [CrossRef] [Green Version]
  14. Searn, M. The evolution of greenways as an adaptive urban landscape form. Landsc. Urban Plan. 1995, 33, 1–3. [Google Scholar] [CrossRef]
  15. Shirvani Dastgerdi, A.; Sargolini, M.; Broussard Allred, S.; Chatrchyan, A.; De Luca, G. Climate Change and Sustaining Heritage Resources: A Framework for Boosting Cultural and Natural Heritage Conservation in Central Italy. Climate 2020, 8, 26. [Google Scholar] [CrossRef] [Green Version]
  16. Dastgerdi, A.S.; Sargolini, M.; Pierantoni, I. Climate Change Challenges to Existing Cultural Heritage Policy. Sustainability 2019, 11, 5227. [Google Scholar] [CrossRef] [Green Version]
  17. Wang, Y.Q. The Path Selection of Urban Green Development in China. J. Hebei Univ. Econ. Trade 2014, 3, 51–53. [Google Scholar]
  18. Shi, M.J.; Liu, Y.Y. Urban Green Development: An International Comparison and Perspective of Problems. Urban Dev. Stud. 2013, 5, 140–145. [Google Scholar]
  19. Zheng, C.D.; Ma, K.; Su, J.R. Assessment of Ecological and Livable City Based on the Satisfaction of the Residents. Stat. Decis. 2014, 5, 64–66. [Google Scholar]
  20. Matthew, K.E. Green Cities: Urban Growth and the Environment; Brookings Institution: London, UK, 2006. [Google Scholar]
  21. Wang, Y.X.; Liang, J.Y. The Evaluation Model of Eco-city: Construction and Application. Econ. Probl. 2011, 10, 126–129. [Google Scholar]
  22. Li, T. Research on Fuzzy Mathematics Evaluation of Urban Low Carbon Economy. Chin. J. Manag. Sci. 2015, 23, 744–748. [Google Scholar]
  23. Economic Intelligence Unit. Asian Green City Index: Assessing the Environmental Performance of Asia’s Major Cities; Siements A G: London, UK, 2011. [Google Scholar]
  24. Richardson, E.A.; Mitchell, R.; Hartig, T.; de Vries, S.; Astell-Burt, T.; Frumkin, H. Green cities and health: A question of scale? J. Epidemiol. Community Health 2012, 66, 160–165. [Google Scholar] [CrossRef] [Green Version]
  25. Lee, J.H.; Hancock, M. Toward a framework for smart cities: A comparison of Seoul, San Francisco and Amsterdam. In Proceedings of the Smart Green Cities Conference on Innovations for Smart Green Cities: What’s Working, What’s Not, What’s Next, Stanford Business School, Palo Alto, CA, USA, 26–27 June 2012. [Google Scholar]
  26. William, E.S.; Lucianetti, L. Machiavellianism, stakeholder orientation, and support for sustainability reporting. Bus. Ethics Eur. Rev. 2018, 27, 272–285. [Google Scholar]
  27. Li, X.X.; Pan, J.C. Compilation of China Green Development Index-A Brief Introduction to the Annual Report of China Green Development Index 2010-Provincial Comparison Review of Economic Research. Rev. Econ. Res. 2011, 2, 36–64. [Google Scholar]
  28. Wang, W.J.; Zhao, R.X.; Chuai, X.W.; Gao, S. Evaluation Index System of Green Nanjing City Construction. Areal Res. Dev. 2012, 31, 62–66. [Google Scholar]
  29. Du, Y.Z. The Research on the Appraisal of Coordinated Development of Green City Xiamen Based on PRED; Fujian Agriculture and Forestry University: Fujian, China, 2010; pp. 32–41. [Google Scholar]
  30. Zhu, B.; Yao, Q.Q. Comprehensive Evaluation and Thinking Analysis of Green City Development in Fujian Province. Dev. Res. 2013, 11, 24–31. [Google Scholar]
  31. Beijing Municipal Commission of Development and Reform. The Development and Construction Plan of Green Beijing During the Twelfth Five-Years Plan Period in Beijing; Beijing Municipal People’s Government: Beijing, China, 2016.
  32. Shlafman, N.; Frolina, K.; Gotal Dmitrovic, L. Modeling for the analysis of the investment potential of the construction sector. Teh. Glas. 2018, 12, 236–243. [Google Scholar] [CrossRef]
  33. Cai, H.G. Coupling Analysis of Traffic and Tourism in Yunnan Border Region and Its Driving Mechanism; Yunnan Normal University: Yunnan, China, 2019; pp. 78–86. [Google Scholar]
  34. Gandarias, N.T.; Ramon, J.; Olasok, O. A Novel Method for Strategic Decision Making Based on Project Management Maturity. DYNA 2019, 94, 75–81. [Google Scholar]
  35. Ren, X.P. The Analysis of the Spatial and Temporal Evolution of the Coupling Coordination between the Regional Urban Behavior and the Environment in China. Ecol. Econ. 2018, 34, 158–163. [Google Scholar]
  36. Li, X.M. Coupled Analysis of the Social-Economic Development and Resource Environment in Wuhan City. In Information Engineering Research Institute, USA. Proceedings of 2012 4th International Conference on Environmental Science and Information Application Technology (ESIAT 2012), Bali, Indonesia, 1 December 2012; Information Engineering Research Institute: Texas City, TX, USA, 2012; pp. 213–218. [Google Scholar]
  37. Mandolini, M.; Favi, C.; Germani, M. An Analytic Hierarchy Method for Anticipating the Selection of the Supplying Strategy at the Design Stage. DYNA 2019, 94, 161–167. [Google Scholar] [CrossRef] [Green Version]
  38. Lu, K.P.; Chang, S.T. Detecting change-points for shifts in mean and variance using fuzzy classification maximum likelihood change-point algorithms. J. Comput. Appl. Math. 2016, 308, 447–463. [Google Scholar] [CrossRef]
  39. Tasias, K.A.; Nenes, G. A variable parameter Shewhart control scheme for joint monitoring of processmean and variance. Comput. Ind. Eng. 2012, 63, 1154–1170. [Google Scholar]
  40. Chen, L.-H.; Hung, C.-H.; Tu, C.-C. Considering the decision maker’s attitudinal character to solve multi-criteria decision-making problems in an intuitionistic fuzzy environment. Knowl. Based Syst. 2012, 36, 129–138. [Google Scholar] [CrossRef]
  41. Safari, A.; Salehzadeh, R.; Panahi, R.; Abolghasemian, S.; Goverance, C. Multiple pathways linking environmental knowledge and awareness to employees′ green behavior. Corp. Gov. Int. J. Bus. Soc. 2018, 18, 81–103. [Google Scholar] [CrossRef]
  42. Ntanos, S.; Kyriakopoulos, G.; Skordoulis, M.; Chalikias, M.; Arabatzis, G. An application of the new environmental paradigm (NEP) scale in a Greek context. Energies 2019, 12, 239. [Google Scholar] [CrossRef] [Green Version]
  43. Arabatzis, G.; Kyriakopoulos, G.; Tsialis, P. Typology of regional units based on RES plants: The case of Greece. Renew. Sustain. Energy Rev. 2017, 78, 1424–1434. [Google Scholar] [CrossRef]
  44. Ntanos, S.; Kyriakopoulos, G.; Chalikias, M.; Arabatzis, G.; Skordoulis, M.; Galatsidas, S.; Drosos, D. A social assessment of the usage of Renewable Energy Sources and its contribution to life quality: The case of an Attica Urban area in Greece. Sustainability 2018, 10, 1414. [Google Scholar] [CrossRef] [Green Version]
  45. Kolovos, K.G.; Kyriakopoulos, G.; Chalikias, M.S. Co-evaluation of basic woodfuel types used as alternative heating sources to existing energy network. J. Environ. Prot. Ecol. 2011, 12, 733–742. [Google Scholar]
Figure 1. Coupling relation between sustainable development of ecological environmental system and urban–natural spatial structural factors.
Sustainability 12 05703 g001
Figure 2. Coupling relation between sustainable development of economic system and urban economic spatial structural factors.
Sustainability 12 05703 g002
Figure 3. Coupling relation between sustainable development of social system and urban social–spatial structural factors.
Sustainability 12 05703 g003
Figure 4. Coupling relation between sustainable development and evolution of overall urban spatial structure.
Sustainability 12 05703 g004
Table 1. Schematic diagram of the precedence chart (PC) method.
Comparison IndicesN1N2N3N4N5Nn
N1
N2
N3
N4
N5
Nn
Table 2. Sustainable urban development factors.
Sustainable Development PurposesSustainable Development ConnotationsSustainable Development Factors
Green development of ecological environmental systemBearing capacity of resource environmentWastewater emissions
Waste gas emissions
Solid waste emissions
Energy consumption of regional gross domestic production (GDP)
Application intensity of fertilizers and chemical pesticides
Regional noise pollution
Environmental governanceComprehensive recycling of “waste gas”, “wastewater”, and “solid wastes”
Comprehensive recycling of agricultural wastes
Comprehensive recycling of mineral resources
Comprehensive recycling of renewable resources
Ecological environmental restoration
Resource abundance and ecological protectionForest resources or ecological green land
Water resources
Natural reserves
Green development of economic systemEconomic development levelRegional GDP
High-tech industries
Ecological agriculture
Tertiary industry
R&D
Utilization of renewable energy sources
Economic development qualityReductionEnergy consumption
Resource consumption
Production of household wastes
RecyclingRecycling of reclaimed water
Waste recycling
HarmlessSewage disposal
Hazardous solid waste disposal
Harmless waste disposal
Air pollution
Green development of social systemPopulation quality levelQuality of employees in tertiary industry
Education development
Professional technicians
Infrastructure and urban managementPublic green lands
Public transport
Municipal water
Green marking system
Policies of green social developmentPolicies of environmental protection
Policies of science, education, culture, and health development
Policies of social insurance and employment
Table 3. Urban spatial structural factors.
Connotation of Urban Spatial DevelopmentSpatial Structural FeaturesSpatial Structural Development PurposesSpatial Structural Factors
Ecological intersection of urban–natural spatial structuresContinuity of natural spaceCombination with natural environmental conditionsNatural landform
Hydrology, geology, and meteorology
Urban land expansion direction
Ecological safety of natural spatial structureOccurrence of natural disasters
Land use in ecological restoration region
Urban safety protection
Ecological efficiency of natural spatial structureBiodiversity level
Biodiversity protection
Spatial infiltration of natural and artificial environmentsNatural infiltration of built-up areas and suburbs in citiesRing-, wedge-, and corridor-shaped greening systems
Natural infiltration in citiesUrban public green land system
Ecological efficiency of natural and artificial environmental edgesEcological efficiencyCategories and quantity of organisms
Categories and quantity of special organisms
Ecological stabilityGeochemical environment
Ecological environment in urban–rural ecotone
Spatial association of urban ecological quadratsDiversity of ecological quadratsNatural factors
Open space
Connectivity of ecological quadratsEcological corridor
Collaborative adaptation of urban economic spatial structureConnections of urban economic spacesConvenience of economic spatial connectionsExternal traffic connections
Spatial industrial layout
Traffic system in urban built-up areas
Reasonability of industrial layout and land use intensityReasonability of industrial layoutBearing capacity of urban lands
Intensification of land use
Per land outputs in urban built-up areas
Development intensity in urban built-up areas
Urban industrial land use pattern
Urban industrial agglomeration and dispersion
City block pattern
Diversity of land functional layoutMixed urban land usesFunction division of urban land uses
Ordered mixing of urban land uses
Spatial coordination of land use structuresCoordination of urban land usesUrban public green lands
Proportions of different urban land uses
Urban land unfit for construction
Ecological efficiency of layout of economic spatial structural factorsEcological efficiency of layout of economic spatial structural factorsProportional relationship between growth of construction land and growth of city GDP
Spatial layout of urban industrial activities
Urban energy utilization
Layout of urban infrastructure lands
Evolutionary updating of urban social–spatial structureConsistency between population size and spatial scaleMatching between population size and spatial scalePer capita land area
Per capita living space
Reasonability of public service facility layoutConvenience of using urban spatial resourcesLayout of public service facilities
Open urban spaces
Urban traffic network
Ecology of urban trafficUrban public transit system
Urban slow-moving traffic system
Urban roads and squares
Organic combination of living space differentiation and mixingAvoiding social contradictionsLayout of urban residential lands
Layout of urban affordable housing lands
Service facility configuration in residential areas
Continuity of spatial forms in historical sectionsInheritance of urban historical cultural featuresUrban spatial texture
Urban historical and cultural heritage protection
Updating of historical sections and reconstruction of old city
Physical evolution of overall urban spatial structureAdaptation of urban spatial structureUrban spatial structure and inheritance of urban historical cultural featuresSimilarity between spatial structure and historical original pattern
Expansibility of urban spatial structureAdaptation between urban spatial scale and natural environmental capacityUrban population size
Urban land use scale
Urban industrial scale
Elasticity of urban spatial structureSpatial–temporal coordination of urban spatial structureEvolutionary time series of urban spatial structure
Urban development reserves
Reserved land for major infrastructure
Table 4. Evaluation system for sustainable urban spatial development in the Qin-Ba mountain area.
Purposes (P)Item Layer (A)Factor Layer (B)Index Layer (C)UnitConnotation of Indices
Sustainable urban spatial development (P)Ecological environmental protection (A1)Biodiversity protection (B1)Local woody plant index (C1)-Green coordination indices
Composite species index (C2)-
Ecological space construction (B2)Proportion of cultivated area (C3)%
Proportion of forestry area (C4)%
Greening rate of built-up areas (C5)%
Green coverage ratio of built-up areas (C6)%
Per capita green land area (C7)m2/person
Standard rate of road greening (C8)%
Naturalization rate of water line (C9)%
Urban environmental safety (B3)Control rate of total annual runoffs (C10)%
Ratio of high environmental air quality (C11)%
Total standard rate of acoustic environmental quality monitoring points and times in different functional areas (C12)%
Harmful disposal of household wastes (C13)%
Total industrial wastewater emission density (C14)t/km2·day
Total industrial dust emission density (C15)t/km2·year
Circular economic development (A2)Economic development level (B4)Per capita GDP (C16)RMB/personGreen development indices
Energy consumption per unit GDP (C17)Tons of standard coals/10,000 RMB
Intensive land use (B5)Proportion of construction land area (C18)%
Average volume fraction of residential areas (C19)-
Per capita urban construction land area (C20)m2/person
Population density (C21)person/km2
Proportion of industrial land use (C22)%
Economic development quality (B6)Proportion of renewable energy source consumption (C23)%
Recycled water utilization (C24)%
Sewage disposal rate (C25)%
Proportion of green buildings in newly constructed buildings (C26)%
Social progress (A3)Population quality level (B7)Education input (C27)%Green sustainability indices
Infrastructure perfection (B8)Coverage rate within 500 m of bus stations (C28)%
Coverage rate of accessible public service facilities in 5 min (C29)%
Healthy mode of life (B9)Sharing ratio of green travel (C30)%
Job–housing balance index (C31)%
Social management efficiency (B10)Proportion of environmental protection investment in GDP (C32)%
Residents’ satisfaction with urban ecological environment (C33)%
Table 5. Eigenvectors of the judgment matrix P A 1 - A 3 .
Sustainable Urban Spatial Development ( P A 1 - A 3 )Ecological Environmental Protection (A1)Circular Economic Development (A2)Social Progress (A3)Wi
Ecological environmental protection (A1)1350.6370
Circular economic development (A2)1/3130.2583
Social progress (A3)1/51/310.1047
λ max = 3.038511, CI = 0.0192555, RI = 0.58, CR = 0.033199.
Table 6. Weights of indices in the evaluation system for sustainable urban spatial development.
Purpose Layer (P)Item Layer (A)Factor Layer (B)Weight of Single SequencingWeight of Total SequencingIndex Layer (C)Weight of Single SequencingWeight of Total Sequencing
Sustainable urban spatial development (P)Ecological environmental protection (A1) 0.6370Biodiversity protection (B1)0.11720.0746Local woody plant index (C1)0.75000.0560
Composite species index (C2)0.25000.0187
Ecological space construction (B2)0.26840.1710Proportion of cultivated area (C3)0.03930.0067
Proportion of forestry area (C4)0.05980.0102
Greening rate of built-up areas (C5)0.20290.0347
Green coverage ratio of built-up areas (C6)0.27060.0463
Per capita green land area (C7)0.23130.0396
Standard rate of road greening (C8)0.10570.0181
Naturalization rate of water line (C9)0.09040.0154
Urban environmental safety (B3)0.61440.3914Control rate of total annual runoffs (C10)0.05240.0205
Ratio of high environmental air quality (C11)0.10230.0400
Total standard rate of acoustic environmental quality monitoring points and times in different functional areas (C12)0.02980.0117
Harmful disposal of household wastes (C13)0.17840.0698
Total industrial wastewater emission density (C14)0.39940.1563
Total industrial dust emission density (C15)0.23770.0930
Circular economic development (A2) 0.2583Economic development level (B4)0.09740.0252Per capita GDP (C16)0.25000.0063
Energy consumption per unit GDP (C17)0.75000.0189
Intensive land use (B5)0.33310.0860Proportion of construction land area (C18)0.16410.0141
Average volume fraction of residential areas (C19)0.40350.0347
Per capita urban construction land area (C20)0.28870.0248
Population density (C21)0.04950.0043
Proportion of industrial land use (C22)0.09420.0082
Economic development quality (B6)0.56950.1471Proportion of renewable energy source consumption (C23)0.07140.0105
Recycled water utilization (C24)0.51470.0757
Sewage disposal rate (C25)0.28100.0413
Proportion of green buildings in newly constructed buildings (C26)0.13290.0195
Social progress (A3) 0.1047Population quality level (B7)0.07140.0075Education input (C27)1.00000.0075
Infrastructure perfection (B8)0.51470.0539Coverage rate within 500 m of bus stations (C28)0.25000.0135
Coverage rate of accessible public service facilities in 5 min (C29)0.75000.0404
Healthy mode of life (B9)0.28100.0294Sharing ratio of green travel (C30)0.33330.0098
Job–housing balance index (C31)0.66670.0196
Social management efficiency (B10)0.13290.0139Proportion of environmental protection investment in GDP (C32)0.25000.0035
Residents’ satisfaction with urban ecological environment (C33)0.75000.0104
Table 7. Evaluation of sustainable urban spatial development situations.
No.FactorsTarget ValuesEvaluation Connotations
1Biodiversity protection0.0605Green coordination
2Ecological space construction0.1128
3Urban environmental safety0.3551
4Economic development level0.0193Green development
5Intensive land use0.0837
6Economic development quality0.1132
7Population quality level0.0050Green sustainability
8Infrastructure perfection0.0485
9Healthy mode of life0.0250
10Social management efficiency0.0093
Total0.8324Sustainable urban spatial development
Table 8. Association degrees of the index factors of sustainable urban spatial development in Shangluo City.
No.Connotation of IndicesIndex Factors of Green Urban Spatial DevelopmentNumerical Values
1Green coordinationProportion of cultivated area (%)0.7269
2Proportion of forestry area (%)0.7367
3Greening rate of built-up areas (%)0.7356
4Green coverage ratio of built-up areas (%)0.7830
5Per capita green land area (m2/person)0.8731
6Harmful disposal of household wastes (%)0.5536
7Total industrial wastewater emission density (t/km2·day)0.4820
8Total industrial dust emission density (t/km2·year)0.7346
9Green developmentProportion of construction land area (%)0.5215
10Average volume fraction of residential areas0.7251
11Per capita urban construction land area (m2/person)0.7474
12Proportion of industrial land use (%)0.9703
13Green sustainabilityCoverage rate within 500 m of bus stations (%)0.5926
14Coverage rate of accessible public service facilities in 5 min (%)0.5745

