Article

Assessment Model of End-of-Life Costs and Waste Quantification in Selective Demolitions: Case Studies of Nearly Zero-Energy Buildings

by
Eduardo Vázquez-López
1,*,
Federico Garzia
2,
Roberta Pernetti
2,
Jaime Solís-Guzmán
1 and
Madelyn Marrero
1
1
ArDiTec Research Group, Departament of Architectural Constructions II, Higher Technichal School of Building Engineering, Universidad de Sevilla, 41012 Seville, Spain
2
Institute of Renewable Energy, EURAC Research, 39100 Bolzano, Italy
*
Author to whom correspondence should be addressed.
Sustainability 2020, 12(15), 6255; https://doi.org/10.3390/su12156255
Submission received: 7 July 2020 / Revised: 30 July 2020 / Accepted: 31 July 2020 / Published: 3 August 2020

Abstract

:
Innovative designs, such as those taking place in nearly zero-energy buildings, need to tackle Life Cycle Cost, because reducing the impact of use can carry other collateral and unexpected costs. For example, it is interesting to include the evaluation of end-of-life costs by introducing future activities of selective dismantling and waste management, to also improve the environmental performance of the demotion project. For this purpose, it is necessary to develop methods that relate the process of selective demolition to the waste quantification and the costs derived from its management. In addition, a sensitivity analysis of end-of-life parameters allows different construction types, waste treatment options, and waste management costs to be compared. The assessment of end-of-life costs in the present work is developed by a case-based reasoning. Cost data are obtained from three actual studies which are part of the H2020 CRAVEzero project (Cost Reduction and Market Acceleration for Viable Nearly Zero-Energy Buildings). Results show that end-of-life costs are similar to traditional building typologies. The most influential materials are part of the substructure and structure of the building, such as concrete and steel products.

1. Introduction

The study of the life cycle of buildings has generally focused first on the use phase. Studies about hotels’ performance consider that this phase can represent between 70%–80% of the total life cycle energy consumption [1] and 80–90% of CO2 emissions [2]; in the case of residential typology, building operation phase consume between 81–94% of total energy of life cycle and 75–90% of CO2 emissions [3]. Once the use phase analysis is delimited, it is then focused on the construction phase. In this stage, studies have been centered on the manufacture of construction products and the building construction itself, which last a relatively short period of time (1–2 years) but cause a very high environmental impact. This is largely due to the intensive use of concrete and steel for the construction of building structures, which represent a very high percentage of the CO2 emissions generated [4,5]. For instance, Du et al. computed embodied energy to be equal 4.9% of the total life cycle energy of building. This value was due to covering only the initial embodied energy of the building [6].
However, it is also important to evaluate the whole life cycle of buildings, including end-of-life, mainly related to demolition and waste management. Rosselló-Batle et al. [1] calculated that around 40–50% of the whole energy of this stage is used to demolish the structure of the building, and to transport construction and demolition waste (CDW), which is between 16–32%. The authors also asserted that this result is highly dependent on the distance travelled to the disposal or recycling plant. In the European Union, Michailidou et al. [7] highlighted the data unavailability to perform end-of-life studies. Marrero et al. [8] analyzed urbanization and demolition phases and concluded that both generate 90% of CDW of whole life cycle; the former is due to earthworks and the latter is due to the elimination of all buildings materials.
A building’s end-of-life takes place when it is considered out of service [9], implies a total demolition, selective or not, and includes all its processes and waste management [10,11]. Most building materials are considered waste in this phase [12]. As defined in the EN-16627 standard, End-of-Life Cost (EOLC) includes deconstruction/demolition, transport, waste processing for reuse or recycle, and waste disposal [11].
Several studies related to EOLC can be found in the literature. Islam et al. [13] did a complete review of Life Cycle Assessment (LCA) and Life Cycle Cost (LCC) on residential buildings. Practical models and systems of LCA and LCC also were analyzed. The main limitation of the case studies was that EOLC was not studied in detail. Dwaikat and Ali [14] carried out LCC analysis for a sustainable building and how to identify and use LCC variables to perform the assessment, considering a useful life of 60 years. In that case, a deeper study about EOLC was developed. Pelzeter [15] tried to demonstrate that the optimization of the results obtained with the LCC analysis largely depended on the assumptions that were made during the calculation process of LCC, but in this study, EOLC were not determined.
EOLC are important for the construction sector because they can incorporate the concept of life cycle from the design, in order to promote good practices such as reuse and recycling in selective demolition works or on-site separation processes for the proper treatment of CDW. Recent European regulations related to the management of CDW include the concept of circular economy, which focused on the waste hierarchy: Reduce, reuse, and recycle [16]. Dismantling or selective demolition are therefore promoted [17], for example, through the Green Public Procurement Program developed by the European Union.
Furthermore, the European legislation about public procurement has considered since 2014 that the LCC evaluation is necessary to find the most advantageous economical tender [18]. In the most important standards, LCC is normally divided into four stages, that is, construction, operation, maintenance, and end-of-life [10], thus allowing, in Net Present Value (NPV) terms, different options of building design to be compared.
To determine the EOLC of new building designs, the definition of a quantification method of the materials making up the building is required. Furthermore, its corresponding costs should be known. Other important aspects to incorporate in the assessment of end-of-life cost are the identification of technological and administrative barriers to adequately manage CDW, which is widely studied by the environmental community [19,20,21]. To analyze the waste generation processes in construction, quantification procedures should be defined. A recent piece of research divides these procedures into six categories, namely site visit, generation rate calculation, lifetime analysis, classification system accumulation (CSA), variables modelling, and others particular methods [22].
The cumulative systems are the most used in the literature [23,24,25]. In these methods, a construction works classification system is essential; this system is the structure on which the calculations are developed to estimate the costs and quantities of each construction material. These systems offer a rigorous way to quantify waste streams, allowing decision-making to define the most appropriate treatment strategies for each waste stream. They generally combine computer tools with calculation tables. Akinade et al. [26] studied the environmental evaluation of building design, and described four quantification tools, which include the demolition stage in the analysis, as well as its corresponding cost estimation and material quantification. The first tool was Building for Environmental and Economic Sustainability (BEES) [27], which allows building products to be individually evaluated. The second tool was One-click LCA, a software that assesses capital costs, LCC, and environmental impacts of 3D models of construction materials and systems [28]. The third tool was Demolition and Renovation Waste Estimation (DRWE), which is focused on the evaluation of material quantification and waste management options such as reuse, recycle, and disposal [29]. The fourth one was Integrate Material Profile and Costing Tool (IMPACT), which measures the environmental impact of construction phase and the LCC analysis of buildings [30].
In this paper, EOLC will be calculated using the ISO 15686-5:2008 standard [10], which is the main source for the building LCC calculation. According to this standard, the LCC of a building is the NPV, which is the sum of the discounted costs and revenue streams during the phases of the selected period of the life cycle. The phases of the life cycle that are included in the calculation are the initial investment cost (design and construction), the cost for operation and maintenance, and the EOLC [31].
An assessment model is proposed to study the end-of-life phase, including quantification and management of demolition waste. These assessments are needed in economic and environmental analyses. This study will be applied to Nearly Zero-Energy Buildings (NZEB), as part of the H2020 CRAVEzero research project, of which the objective is to identify the additional economic costs of NZEB from the point of view of the complete life cycle, in order to be able to make proposals that minimize these costs. As part of the project, Pernetti et al. have developed a tool that implements a global and structured methodology [32]. This tool analyzes a set of NZEB case studies, representing the most technologically advanced buildings across Europe. The projects data have been provided by the companies Bouygues, Skanska, Köhler & Meinzer, ATP sustain, and Moretti, which participated as designers, general contractors, or technology providers in the construction processes of buildings. NZEB have the challenge of reducing energy consumption in the stage of use of the life cycle of buildings, the longest and most impacting phase [33,34].
European NZEB are defined as “Very high energy performant buildings with a very low amount of energy required covered to a very significant extent by energy from on-site or nearby renewable sources“ [35]. In the European Union, each country can established his own energy consumption and emissions requirement, e.g., new single-family house in Madrid (Spain) should not surpass 44.6 kWh/m2 of primary energy consumption or 10.1 kgCO2/m2 of emissions per year [36]. Furthermore, each level of energy performance will be joined to cost-optimality solutions to evaluate the building energy performance [33,37]. A NZEB typology will be mandatory in new buildings in the European Union States (EU) by 2021 [33,38]. These improvements achieve an energy demand reduction from non-renewable energy sources [34,38], e.g., in Spain, a NZEB could reduce approximately 75% of energy consumption and emissions [36].
In the early stages of the design, the analysis of the EOLC should allow all costs to be estimated. For this purpose, construction materials, dismantling processes, and waste management should be quantified. In this work, an EOLC assessment is proposed for the CRAVEzero project, which is based on the standard classification system of construction work of the Andalusian Construction Cost Database (ACCD) [39]. The methodology developed by the ARDITEC research group [8,12,25] for the quantification and environmental assessment of CDW is also implemented.
However, we can say that there are insufficient studies or information regarding the EOLC. Therefore, one of the objectives of this article is to propose a methodology to estimate the costs and the quantification of waste generated by this phase because the impact from the environmental point of view is crucial; consequently, its analysis is pertinent. In addition, a sensitivity analysis of end-of-life parameters allows for the comparison of different construction types, waste treatment options, and waste management costs. The estimation model is developed by a case-based reasoning and cost data are obtained from three actual studies that are part of the CRAVEzero project.

2. Methodology

The proposed model calculates the EOLC through the quantification of demolished materials by using an indirect estimation method per Kim classification [40]. This method predicts the waste generated by construction work units and accumulation units. The quantification during the project design stage is based on a forecast of the CDW production and is helpful for defining the potential recycling benefit and disposal costs.
In Spain, a waste quantification method, included in the category of CSA methods, allows the volumes of waste generated by a building demolition to be known [25,41]. In addition, if this method is combined with a cost classification method of work units, a waste cost estimation is likely to be obtained [42]. The ACCD is employed in this work for the work unit definition [39] as it has been successfully used in previous works on waste quantification [43]. EOLC includes costs of demolition (TDC), load (TLC), transport (TTC), and waste (TWC) [9]
EOLC = TDC + TLC + TTC + TWC
The structure of the EOLC calculation is divided into three groups (Figure 1). The first group is demolition costs (DC), the second group is made up of load (LC), transport (TC), and waste management costs (WC), and the third one is EOLC in terms of NPV. NPV represents the actual value of a future cost, so the project time analysis and economic factors, such as discount rate and inflation, should be considered [44]. These costs categories are compatible with the indications of the ISO 15686-5 and EN 15643-4 standards [10,45].

2.1. Demolition Costs

The demolition activity is mainly conducted in two ways, massive demolition or dismantling and selective demolition. The former is not considered in this work because it does not meet European policies [35,46] about CDW management due to the mixed waste that it produces. In economic terms, there is no consensus about which demolition (massive or selective) is the best economic option; on the one hand, Dantata et al. indicate that selective demolition can be 17–25% greater than massive demolition costs [47], and on the other hand, some studies consider selective demolition more profitable than massive demolition [12,48,49]. When the demolition method is massive, costs can be calculated by means of the volumetric or area data of the building. However, if a selective demolition takes place, detailed information of the building design should be available.
ACCD [39] is employed in this paper for the work unit definition. Its most widespread use is for estimating costs in the construction sector and is mandatory in public works in Andalusia (Spain) [50]. It uses a hierarchical organization for work units, where the highest level is the construction site, followed by categories called chapters, each representing a construction process (for example, demolitions, foundations, installations, waste management, etc.), which then in turn are divided into subchapters. The base of this structure is formed by the Basic Costs, which correspond to elementary resources (materials, machinery, and labor), which are added to form Auxiliary Costs, generally mixtures of materials such as cement mortar. The aggregation of several basic and auxiliary costs give rise to Simple Costs, which represent the various construction activities or work units. Putting together Simple Costs generates Complex Costs, which represent more complicated work units.
In this research, demolition cost is calculated (Figure 2) by assigning Demolition Complex Costs to each building element (BE). The last are parts in which the building´s project is divided, and they were used in CRAVEzero project to calculate LCC. Some examples are foundation, facilities, and roofs. Each of them is expressed in a certain unit of measurement: m2, kg, m, etc. Thirty-nine new Demolition Complex Costs and thirty-one Simple Costs were defined using ACCD. These costs have been defined to adapt the demolition process to the work units in the case studies, such as wooden structures and renewable energy systems.
In many cases, the unit of measurement of BE could be different to the one of the corresponding demolition work unit, thereby a unit conversion ratio (CR) is required. The demolition cost of each BE (DCi) is calculated according Equation (2),
DCi = Qi × ∑ (CRi,j × DCj)
where DCi = Demolition Cost of BEi, and Qi = Quantity of BEi, expressed in its unit of measurement. CRij = Unit Conversion Ratio. DCj = Demolition Simple Cost j, expressed in €/unit of measurement. The sum of the DCi that are part of the BE, leads to the total demolition costs (TDC) of the building according to Equation (3),
TDC = ∑DCi
Table 1 shows the BE, roof, and, the Demolition Complex Cost generated from the Demolition Simple Costs, and how the use of CR is necessary to be able to relate the units of both elements (BE and Demolition Costs). Finally, the cost of the roof with cold attic (DC) is 33.67 €/m2.

2.2. Load, Transport, and Waste Management Costs
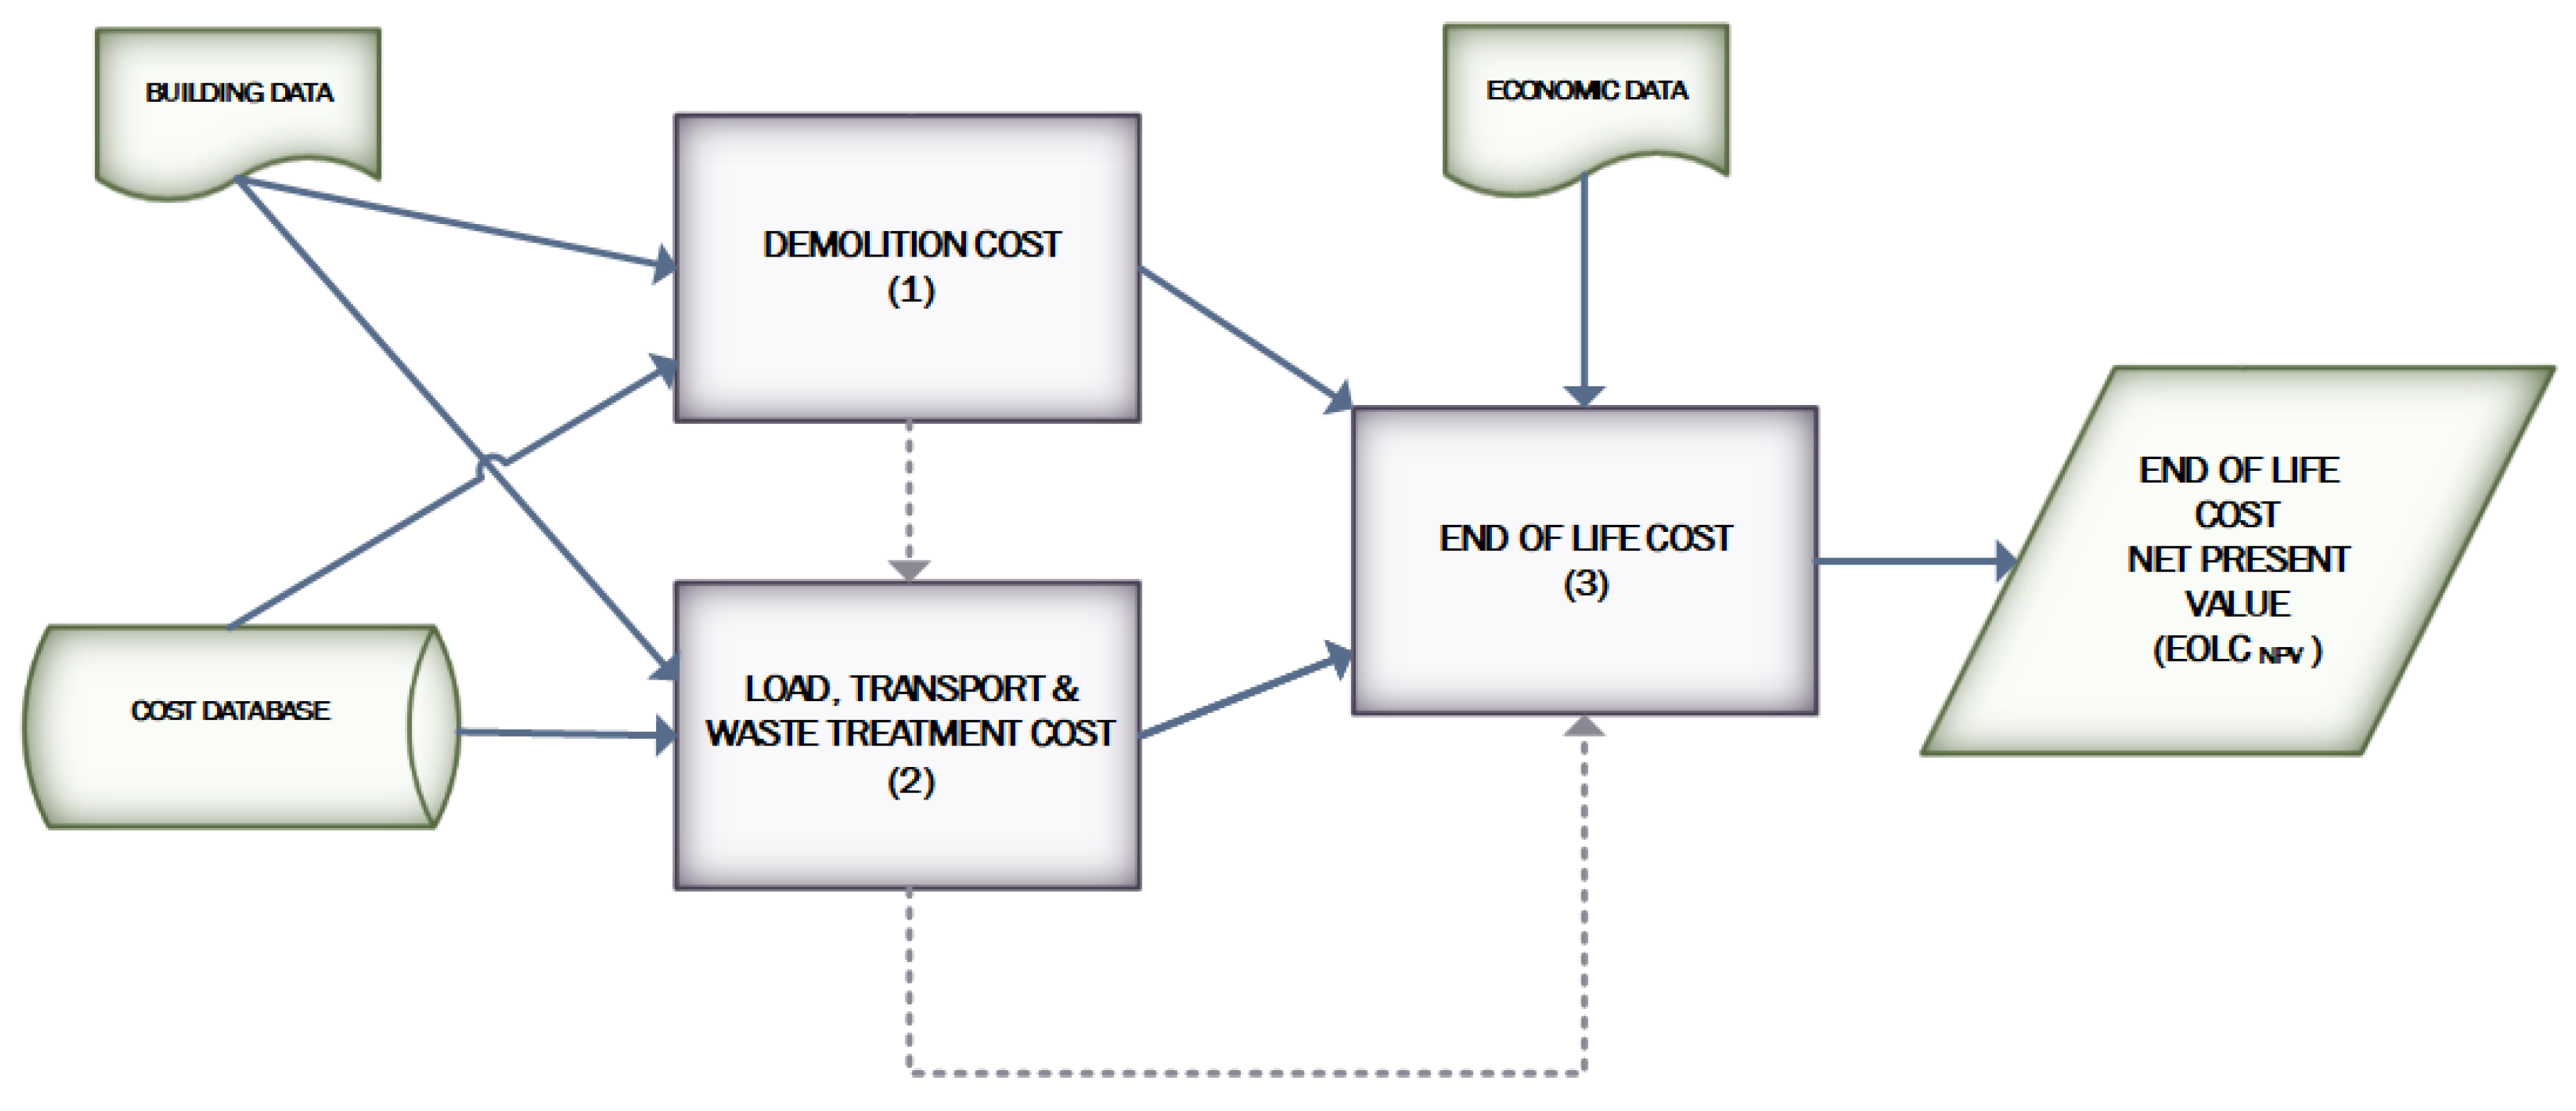
Load, transport, and management activities represent the conversion of demolished BEs into waste and their treatment cost. Previously to cost calculation, waste should be quantified, and waste management options should be defined. The first part of the calculation process (waste quantification) is performed with the support of the ARDITEC waste volume calculation [25].
For each BE, a volume conversion coefficient (CCi) is applied to change the unit of measurement of the BE to cubic meter. This ratio indicates how much apparent volume (m3a) is contained in a unit of the BE before being demolished. In example (Table 1), a wooden roof has 0.6957 m3a/m2. However, gaps are discounted by measuring the project to obtain a value of 0.6957 − 0.021 = 0.6747 m3a/m2. This last figure (0.6747) is what it is defined as CCi.
After BE is demolished, its volume is changed and is transported as bulk volume. This conversion is made by a bulk volume ratio (CTi). Representative CTi values are in parenthesis, for reinforced concrete (1.30), walls-partitions (1.30), tiling (1.20), ceiling (1.35), wood doors (1.15), heaters (1.00), and glass (1.10) [8,25]. The demolished bulk volume (DBVi) of the BE is defined as the demolished volume generated by each BE of the project according to Equation (4).
DBVi = Qi × CCi × CTi
In the example of Table 1, DBVwooden roof = 1541 × 0.6747 × 1.30 = 1351.98 m3b; CTi in this case is 1.30. An average value of CTi is stablished for each BE.
It is necessary to calculate the total waste of each material that can be generated by each Demolition Complex Cost. Therefore, the next step is to determine the weight of different material components by nature in the BE. The waste nature is defined by using the classification from the European Waste List [51], included in Chapter 17 Construction and demolition wastes. The codes are 17 01 01 concrete, 17 01 07 ceramic, 17 02 01 wood, 17 02 02 glass, 17 02 03 plastic, 17 03 02 bituminous, 17 04 07 metal, 17 04 11 cable electric, 17 05 04 soil, 17 06 04 isolation, 17 08 02 gypsum-based, 17 09 04 mixed inert, 17 09 04 mixed non-inert, and hazardous materials.
Firstly, the percentage of each material in the BE, the material volume percentage (VPki), should be determined according to Equation (5),
VPki = qki × (CCk/CCi)
where qki is the quantity of the material included in the BE per unit of BE. It is obtained from the bill of quantities of the project. CCk is a conversion ratio that relates the unit of measurement of the material included in the BE to volume unit (m3). CCi comes from Equation (4).
For example (Table 1), the percentage of wood in BE (wooden roof) will be calculated. CCi is calculated before (0.6747 m3a/m2); CCk = 1, since wood is measured in m3; and qki is obtained from the bill of quantities of wooden roof, in this case 0.039 m3/m2, VPwood, wooden roof =0.039 × 1/0.6747 = 5.78%. A similar analysis is done with the other materials that are part of the BE. Thus, it is possible to determine the quantity of demolished bulk volume for each material (DBVki), according to Equation (6),
DBVki = DBVi × VPki
To determine the demolished weight material (DWki), the bulk density (dbki) is employed according to Equation (7),
dbki = dak / CTi
where dak is the apparent density. Finally, DWki was calculated according to Equation (8),
DWki = DBVki × dbki
In the example (Table 1), the bulk density of wood = 0.5 t/m3 and DWwood, wooden roof =0.0578 × 1351.98 × 0.5 = 39.07 t. This process is done with all the materials that make up the BE. In this example, the materials are wood, bituminous, plastic, insulation, and gypsum. This process would be replicated for all BEs in the project.
After determining all weights, the treatment option percentage can be indicated for each material. The waste treatment options are chosen by considering the waste treatment hierarchy, reuse (PUk), recycle (PYk), and disposal (PDk) [16], thus allowing different percentage combinations to be compared. Quantities are obtained (in weight) of reused (DWUk), recycled (DWYk), and disposed (DWDk) waste with the Equations (9), (10), and (11) respectively,
DWUk = PUk × ∑DWki
DWYk = PYk × ∑DWki
DWDk = PDk × ∑DWki
After determining all material weights, the costs of load, transport, and waste treatment can be established. The total load cost (TLC) includes in situ transport of waste and being loaded on a truck, according to Equation (12),
TLC = LC × ∑(DWUk + DWYk + DWDk)
The calculation is made by multiplying the unitary load cost (LC) per tonne to the waste weight, after adding the weight of different waste treatment options. The total transport cost (TTC) includes all the costs incurred from the construction to the treatment site. The calculation is made with the Equation (13),
TTC = ∑ (TC × WTDok × DWok)
where TC is the unitary transport cost (TC), WTDok is the distance between the worksite and the waste treatment site, and DWok is the total amount of waste and waste treatment option (the options are recycling or disposal). The total waste treatment cost (TWC) includes all the cost related to the waste treatment site, fees, and special taxes included according to Equation (14),
TWC = ∑ (WCok × DWok)
which is the summation of each unitary waste treatment cost (WCok) per tonne times the total amount of wasted materials for each treatment option DWok (recycling or disposal).

2.3. EOLC

The EOLC is calculated through the aggregation of demolition, load, transport, and waste treatment costs (Equation (1)). This cost will be therefore affected by economic factors over time and indicates the investor’s time value of money [44]. The NPV of EOLC is obtained from Equation (15),
EOLCNPV = EOLC × ((1 + i)y/(1 + dr)y)
where EOLCNPV represents the present worth of an investment, which will take place in the future, so the period of time (y), the value of discount rate (dr), and the inflation rate (i) that the investor considered in the LCC assessment should be known. This equation is used for the LCC assessment in ASTM 917, EN-16627, and ISO 15686-5 [10,11,44]. Additionally, if the data cost is not recent, an updated cost factor is also required [10].

2.4. Cost Normalization

To compare the results of EOLC of the case studies and to add into previous costs calculated of NZEBs, a cost normalization should be performed [32], because these case studies come from different countries in Europe. For this purpose, the European construction cost index is employed [52] to establish an equivalence value of the EOLC obtained from the ACCD and the CRAVEzero project. It is defined as EOLCNPVn and obtained in Equation (16),
(EOLCNPV)n = EOLCNPV/icd
EOLCNPV represents the end-of-life cost calculated with ACCD in this research, and icd is the cost index of Spain where the ACCD is defined.

2.5. Sensitivity Analysis

The main weak point of an LCC analysis are the assumptions that should be made for the input parameters. The difficult access to data, especially in the case of economic boundary conditions, leads to uncertainty in LCC calculation, thus limiting its application. To determine the most relevant input parameters and to tackle in this way the uncertainty issue, a sensitivity analysis is performed, so decision makers could concentrate on the analysis of the most critical parameters [53].
First, the set of input parameters and their variation range must be selected. On the one hand, a fixed range can be adopted from the technical literature, norms, and the data collection of case studies, i.e., interest rates. On the other hand, if a fixed range is not available, e.g., the price of building features, the baseline value is arbitrary varied, ±10%.
One of the simplest screening techniques, the differential sensitivity analysis, is adopted. This method belongs to the class of the one factor at a time methods [54,55,56]. The impact on the LCC of one parameter at a time is studied, keeping the other parameters set equal to their baseline value. In spite of the influence of inflation rate and discount rate, it is very intense in terms of present worth. This affirmation is widely supported in existing literature [13,44,56,57]. Thus, we focus the sensitivity analysis on evaluation of parameters related directly with EOL: Recycle percentage (PYk), Recycle distance (DYk), Disposal distance (DDk), Unitary recycle cost (CYk), and Unitary disposal cost (CDk).

2.6. LCC CRAVEzero Calculation

For the LCC calculation of the other life cycle phases (design, construction, and operation) CRAVEzero methodology [32] was adopted, which is resumed in this section. The first step for the calculation of the LCC is establishing the time period. Following the framework of the ISO 15686-5:2008 standard, the largest period possible is 100 years [10] but shorter periods lead to more reliable assessments as time-uncertainties have a smaller impact. For the phases up to the operation phase, a period of 40 years was selected. A common discount rate value for all case studies was adopted to updating future costs over the 40-year life. The selected value was taken from the FRED Economic Database [58], which provided an average discount rate of 1.51% for the time period going from 2009 (the year of construction of the oldest case study) to 2017 (time period during case studies were built). Average values from 2009–2016 (year of construction of the case studies) of interest rate were used. Interest rate is taken from CRAVEzero project, which is necessary to maintain for further comparison and aggregation. Inflation rate was not considered in this calculation since it affects all results in the same way.
In a second step, energy costs related to building operation were obtained from CRAVEzero project. As the official energy bills were not available in most cases, the evaluation was based on the energy demand calculated. In particular, the energy consumption and production was analyzed using the PHPP evaluation tool [59]. Energy prices derived from Eurostat [60], considering the average values from 2010 to 2017.
The analyzed buildings were built between 2009 and 2016, and there are not enough data for maintenance cost yet. Therefore, the analysis within CRAVEzero of maintenance and use costs was based on the standard values from the literature. In particular, the EN 15459:2017 standard [32,61] provided annual maintenance costs for each item, including operation, repair, and service, as a percentage of the initial construction cost. For passive construction elements, an annual average value, representing 1.5% of the construction cost, was taken for the evaluation, and it was verified with average values derived from the experience of industry partners in the CRAVEzero project.

3. Case Studies Description, Scenario

3.1. Case Studies Description

Three buildings with different construction characteristics were chosen for this study (Table 2). Their main difference was their structural material, ranging from concrete, wood, and mixed. Also, they have a high degree of thermal insulation in their envelope, use low-consumption installations, and have their own system of photovoltaic power production.

3.2. Scenario

To compare different buildings correctly, economic and geographical estimates were made, including the normalization of the economic values of the LCC (Section 2). Furthermore, the idealization of the location of waste treatment plants included the unification of the distances between the construction site and the plant. In addition, the costs of each type of waste management, such as reuse, recycle, and/or disposal, for each waste stream were defined by employing current fees in Spanish municipalities and ACCD [39,62,63]. Reuse did not take place due to the complex factors making it difficult to define its corresponding costs because of both the opacity in the market of construction companies and the lack of public data. Recycling and disposal rates at European level were obtained from the project called Resource Efficient Use of Mixed Wastes Improving Management of Construction and Demolition Waste [64] as well as from the Institute of Civil Engineers [65]. Main data and its sources are summarized in Table 3; no estimation has been made in the present work besides the cost normalization as explained in Section 2.4.

4. Results and Discussions
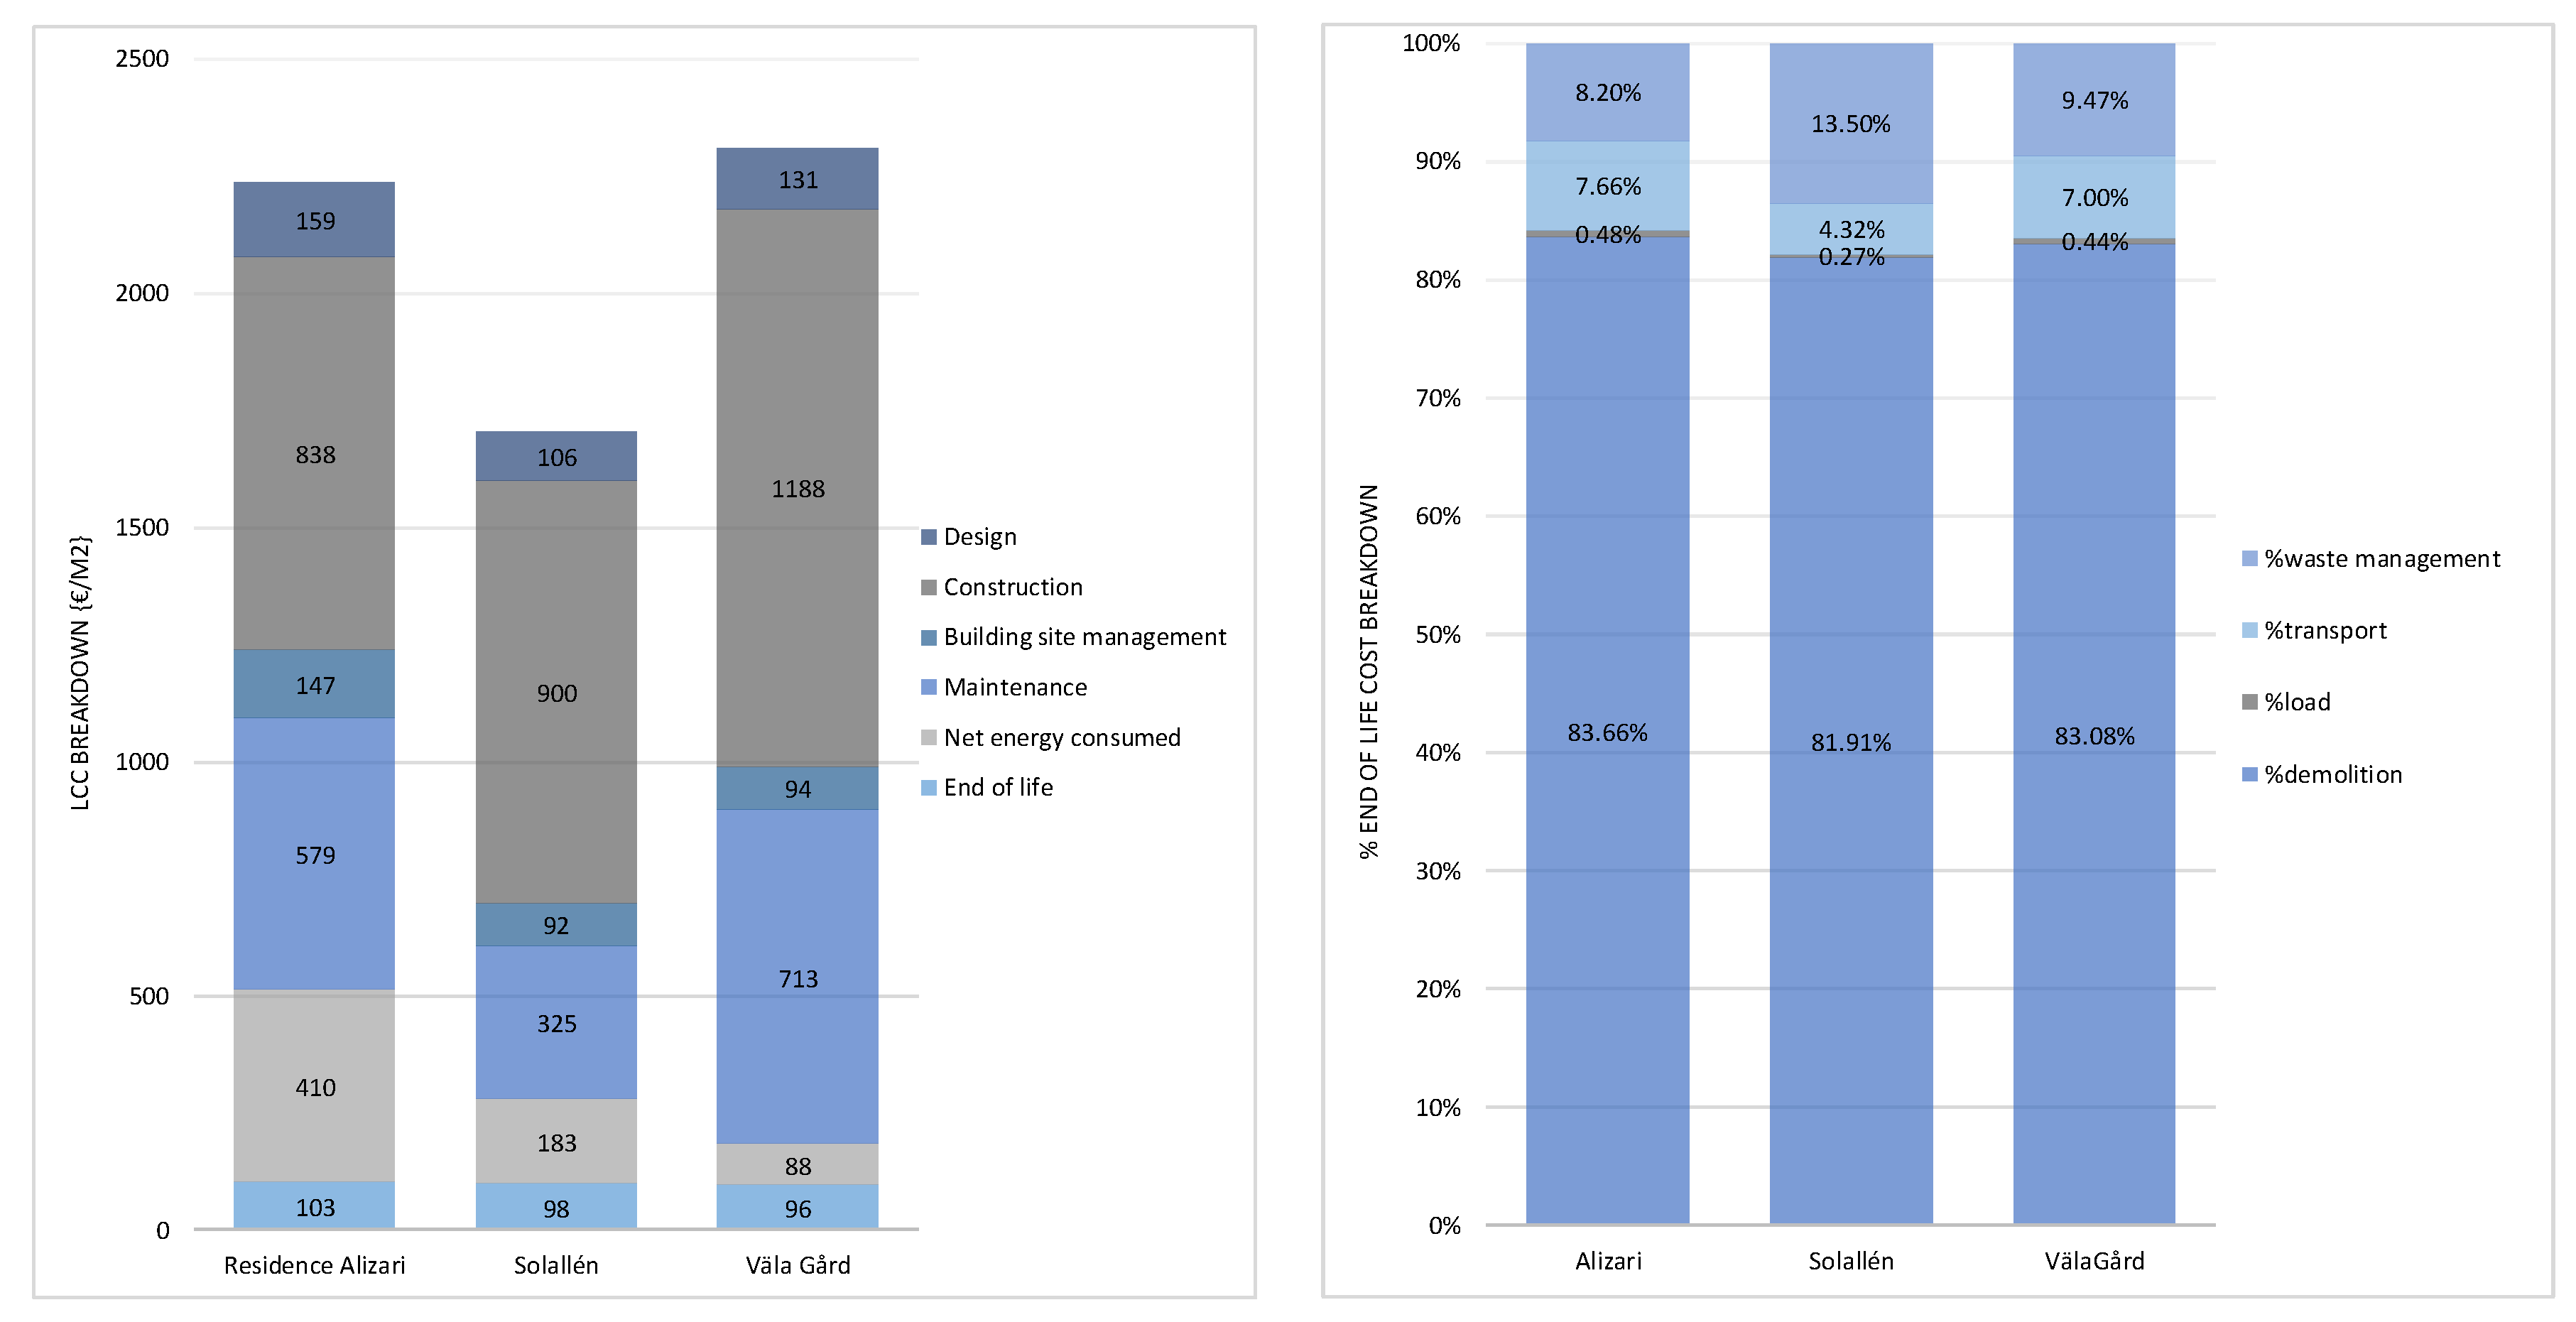
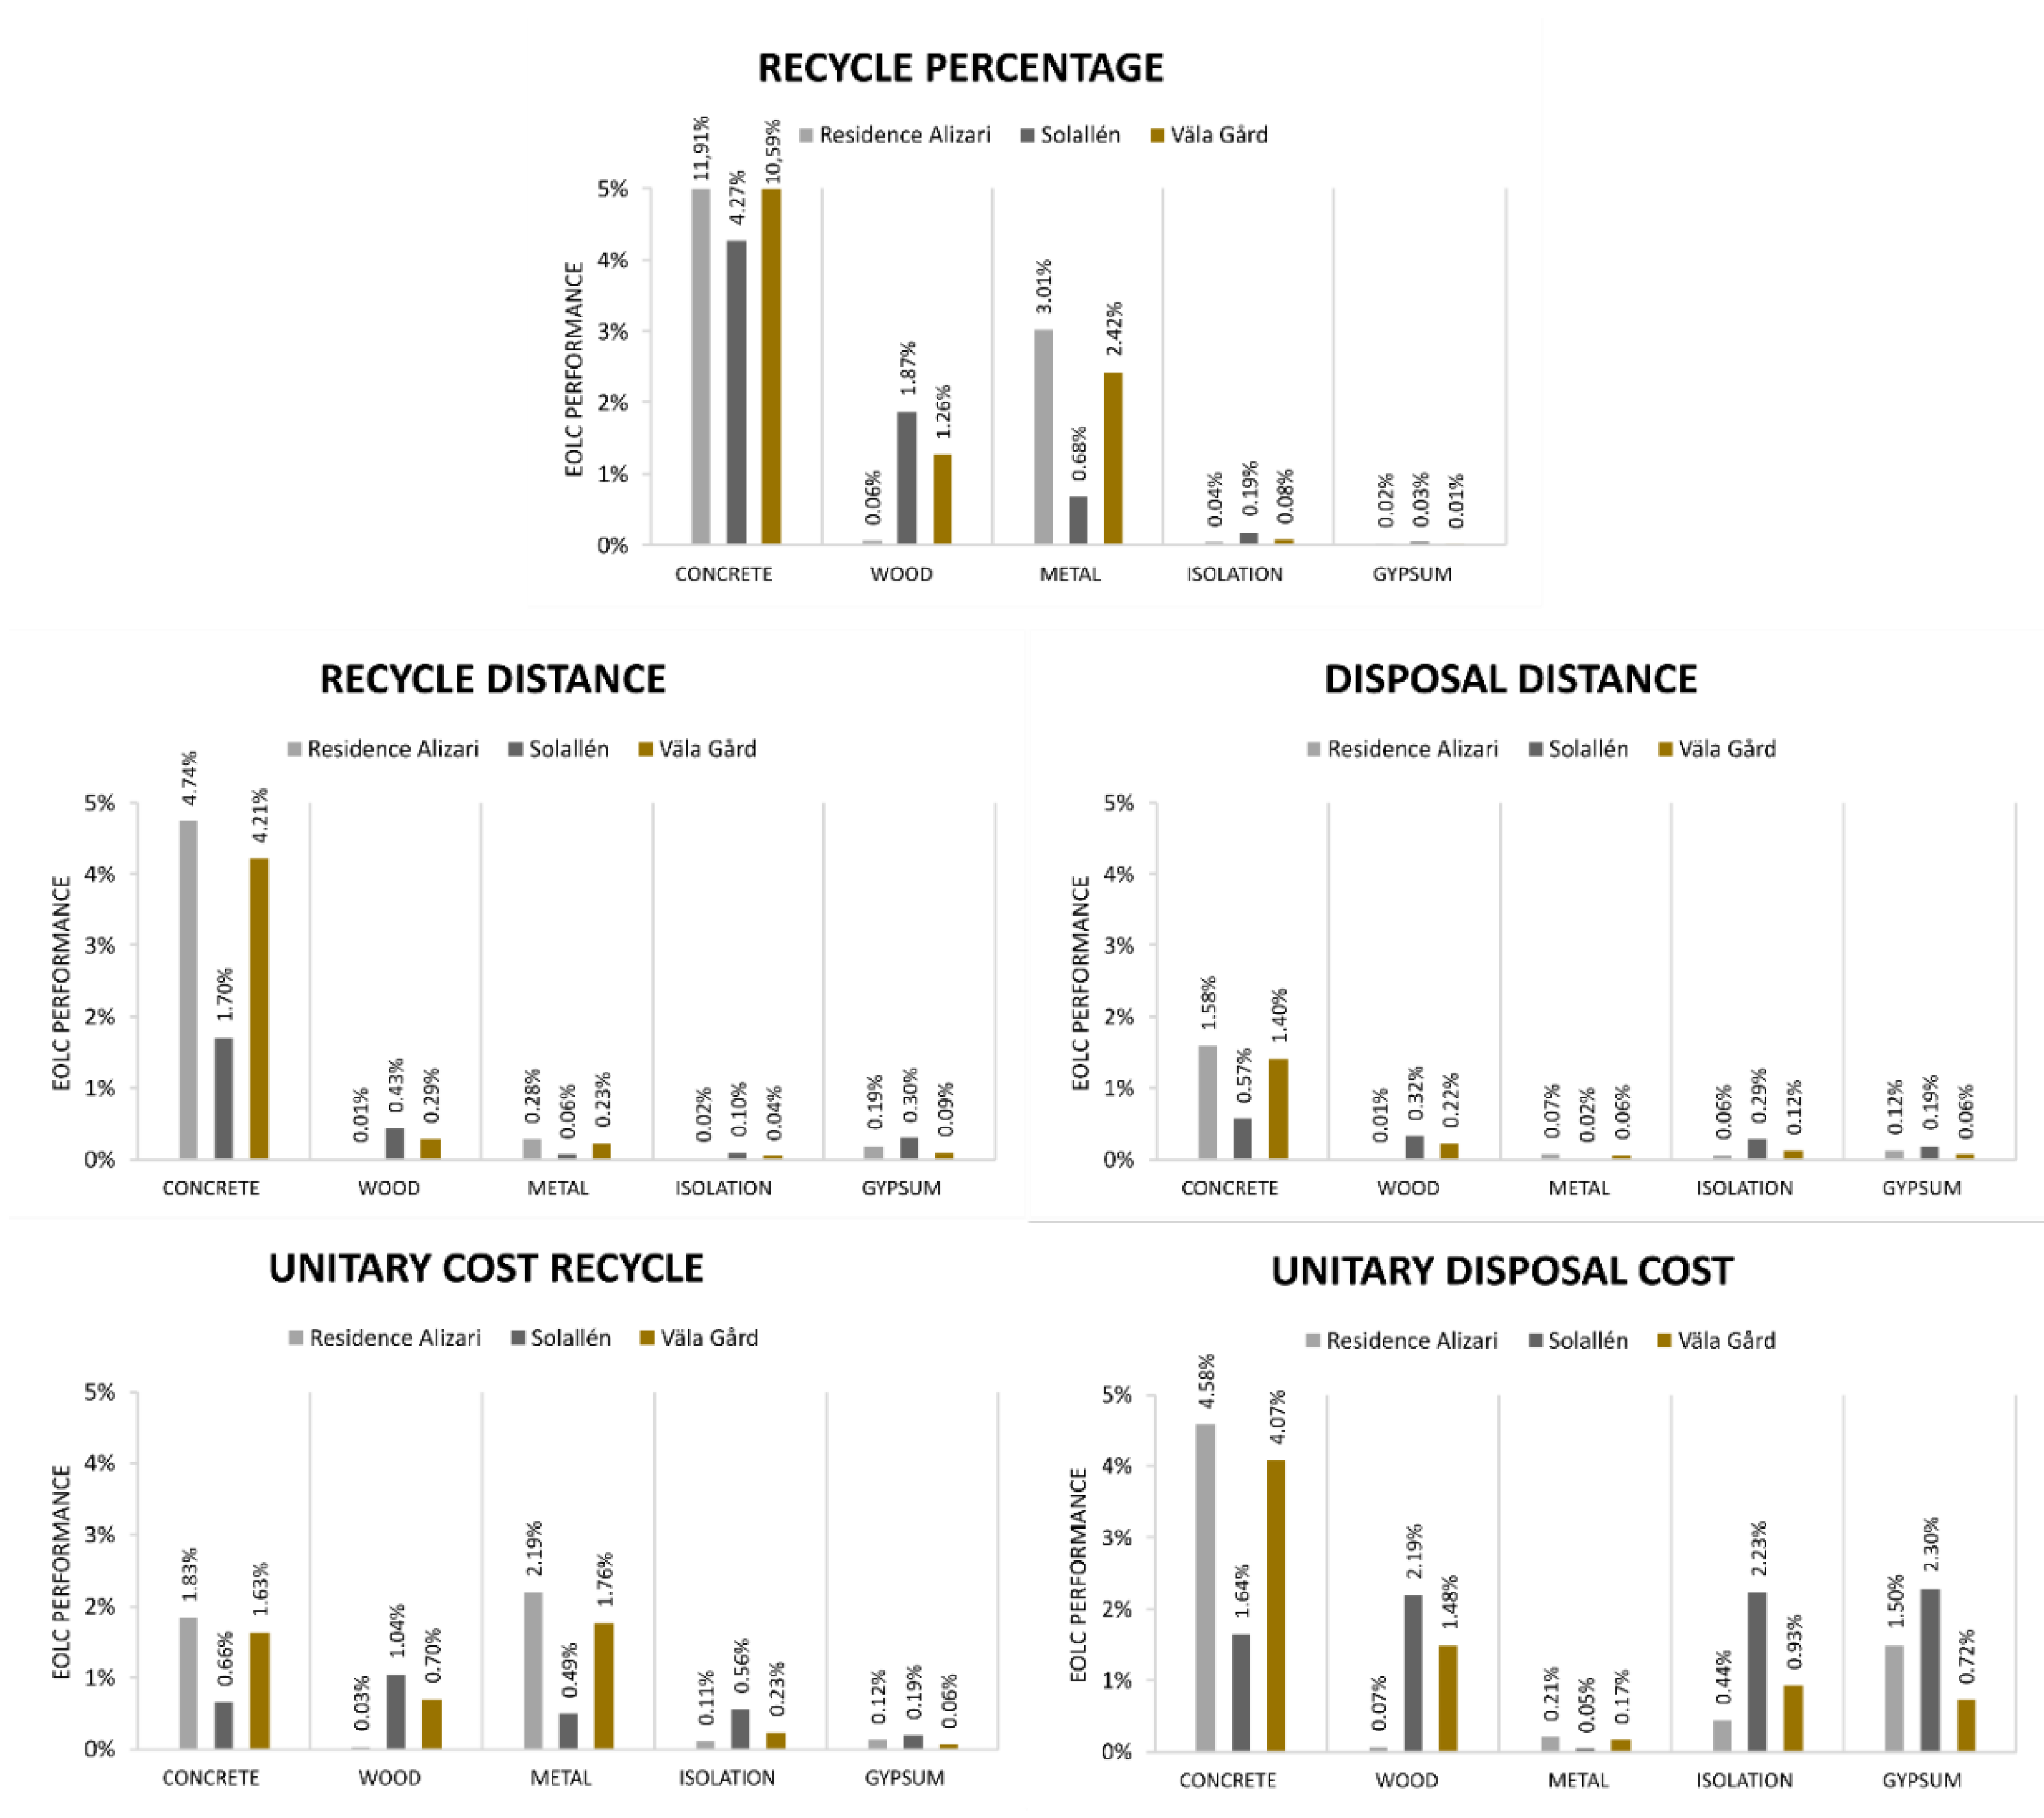
4.1. EOLC Results

The importance of the EOLC is established by comparing it with the rest of the LCC previously calculated in the CRAVEzero project [32]. The indicator chosen for comparison was the cost per Gross Floor Area (GFA).
EOLC is divided into demolition, load, transport, and waste management costs. In Figure 3, EOLC in the three cases is approximately 100 €/m2 and 5% of the LCC.
Comparing these results with other research, Banias et al. determined the transport and management cost is in the range between 31–42 €/m2 [66], but cost normalization or NPV were not applied. In terms of the importance of the EOLC with respect to the LCC, Islam et al. established those in 2.69% (a discount rate of 6% and a study period of 50 years) [13], Pelzeter in 1% (a discount rate of 5% and a study period of 90 years) [15], and Dwaikat in 1% (a discount rate of 0% and a study period of 60 years) [14]. The difference was mainly due to different discount rates and the number of years employed.
The cost distribution (Figure 3) of EOLC was as follows: Demolition cost from 82 to 84%, waste management from 8 to 14%; transport cost from 4 to 7%; and load cost, 1%.

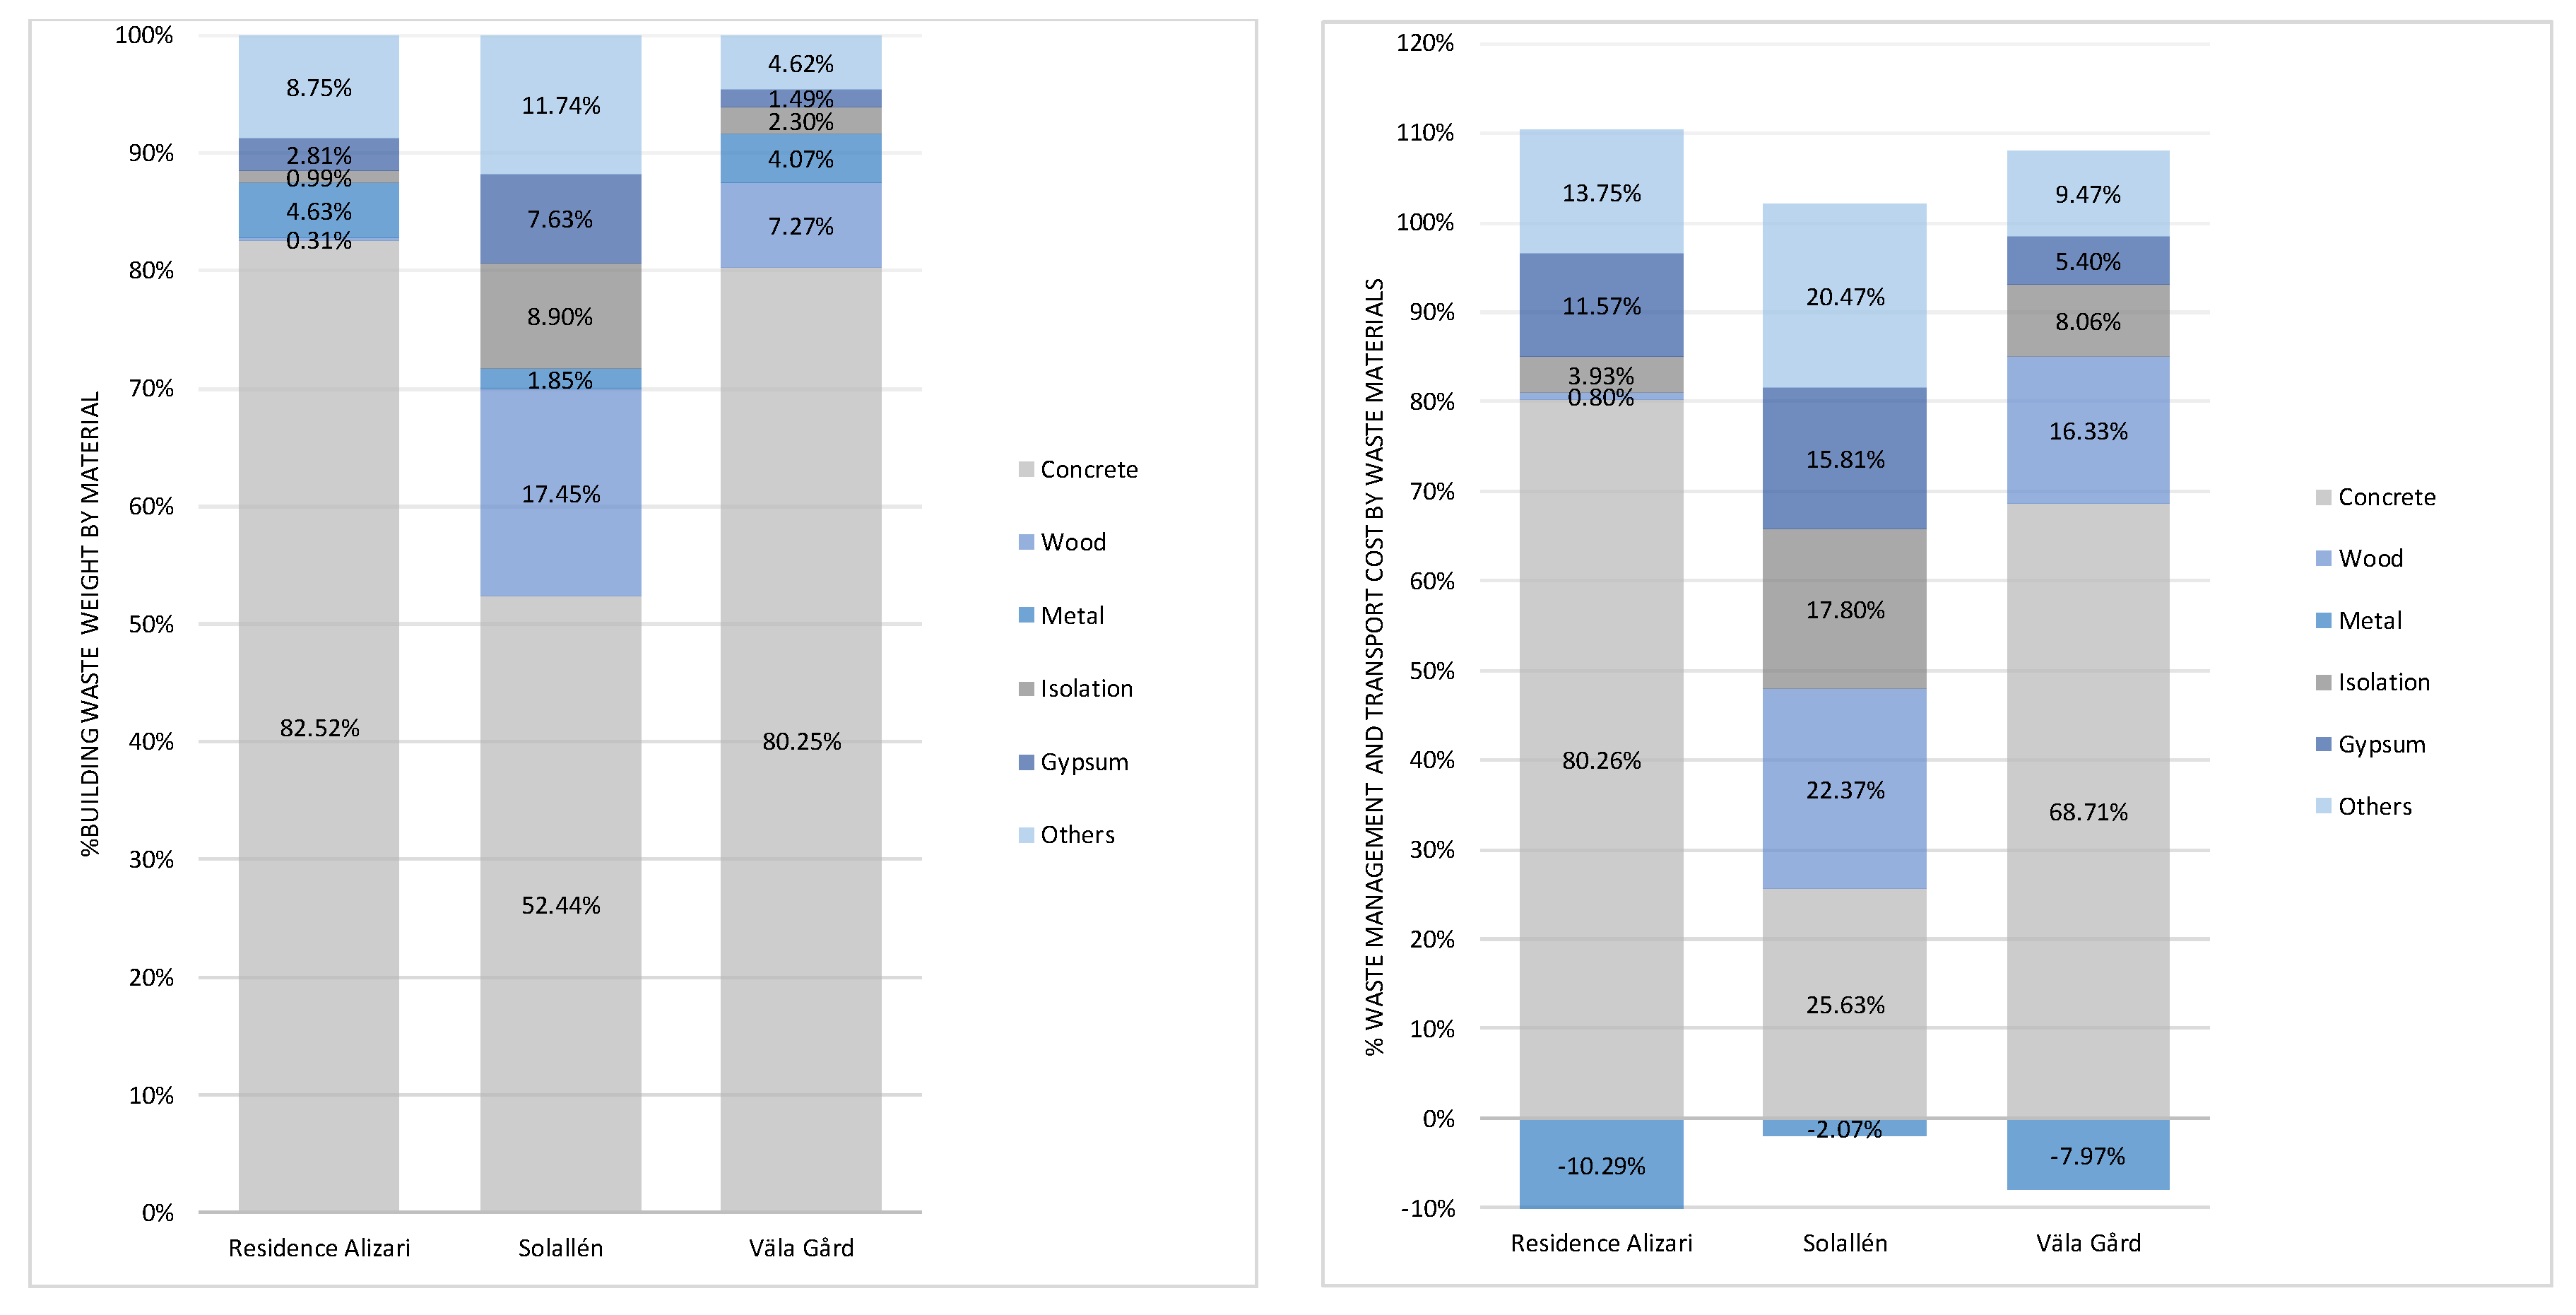
4.2. Waste Streams and EOLC

Table 4 shows the total amount of waste streams obtained in this work and in others [23]. The insulation material was that showing significant differences, as expected in NZEB.
Another work analyzed the construction waste generated during the building life cycle of social housing projects [8] named P1, P2, and P3; the main streams of P2 and P3 (concrete, plastic, and metallic waste) were similar to those included in this work, the Residence Alizari project, but P1 was significantly different due to its urbanization characteristics.
In the three case studies, a detailed analysis of the influence of the materials within the EOLC, in terms of the percentage per weight and costs of transport and management, is shown in Figure 4. The main materials were concrete, metallic, insulation, wooden, and gypsum-based materials, representing between 88 and 95% per weight. Moreover, NZEB buildings increased the amounts of insulation waste, thus making the recycling of these materials important.
In the percentage comparison of the material weight, the importance of concrete was stressed as it represented between 80 and 82% in buildings with a reinforced concrete structure and façade, and 52% when it was employed only in the foundation.
The cost of transport and waste management represented between 79 and 90% of the EOLC. In turn, the metallic materials which were sold were between −3 and −10%.

4.3. Sensitivity Analysis

The sensitivity analysis compared the percentage of variation of the EOLC with respect to waste parameters, when the parameter studied changes 1%. In terms of the EOLC and the building weight, the five materials most influencing were as follows (see Figure 5): Concrete, metallic, insulation, wooden, and gypsum-based materials. Moreover, the three case studies were compared.
The first parameter evaluated was the waste recycling percentage. The results showed that concrete was the most influential, which was between 4 and 12%, followed by metallic materials which were between 1 and 3%, and wooden materials which were between 0 and 2%. The second parameter assessed was the distance to the recycling plant. The waste most influencing the EOLC was also concrete, which was between 2 and 5%; the remaining waste did not significantly affect the EOLC.
The third parameter analyzed was the distance to the disposal plant. The residue most affecting the EOLC was also concrete, which was between 1 and 2%; the remaining waste did not significantly affect the EOLC. The fourth parameter evaluated was the unit cost of waste recycling. The results showed that the cost of recycling metallic waste varied up to 2%. Then, concrete influenced between 1 and 2%, and finally, the wooden waste reached up to 1%.
The fifth parameter was the unit cost of disposal. Concrete waste was again the most influential, between 2 and 5%. Wooden, insulation, and gypsum-based materials were up to 2% of EOLC. The results showed, in general, that the EOLC was mainly influenced by the materials most presented in the building, and in particular those which were part of the structure and substructure.
Also, it is possible to analyze the differences between concrete and wooden buildings, verifying that in the latter (Solallén), the influence of wood on the sensitivity analysis is much greater than in the other two buildings (Alizari and Väla Gård). The uncertainties in the main material volume calculations (i.e., concrete) were low because this material was an essential part of the building structure and was always precisely defined in construction projects due to safety issues.

5. Conclusions

This work defines an assessment model for the evaluation of the EOLC of buildings, based on a cost model that implements selective demolition. It is aimed at designing stage decision making, by knowing in advance what type of waste is to be generated at the end-of-life and its economic impact. These aspects could be considered during the materials selection in the building design stage. In addition, the influence of the distance to the recycling plants is also assessed in economic terms, as well as the influence of waste management fees.
Firstly, the results showed that the EOLC represented approximately 5% of the total of the LCC. That percentage significantly changed with modifications in time span and discount rate, thus making the comparison to other results difficult. Furthermore, among the elements describing the EOLC (i.e., demolition, load, transport, and waste management costs), demolition costs were those most influencing the EOLC as they constituted between 82 and 84% of the total. In addition, these percentages were not affected by the typology of the structure or by the number of floors.
Secondly, the results showed that the waste generated was mainly from the foundation and structure. In particular, concrete, wood, metals, insulation, and plaster-based materials. Also, the indicator of weight per floor area obtained in the three case studies was in line with those calculated with other methodologies in the scientific literature. Moreover, NZEB buildings increased the amounts of insulation waste, thus making the recycling of these materials more important than in conventional projects. The presence of waste that generates income, such as metallic waste, showed the importance of the recycling market.
Thirdly, the sensitivity analysis indicated that the parameters most influencing the EOLC were the percentages of recycled waste and disposal unit cost. In this regard, it was clearly shown that if the difference between disposal costs with respect to recycling costs increased, then recycling would be an economic advantageous. So, the sensitivity analysis confirmed, as previously mentioned, that those materials constituting the building structure and foundation were the most influencing, and consequently, recycling policies would be focused on these materials.
In future works, the complete LCC of the building will be calculated for a bigger sample of building typologies.

Author Contributions

Conceptualization, E.V.-L., R.P., and J.S.-G.; data curation, E.V.-L.; formal analysis, J.S.-G. and M.M.; investigation, E.V.-L.; methodology, E.V.-L., F.G., and J.S.-G.; project administration, R.P. and M.M.; resources, F.G. and R.P.; software, E.V.-L and F.G.; supervision, R.P., J.S.-G., and M.M.; validation, R.P., J.S.-G., and M.M.; visualization, E.V.-L.; writing—original draft, E.V.-L and F.G.; writing—review and editing, J.S.-G. and M.M. All authors have read and agreed to the published version of the manuscript.

Funding

This paper and the costs for its publication in open access have been funded by the CIRCULAR-BIM project (code 2019-1-ES01-KA203-065962), an ERASMUS+ project co-funded by the European Union and within the framework of an initiative of 2019 (KA2, Strategic partnerships in the field of higher education), with the support of the Servicio Español Para la Internacionalización de la Educación (SEPIE, Spain). This research was funded by the ERASMUS+ Programme and the VI Own Research and Transfer Plan of the University of Seville (VI PPIT-US).

Acknowledgments

The present work has been carried within the project CRAVEzero—Grant Agreement No. 741223 (www.cravezero.eu), financed by the Horizon 2020 Framework Programme of the European Union. The authors would like to acknowledge the support of the following contributors that collaborated in the collection of the data: David Venus, Anna Maria Fulterer, Klara Meier, Jens Gloeggler, Bjorn Berggren; Gerold Koehler; Thomas Stoecker; Christian Denacquard, Marine Thouvenot, Cristina Foletti6, Gianluca Gualco, Mirco Balachia (AEE- INTEC, ATP Sustain, Skanska, Koeler&Meinzer, Bouygues Construction, Moretti 73i engineering.

Conflicts of Interest

The authors declare no conflict of interest. The funders had no role in the design of the study; in the collection, analyses, or interpretation of data; in the writing of the manuscript, or in the decision to publish the results”. The European Commission’s support for the production of this publication does not constitute an endorsement of the contents, which reflect the views only of the authors, and the commission cannot be held responsible for any use which may be made of the information contained therein.

Abbreviations

Equation Parameter List
CCiVolume conversion ratio of building element {m3a/umBEi}
CCkVolume conversion ratio of material {m3a/umMk}
CRijUnit conversion ratio. {umDCj /umBEi}
CTiBulk volume ratio {m3b/ m3a}
DCiDemolition cost of building element {€}
TDCTotal demolition cost {€}
dakApparent density of material {t/m3a}
dbkiBulk density of material {t/m3b}
drDiscount rate {dimensionless}
DBViDemolished bulk volume of building element {m3b}.
DBVkiQuantity of demolished bulk volume for each material {m3b}.
DCjunit demolition cost {€/umDCj}
DWkiQuantity of demolished weight for each material {t}
DWUkDemolition waste reuse {t}
DWYkDemolition waste recycle {t}
DWDkDemolition waste disposal {t}
EOLCEnd-of-life cost {€}
EOLCNPVEnd-of-life cost net present value {€}
(EOLCNPV)nEnd-of-life costs net present value and normalized. {€}
iInflation rate {dimensionless}
icdCost index {dimensionless}
PokTreatment option percentage {dimensionless}
PUkReuse percentage {dimensionless}
PYkRecycle percentage {dimensionless}
PDkDisposal percentage {dimensionless}
QiQuantity of building element {umBEi}.
qkiQuantity of the material included in the BE {umMk/umBEi}.
TLCTotal Load costs {€}
TTCTotal Transport cost {€}
LCUnitary load cost {€/t}
TCUnitary transport cost {€/t·km}
TWCTotal Waste treatment cost {€}
VkiVolume percentage of material k in building element i. {dimensionless}
WCokUnitary waste treatment cost {€/t}
WTDokWaste treatment distance {km}
yPeriod of time {years}
Measure Unit List
m3aApparent volume.
m3bBulk volume.
umBEiUnit of measurement of building elements {m, m2, m3…}
umDCjUnit of measurement of demolition work unit {m, m2, m3…}
umMkUnit of measurement material {m, m2, m3, t…}
ttonns

References

  1. Rosselló-Batle, B.; Moià, A.; Cladera, A.; Martínez, V. Energy use, CO2 emissions and waste throughout the life cycle of a sample of hotels in the Balearic Islands. Energy Build. 2010, 42, 547–558. [Google Scholar] [CrossRef]
  2. Radhi, H.; Sharples, S. Global warming implications of facade parameters: A life cycle assessment of residential buildings in Bahrain. Environ. Impact Assess. Rev. 2013, 38, 99–108. [Google Scholar] [CrossRef]
  3. Nematchoua, M.K.; Teller, J.; Reiter, S. Statistical life cycle assessment of residential buildings in a temperate climate of northern part of Europe. J. Clean. Prod. 2019, 229, 621–631. [Google Scholar] [CrossRef] [Green Version]
  4. Asif, M.; Muneer, T.; Kelley, R. Life cycle assessment: A case study of a dwelling home in Scotland. Build. Environ. 2007, 42, 1391–1394. [Google Scholar] [CrossRef]
  5. Dimoudi, A.; Tompa, C. Energy and environmental indicators related to construction of office buildings. Resour. Conserv. Recycl. 2008, 53, 86–95. [Google Scholar] [CrossRef]
  6. Du, P.; Wood, A.; Stephens, B.; Song, X. Life-Cycle Energy Implications of Downtown High-Rise vs. Suburban Low-Rise Living: An Overview and Quantitative Case Study for Chicago. Buildings 2015, 5, 1003–1024. [Google Scholar] [CrossRef] [Green Version]
  7. Michailidou, A.V.; Vlachokostas, C.; Moussiopoulos, N.; Maleka, D. Life Cycle Thinking used for assessing the environmental impacts of tourism activity for a Greek tourism destination. J. Clean. Prod. 2016, 111, 499–510. [Google Scholar] [CrossRef]
  8. Marrero, M.; Rivero-Camacho, C.; Alba-Rodríguez, M.D. What are we discarding during the life cycle of a building? Case studies of social housing in Andalusia, Spain. Waste Manag. 2020, 102, 391–403. [Google Scholar] [CrossRef]
  9. EN-15643-1. Sustainability of Construction Works—Sustainability Assessment of Buildings—Part 1: General Framework; Comite Europeen de Normalisation: Geneva, Switzerland, 2010. [Google Scholar]
  10. ISO 15686-5. Buildings and Constructed Assets—Service Life Planning—Part 5: Life-Cycle Costing; International Organization for Standardization: Geneva, Switzerland, 2017. [Google Scholar]
  11. EN-16627. Sustainability of Construction Works—Assessment of Economic Performance of Buildings—Calculation Methods; Comite Europeen de Normalisation: Geneva, Switzerland, 2015. [Google Scholar]
  12. Alba-Rodríguez, M.D.; Martínez-Rocamora, A.; González-Vallejo, P.; Ferreira-Sánchez, A.; Marrero, M. Building rehabilitation versus demolition and new construction: Economic and environmental assessment. Environ. Impact Assess. Rev. 2017, 66, 115–126. [Google Scholar] [CrossRef]
  13. Islam, H.; Jollands, M.; Setunge, S. Life cycle assessment and life cycle cost implication of residential buildings—A review. Renew. Sustain. Energy Rev. 2015, 42, 129–140. [Google Scholar] [CrossRef]
  14. Dwaikat, L.N.; Ali, K.N. Green buildings life cycle cost analysis and life cycle budget development: Practical applications. J. Build. Eng. 2018, 18, 303–311. [Google Scholar] [CrossRef]
  15. Pelzeter, A. Building optimisation with life cycle costs—The influence of calculation methods. J. Facil. Manag. 2007, 5, 115–128. [Google Scholar] [CrossRef]
  16. European Commission. Report from the Commission to the European Parliament on the Implementation of the Circular Economy Action Plan COM/2019/190 Final; European Union: Brussels, Belgium, 2019. [Google Scholar]
  17. European Commission. EU Construction & Demolition Waste Management Protocol; Dublin, 22 June 2017; European Union: Brussels, Belgium, 2016; Volume 62, ISBN 1866505041. [Google Scholar]
  18. European Parliament. Directive 2014/24/EU of The European Parliament and of The Council of 26 February 2014 on Public Procurement and Repealing Directive 2004/18/EC (Text with EEA Relevance); European Parliament: Brussels, Belgium, 2014; Volume 94. [Google Scholar]
  19. Kofoworola, O.F.; Gheewala, S.H. Estimation of construction waste generation and management in Thailand. Waste Manag. 2009, 29, 731–738. [Google Scholar] [CrossRef] [PubMed]
  20. Wang, J.; Yuan, H.; Kang, X.; Lu, W. Critical success factors for on-site sorting of construction waste: A china study. Resour. Conserv. Recycl. 2010, 54, 931–936. [Google Scholar] [CrossRef]
  21. Yuan, H.; Shen, L. Trend of the research on construction and demolition waste management. Waste Manag. 2011, 31, 670–679. [Google Scholar] [CrossRef]
  22. Wu, Z.; Yu, A.T.W.; Shen, L.; Liu, G. Quantifying construction and demolition waste: An analytical review. Waste Manag. 2014, 34, 1683–1692. [Google Scholar] [CrossRef]
  23. Mália, M.; De Brito, J.; Pinheiro, M.D.; Bravo, M. Construction and demolition waste indicators. Waste Manag. Res. 2013, 31, 241–255. [Google Scholar] [CrossRef]
  24. Coelho, A.; De Brito, J. Generation of construction and demolition waste in Portugal. Waste Manag. Res. 2011, 29, 739–750. [Google Scholar] [CrossRef]
  25. Solís-Guzmán, J.; Marrero, M.; Montes-Delgado, M.V.; Ramírez-de-Arellano, A. A Spanish model for quantification and management of construction waste. Waste Manag. 2009, 29, 2542–2548. [Google Scholar] [CrossRef]
  26. Akinade, O.O.; Oyedele, L.O.; Omoteso, K.; Ajayi, S.O.; Bilal, M.; Owolabi, H.A.; Alaka, H.A.; Ayris, L.; Henry Looney, J. BIM-based deconstruction tool: Towards essential functionalities. Int. J. Sustain. Built Environ. 2017, 6, 260–271. [Google Scholar] [CrossRef]
  27. NIST BEES Online. Available online: https://ws680.nist.gov/bees/(A(YRWmdd3E1QEkAAAAZWE1NmE3MzUtMWM4Zi00OTA1LWI0MTctN2RkODkzOWYyNGMzu9uo8zgO971rP3Ett3WWtXZwV6A1))/AnalysisParametersBuildingProds.aspx (accessed on 7 July 2020).
  28. BIONOVA Ltd. One Click LCA. Available online: https://www.oneclicklca.com/ (accessed on 7 July 2020).
  29. Cheng, J.C.P.; Ma, L.Y.H. A BIM-based system for demolition and renovation waste estimation and planning. Waste Manag. 2013. [Google Scholar] [CrossRef] [PubMed]
  30. BRE Group. IMPACT. Available online: https://www.bregroup.com/impact/ (accessed on 7 July 2020).
  31. Garzia, F.; Pernetti, R.; Weiss, T.; Venus, D.; Knotzer, A.; Thouvenot, M.; Berggren, B. D2.1: Report on EU Implementation of nZEBs; EURAC research: Bolzano, Italy, 2018. [Google Scholar]
  32. Pernetti, R.; Garzia, F.; Paoletti, G. D2.2: Spreadsheet with LCCs A Database for Benchmarking Actual NZEB Life-Cycle Costs of the Case Studies; EURAC research: Bolzano, Italy, 2018. [Google Scholar]
  33. European Parliament. Directive 2010/31/EU, of european parliament and of the council of 19 May 2010 on the energy performance of building (recast). Off. J. Eur. Union 2010, 153, 13–35. [Google Scholar]
  34. European Commission. Guidelines accompanying Commission Delegated Regulation (EU) No 244/2012 of 16 January supplementing Directive 2010/31/EU of the European Parliament and of the Council. Off. J. Eur. Union 2012, 115, 1–28. [Google Scholar]
  35. European Commission. Commission recommendation (EU) 2016/1318, on guidelines for the promotion of nearly zero-energy buildings and best practices to ensure that, by 2020, all new buildings are nearly zero-energy buildings. Off. J. Eur. Union 2016, 208, 46–57. [Google Scholar]
  36. IDAE. Escala de calificación energética—Edificios de nueva construcción. Labelling schemes for new buildings; IDAE—Instituto para la Diversificación y Ahorro de la Energía: Madrid, Spain, 2009. [Google Scholar]
  37. D’Agostino, D.; Mazzarella, L. What is a Nearly zero energy building? Overview, implementation and comparison of definitions. J. Build. Eng. 2019, 21, 200–212. [Google Scholar] [CrossRef]
  38. Karlessi, T.; Kampelis, N.; Kolokotsa, D.; Santamouris, M.; Standardi, L.; Isidori, D.; Cristalli, C. The Concept of Smart and NZEB Buildings and the Integrated Design Approach. Proc. Eng. 2017, 180, 1316–1325. [Google Scholar] [CrossRef]
  39. ACCD—Andalusia Construction Cost Database. 2017. Available online: http://www.juntadeandalucia.es/organismos/fomentoyvivienda/areas/vivienda-rehabilitacion/planes-instrumentos/paginas/bcca-sept-2017.html (accessed on 7 July 2020).
  40. Kim, Y.-C.; Hong, W.-H.; Park, J.-W.; Cha, G.-W. An estimation framework for building information modeling (BIM)-based demolition waste by type. Waste Manag. Res. 2017, 35, 1285–1295. [Google Scholar] [CrossRef]
  41. Ramirez de Arellano Agudo, A.; Llatas-Oliver, C.; García-Torres, I. Retirada Selectiva de Residuos: Modelo de Presupuestacion; Coleccion Nivel 6; Fundacion Cultural del Colegio Oficial de Aparejadores y Arquitectos Tecnicos: Sevilla, Spain, 2002. [Google Scholar]
  42. Marrero, M.; Ramirez-De-Arellano, A. The building cost system in andalusia: Application to construction and demolition waste management. Constr. Manag. Econ. 2010, 28, 495–507. [Google Scholar] [CrossRef]
  43. González-Vallejo, P.; Muñoz-Sanguinetti, C.; Marrero, M. Environmental and economic assessment of dwelling construction in Spain and Chile. A comparative analysis of two representative case studies. J. Clean. Prod. 2019, 208, 621–635. [Google Scholar] [CrossRef]
  44. ASTM E917. Stardard Practice for Measuring Life-Cycle Costs of Buildings and Building Systems; ASTM International: West Conshohocken, PA, USA, 2013. [Google Scholar]
  45. EN-15643-4. Sustainability of Construction Works. Assessment of Buildings. Framework for the Assessment of Economic Performance; Comite Europeen de Normalisation: Geneva, Switzerland, 2012. [Google Scholar]
  46. European Parliament. Directive 2008/98/EC, On Waste and Repealing Centain Directives. Off. J. Eur. Union 2008, 312, 3–30. [Google Scholar]
  47. Dantata, N.; Touran, A.; Wang, J. An analysis of cost and duration for deconstruction and demolition of residential buildings in Massachusetts. Resour. Conserv. Recycl. 2005, 44, 1–15. [Google Scholar] [CrossRef]
  48. Solís-Guzmán, J.; Marrero, M.; Guisado García, D. Model for the quantification and budgeting of the construction and demolition waste. Application to roads|Modelo de cuantificación y presupuestación en la gestión de residuos de construcción y demolición. Aplicación a viales. Carreteras 2014, 4, 6–18. [Google Scholar]
  49. Pun, S.K.; Liu, C.; Langston, C. Case study of demolition costs of residential buildings. Constr. Manag. Econ. 2006, 24, 967–976. [Google Scholar] [CrossRef] [Green Version]
  50. Freire-Guerrero, A.; Alba-Rodríguez, M.D.; Marrero, M. A budget for the ecological footprint of buildings is possible: A case study using the dwelling construction cost database of Andalusia. Sustain. Cities Soc. 2019, 51. [Google Scholar] [CrossRef]
  51. European Commission. 2000/532/EC European waste catalogue. Off. J. Eur. Communities 2000, 226, 3–24. [Google Scholar]
  52. European Constructions Costsd Ltd. European Cost Index. Available online: http://constructioncosts.eu/cost-index/ (accessed on 7 July 2020).
  53. Langdon, D. Life Cycle Costing (LCC) as a contribution to sustainable construction: A common methodology. Literature review. Davis Langdon Manag. Consult. 2007, 1, 1–113. [Google Scholar]
  54. Heiselberg, P.; Brohus, H.; Hesselholt, A.; Rasmussen, H.; Seinre, E.; Thomas, S. Application of sensitivity analysis in design of sustainable buildings. Renew. Energy 2009, 34, 2030–2036. [Google Scholar] [CrossRef] [Green Version]
  55. Tian, W. A review of sensitivity analysis methods in building energy analysis. Renew. Sustain. Energy Rev. 2013, 20, 411–419. [Google Scholar] [CrossRef]
  56. Weiss, T.; Moser, C.; Venus, D.; Garzia, F.; Pernetti, R.; Köhler, G.; Stöcker, T. D6.1: Parametric Models for Buildings and Building Clusters: Building Features and Boundaries; EURAC research: Bolzano, Italy, 2019. [Google Scholar]
  57. Marenjak, S.; Krstić, H. Sensitivity analysis of facilities life cycle costs. Teh. Vjesn. 2010, 17, 481–487. [Google Scholar]
  58. Federal Reserve Bank of St. Louis Interest Rates, Discount Rate for Euro Area (INTDSREZQ193N)|FRED|St. Louis Fed. Available online: https://fred.stlouisfed.org/series/INTDSREZQ193N (accessed on 7 July 2020).
  59. Feist, W.; Pfluger, R.; Schneieders, J.; Kah, O.; Kaufman, B.; Krick, B. Passive House Planning Package Version 7; Passive House Institute: Darmstadt, Germany, 2012. [Google Scholar]
  60. Eurostat Electricity Prices for Households in the European Union 2010–2017, Semmi-Annually. Available online: http://epp.eurostat.ec.europa.eu (accessed on 7 July 2020).
  61. EN15459-1:2017. Energy Performance of Buildings—Economic Evaluation Procedure for Energy Systems in Buildings—Part 1: Calculation Procedures, Modules M1-M14; Comite Europeen de Normalisation: Geneva, Switzerland, 2017. [Google Scholar]
  62. SGC. Tarifa de Precios de Reciclaje de Residuos de la Construcción; SGC: Fresno de la Ribera, Spain, 2016. [Google Scholar]
  63. RESIDUALIA. Tarifas—Centro de Gestión Medioambiental Sierra Segura. Available online: http://www.residualia.net/tarifas/ (accessed on 8 November 2019).
  64. BRE; Deloitte; FCT; ICEDD; RPS; VTT, D.-G. Resource Efficient Use of Mixed Wastes Improving Management of Construction and Demolition Waste; Final report; European Commission: Brussels, Belgium, 2017. [Google Scholar]
  65. ICE. Demolition Protocol; Institution of Civil Engineeres: London, UK, 2008. [Google Scholar]
  66. Banias, G.; Achillas, C.; Vlachokostas, C.; Moussiopoulos, N.; Papaioannou, I. A web-based Decision Support System for the optimal management of construction and demolition waste. Waste Manag. 2011, 31, 2497–2502. [Google Scholar] [CrossRef]
Figure 1. Groups and data flow for the end-of-life cost calculation.
Sustainability 12 06255 g001
Figure 2. Groups and data flow for the end-of-life cost calculation.
Sustainability 12 06255 g002
Figure 3. Life Cycle Cost (LCC) breakdown and End-of-Life Cost (EOLC) breakdown percentage.
Sustainability 12 06255 g003
Figure 4. Waste fraction per weight and its influence on transport and waste management cost.
Sustainability 12 06255 g004
Figure 5. Sensitivity analysis. EOLC performance.
Sustainability 12 06255 g005
Table 1. Example of Demolition Complex Cost of building elements (BEs).
DescriptionQiumBE
Roof with cold attic1541m2
ComponentsHeight (cm)
Gypsum board1.30
Wood/air2.80
Plastic foil0.02
Isolation + Wood frames60.00
Wood2.20
Bituminous sheet3.25
TOTAL height69.57
Breakdown cost calculation
umDCjConceptCRij€/umDCj€/umBE
m2Selective demolition wood roof1.00 m2/m27.46 €/m27.46 €/m2
m2Selective demolition wood frames1.00 m2/m214.72 €/m214.72 €/m2
m2Selective demolition suspended ceiling1.00 m2/m22.24 €/m22.24 €/m2
m3Selective demolition isolation panels0.60 m3/m215.42 €/m29.20 €/m2
TOTAL33.67 €/m2
Table 2. Nearly Zero-Energy Buildings (NZEB) case studies description and equipment. Adapted from Pernetti et al. [32].
Sustainability 12 06255 i001 Sustainability 12 06255 i002 Sustainability 12 06255 i003
NameResidence AlizariSolallénVäla Gård
Year201520152012
LocationMalaunay (France)Växjö (Sweden)Helsingborg (Sweden)
GFA {m2}282521001815
Building typologyResidentialResidentialOffice building
Floors513
Construction featuresConcrete structure. Triple glazing, internal and external insulationWood structure. Well insulated and airtightConcrete structure except wood roof. Well insulated and airtight
Equipment featuresBalanced ventilation with heat recovery, centralized wood boiler, photovoltaicsBalanced ventilation with HR, GSHP, photovoltaicsBalanced ventilation with HR, GSHP, photovoltaics
Net final energy consumption63.90 kWh/m2.yr28.18 kWh/m2.yr12.58 kWh/m2.yr
GFA = gross floor area, HR = heat recovery, GSHP = Ground source heat pump
Table 3. Data scenario and assumptions.
ParameterValueSource
Life cycle cost buildingVarious[32]
Time period40 years[32]
Inflation rate0-
Discount rate1.51%[58]
Cost normalization index Spain70.52%[52]
Load Cost (LC)0.65 €/t[39]
Transport Cost (TC)0.69 €/t km[39]
Demolition Cost (DC)Various[39]
Waste Treatment Cost (WC) Material(k)Recycle (WCYk)Disposal (WCDk)[39,62,63]
Mix non-inert-70.00 €/t
Mix inert9.50 €/t30.00 €/t
Concrete4.00 €/t30.00 €/t
Ceramics6.00 €/t30.00 €/t
Wood25.00 €/t70.00 €/t
Glass30.00 €/t70.00 €/t
Bituminous3.50 €/t70.00 €/t
Metal−80.00 €/t30.00 €/t
Cable−900.00 €/t70.00 €/t
Soil3.00 €/t30.00 €/t
Isolation60.00 €/t80.00 €/t
Gypsum based60.00 €/t80.00 €/t
Paper3.50 €/t70,00 €/t
Hazardous-80,00 €/t
Waste Treatment Distance (WTD)15 km-
Recycle waste percentage
Mixed inert, concrete, ceramic75%[65]
Gypsum-based10%[64]
Wood57%[65]
Metal80%[64]
Soil, glass, paper50%[64]
Plastic, bituminous, isolation25%[64]
Table 4. Weight of waste/Gross Floor Area (GFA) (kg/m2).
WasteAlizariResidential. Reinforced. Concrete *SolallénResidential. Wood *Väla GårdNon-Residential. Reinforced Concrete *
Concrete810.76492–840278.95137–300683.50401–768
Wood3.0812–5892.8170–27561.9320–159
Metal45.499.8–28.49.844.8–22.534.6928.4–53
Isolation9.690.1–2.247.320.1–2.219.580.1–2.2
Gypsum27.5710.8–64.340.6110.9–105.412.6710.8–75.7
* [23].

