Spatiotemporal Variation and Climate Influence Factors of Vegetation Ecological Quality in the Sanjiangyuan National Park

1
State Key Laboratory of Environmental Criteria and Risk Assessment, Chinese Research Academy of Environmental Sciences, Beijing 100012, China
2
State Environment Protection Key Laboratory of Regional Eco-Process and Function Assessment, Chinese Research Academy of Environmental Sciences, Beijing 100012, China
*
Author to whom correspondence should be addressed.
Sustainability 2020, 12(16), 6634; https://doi.org/10.3390/su12166634
Submission received: 30 May 2020
/
Revised: 23 July 2020
/
Accepted: 1 August 2020
/
Published: 17 August 2020
(This article belongs to the Special Issue National Parks: Theories and Practices)
Abstract
:The Sanjiangyuan National Park is the first Chinese national park system, and the ecological environment is inherently fragile and sensitive. Therefore, for environmental protection, it is imperative to understand the spatiotemporal variation characteristics of the ecological quality of vegetation and its climate influence factors. We used the MODIS normalized difference vegetation index (NDVI) dataset, meteorological dataset, and Carnegie–Ames–Stanford Approach (CASA) model to investigate the spatiotemporal patterns and change trends of the NDVI and the net primary productivity (NPP) of the vegetation in the Sanjiangyuan National Park from 2000 to 2016. A linear regression model was used to explore the influence of the ecological quality of vegetation and climatic factors. The results showed that (1) the NDVI and NPP were high in the southeast area and low in the northwest area. The Yangtze River headwater region had the lowest NDVI (0–0.3) and NPP (0–100 gC/m2). The Lancang River had the highest NDVI (0.4–0.8) and NPP (100–250 gC/m2). (2) From 2000–2016, approximately 23.46% of the area showed a significant positive trend of the NDVI that was mainly distributed in the prairie areas in the midlands and the north of the Yangtze River headwater region, and was scattered in the midlands and the north of Yellow River headwater region. Furthermore, 24.32% of the NPP was determined to have increased significantly, which was mainly distributed in the midlands and the north of the Yangtze River headwater region, as well as the midlands and the east of the Yellow River headwater region. (3) The vegetation growth in the Sanjiangyuan National Park was regulated by both water and heat conditions. The NDVI was significantly affected by precipitation during the growing season and by the annual precipitation. In addition, the NPP was significantly affected by temperature during the growing season and by the annual average temperature of the study area.
1. Introduction
Vegetation is the core of material circulation and energy flow on Earth, and plays a crucial role in the ecosystem [1]. Vegetation is not only an important environmental factor, but also a sensitive indicator of the land’s ecosystem [2]. With the increase in large-scale productivity studies and the progress in understanding plant eco-physiological processes, gross primary production (GPP) and net primary productivity (NPP) have been proposed to represent the productivity of vegetation [3]. Defined as the amount of organic matter produced by green plants per unit of time and area [4], NPP indicates the balance between the carbon gained by GPP and the carbon released by plant respiration [5]. And the normalized difference vegetation index (NDVI) as displayed in temporal variation of a spectral vegetation index has been used to reflect the state of vegetation cover, which is calculated as the difference between the near-infrared and visible reflectances divided by the sum of the two [6].
The Sanjiangyuan region lies in the hinterland of the Qinghai–Tibet Plateau, Qinghai Province, China and is generally considered to be one of the most sensitive zones to climate change in the world [7,8]. In recent decades, understanding the spatial and temporal patterns of vegetation and its interactions with environmental factors (i.e., climate factors and anthropogenic factors) has been the focus of studies on global climate change [9,10,11,12]. As an important aspect of the studies on global climate change and the response of vegetation to the changes [13], a series of studies have been carried out in the Sanjiangyuan region. Many scholars have studied the spatial and temporal distribution of vegetation status (i.e., NDVI, NPP) and the effects of climate change and human activities on the vegetation status. The methods used to estimate NPP in the Sanjiangyuan region can be broadly divided into two categories: Field measurements and model simulations [14]. Among these techniques, the Carnegie–Ames–Stanford Approach (CASA) model has been successfully applied as a remote-sensing-based approach to mapping NPP patterns worldwide, including in mainland China [15]. These approaches are relatively simple and are efficient for the exploration of dynamic changes in NPP and their spatiotemporal variations at larger scales.
Since the year 2000, the Chinese government has adopted a variety of measures to protect and restore the ecological environment, including the creation of the Sanjiangyuan National Nature Reserve (SNNR) in 2000 and the implementation of a project of ecological protection and construction for the SNNR. The overall trends of the degradation of the ecosystem were initially contained and partially improved [16]. The effectiveness of ecological conservation has been assessed quantitatively, and the contributions of climate change and human activity to vegetation growth were calculated to be 79.32% and 20.68%, respectively [17].
In particular, the establishment of the Sanjiangyuan National Park in 2016 has further strengthened the efforts to protect the authenticity and integrity of ecosystem. Thus, human disturbances to vegetation cover in the Sanjiangyuan National Park have been strictly limited. Climatic conditions can be considered to be the dominant factor determining vegetation dynamics and ecological quality status. Therefore, the examination of the spatiotemporal patterns of the status of vegetation and environmental controls is necessary and is of great importance to the decision-making regarding vegetation protection and restoration by the management of Sanjiangyuan National Park. The aims of this study are (i) to examine the spatial pattern of NDVI and NPP in Sanjiangyuan National Park, (ii) to explore the response of different vegetation types to climate change in Sanjiangyuan National Park, and (iii) to investigate the relationships between NDVI, NPP, and climate factors at a spatiotemporal scale in Sanjiangyuan National Park.
2. Materials and Methods
2.1. Study Area
The Sanjiangyuan National Park is located in the south of Qinghai province, between 33°09′ and 36°47′ N and between 89°50′ and 95°18′ E. It covers a total area of 123,100 km2, accounting for 31.16% of the total area of the Sanjiangyuan region. The Sanjiangyuan National Park is the source of three important rivers in Asia, i.e., the Yellow, Yangtze, and Lancang Rivers. The Yellow River headwater region is located in Maduo county, Guoluo prefecture and covers an area of 19,100 km2; the Yangtze River headwater region (Kekexili) is located in Zhiduo and Qumalai counties of Yushu prefecture and covers an area of 90,300 km2; and the Lancang River headwater region is located in Zaduo county, Yushu prefecture and covers an area of 13,700 km2. The altitude of the Sanjiangyuan National Park is 3774–6821 m. The Yangtze River headwater region has the highest average altitude, at 4772 m, followed by the Lancang River, at 4734 m, while the Yellow River headwater region has the lowest average altitude, at 4400 m (Figure 1).
Generally, the vegetation types in Sanjiangyuan National Park mainly include coniferous forest, shrub, meadow, prairie, and alpine vegetation. Meadow and prairie are the most important types of ecosystems, accounting for 45.42% and 37.23% of the total area, respectively, followed by alpine vegetation. Spatially, the vegetation of the studied region is differentiated along the gradient of precipitation, especially in the Yangtze River headwater region, where the precipitation gradually increases from west to east. In the western and driest part of the region (200–300 mm precipitation/year), sub-desert steppe is dominant, and gradually tends toward the east into steppe xeric grasslands dominated by Stipa purpurea. The eastern part of the region is occupied by rich-in-species mesoxeric steppe grasslands (450–550 mm/year). In the Lancang area, the rich-in-species s mesoxeric steppe grasslands are predominant, but in the valleys at its eastern border, there are conifer forests dominated by Picea likiangensis, Picea purpurea, and Pinus densata. The Yellow River headwater region is dominated in the northern half by xeric steppes with Stipa purpurea, while in the south, in the context of a more humid climate, the rich-in-species and very dense mesoxeric steppes are predominant [18,19,20,21]. The studied area is also, according to the Worldwide Fund for Nature(WWF), a part of the Central China eco-region that is particularly important for the conservation of large mammal fauna, containing the rare snow leopard, Panthera uncia, and many ungulate species [22,23]. This fauna, with most of its valuable species in a critically endangered/endangered status, depends on the state of the vegetation of the region.
2.2. Data Collection and Processing
Currently, the widely used NDVI datasets are primarily based on an advanced very-high-resolution radiometer (AVHRR), SPOT-VEGETATION, and MODIS sensors [24,25,26,27]; the significant differences in sensors, spatiotemporal resolution, and vegetation indexes result in identical surface reflectance producing different NDVIs. Among these NDVI datasets, the MODIS NDVI dataset has a relatively high spatial resolution of 250 × 250 m and sufficient temporal resolution of 16 days, and the MODIS time series, based on a single sensor, can effectively inhibit the influence of a platform/sensor shift [28]. Therefore, the MODIS NDVI datasets from the year 2000 to 2016 were derived from NASA’s Earth Observing System and used in this study. The NDVI datasets were selected only during the growing season (May–October), which represents the active status of plant growth, and the maximum growing season NDVI was chosen to represent the yearly NDVI. Pixel NDVI datasets were obtained using the maximum value composite (MVC) method, which selects the highest observation for each pixel from a predefined compositing period to represent the current period, and could minimize the effects of clouds, atmospheric conditions, and solar altitude [29].
The climatic datasets consisting of daily mean temperature and daily precipitation data from the year 2000 to 2016 were collected from the National Meteorological Center of China. There are 17 meteorological stations in the Sanjiangyuan National Park and its neighboring regions. The spatial locations of the meteorological stations are shown in Figure 1. The inverse distance weighted technique was used to interpolate the data into raster layers [30]. For further analysis, the spatial time series of the yearly NDVI, NPP, temperature, and precipitation from the year 2000 to 2016 were generated.
2.3. Methods
2.3.1. Framework of NPP Assessment
A process-based Carnegie-Ames-Stanford Approach (CASA) model was used to simulate net primary productivity (NPP) for the carbon sequestration function. NPP at a grid cell (x) in month t is a product of intercepted photosynthetically active radiation (IPAR) and a light utilization efficiency (ε) that is modified by temperature and soil moisture. Neither IPAR nor ε is dependent on ecosystem type [31].
NPP(x,t) = IPAR(x,t) × ε(x,t)
IPAR(x,t) = SOL(x,t) × FPAR(x,t) × 0.5
SOL is the total solar radiation incident on grid cell x in month t (MJ/m2) [32], FPAR is the fraction of the incoming photosynthetically active radiation (PAR) intercepted by green vegetation, and the factor of 0.5 accounts for the fact that approximately half of the incoming solar radiation is in the PAR waveband (0.4–0.7 μm) [33].
FPAR is calculated based on the AVHRR simple ratio (SR), where
represents SR for unvegetated land areas and is set to 1.08 for all grid cells [31]. approximates the value at which all downwelling solar radiation is intercepted and corrects for effects of canopy architecture and residual cloud contamination. ε is calculated based on temperature and water condition [31]:
where Tε1 and Tε2 account for the effects of temperature stress, Wε accounts for effects of water stress, and ε* is the maximum possible efficiency and is set to 0.56 g C/MJ [34].
ε(x,t) = Tε1(x,t) × Tε2(x,t) × Wε(x,t) × ε*
2.3.2. Trends and Regression Analysis
To investigate the relationship between vegetation and climatic factors, the linear trends for yearly NDVI, NPP, annual precipitation, and average temperature were first analyzed, and linear regression models based on the climate factors and NDVI and NPP were constructed. The linear time trend was estimated by regressing it as a function of time over the study period; the slope of each variable is expressed as follows:
where Vi represents the value of the sequence in year i and n is the length of the sequence.
The elementary structure form of the linear regression model for different data is as follows:
Parameters a and b are estimated by the least squares method; is residual error; Yi represents NDVI or NPP, while Xi is average temperature or precipitation. is the mean of all monthly NVDI or NPP from 2000 to 2016 at the corresponding pixel. is the mean of all average temperature or precipitation data from 2000 to 2016 at the corresponding pixel.
2.3.3. Trends and Relationship Classification
To check the validity, a significance test is required. The F-test was used to test for the significance of the linear trend and the correlation coefficient between vegetation and climatic factors. More specifically, changing trends were divided into five categories: Extremely significant increase (ESI), significant increase (SI), extremely significant decrease (ESD), significant decrease (SD), and insignificant change (IS), according to the slope and significance level of the F-test. A changing trend is considered to be an ESI if slope > 0 and p ≤ 0.01, SI if slope > 0 and 0.01 < p ≤ 0.05, ESD if slope < 0 and p ≤ 0.01, SD if slope < 0 and 0.01 < p ≤ 0.05, and an IS if slope = 0 or p > 0.05. The relationships were then divided into five categories (extremely significant positive correlation (ESPC), significant positive correlation (SPC), extremely significant negative correlation (ESNC), significant negative correlation (SNC), and insignificant correlation (ISC)) according to the correlation coefficient and significance level of the F-test. It is considered an ESPC if the correlation coefficient > 0 and p ≤ 0.01, SPC if the correlation coefficient > 0 and 0.01< p ≤ 0.05, ESNC if the correlation coefficient < 0 and p ≤ 0.01, SNC if the correlation coefficient <0 and 0.01< p ≤ 0.05, and ISC if the correlation coefficient = 0 or p > 0.05.
3. Results
3.1. Spatial Patterns of NDVI and NPP
The spatial distributions of the perennial average values of NDVI and NPP in the Sanjiangyuan National Park are shown in Figure 2. Overall, the NDVI was high in the southeast and low in the northwest. Similar results have been reported in previous research [35]. For the entire region, the mean annual maximum NDVI from 2000–2016 was 0.31, ranging from 0.06 to 0.82. The Yangtze River headwater region had the lowest NDVI, which was mostly concentrated between 0 and 0.3, and the Lancang River headwater region had the highest NDVI, which was mostly concentrated between 0.4 and 0.8. It was clear to see that the NPP had similar spatial distribution patterns of high in the southeast and low in the northwest, and the mean annual NPP from 2000–2016 was 93 gC/m2, ranging from 0.01 to 410.62 gC/m2. The NPP of the Yangtze River headwater region was predominantly 0–100 gC/m2, and 100–250 gC/m2 for the Lancang River headwater region.
Among the different vegetation types (Figure 3), the perennial average NDVI ranged from 0.19 to 0.67, and the NPP ranged from 39.77 to 352.36 gC/m2. The coniferous forests had the highest values of NDVI and NPP, followed by the shrub and meadow, while the prairie had the lowest values of NDVI and NPP.
3.2. Regional Scale Changes in NDVI and NPP
Based on an analysis of time-series data from 2000 to 2016, the regional NDVI and NPP conditions of the Sanjiangyuan National Park exhibited a slightly increasing trend, with an annual increase by an average of 0.0009/a and 0.7523 gC/m2/a, respectively. According to an intuitive analysis of the interannual statistical data, there was a decline in NDVI and NPP after 2014 [36], which may be due to climate change or the ignorance of spatial heterogeneity [37,38]. Therefore, to reduce the impact of the value of possible outliers, we analyzed the trends of NDVI and NPP from 2000 to 2014. From 2000 to 2014, the NDVI exhibited a significant increasing trend in all vegetation types (Table 1). Shrub exhibited the highest rate of 0.0028/a (p < 0.05) by ranging from 0.5714 to 0.6444, followed by the meadow with a rate of 0.0026/a (p < 0.05), ranging from 0.4081 to 0.4691. From 2000 to 2014, the NPP also exhibited a significant increasing trend in all vegetation types. Shrub had the highest rate, 2.90 gC/m2/a (p < 0.05), by ranging from 224.60 to 301.92 gC/m2/a, followed by the meadow with a rate of 2.03 gC/m2/a (p < 0.05), ranging from 121.40 to 184.25 gC/m2/a.
From 2000 to 2014, the NDVI exhibited a significant increasing trend in the study area, with a rate of increase of 0.0022/a, ranging from 0.32 to 0.36 (p < 0.05) (Figure 4a). There were significant differences between the three headwater regions; the annual maximum NDVI at the Yellow River headwater region ranged from 0.39 to 0.47, with a significant upward trend at a rate of 0.0035/a (p < 0.05) (Figure 4b), which was faster than the trend of the entire study area. The annual maximum NDVI at the Yangtze River headwater region ranged from 0.26 to 0.30, with a significant upward trend at a rate of 0.0020/a (p < 0.05) (Figure 4c). However, the annual maximum NDVI at the Lancang River headwater region ranged from 0.50 to 0.56 with no significant change (Figure 4d).
The annual NPP exhibited a significant upward trend at a rate of 1.3824 gC/m2/a (p < 0.05), ranging from 81.49 to 123.46 gC/m2/a between 2000–2014 (Figure 5a). The annual NPP at the Yellow River headwater region ranged from 107.22 to 180.37 gC/m2/a, with a significant upward trend at a rate of 2.661/a (p < 0.05) (Figure 5b), which was faster than the trend for the entire study area. The annual NPP at the Yangtze River headwater region ranged from 57.38 to 88.50 gC/m2/a (Figure 5c), with a significant upward trend at a rate of 1.0207 gC/m2/a (p < 0.05), which was slower than the trend for the entire study area. However, the annual NPP at the Lancang River headwater region ranged from 183.73 to 245.58 gC/m2/a (Figure 5d) with no significant change.
3.3. Pixel Scale Changes in NDVI and NPP
The NDVI and NPP trends were also analyzed based on the pixel data to discover their changing trends more comprehensively. Although the trends in NDVI and NPP exhibited no significant trend from 2000–2016, they indicated a high degree of spatial heterogeneity on a per-pixel analysis, as shown in Figure 6. In general, NDVI and NPP showed insignificant changes in most regions, accounting for 75.15% and 75.40%, respectively. The areas for NDVI and NPP with increased change (extremely significant increase + significant increase) accounted for 23.46% and 24.32% of the area, respectively. Spatially, the regions of increased change in NDVI were mainly distributed in the prairie areas in the midlands and north of the Yangtze River headwater region, and scattered in the midlands and north of the Yellow River headwater region. The regions of increased change in NPP were mainly distributed in the midlands and north of the Yangtze River headwater region, and the midlands and east of the Yellow River headwater region. In addition, only a small percentage showed a decreasing trend of approximately 1.39% and 0.29% of the Sanjiangyuan National Park area for NDVI and NPP.
The Yangtze River headwater region had the largest proportion of extremely significant increase in NDVI (13.58%), and the Yellow River headwater region had the largest proportion of extremely significant increase in NPP (23.24%), whereas the Lancang River headwater region showed no significant change for either NDVI or NPP (Table 2 and Table 3).
3.4. Changes in Annual Precipitation and Average Temperature
Based on an analysis of time-series data of the annual precipitation and the annual mean temperature from 2000–2016, there was no obvious trend for the annual precipitation, while there was a significantly increasing trend of the annual mean temperature at the regional scale. The variation rate of annual precipitation was 1.07 mm/a (p > 0.1), and the variation rate of annual mean temperature was 0.05 °C/a (p < 0.01). Similarly to NDVI and NPP, the trend for annual precipitation and annual average temperature for the 2000–2014 period was analyzed. The regional climate conditions of the Sanjiangyuan National Park exhibited a significantly warming and wetting trend from 2000–2014, with an annual increase in the precipitation and temperature of 4.37 mm/a (p < 0.05) and 0.05 °C/a (p = 0.05), respectively.
The Yellow River headwater region indicated a significant increasing trend in annual precipitation at a rate of 7.03 mm/a (p < 0.05) (Figure 7b), and the Yangtze River headwater region also indicated a slightly significant increase trend at a rate of 3.83 mm/a (p < 0.1) (Figure 7c), while the Lancang River headwater region showed no significant change in annual precipitation (Figure 7d). The annual average temperature at the Yellow River headwater region exhibited a significant upward trend at a rate of 0.0433 °C/a (p = 0.053) (Figure 8b), the Yangtze River headwater region at a rate of 0.0483 °C/a (p = 0.053) (Figure 8c), and the Lancang River at a rate of 0.0543 °C/a (p = 0.05) (Figure 8d).
3.5. Response of Vegetation to Climatic Conditions at Regional Scale
The linear regression analysis between the NDVI and NPP and the annual precipitation and annual average temperature indicated a highly significant positive correlation between NDVI and annual precipitation and between NPP and annual average temperature in the Sanjiangyuan National Park (Table 4, Figure 9 and Figure 10).
The correlation coefficient of NDVI and annual precipitation was 0.6729 (p = 0.0031), and the Yangtze River headwater region had the highest correlation coefficient of 0.6849 (p = 0.0024). The correlation coefficient of NPP and annual average temperature was 0.5396 (p = 0.0254), and the Yangtze River headwater region had the highest correlation coefficient of 0.5350 (p = 0.0625).
There was no significant correlation between NDVI and annual average temperature in all three parks, and no significant correlation between NPP and annual precipitation in the Yangtze and Lancang Rivers. However, a positive correlation between NPP and annual precipitation was detected in the Yellow River (R = 0.4828, p = 0.05).
The response of vegetation to climatic conditions indicated a highly significant positive correlation between NDVI and annual precipitation among all vegetation types, especially in the meadow and prairie (Table 5). The correlation coefficient of NDVI and annual precipitation was 0.6930 (p = 0.0020) for the meadow and 0.6105 (p = 0.0092) for the prairie. A significant positive correlation between NDVI and annual average temperature was also detected in the prairie, shrub, and alpine types, with correlation coefficients of 0.4671 (p = 0.0587), 0.4417 (p = 0.0759), and 0.4221 (p = 0.0915), respectively. In addition, the unilateral significance test of the influence of the average annual temperature on NDVI passed the 95% confidence level. However, no significant relationships between NDVI and annual average temperature were detected in the meadow and coniferous forest. Furthermore, a highly significant positive correlation between NPP and annual average temperature were also detected among all vegetation types, but there were no significant relationships between NPP and annual precipitation.
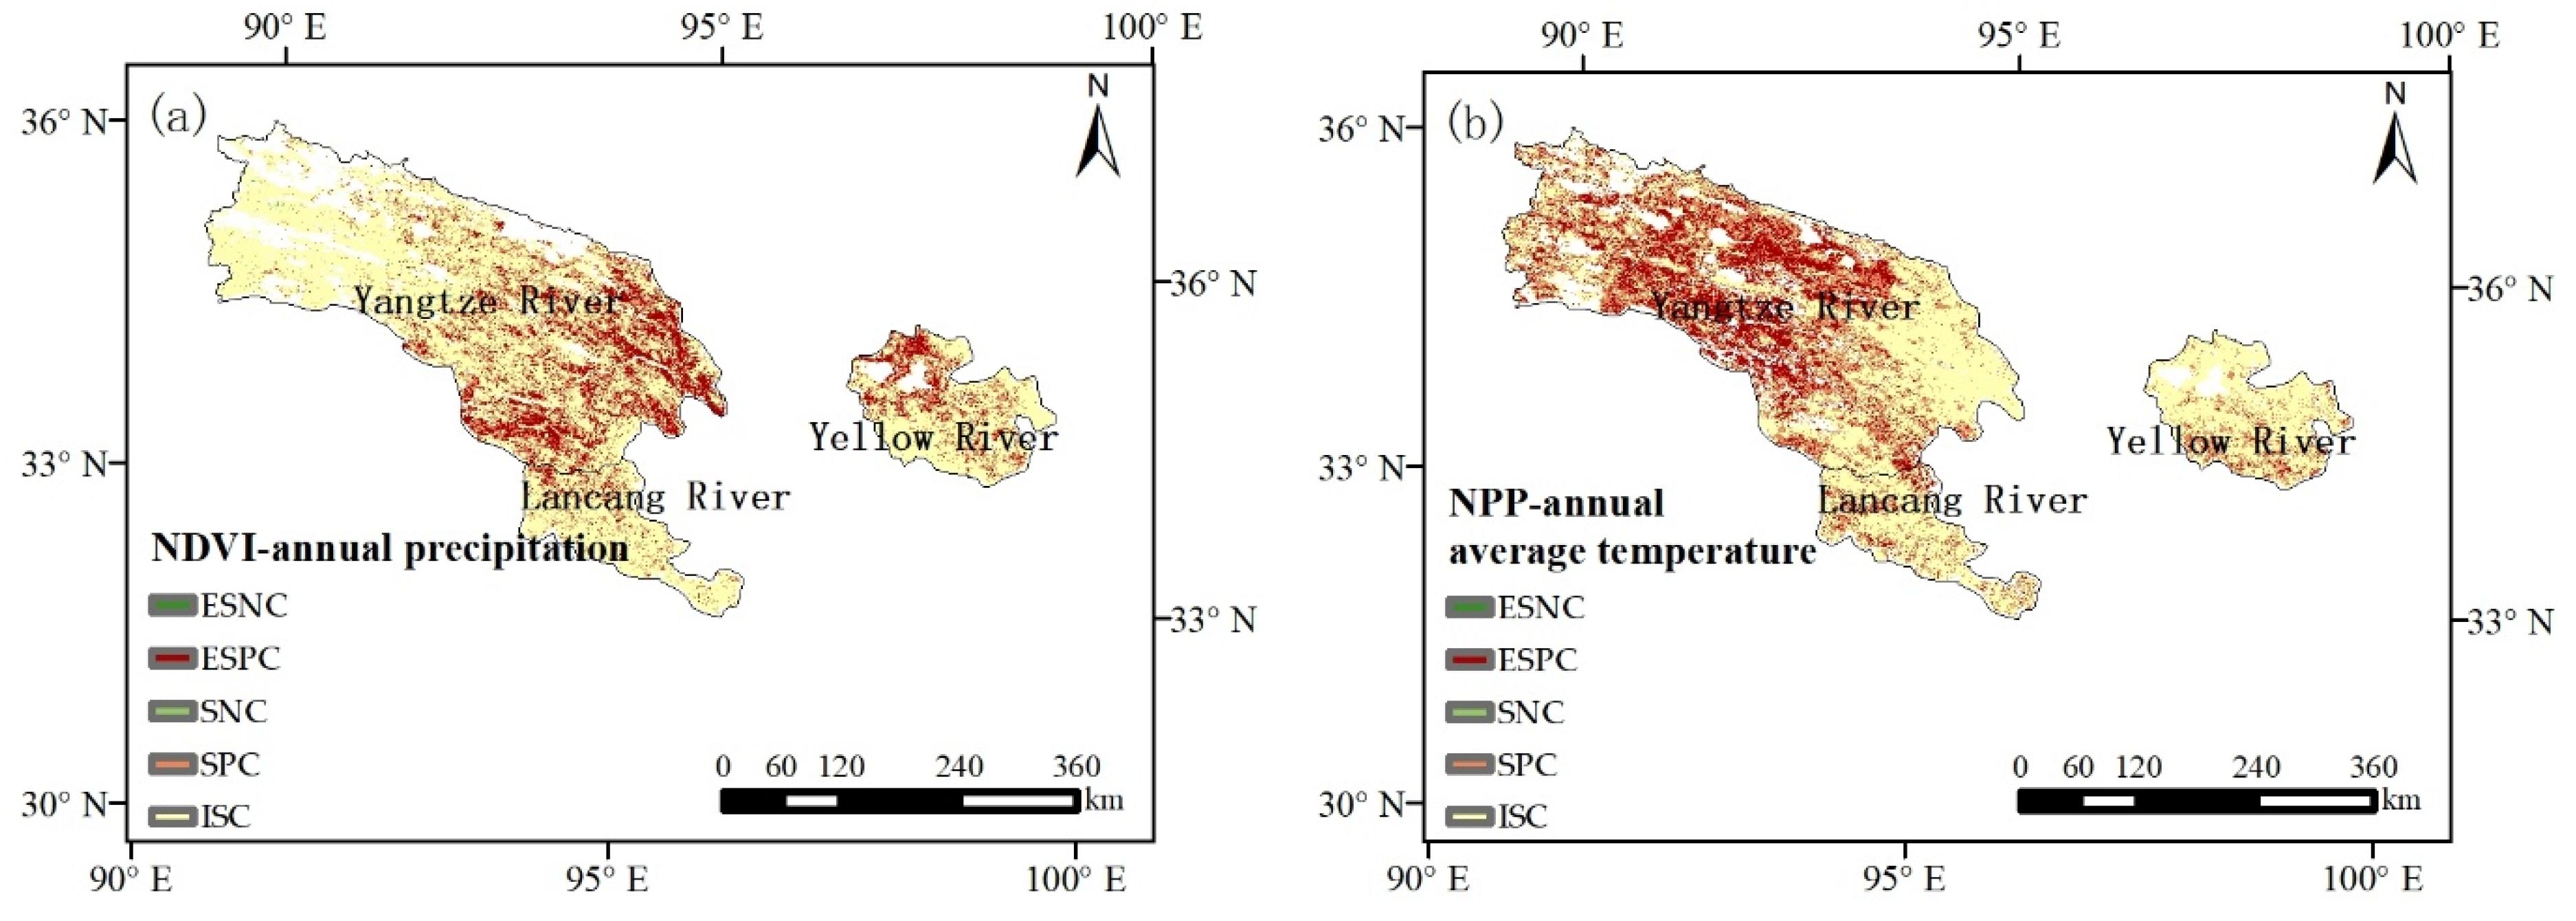
3.6. Response of Vegetation to Climatic Conditions at Pixel Scale
The relationships between NDVI and annual precipitation, as well as NPP and average temperature, were also analyzed using the pixel data. In general, a positive correlation was detected in 32.11% of regions between NDVI and annual precipitation, and 67.64% of regions showed insignificant correlation, whereas a very small proportion indicated a negative correlation (0.25%) (Table 6). Spatially, the regions of positive correlation were mostly distributed in the meadow areas in the east and south of the Yangtze River headwater region and in the midlands and northwest of the Yellow River headwater region (Figure 11a). The Yangtze River headwater region had the largest proportion of extremely significant positive correlation (15.32%) and of significant positive correlation (18.59%) (Table 6). Notably, a considerable proportion (approximately 46.09%) of the areas indicated a positive correlation between NPP and annual average temperature, and 53.90% of regions showed insignificant correlation, whereas a small proportion indicated a negative correlation (0.01%) (Table 7). Spatially, the regions of positive correlation were mostly distributed in the prairie and meadow areas in the west and north of the Yangtze River headwater region and in the midlands and south of the Yellow River headwater region (Figure 11b). The Yangtze River headwater region had the largest proportion of extremely significant positive correlation (24.56%) and of significant positive correlation (29.60%) (Table 7).
4. Discussions
NDVI and NPP are of great significance for evaluating vegetation dynamics and ecological quality status. Vegetation dynamics and ecological quality status are comprehensively affected by the biochemical characteristics of vegetation, climatic conditions, and human disturbances [39,40,41]. As the first Chinese national park system, Sanjiangyuan National Park is also the most concentrated and ecologically sensitive area in the high-altitude areas of the world. The status of the vegetation of the region is highly sensitive to climatic changes. Therefore, we analyzed the temporal and spatial change of NDVI and NPP and investigated the response of vegetation to climate conditions.
4.1. The Spatiotemporal Variation of Vegetation NDVI and NPP
No obvious positive or negative trend was detected in the annual NDVI and NPP time series between 2000–2016, though a significant increasing trend was generalized during the 2000–2014 period. The findings were similar to those of the studies by Xu et al. and Ze et al. [36,42]. However, Zheng et al. [43] reported no positive or negative trend in annual GIMMS AVHRR NDVI time series during 2001–2013. This further clarified that different NDVI datasets and different processing methods for NDVI datasets could induce different findings. There was a high degree of spatial heterogeneity of the annual NDVI and NPP time series from 2000–2016 in the Sanjiangyuan National Park. Generally, an insignificant increase or decrease in NDVI and NPP was detected in most parts of the region, and only a very small fraction showed a decreasing trend. The areas with obvious increased change were mainly distributed in the prairie areas in the Yangtze River headwater region and Yellow River headwater region. A previous study in the upper catchments of the Yellow River also confirmed that vegetation was relatively stable, with a significantly increasing trend in the largest part of the study area. Approximately 20%–30% of the vegetation was significantly correlated with climatic factors, and the correlations in most areas were positive [44].
4.2. The Response of Vegetation to Annual Precipitation and Annual Average Temperature
There was no significant increasing or decreasing trend in annual precipitation, but there was a significant increase in the average annual temperature from 2000–2016. Similar conclusions have been found in previous studies. For example, Jiang and Zhang [45] indicated that 100% of the stations in the Three-Rivers Headwater Region showed an increasing temperature trend in the 21st century. Lan et al. [46] reported that average annual precipitation change in the Yellow River headwater region has not been evident in the past 50 years as a whole. Studies have shown that in the arid and semi-arid regions, the NDVI was mainly influenced by the precipitation and had little correlation with temperature [47,48]. The findings in this study also drew similar conclusions. There existed a highly significant positive correlation between NDVI and annual precipitation among all vegetation types, especially in the meadow and prairie. A weak significant positive correlation between NDVI and annual average temperature was detected in the prairie, shrub, and alpine types. In addition, the annual average temperature establishes the important climatic factor influencing the NPP, while no significant linear correlation was detected between the NPP and annual precipitation.
4.3. The Response of Vegetation to Precipitation and Average Temperature of Different Months
It is possible that the data homogenization with annual scale analysis would cause the weak correlations between temperature and NDVI and between precipitation and NPP. We explored the relationships between monthly precipitation and average temperature during the growing season with NDVI and NPP. Several interesting findings were identified: (i) There was a positive relationship between precipitation during the growing season and NDVI (R = 0.6639, p < 0.01). Notably, the precipitation during the growing season was significantly correlated with the annual precipitation (R = 0.9660), which illustrated that the precipitation during the growing season was the main factor influencing annual precipitation and NDVI. (ii) There was no significant correlation between the average temperature during the growing season and the NDVI. However, a positive relationship was detected between the average temperature in May and NDVI for the Yellow River (R = 0.5056, p < 0.05), the average temperature in September and NDVI for the Yangtze River (R = 0.5158, p < 0.05), and the average temperature in July and NDVI for the Lancang River headwater region (R = 0.4589, p = 0.064). (iii) There was also a positive relationship between the average temperature during the growing season and NPP (R = 0.7817, p < 0.001). Additionally, the Yellow River headwater region exhibited a correlation coefficient of 0.8055. (iv) A positive relationship was detected between the precipitation in July and NPP for the Yellow River (R = 0.3824, p < 0.05), and a weak positive relationship was detected between the precipitation in July and NPP for the Yangtze River headwater region (R = 0.1312, p = 0.07).
5. Conclusions
This study analyzed the spatiotemporal patterns of NDVI and NPP from 2000 to 2016 and investigated their responses to climate factors. We drew the following conclusions:
- (1)
- There was a significant spatial heterogeneity of NDVI and NPP in the Sanjiangyuan National Park. Generally, the NDVI and NPP values were high in the southeast and low in the northwest. The Yangtze River headwater region had the lowest value of NDVI, mainly in the range of 0 to 0.3, and of NPP, mainly in the range of 0 to 100 gC/m2; the Lancang River had the highest value of NDVI, mainly in the range of 0.4 to 0.8, and of NPP, mainly in the range of 100 to 250 gC/m2. As for the five vegetation categories, the coniferous forests had the highest values of NDVI and NPP, followed by the shrub and meadow, while the prairie had the lowest values of NDVI and NPP.
- (2)
- There were no obvious positive or negative trends in the annual NDVI and NPP time series from 2000–2016. However, a general significant increasing trend was found during the 2000–2014 period with an average annual growth rate of 0.0022/a (p < 0.05) and 1.3824 gC/m2/a (p < 0.05). From 2000–2016, approximately 23.46% of the area showed a significant positive trend of NDVI that was mainly distributed in the prairie areas in the midlands and the north of the Yangtze River headwater region and in the midlands and the north of the Yellow River headwater region. It was determined that 24.32% of the NPP time series increased significantly, mainly distributed in the midlands and north of the Yangtze River headwater region and in the midlands and east of the Yellow River headwater region.
- (3)
- The vegetation growth in the Sanjiangyuan National Park was regulated using both water and heat conditions. The NDVI–annual average temperature correlation was stronger than NDVI–annual average temperature correlation in the three headwater regions and for all vegetation types. Increased precipitation and temperature could enhance photosynthesis and respiration for plant growth. Additionally, average temperature was an influencing factor of the change in NPP in the area, with a positive correlation with all vegetation types. However, there was no significant correlation between NPP and annual precipitation among all vegetation types, but weak positive influences on the NPP were detected in the prairie and meadow based on the unilateral significance test.
- (4)
- The response of vegetation to climate condition showed great spatial and temporal differences. The NDVI was profoundly affected by precipitation during the growing season for the study area, and was also influenced by the average temperature in May for the Yellow River headwater region, September for the Yangtze River headwater region, and July for the Lancang River headwater region. The NPP was significantly affected by temperature during the growing season for the study area. In addition, the NPP was regulated by the precipitation in July for the Yellow River and Yangtze River headwater regions.
Author Contributions
Q.S. and W.L. designed the framework and wrote the manuscript, W.L. and J.L. provided direction for the research, Q.S. analyzed and investigated the research, Y.G and C.Y. provided the original datasets. W.L. and Y.G. engaged in the funding acquisition. All authors have read and agreed to the published version of the manuscript.
Funding
This study was supported by the National Key Research and Development Program of China (No.2016YFC0500205, No. 2017YFC0503806) and the National Natural Science Foundation of China (No. 41501381).
Conflicts of Interest
The authors declare no conflict of interest.
References
- Running, S.W. A Measurable Planetary Boundary for the Biosphere. Science 2012, 337, 1458–1459. [Google Scholar] [CrossRef] [PubMed] [Green Version]
- Piao, S.; Wang, X.; Park, T.; Chen, C.; Lian, X.; He, Y.; Bjerke, J.W.; Chen, A.; Ciais, P.; Tømmervik, H.; et al. Characteristics, drivers and feedbacks of global greening. Nat. Rev. Earth Environ. 2019, 1, 14–27. [Google Scholar] [CrossRef]
- Chu, C.; Bartlett, M.; Wang, Y.; He, F.; Weiner, J.; Chave, J.; Sack, L. Does climate directly influence NPP globally? Glob. Chang. Boil. 2015, 22, 12–24. [Google Scholar] [CrossRef] [PubMed]
- Field, C.B.; Randerson, J.T.; Malmstrom, C.M. Global net primary production: Combining ecology and remote sensing. Remote. Sens. Environ. 1995, 51, 74–88. [Google Scholar] [CrossRef] [Green Version]
- Wang, X.; Tan, K.; Chen, B.; Du, P. Assessing the Spatiotemporal Variation and Impact Factors of Net Primary Productivity in China. Sci. Rep. 2017, 7, 44415. [Google Scholar] [CrossRef] [Green Version]
- Defries, R.S.; Townshend, J.R.G. NDVI-derived land cover classifications at a global scale. Int. J. Remote Sens. 1994, 15, 3567–3586. [Google Scholar] [CrossRef]
- Piao, S.L.; Fang, J.Y.; He, J.S. Variations in vegetation net primary production in the Qinghai–Xiang Plateau, China, from 1982 to 1999. Clim. Chang. 2006, 74, 253–267. [Google Scholar] [CrossRef]
- Yang, Y.; Guan, H.; Shen, M.; Liang, W.; Jiang, L. Changes in autumn vegetation dormancy onset date and the climate controls across temperate ecosystems in China from 1982 to 2010. Glob. Chang. Biol. 2014, 21, 652–665. [Google Scholar] [CrossRef]
- El Masri, B.; Barman, R.; Meiyappan, P.; Song, Y.; Liang, M.; Jain, A. Carbon dynamics in the Amazonian Basin: Integration of eddy covariance and ecophysiological data with a land surface model. Agric. For. Meteorol. 2013, 182, 156–167. [Google Scholar] [CrossRef]
- Hemming, D.; Betts, R.; Collins, M. Sensitivity and uncertainty of modelled terrestrial net primary productivity to doubled CO2 and associated climate change for a relatively large perturbed physics ensemble. Agric. For. Meteorol. 2013, 170, 79–88. [Google Scholar] [CrossRef]
- Piao, S.; Fang, J.; Zhou, L.; Zhu, B.; Tan, K.; Tao, S. Changes in vegetation net primary productivity from 1982 to 1999 in China. Glob. Biogeochem. Cycles 2005, 19. [Google Scholar] [CrossRef] [Green Version]
- Zhao, M.; Running, S.W. Drought-Induced Reduction in Global Terrestrial Net Primary Production from 2000 Through 2009. Science 2010, 329, 940–943. [Google Scholar] [CrossRef] [PubMed] [Green Version]
- Liu, Y.; Ju, W.; He, H.; Wang, S.; Sun, R.; Zhang, Y. Changes of net primary productivity in China during recent 11 years detected using an ecological model driven by MODIS data. Front. Earth Sci. 2012, 7, 112–127. [Google Scholar] [CrossRef]
- Sun, Q.; Li, B.; Zhou, C.; Li, F.; Zhang, Z.; Ding, L.; Zhang, T.; Xu, L. A systematic review of research studies on the estimation of net primary productivity in the Three-River Headwater Region, China. J. Geogr. Sci. 2016, 27, 161–182. [Google Scholar] [CrossRef]
- Fang, J.Y.; Piao, S.L.; He, J.S.; Field, C.B.; Pan, Y.; Guo, Q.; Zhou, L.; Tao, S. Increasing net primary production in China from 1982 to 1999. Front. Ecol. Environ. 2003, 1, 293–297. [Google Scholar] [CrossRef]
- Shao, Q.; Fan, J.; Liu, J.; Huang, L.; Cao, W.; Liu, L. Target-based Assessment on Effects of First-stage Ecological Conservation and Restoration Project in Three-river Source Region, China and Policy Recommendations. Chinese Sci. Bull. 2017, 32, 35–44. (In Chinese) [Google Scholar]
- Li, H.; Liu, G.; Fu, B. Response of vegetation to climate change and human activity based on NDVI in the Three-River Headwaters region. Acta Ecol. Sin. 2011, 31, 5495–5504. (In Chinese) [Google Scholar]
- Hou, X.Y. Vegetation of China; People’s Education Press: Beijing, China, 1960. (In Chinese) [Google Scholar]
- Wang, C.W. The Forests of China with a Survey of Grassland and Desert Vegetation; Harvard University: Cambridge, MA, USA, 1961. [Google Scholar]
- Chang, D.H.S. The Vegetation Zonation of the Tibetan Plateau. Mt. Res. Dev. 1981, 1, 29. [Google Scholar] [CrossRef]
- Chen, L.Z.; Sun, H.; Guo, K. Flora and Vegetation Geography of China; Science Press: Beijing, China, 2014. (In Chinese) [Google Scholar]
- MacKinnon, J.; Sha, M.; Cheung, C.; Carey, G.; Xiang, Z.; Melville, D. A Biodiversity Review of China; Worldwide Fund for Nature (WWF) International: Hong Kong, China, 1996. [Google Scholar]
- Schaller, G.B. Wildlife of the Tibetan Steppe; The University of Chicago Press: Chicago, IL, USA, 1998. [Google Scholar]
- Brown, M.E.; Pinzon, J.; Didan, K.; Morisette, J.; Tucker, C. Evaluation of the consistency of long-term NDVI time series derived from AVHRR, SPOT-vegetation, SeaWiFS, MODIS, and Landsat ETM+ sensors. IEEE Trans. Geosci. Remote Sens. 2006, 44, 1787–1793. [Google Scholar] [CrossRef]
- Chen, P.-Y.; Fedosejevs, G.; Tiscareño-López, M.; Arnold, J.G. Assessment of MODIS-EVI, MODIS-NDVI and VEGETATION-NDVI Composite Data Using Agricultural Measurements: An Example at Corn Fields in Western Mexico. Environ. Monit. Assess. 2005, 119, 69–82. [Google Scholar] [CrossRef]
- Fensholt, R.; Proud, S.R. Evaluation of Earth Observation based global long term vegetation trends—Comparing GIMMS and MODIS global NDVI time series. Remote Sens. Environ. 2012, 119, 131–147. [Google Scholar] [CrossRef]
- Shen, X.; An, R.; Feng, L.; Ye, N.; Zhu, L.; Li, M. Vegetation changes in the Three-River Headwaters Region of the Tibetan Plateau of China. Ecol. Indic. 2018, 93, 804–812. [Google Scholar] [CrossRef]
- Vermote, E.F.; Kotchenova, S.Y.; Ray, J.P. MODIS Surface Reflectance User’s Guide. MODIS Land Surf. Reflect. Sci. Comput. Facil. 2011, 1. [Google Scholar]
- Holben, B.N. Characteristics of maximum-value composite images from temporal AVHRR data. Int. J. Remote Sens. 1986, 7, 1417–1434. [Google Scholar] [CrossRef]
- Basconcillo, J.Q.; Duran, G.A.W.; Francisco, A.A.; Abastillas, R.G.; Hilario, F.D.; Juanillo, E.L.; Maratas, S.L.A. Evaluation of Spatial Interpolation Techniques for Operational Climate Monitoring in the Philippines. SOLA Sci. Online Lett. Atmosp. 2017, 13, 114–119. [Google Scholar] [CrossRef] [Green Version]
- Potter, C.; Randerson, J.T.; Field, C.B.; Matson, P.A.; Vitousek, P.M.; Mooney, H.A.; Klooster, S.A. Terrestrial ecosystem production: A process model based on global satellite and surface data. Glob. Biogeochem. Cycles 1993, 7, 811–841. [Google Scholar] [CrossRef]
- Bishop, J.K.B.; Rossow, W.B. Spatial and temporal variability of global surface solar irradiance. J. Geophys. Res. Space Phys. 1991, 96, 16839. [Google Scholar] [CrossRef]
- McCree, K.J. Photosynthetically Active Radiation. In Physiological Plant Ecology I; Springer Science and Business Media LLC: Berlin/Heidelberg, Germany, 1981; Volume 12A, pp. 41–55. [Google Scholar]
- Zhang, Y.; Qi, W.; Zhou, C.; Ding, M.; Liu, L.; Gao, J.; Bai, W.; Wang, Z.; Zheng, D. Spatial and temporal variability in the net primary production of alpine grassland on the Tibetan Plateau since 1982. J. Geogr. Sci. 2014, 24, 269–287. [Google Scholar] [CrossRef]
- Cai, H.; Yang, X.; Xu, X. Human-induced grassland degradation/restoration in the central Tibetan Plateau: The effects of ecological protection and restoration projects. Ecol. Eng. 2015, 83, 112–119. [Google Scholar] [CrossRef]
- Xu, J.X.; Fang, S.B.; Zhang, T.B.; Zhu, Y.C.; Wu, D.; Yi, G.H. NDVI changes and its correlation with climate factors of the Three River -Headwater region in growing seasons during 2000—2016. Rem. Sens. Land Res. 2020, 32, 237–246. [Google Scholar]
- Chavez, F.P.; Messié, M.; Pennington, J.T. Marine Primary Production in Relation to Climate Variability and Change. Annu. Rev. Mar. Sci. 2011, 3, 227–260. [Google Scholar] [CrossRef] [PubMed] [Green Version]
- Fensholt, R.; Langanke, T.; Rasmussen, K.; Reenberg, A.; Prince, S.D.; Tucker, C.; Scholes, M.C.; Le, Q.B.; Bondeau, A.; Eastman, R.; et al. Greenness in semi-arid areas across the globe 1981–2007—An Earth Observing Satellite based analysis of trends and drivers. Remote Sens. Environ. 2012, 121, 144–158. [Google Scholar] [CrossRef]
- Tan, K.; Ciais, P.; Piao, S.; Wu, X.; Tang, Y.; Vuichard, N.; Liang, S.; Fang, J. Application of the ORCHIDEE global vegetation model to evaluate biomass and soil carbon stocks of Qinghai-Tibetan grasslands. Glob. Biogeochem. Cycles 2010, 24. [Google Scholar] [CrossRef]
- Chuai, X.W.; Huang, X.J.; Wang, W.J.; Bao, G. NDVI, temperature and precipitation changes and their relationships with different vegetation types during 1998–2007 in Inner Mongolia, China. Int. J. Clim. 2012, 33, 1696–1706. [Google Scholar] [CrossRef]
- Zheng, L.; Xu, J.; Tan, Z.; Xu, L.; Wang, X. Spatial Distribution of Soil Organic Matter Related to Microtopography and NDVI Changes in Poyang Lake, China. Wetlands 2019, 39, 789–801. [Google Scholar] [CrossRef]
- Ze, H.; Wei, S.; Xiangzheng, D.; Xu, X. Grassland ecosystem responses to climate change and human activities within the Three-River Headwaters region of China. Sci. Rep. 2018, 8, 9079. [Google Scholar]
- Zheng, Y.; Han, J.; Huang, Y.; Fassnacht, S.R.; Xie, S.; Lv, E.; Chen, M. Vegetation response to climate conditions based on NDVI simulations using stepwise cluster analysis for the Three-River Headwaters region of China. Ecol. Indic. 2018, 92, 18–29. [Google Scholar] [CrossRef]
- Cao, R.; Jiang, W.G.; Yuan, L.H.; Wang, W.; Lv, Z.; Chen, Z. Inter-annual variations in vegetation and their response to climatic factors in the upper catchments of the Yellow River from 2000 to 2010. J. Geogr. Sci. 2014, 24, 963–979. [Google Scholar] [CrossRef] [Green Version]
- Jiang, C.; Zhang, L. Climate Change and Its Impact on the Eco-Environment of the Three-Rivers Headwater Region on the Tibetan Plateau, China. Int. J. Environ. Res. Public Health 2015, 12, 12057–12081. [Google Scholar] [CrossRef] [Green Version]
- Lan, Y.; Zhao, G.; Zhang, Y.; Wen, J.; Hu, X.; Liu, J.; Gu, M.; Chang, J.; Ma, J. Response of runoff in the headwater region of the Yellow River to climate change and its sensitivity analysis. J. Geogr. Sci. 2010, 20, 848–860. [Google Scholar] [CrossRef]
- Nemani, R.; Keeling, C.D.; Hashimoto, H.; Jolly, W.M.; Piper, S.C.; Tucker, C.J.; Myneni, R.B.; Running, S.W. Climate-Driven Increases in Global Terrestrial Net Primary Production from 1982 to 1999. Science 2003, 300, 1560–1563. [Google Scholar] [CrossRef] [PubMed] [Green Version]
- Zhao, X.; Tan, K.; Zhao, S.; Fang, J. Changing climate affects vegetation growth in the arid region of the northwest China. J. Arid. Environ. 2011, 75, 946–952. [Google Scholar] [CrossRef]
Figure 1.
Geographical location, altitude, and vegetation distribution of the Sanjiangyuan National Park.
Figure 1.
Geographical location, altitude, and vegetation distribution of the Sanjiangyuan National Park.


Figure 2.
Spatial distribution of normalized difference vegetation index (NDVI) (a), net primary productivity (NPP) during 2000–2016 (b).
Figure 2.
Spatial distribution of normalized difference vegetation index (NDVI) (a), net primary productivity (NPP) during 2000–2016 (b).

Figure 3.
Perennial average NDVI (a), NPP of different vegetation types (b).

Figure 4.
Temporal variations of the NDVI for the Sanjiangyuan National Park (a), the Yellow River headwater region (b), the Yangtze River headwater region (c), and the Lancang River headwater region (d).
Figure 4.
Temporal variations of the NDVI for the Sanjiangyuan National Park (a), the Yellow River headwater region (b), the Yangtze River headwater region (c), and the Lancang River headwater region (d).

Figure 5.
Temporal variations of the NPP for the Sanjiangyuan National Park (a), the Yellow River headwater region (b), the Yangtze River headwater region (c), and the Lancang River headwater region (d).
Figure 5.
Temporal variations of the NPP for the Sanjiangyuan National Park (a), the Yellow River headwater region (b), the Yangtze River headwater region (c), and the Lancang River headwater region (d).
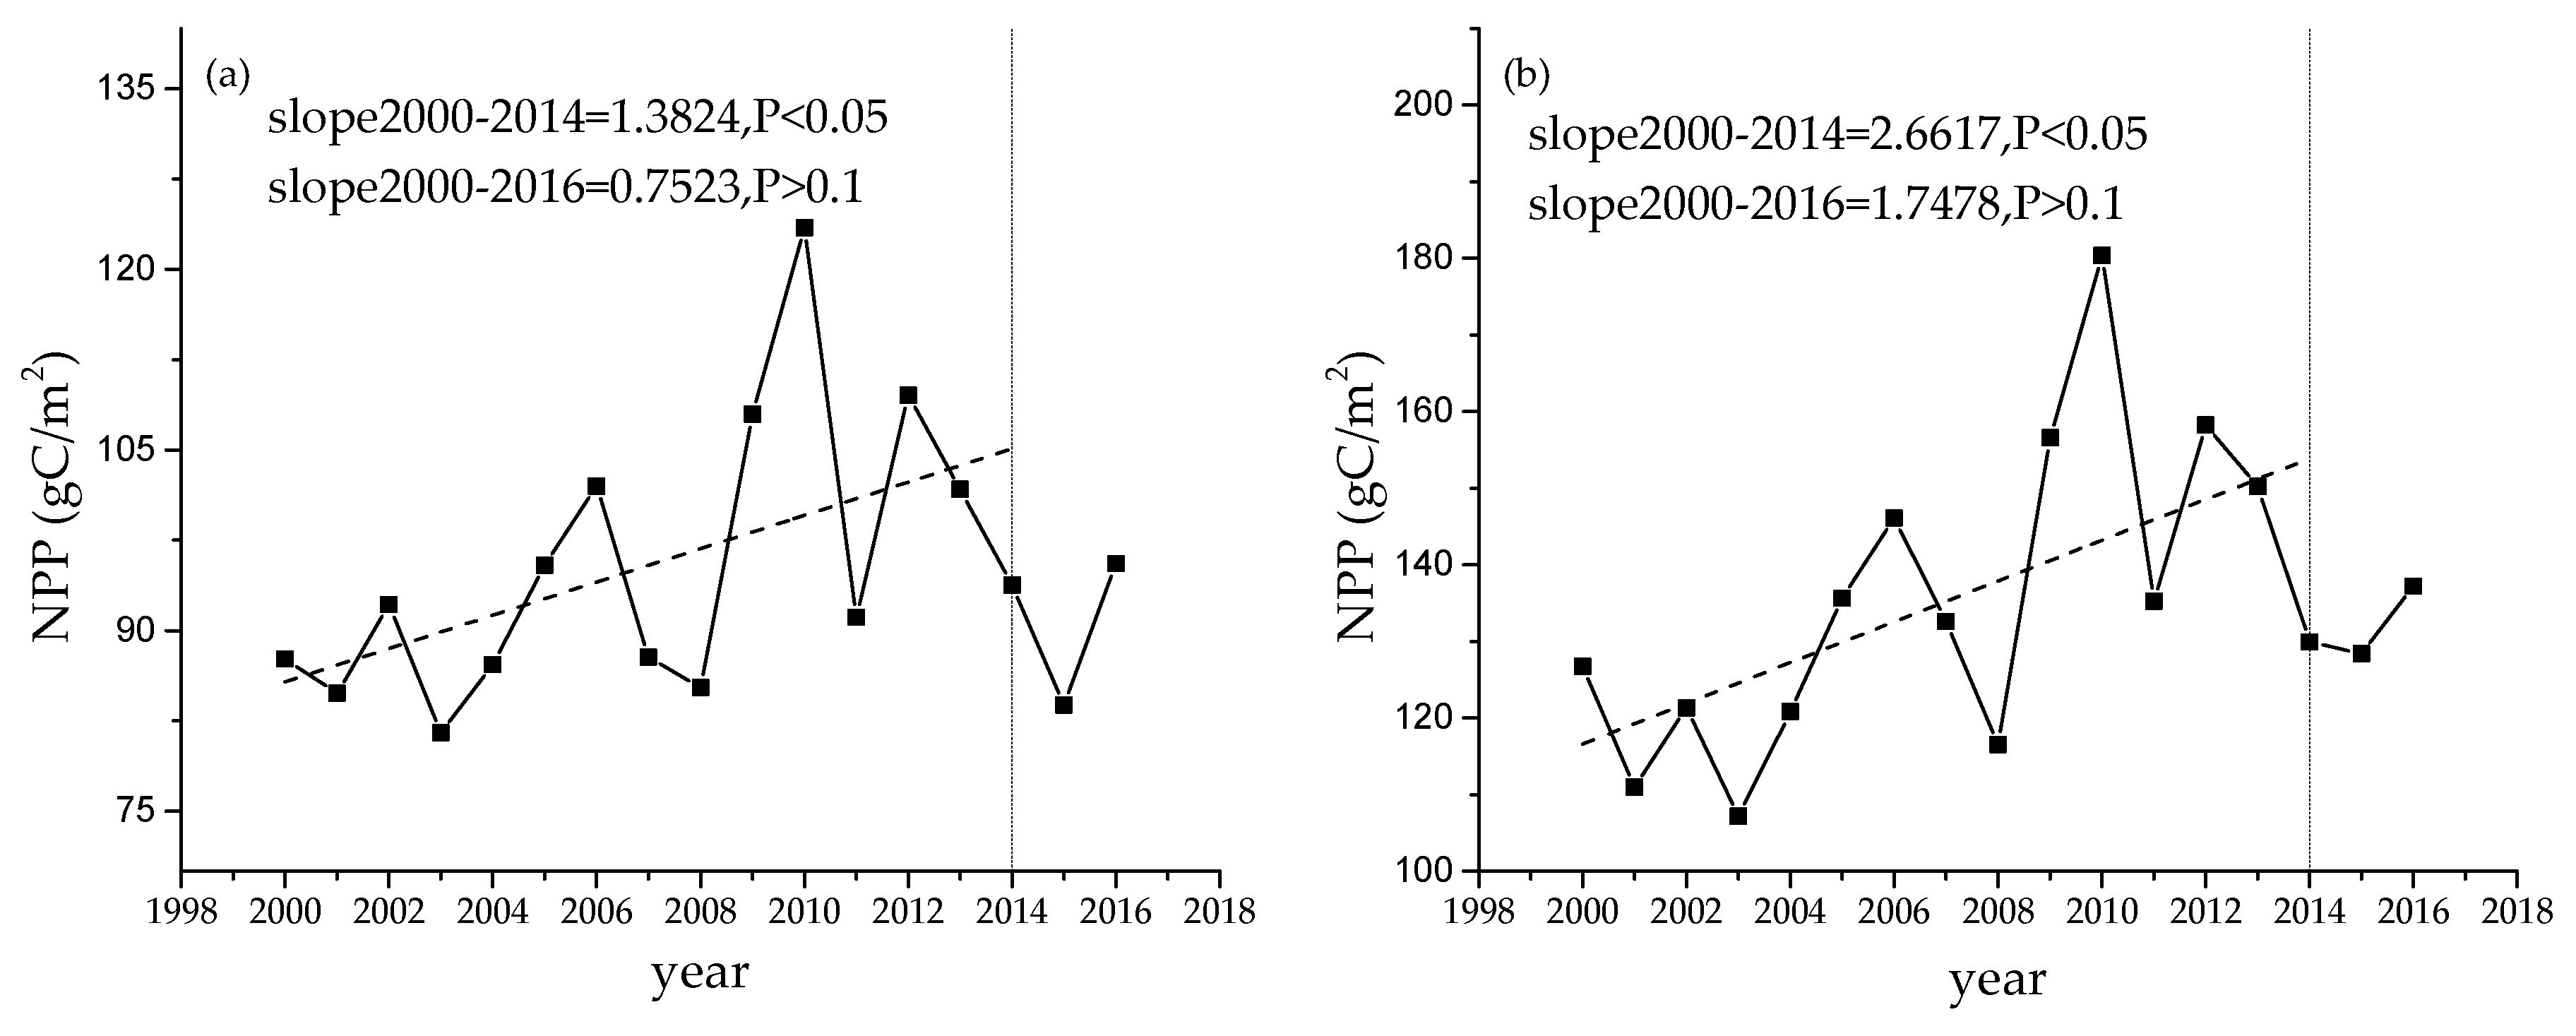
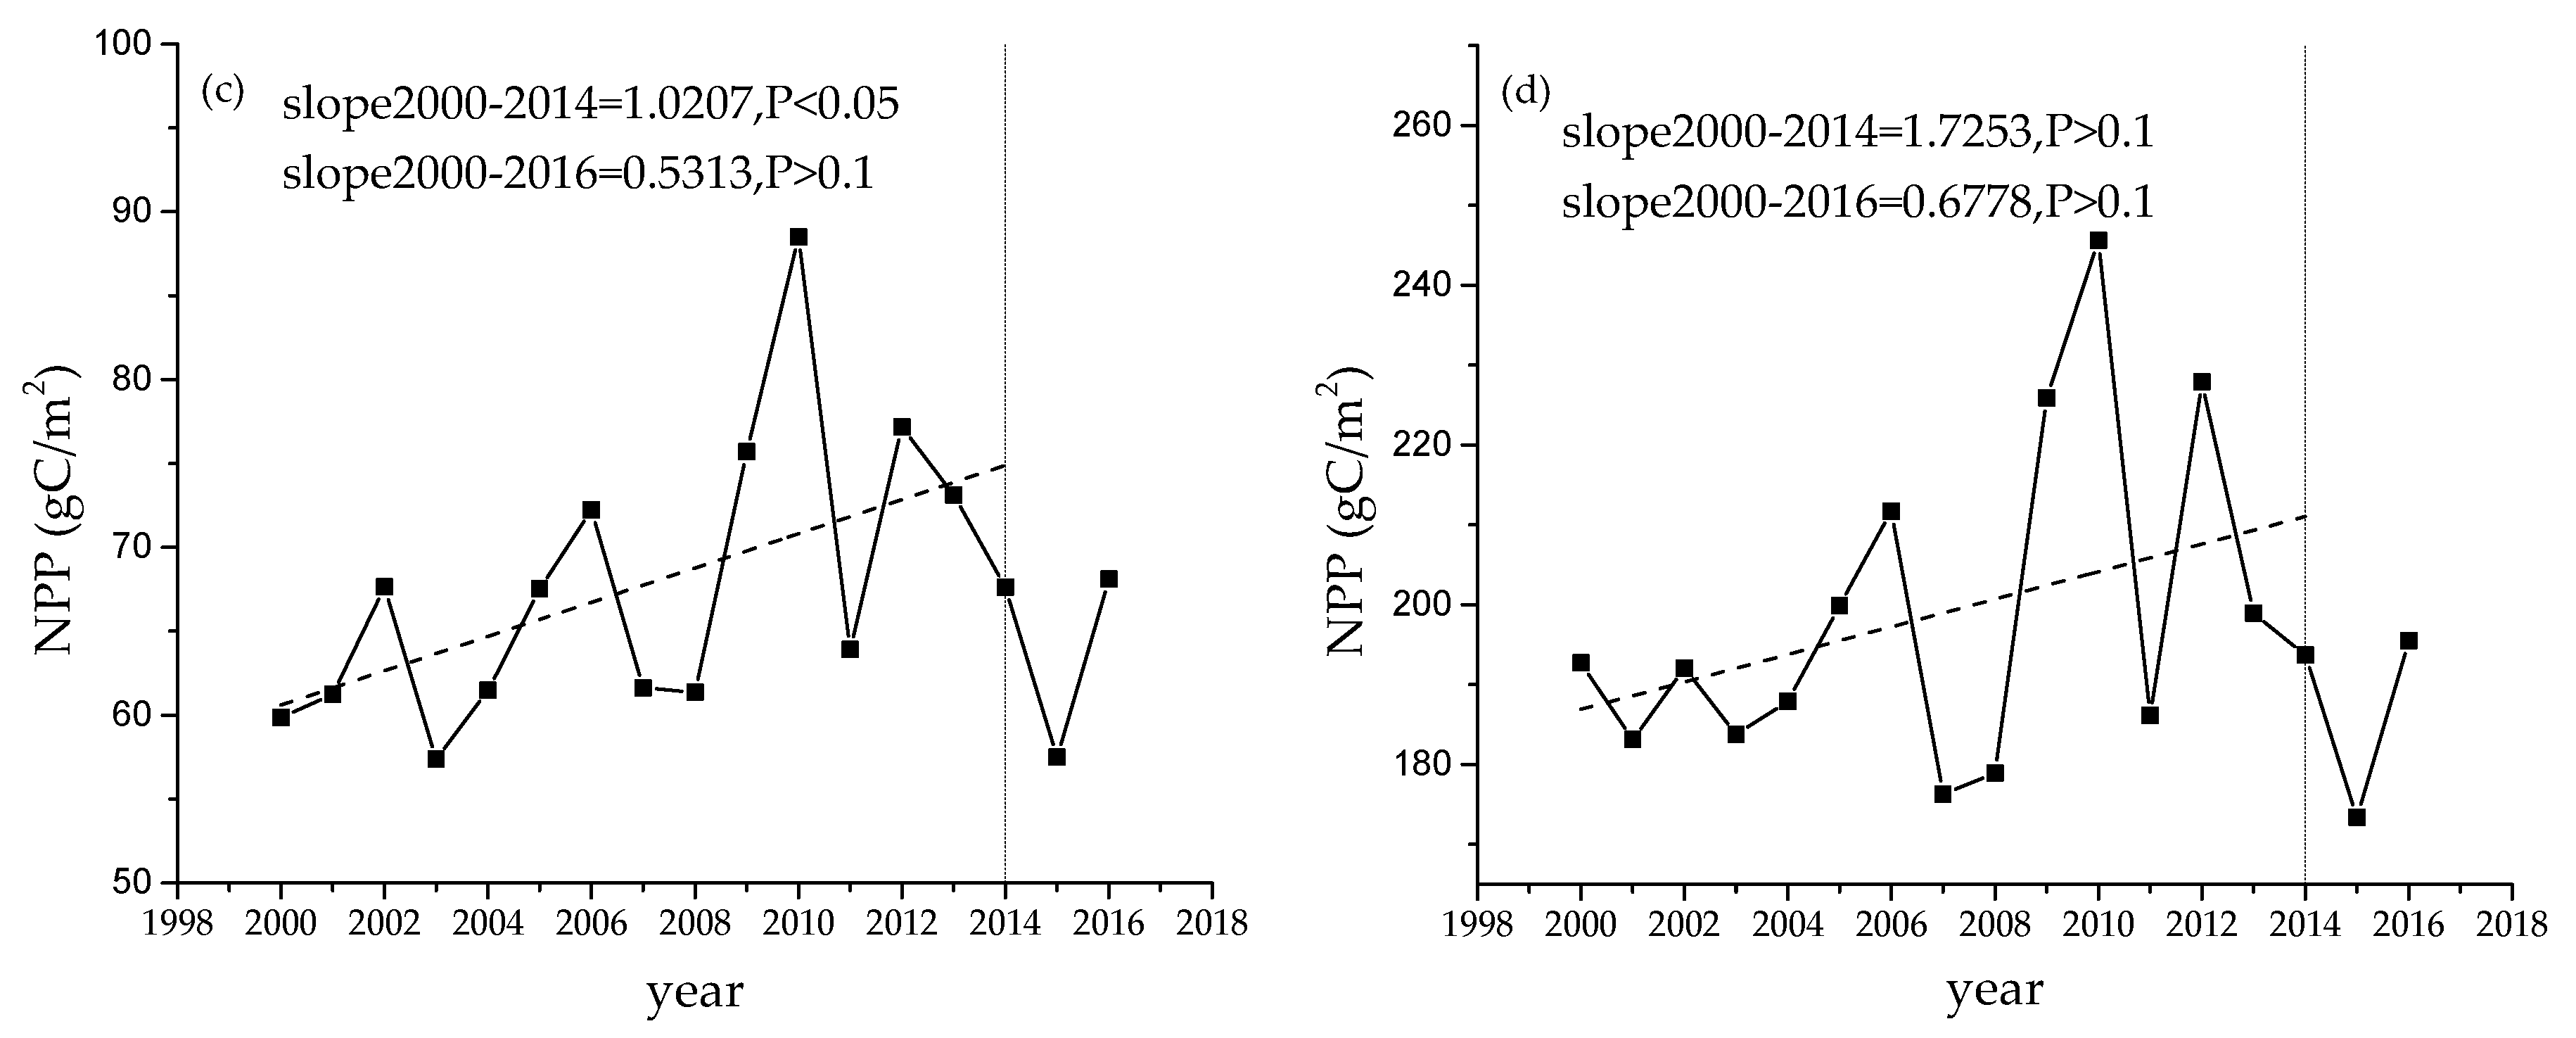
Figure 6.
Spatial distribution of NDVI change (a) and NPP change (b) from 2000–2016.

Figure 7.
Temporal variations of the annual precipitation for the Sanjiangyuan National Park (a), the Yellow River headwater region (b), the Yangtze River headwater region (c), and the Lancang River headwater region (d).
Figure 7.
Temporal variations of the annual precipitation for the Sanjiangyuan National Park (a), the Yellow River headwater region (b), the Yangtze River headwater region (c), and the Lancang River headwater region (d).

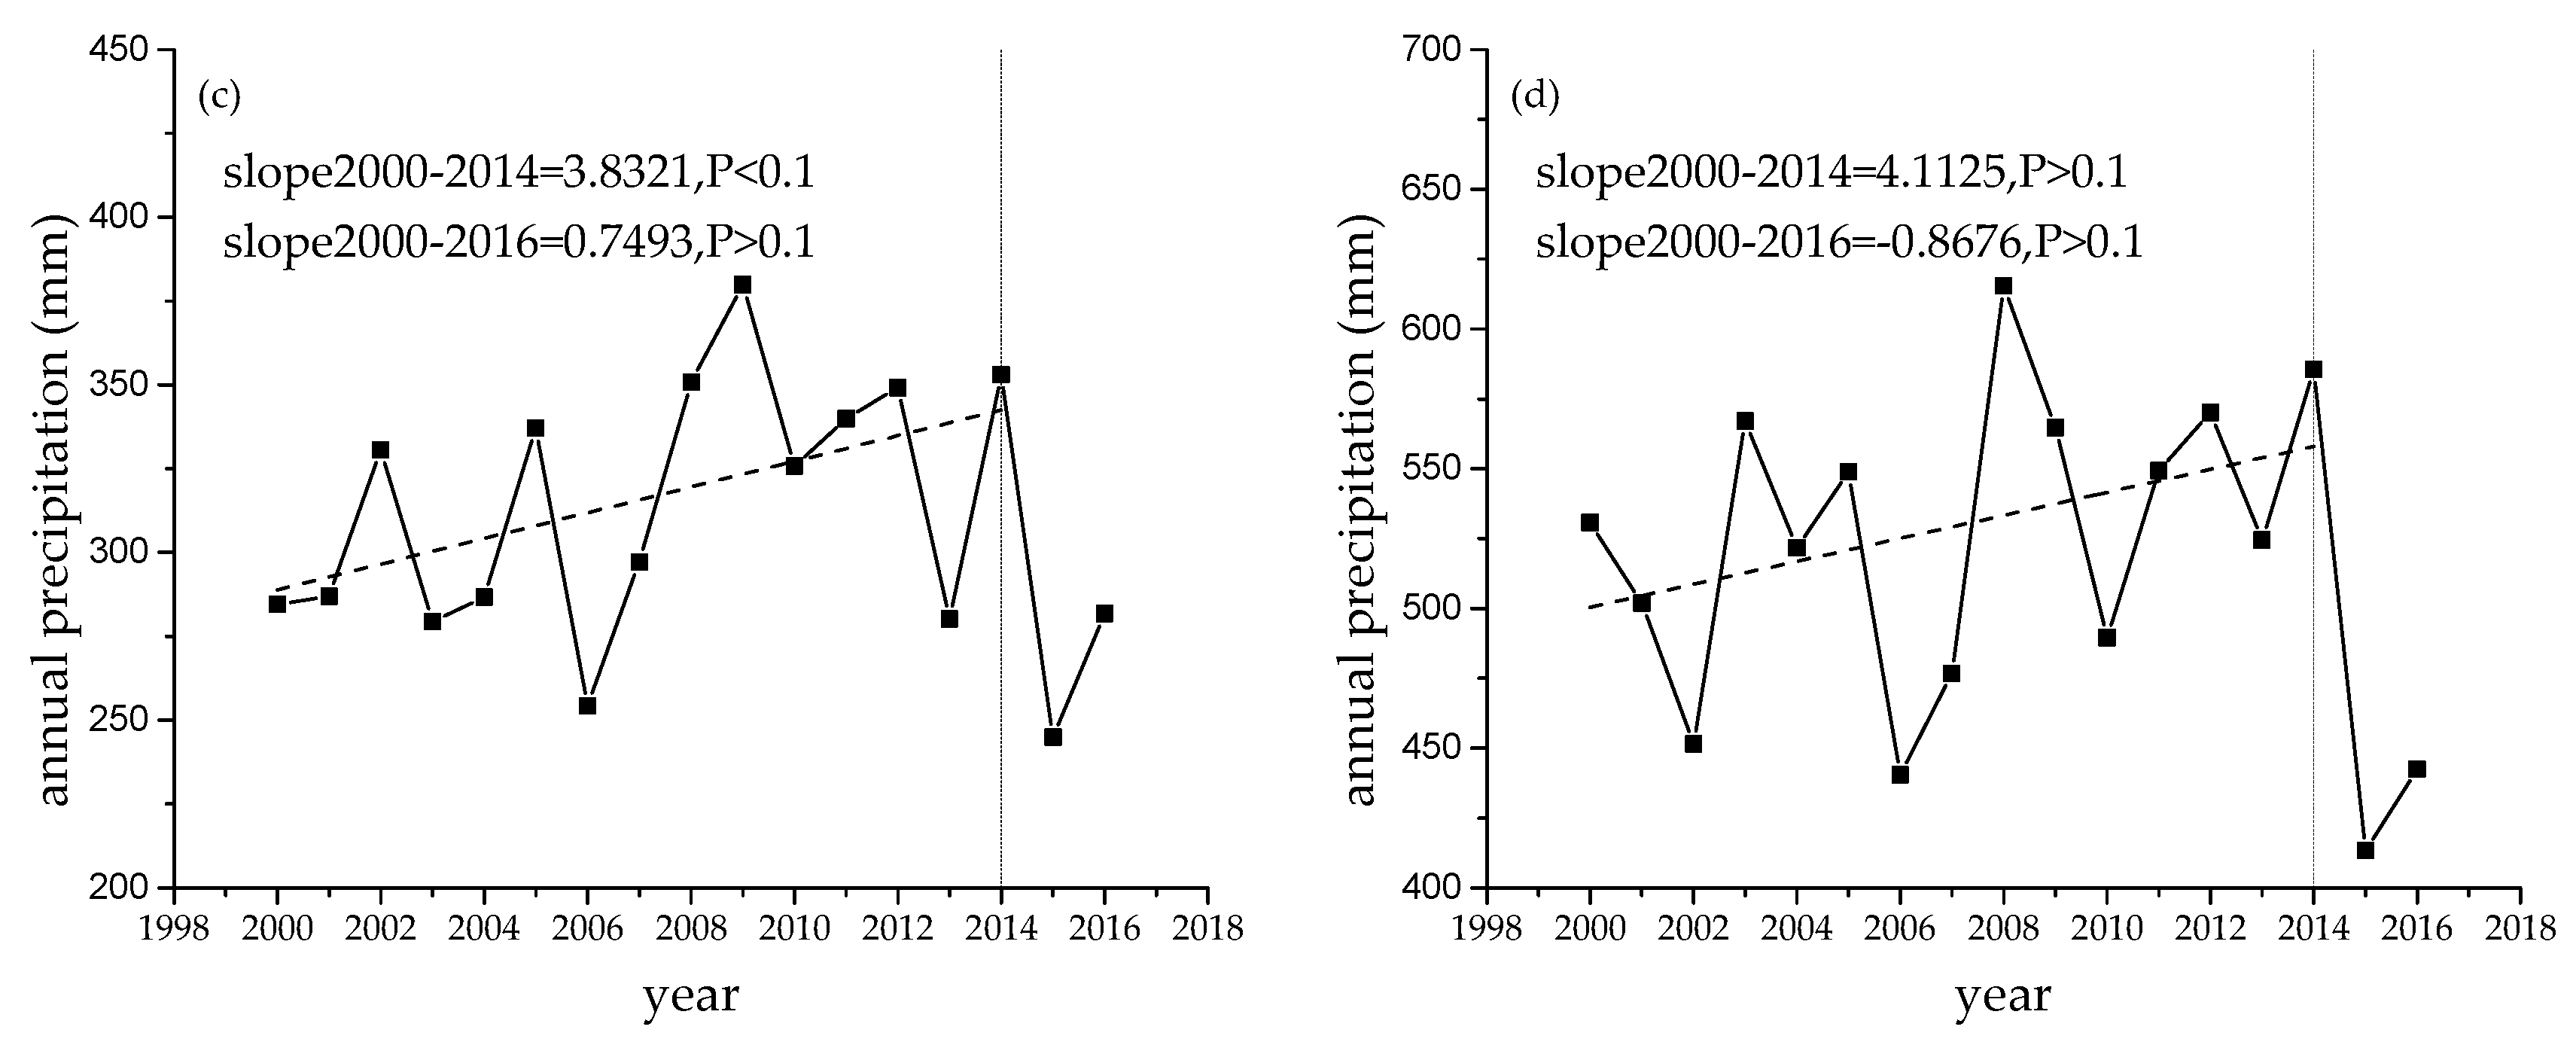
Figure 8.
Temporal variations of the annual average temperature for the Sanjiangyuan National Park (a), the Yellow River headwater region (b), the Yangtze River headwater region (c), and the Lancang River headwater region (d).
Figure 8.
Temporal variations of the annual average temperature for the Sanjiangyuan National Park (a), the Yellow River headwater region (b), the Yangtze River headwater region (c), and the Lancang River headwater region (d).

Figure 9.
Scatter plot of NDVI–annual precipitation for the Sanjiangyuan National Park (a), the Yellow River headwater region (b), the Yangtze River headwater region (c), and the Lancang River headwater region (d).
Figure 9.
Scatter plot of NDVI–annual precipitation for the Sanjiangyuan National Park (a), the Yellow River headwater region (b), the Yangtze River headwater region (c), and the Lancang River headwater region (d).

Figure 10.
Scatter Plot of NPP–annual average temperature for the Sanjiangyuan National Park (a), the Yellow River headwater region (b), the Yangtze River headwater region (c), and the Lancang River headwater region (d).
Figure 10.
Scatter Plot of NPP–annual average temperature for the Sanjiangyuan National Park (a), the Yellow River headwater region (b), the Yangtze River headwater region (c), and the Lancang River headwater region (d).
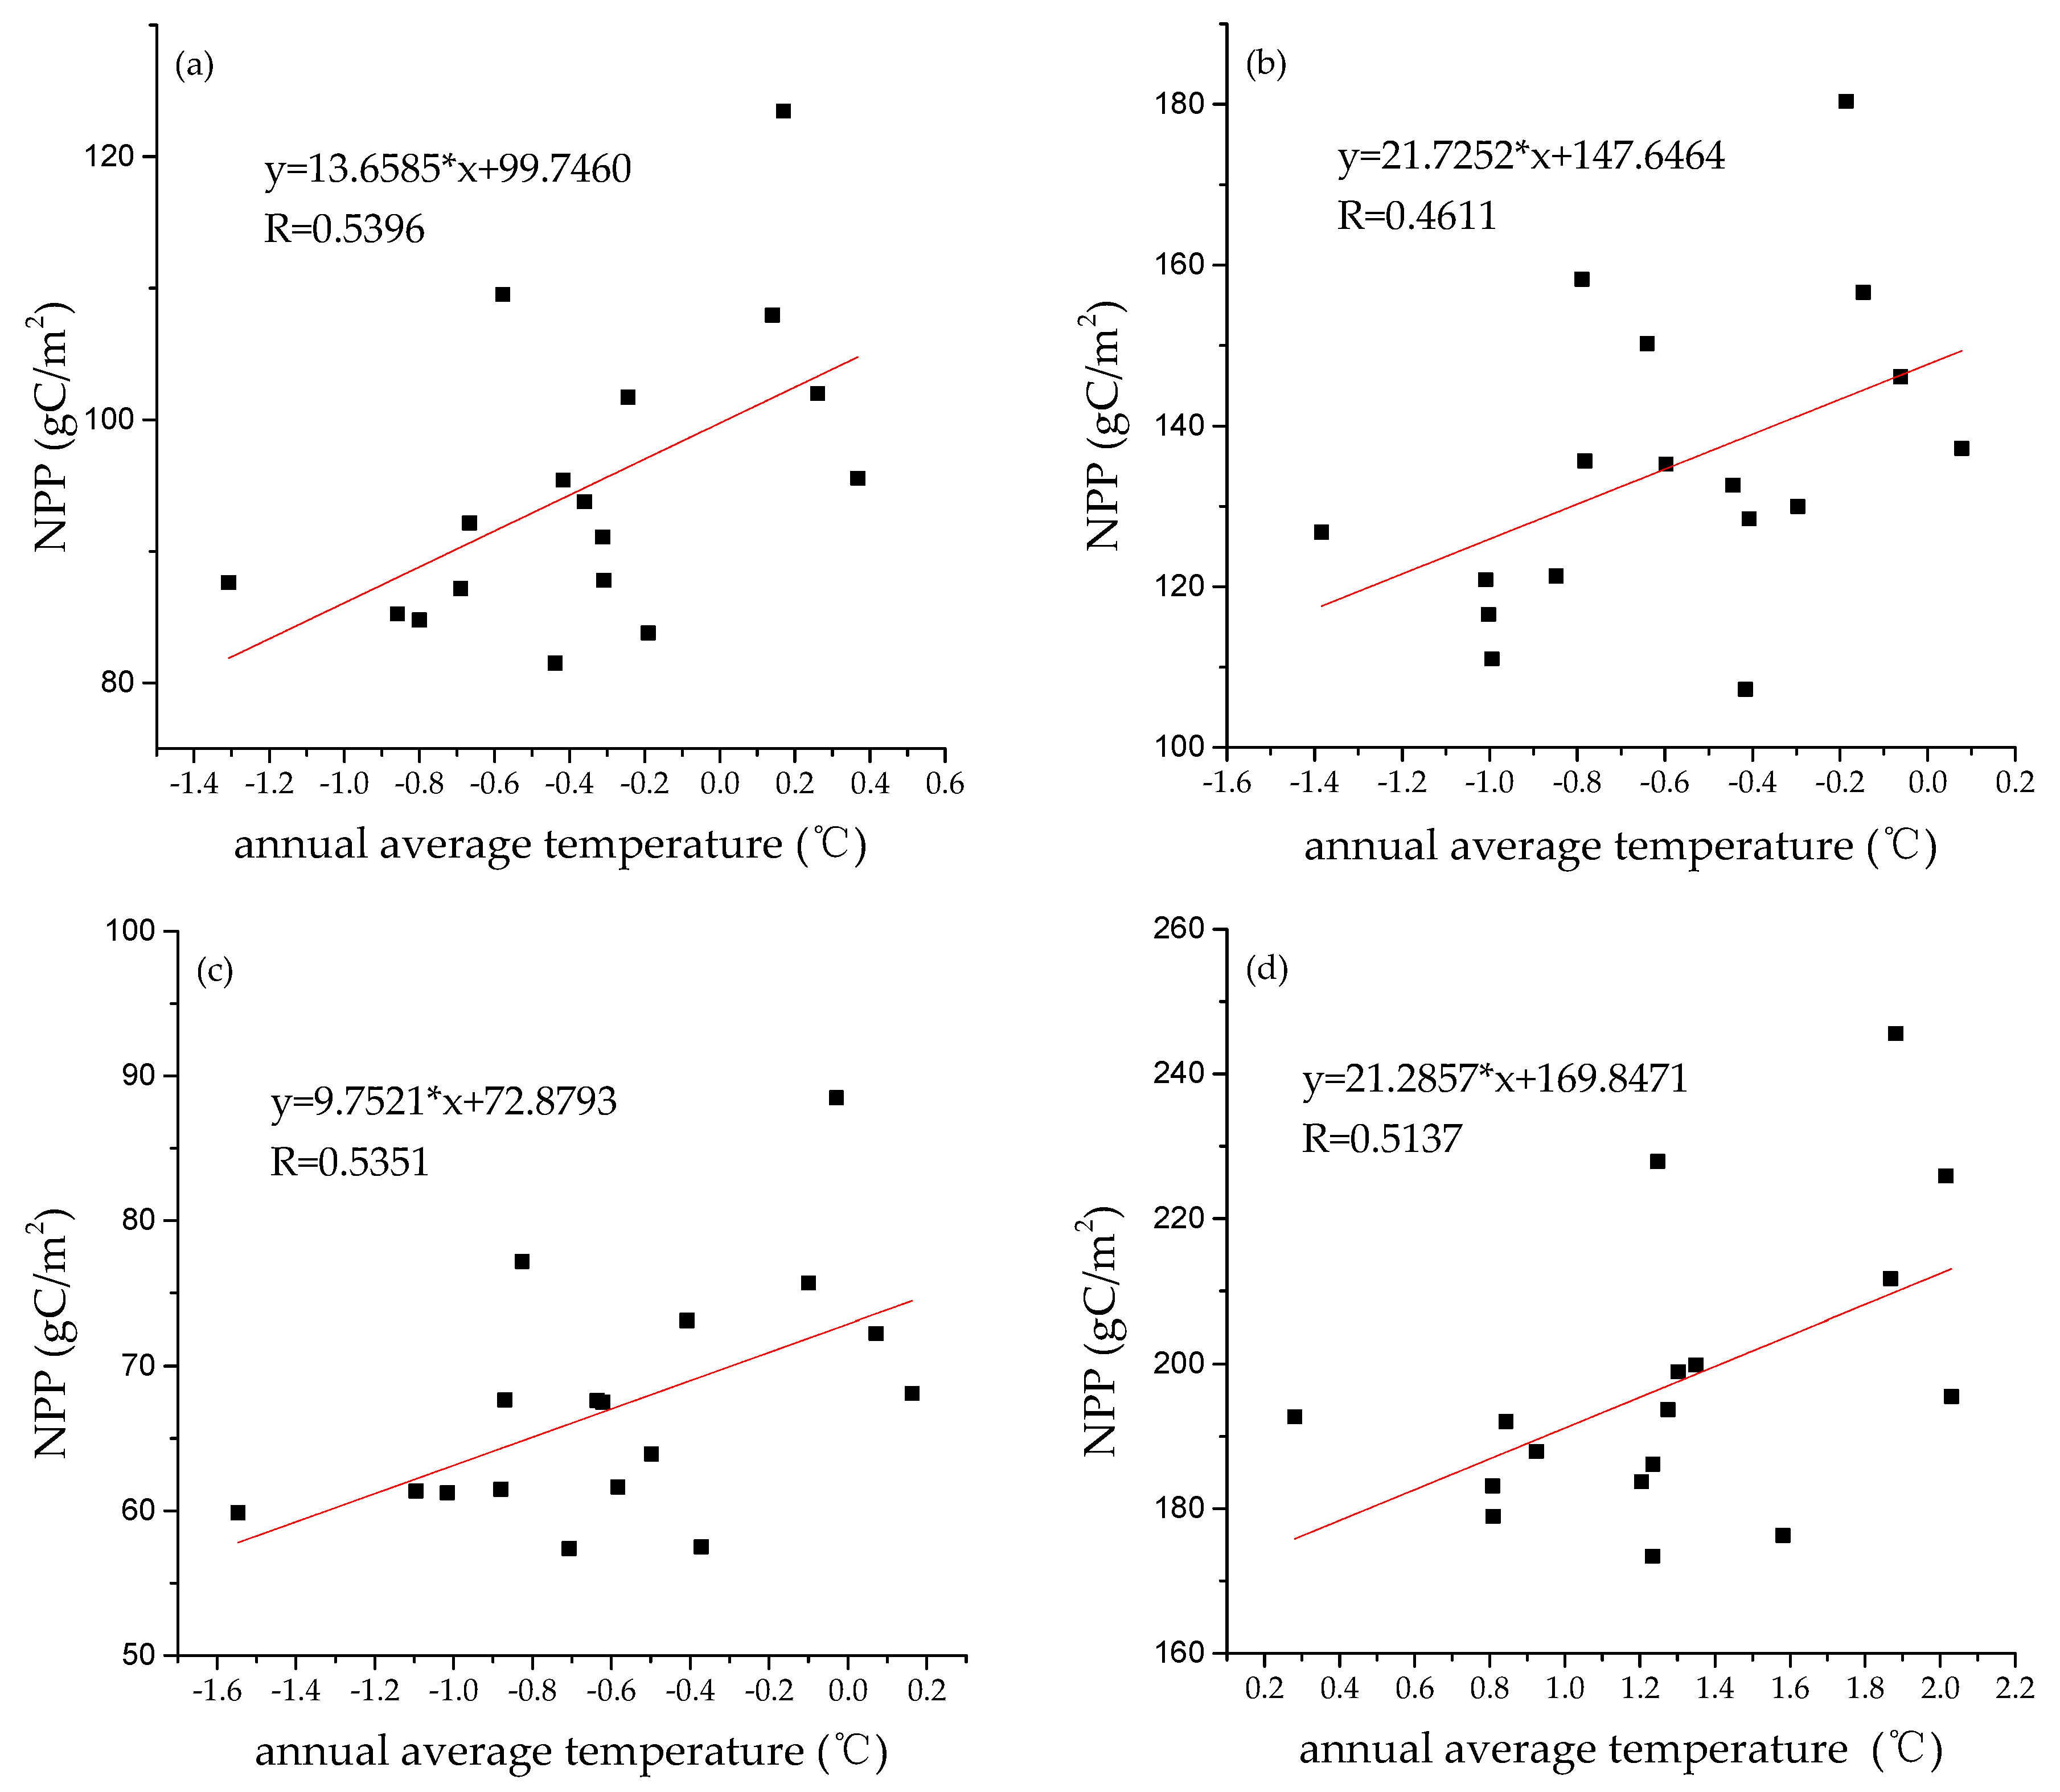
Figure 11.
Spatial distribution of the NDVI–annual precipitation relationship (a) and the NPP–annual average temperature relationship (b).
Figure 11.
Spatial distribution of the NDVI–annual precipitation relationship (a) and the NPP–annual average temperature relationship (b).

Table 1.
Slopes of NDVI and NPP changes in different vegetation types.
| Vegetation Type Slope | NDVI | NPP | ||
|---|---|---|---|---|
| 2000–2014 | 2000–2016 | 2000–2014 | 2000–2016 | |
| Coniferous forest | 0.0025 * | 0.0011 | 2.35 * | 0.72 |
| Shrub | 0.0028 ** | 0.0012 | 2.9 ** | 1.60 |
| Prairie | 0.0019 *** | 0.0011 ** | 0.65 ** | 0.4 * |
| Meadow | 0.0026 ** | 0.0009 | 2.03 ** | 1.05 |
| Alpine vegetation | 0.0018 ** | 0.0009 | 0.83 * | 0.55 |
*, **, and *** represent 0.05 < p ≤ 0.1, 0.01 < p ≤ 0.05, and p ≤ 0.01, respectively.
Table 2.
NDVI changes in different areas of the Sanjiangyuan National Park.
| Region | ESI | SI | IS | SD | ESD |
|---|---|---|---|---|---|
| Yellow River | 6.27% | 11.40% | 81.28% | 0.73% | 0.32% |
| Lancang River | 0.36% | 1.75% | 94.73% | 2.49% | 0.68% |
| Yangtze River | 15.20% | 13.58% | 70.08% | 0.78% | 0.36% |
| Sanjiangyuan | 11.78% | 11.68% | 75.15% | 1.00% | 0.39% |
Table 3.
NPP changes in different areas of the Sanjiangyuan National Park.
| Region | ESI | SI | IS | SD | ESD |
|---|---|---|---|---|---|
| Yellow River | 11.04% | 23.24% | 65.61% | 0.07% | 0.03% |
| Lancang River | 0.43% | 2.35% | 97.07% | 0.12% | 0.02% |
| Yangtze River | 9.92% | 15.74% | 73.98% | 0.21% | 0.14% |
| Sanjiangyuan | 8.97% | 15.35% | 75.40% | 0.18% | 0.11% |
Table 4.
NDVI–precipitation, NDVI–temperature, NPP–precipitation, and NPP–temperature correlation coefficients.
Table 4.
NDVI–precipitation, NDVI–temperature, NPP–precipitation, and NPP–temperature correlation coefficients.
| Region | NDVI | NPP | ||
|---|---|---|---|---|
| Annual Precipitation | Annual Average Temperature | Annual Precipitation | Annual Average Temperature | |
| Yellow River | 0.6281 *** | 0.2554 | 0.4828 ** | 0.4610 * |
| Lancang River | 0.5210 ** | 0.1930 | 0.0802 | 0.5137 ** |
| Yangtze River | 0.6849 *** | 0.3569 | 0.3925 | 0.5350 ** |
| Sanjiangyuan | 0.6729 *** | 0.3392 | 0.3526 | 0.5396 ** |
*, **, and *** represent 0.05 < p ≤ 0.1, 0.01 < p ≤ 0.05, and p ≤ 0.01, respectively.
Table 5.
NDVI–precipitation, NDVI–temperature, NPP–precipitation, and NPP–temperature correlation coefficients among the vegetation types.
Table 5.
NDVI–precipitation, NDVI–temperature, NPP–precipitation, and NPP–temperature correlation coefficients among the vegetation types.
| Vegetation Types | NDVI | NPP | ||
|---|---|---|---|---|
| Annual Precipitation | Annual Average Temperature | Annual Precipitation | Annual Average Temperature | |
| Coniferous forest | 0.4778 * | 0.3262 | 0.1353 | 0.4571 * |
| Shrub | 0.5848 *** | 0.4221 * | 0.1977 | 0.5486 ** |
| Prairie | 0.6105 *** | 0.4671 * | 0.3424 | 0.5935 ** |
| Meadow | 0.6930 *** | 0.2987 | 0.3722 | 0.5146 ** |
| Alpine vegetation | 0.5564 ** | 0.4417 * | 0.1509 | 0.643 *** |
*, **, and *** represent 0.05 < p ≤ 0.1, 0.01< p ≤ 0.05, and p ≤ 0.01, respectively.
Table 6.
NDVI–annual precipitation correlations in different areas of the Sanjiangyuan National Park.
Table 6.
NDVI–annual precipitation correlations in different areas of the Sanjiangyuan National Park.
| Region | ESPC | SPC | ISC | SNC | ESNC |
|---|---|---|---|---|---|
| Yellow River | 13.17% | 20.06% | 66.63% | 0.10% | 0.00% |
| Lancang River | 5.49% | 15.45% | 78.86% | 0.18% | 0.01% |
| Yangtze River | 15.32% | 18.59% | 65.80% | 0.23% | 0.06% |
| Sanjiangyuan | 13.69% | 18.42% | 67.64% | 0.20% | 0.05% |
Table 7.
NPP–annual average temperature correlations in different areas of the Sanjiangyuan National Park.
Table 7.
NPP–annual average temperature correlations in different areas of the Sanjiangyuan National Park.
| Region | ESPC | SPC | ISC | SNC | ESNC |
|---|---|---|---|---|---|
| Yellow River | 3.34% | 18.77% | 77.88% | 0.01% | 0.00% |
| Lancang River | 8.38% | 21.15% | 70.45% | 0.02% | 0.01% |
| Yangtze River | 24.56% | 29.60% | 45.82% | 0.01% | 0.00% |
| Sanjiangyuan | 19.23% | 26.86% | 53.90% | 0.01% | 0.00% |
© 2020 by the authors. Licensee MDPI, Basel, Switzerland. This article is an open access article distributed under the terms and conditions of the Creative Commons Attribution (CC BY) license (http://creativecommons.org/licenses/by/4.0/).
Share and Cite
MDPI and ACS Style
Sun, Q.; Liu, W.; Gao, Y.; Li, J.; Yang, C. Spatiotemporal Variation and Climate Influence Factors of Vegetation Ecological Quality in the Sanjiangyuan National Park. Sustainability 2020, 12, 6634. https://doi.org/10.3390/su12166634
AMA Style
Sun Q, Liu W, Gao Y, Li J, Yang C. Spatiotemporal Variation and Climate Influence Factors of Vegetation Ecological Quality in the Sanjiangyuan National Park. Sustainability. 2020; 12(16):6634. https://doi.org/10.3390/su12166634
Chicago/Turabian StyleSun, Qianying, Weiwei Liu, Yanni Gao, Junsheng Li, and Chunyan Yang. 2020. "Spatiotemporal Variation and Climate Influence Factors of Vegetation Ecological Quality in the Sanjiangyuan National Park" Sustainability 12, no. 16: 6634. https://doi.org/10.3390/su12166634
Note that from the first issue of 2016, this journal uses article numbers instead of page numbers. See further details here.