Evaluating Potential Ground Subsidence Geo-Hazard of Xiamen Xiang’an New Airport on Reclaimed Land by SAR Interferometry


 , ,
, ,
Abstract
:1. Introduction
2. Study Area and Datasets
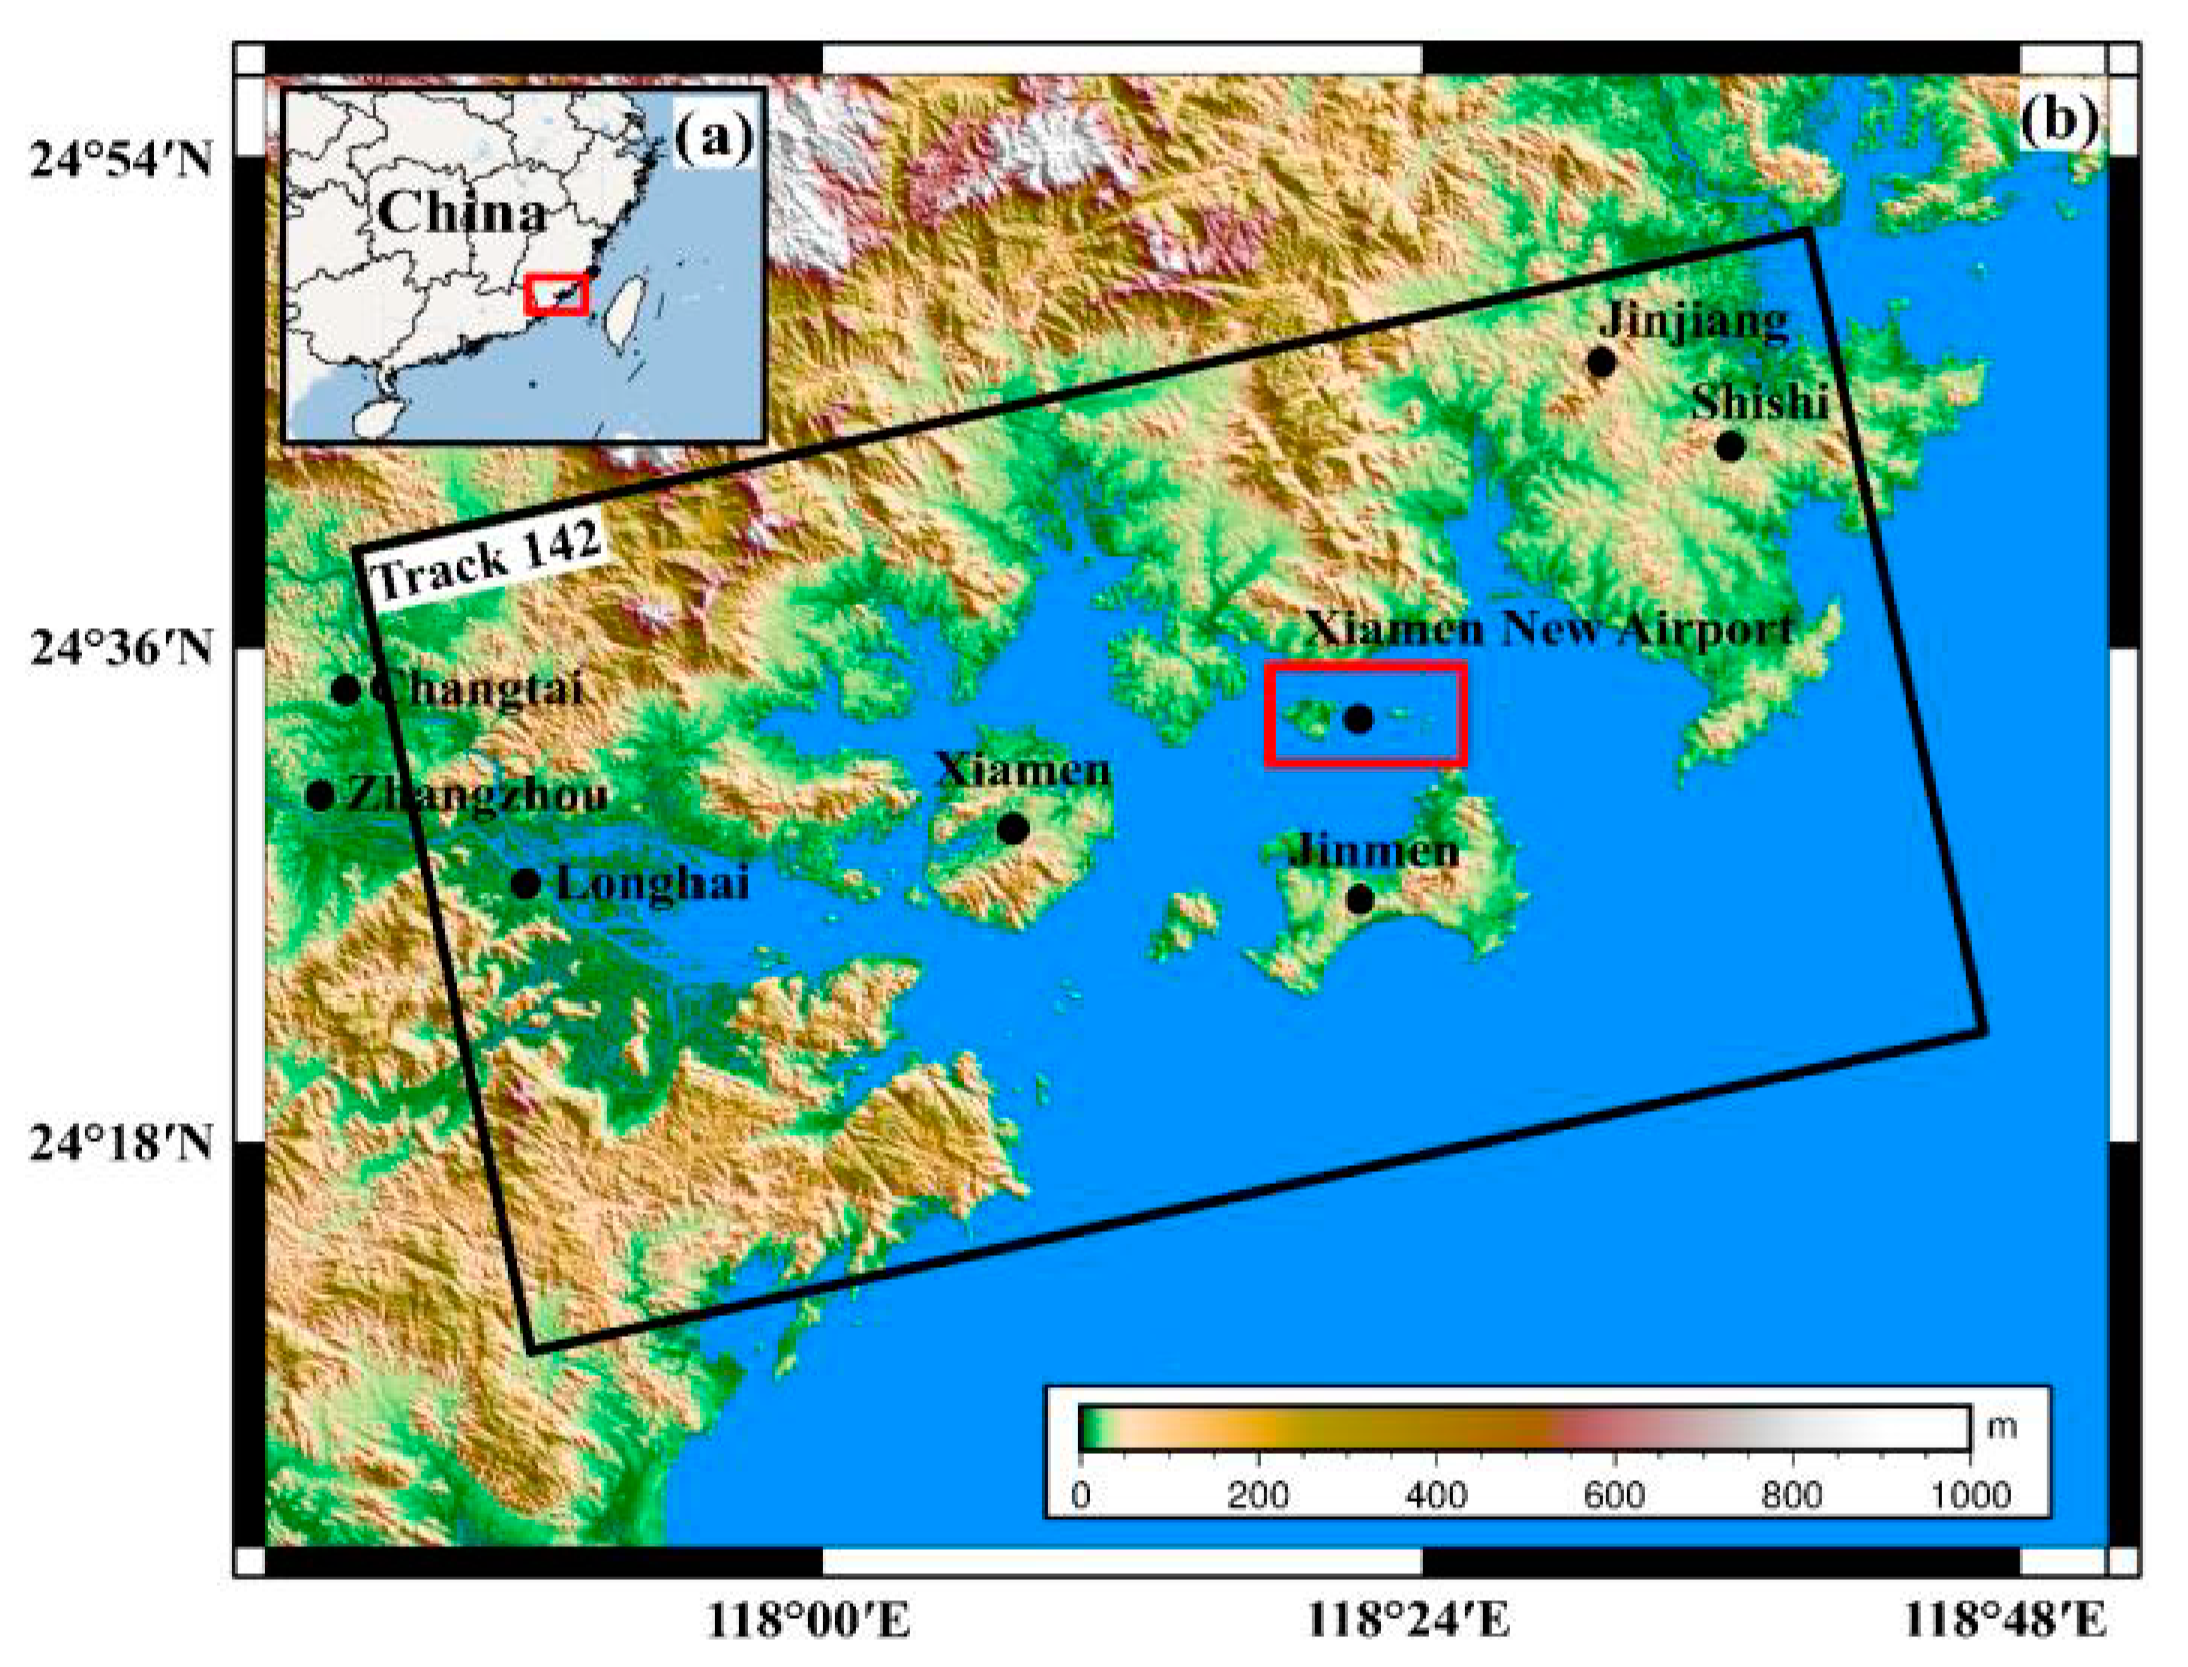
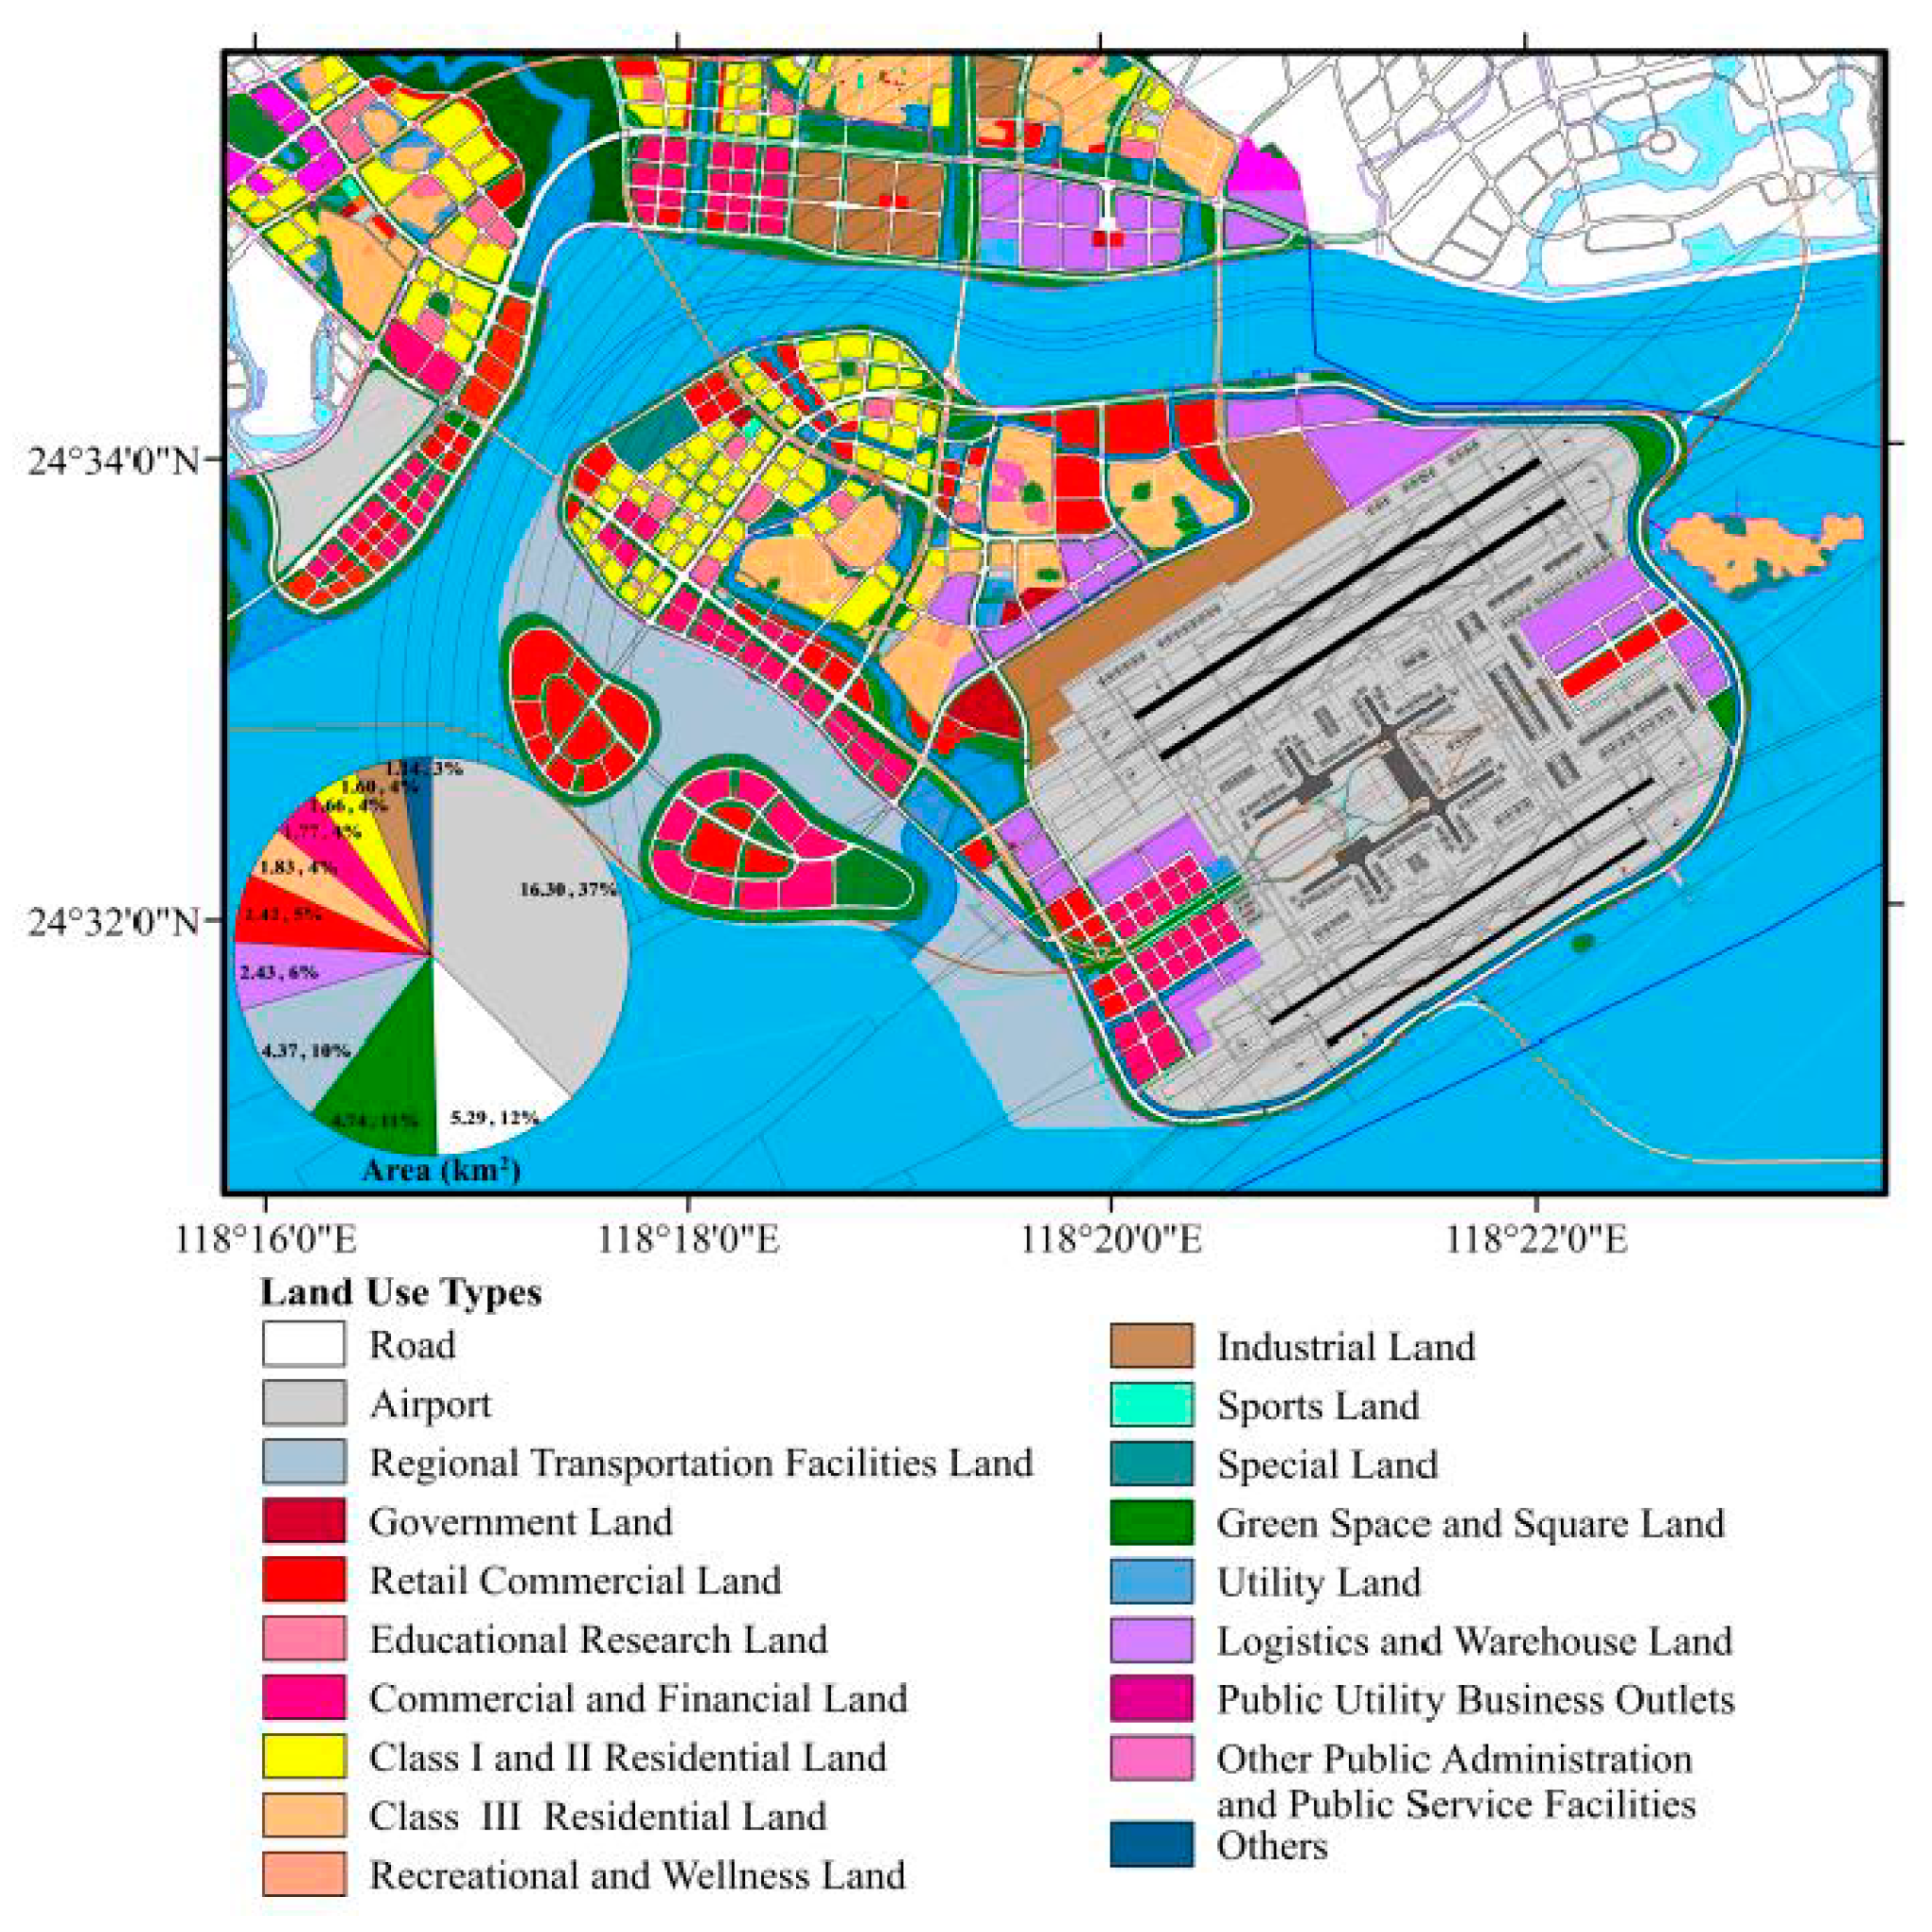
2.1. Location of XXNA and Land Use Planning
2.2. Historical Land Reclamation
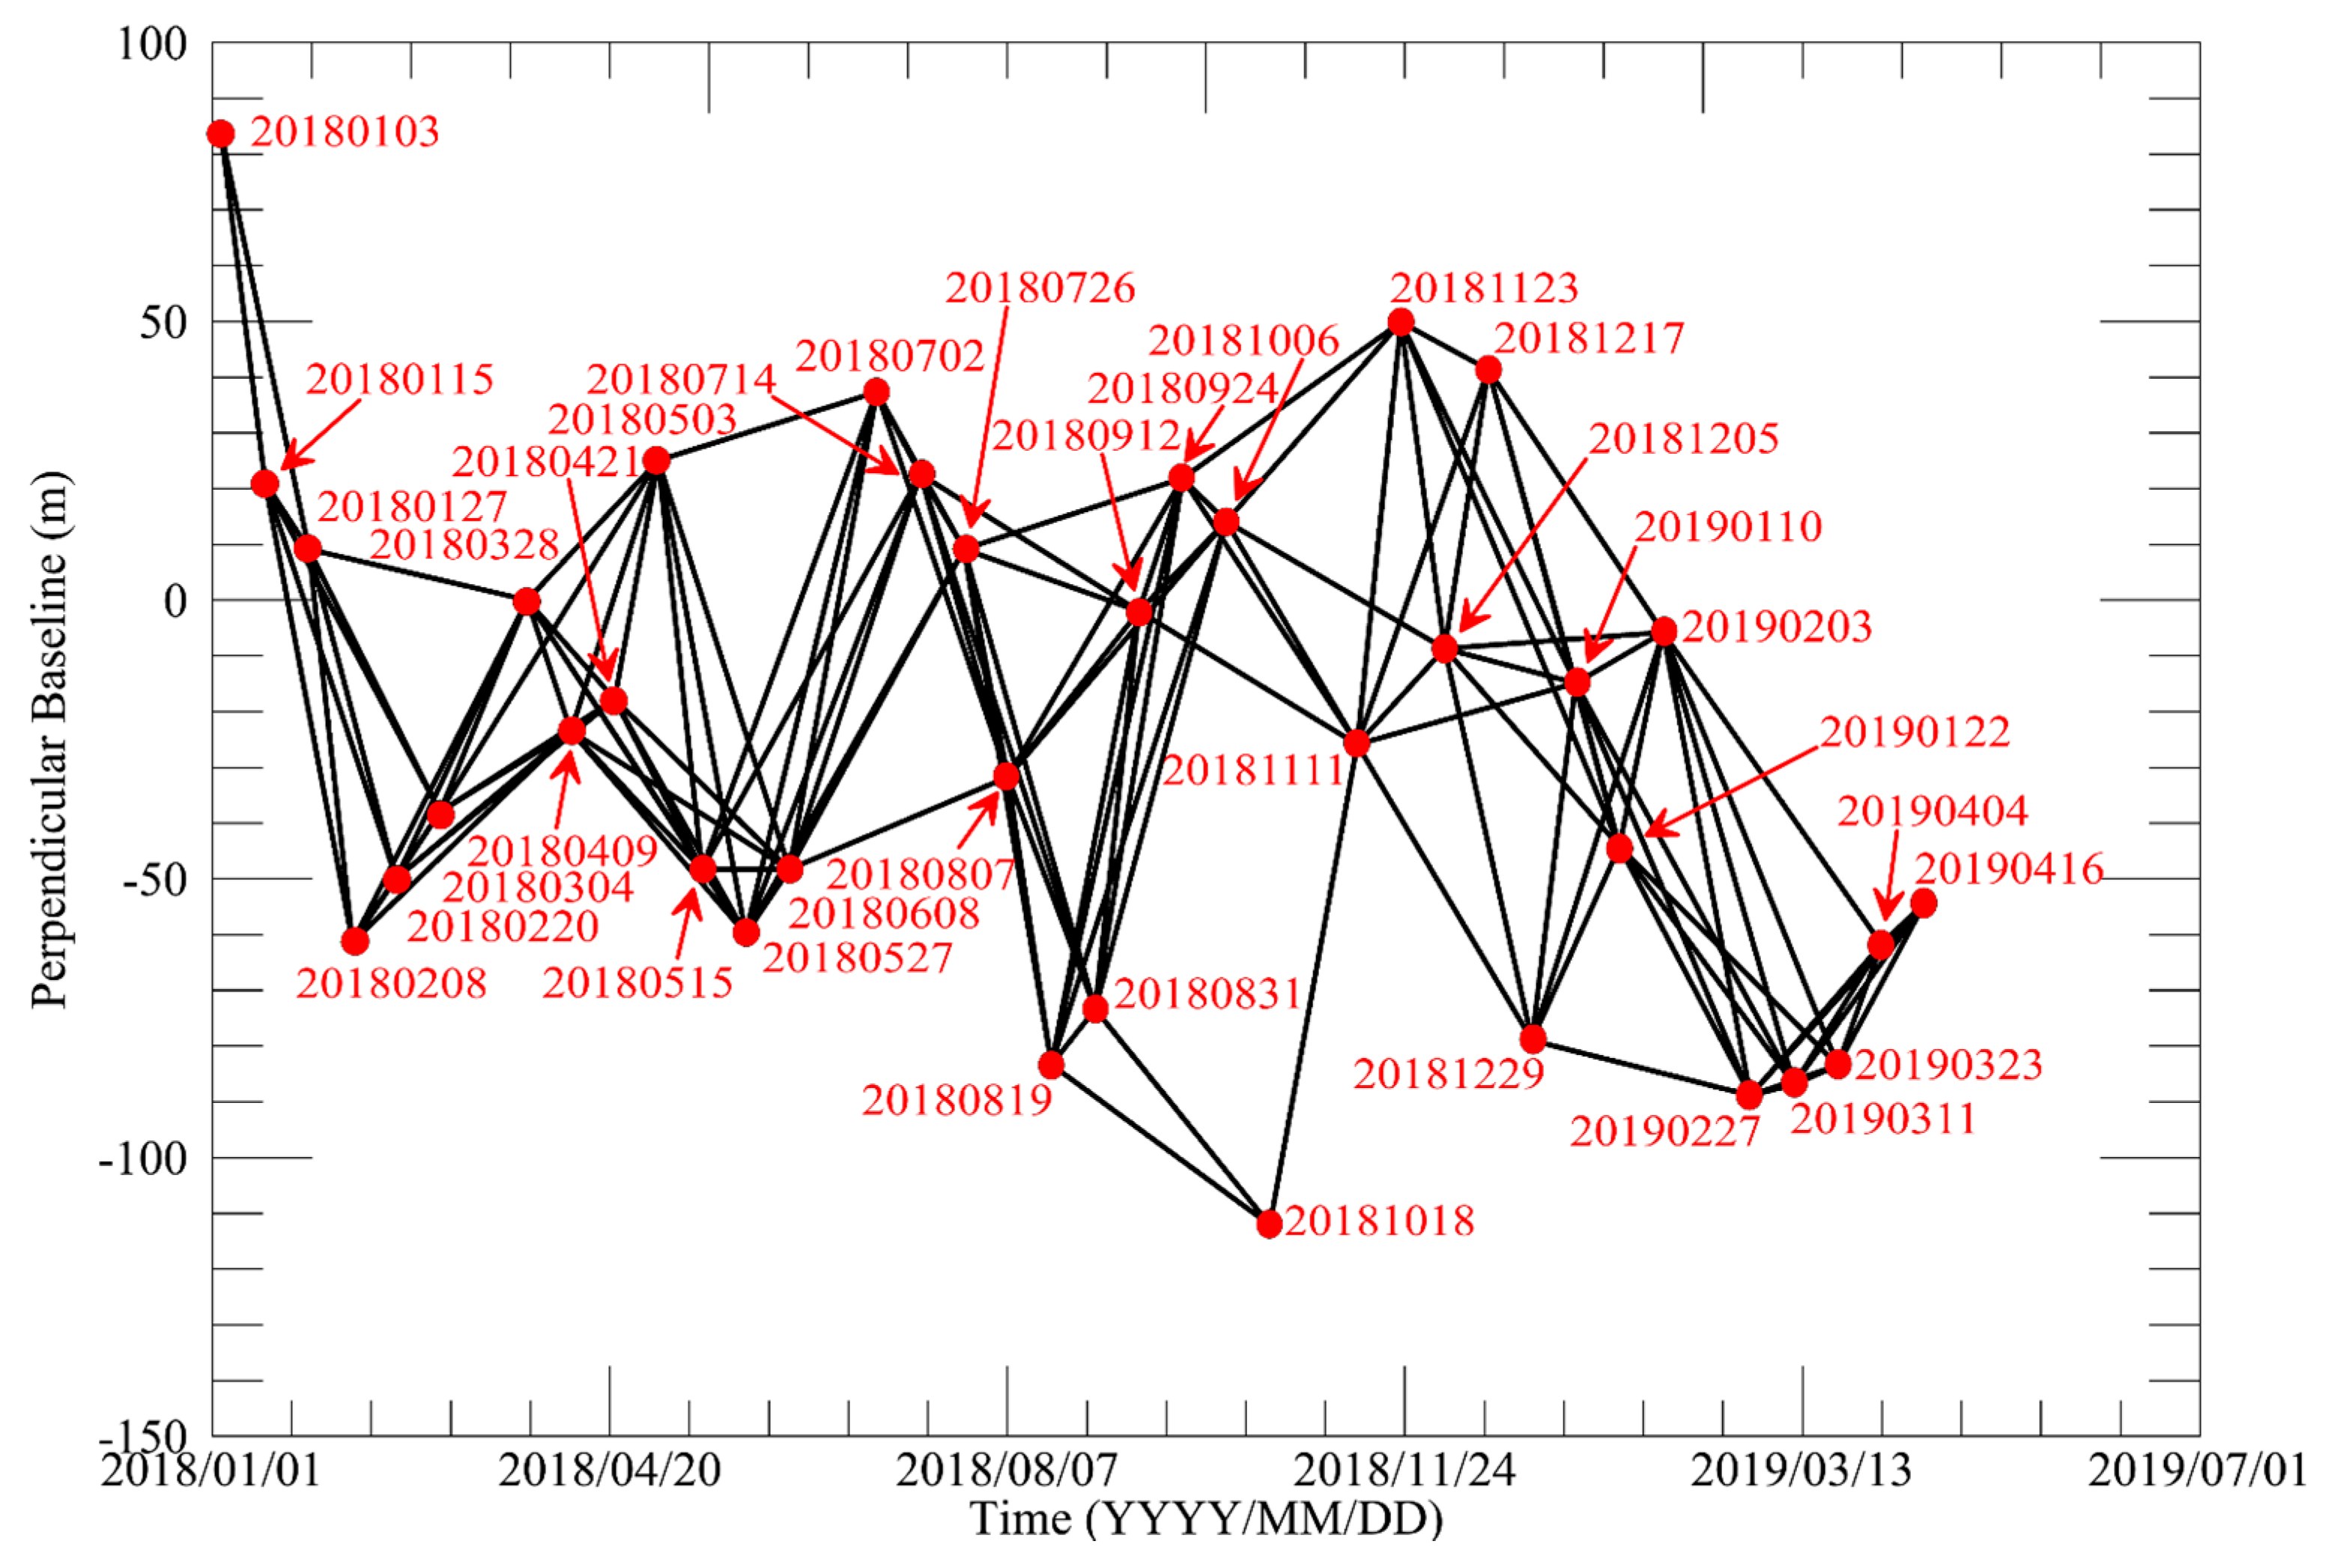
2.3. Datasets
3. Methodology
3.1. SBAS-InSAR Method
3.2. Expectation and Entropy Methods
4. Results
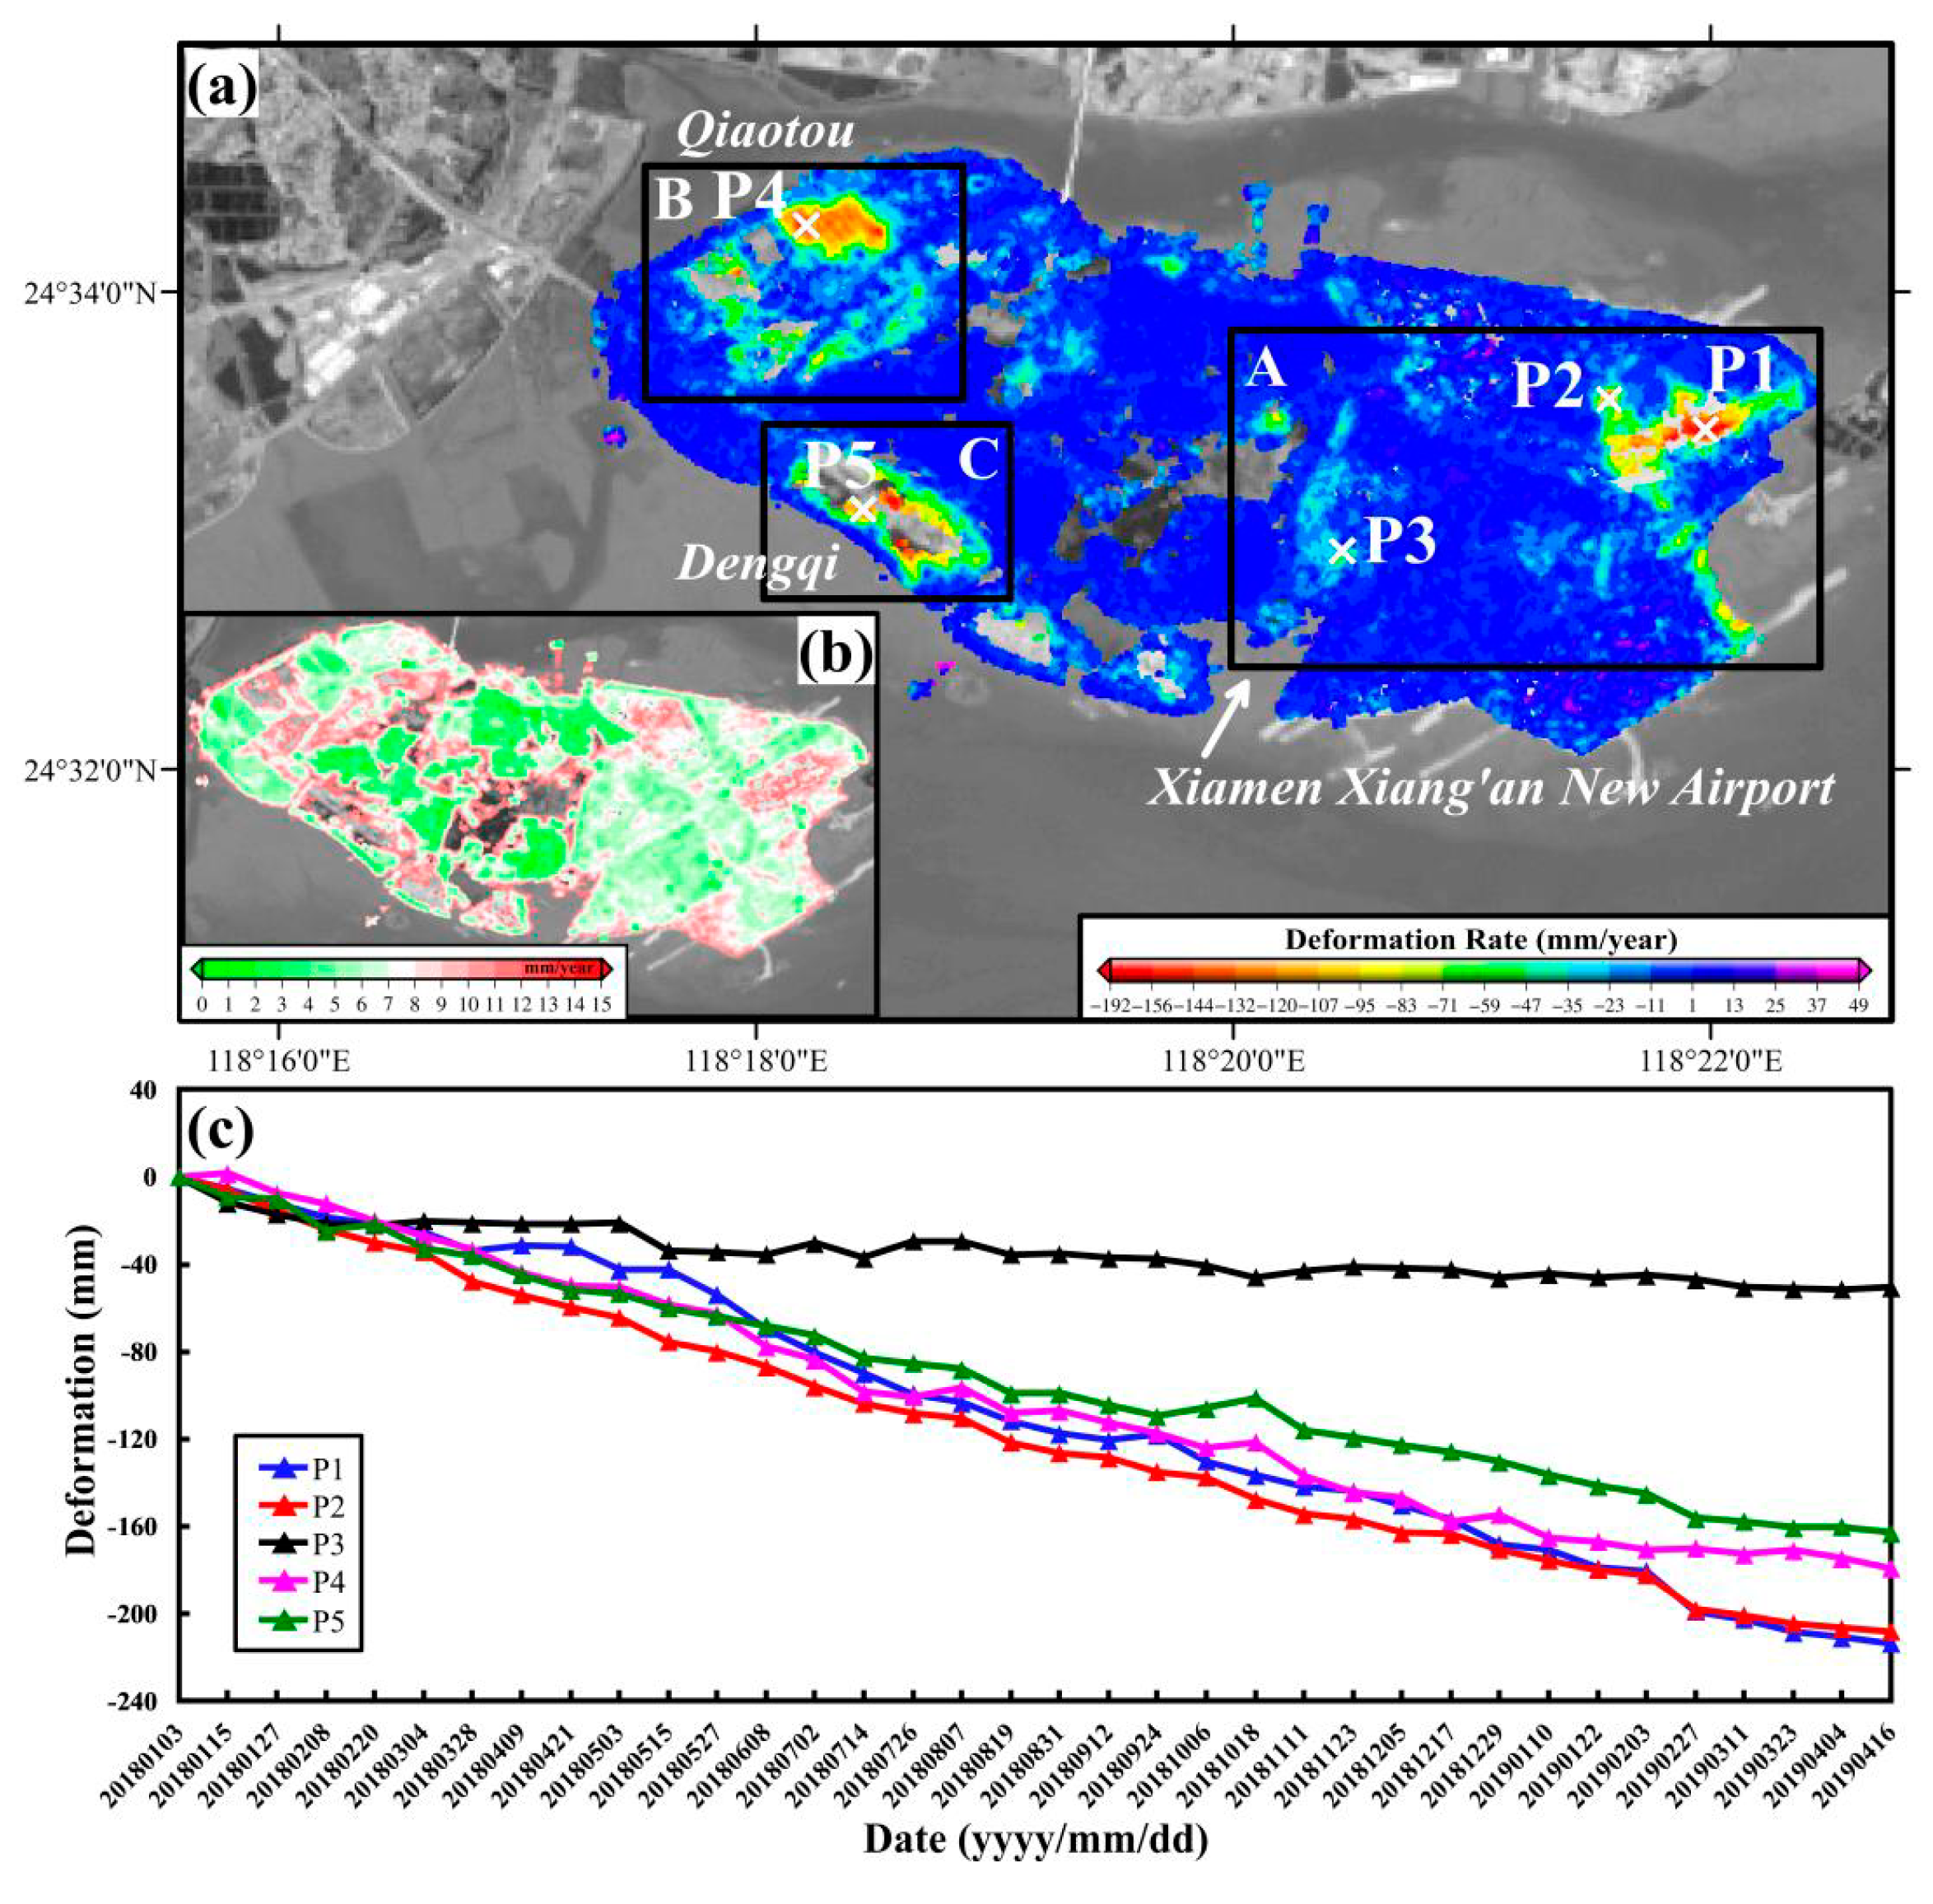
4.1. Mean Velocity Subsidence and the Time Series Subsidence
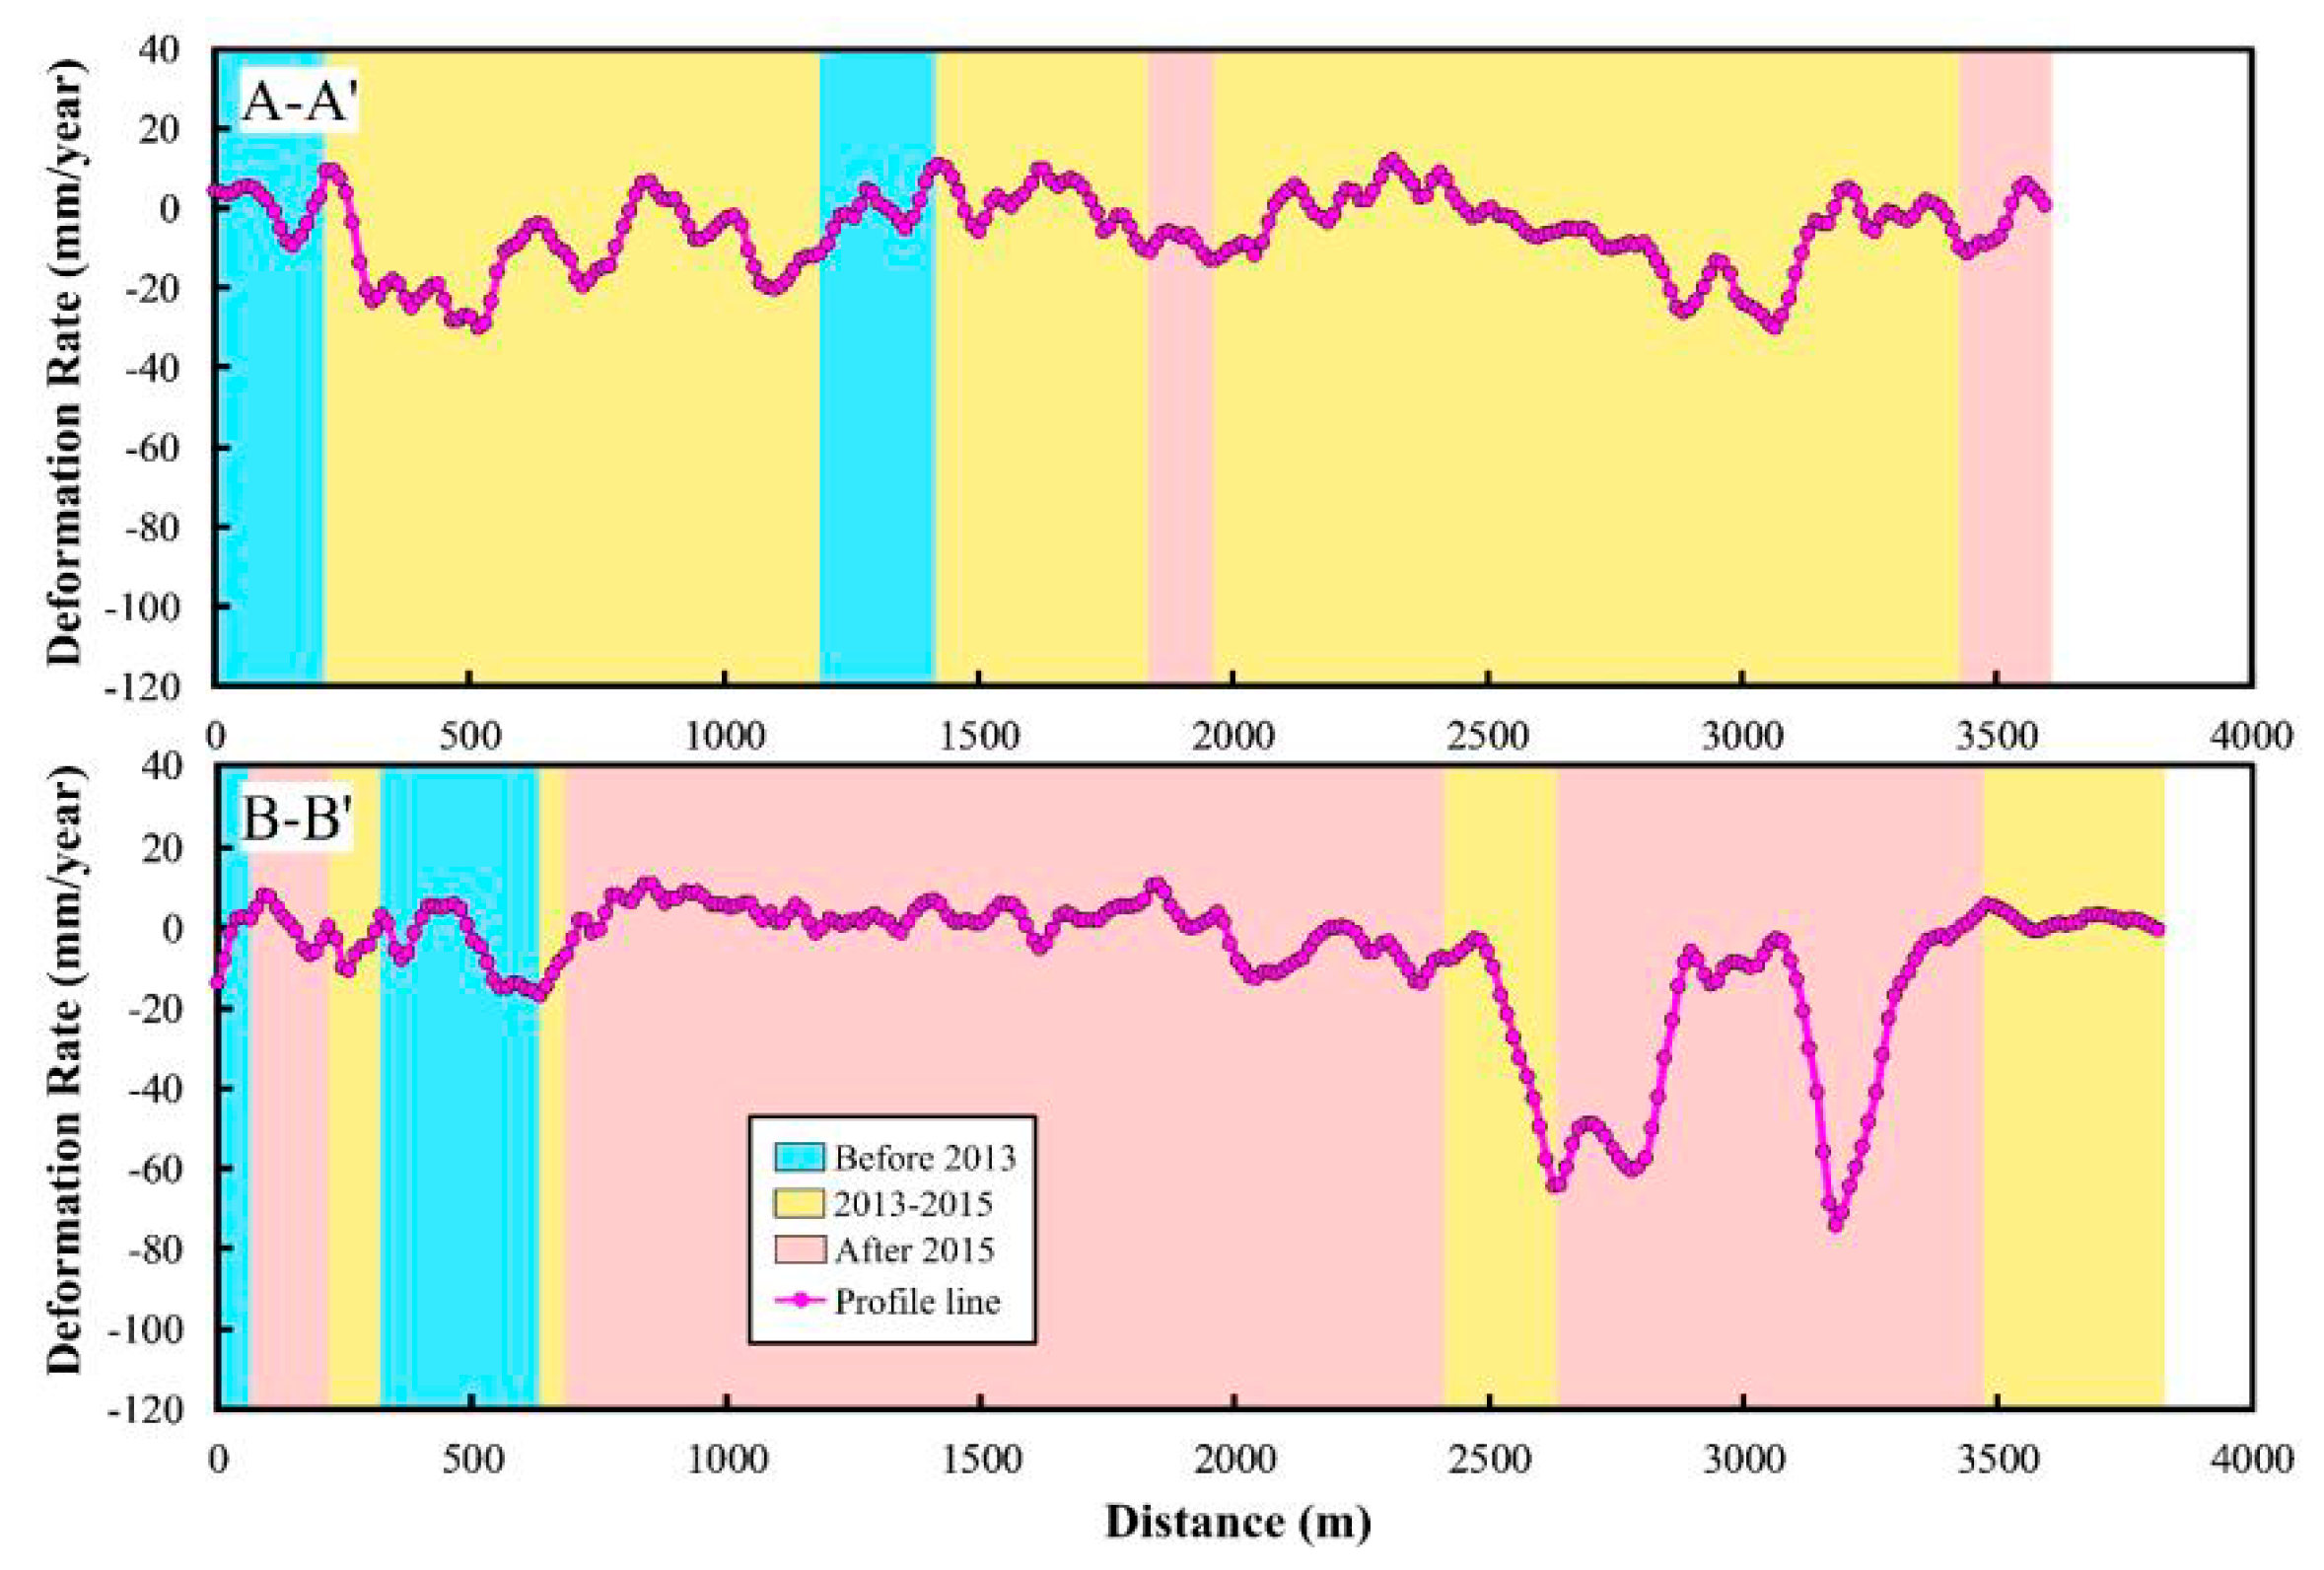
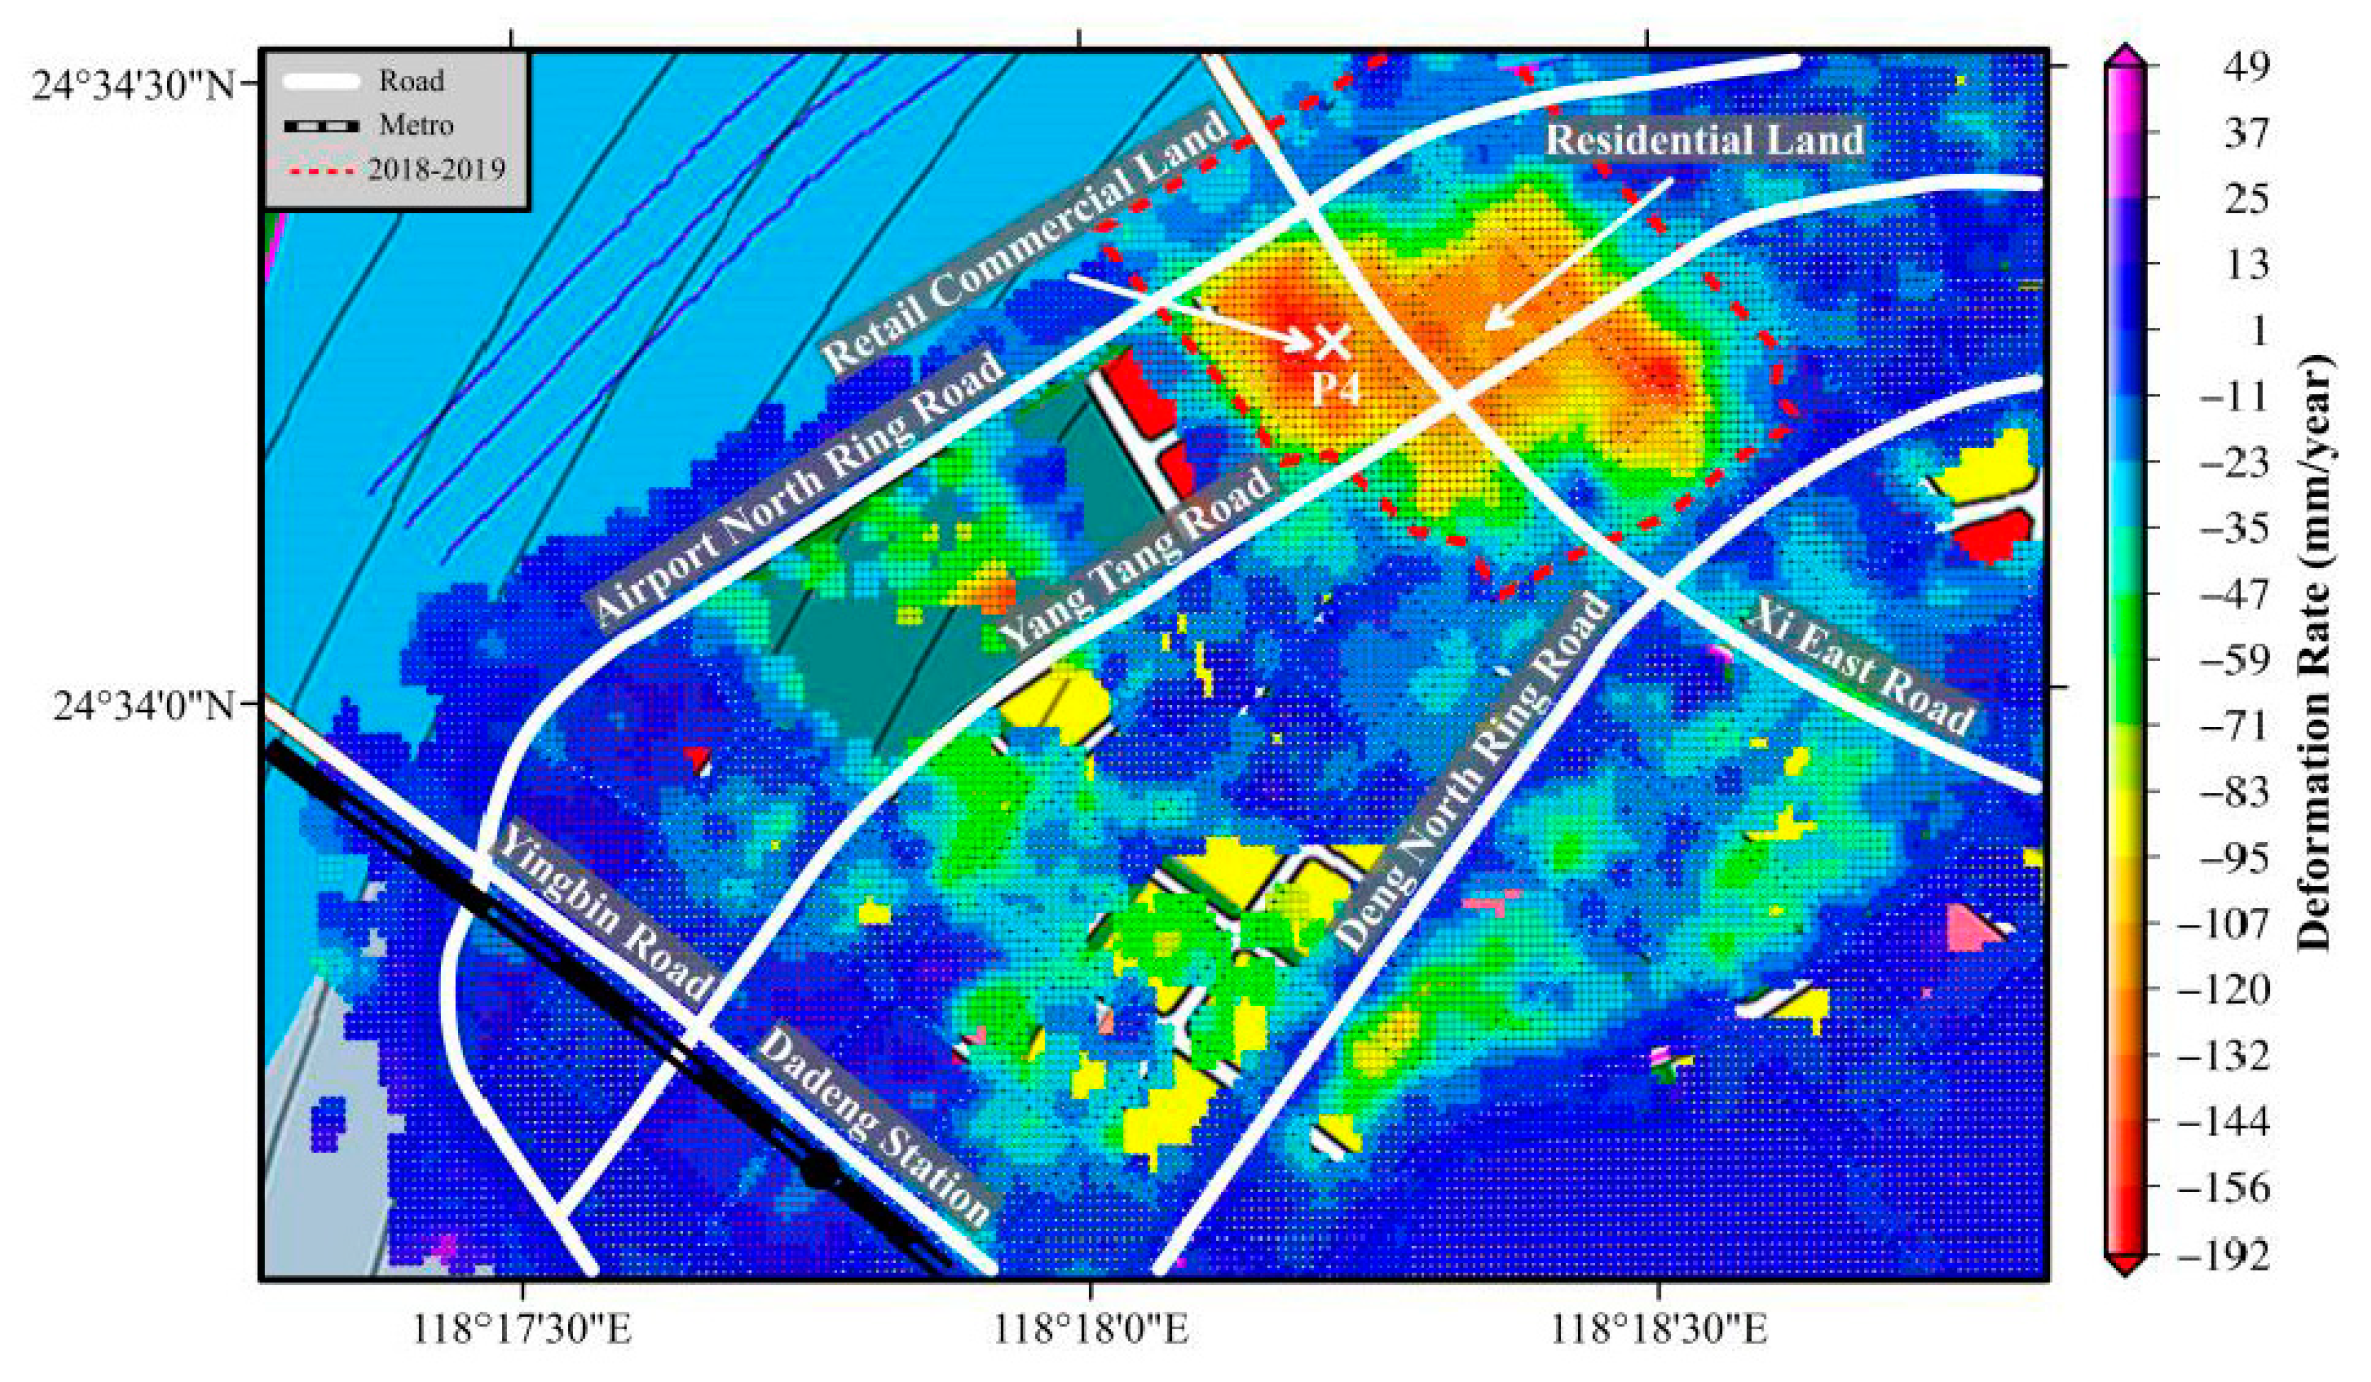
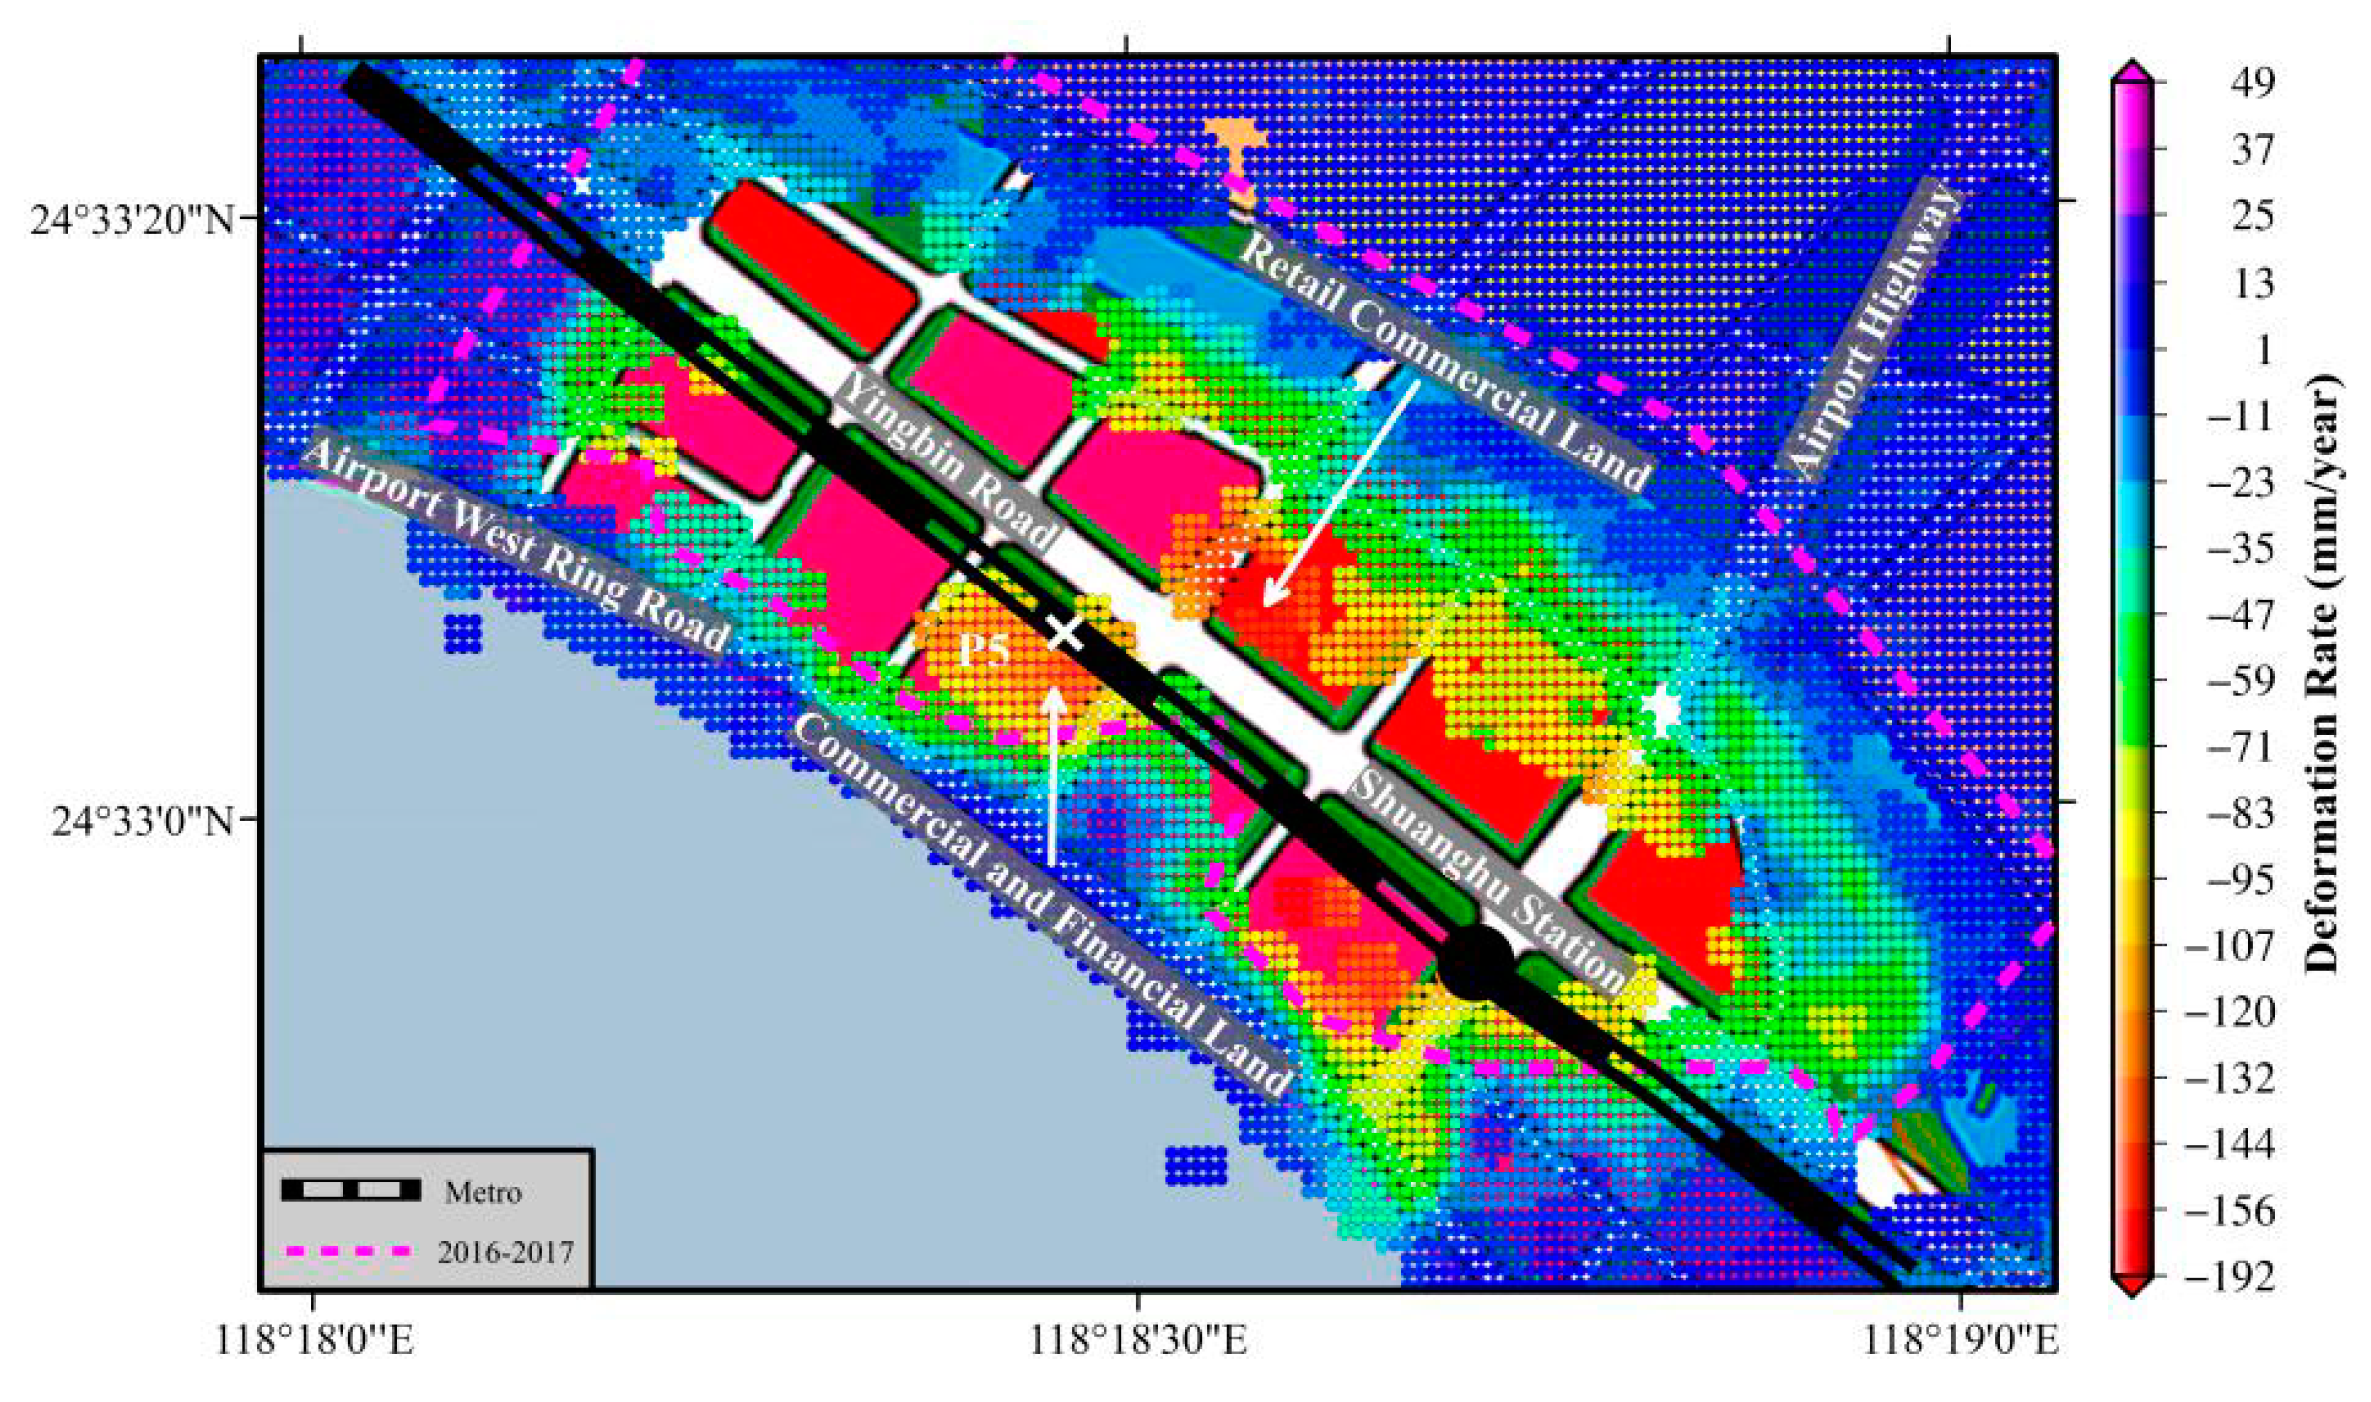
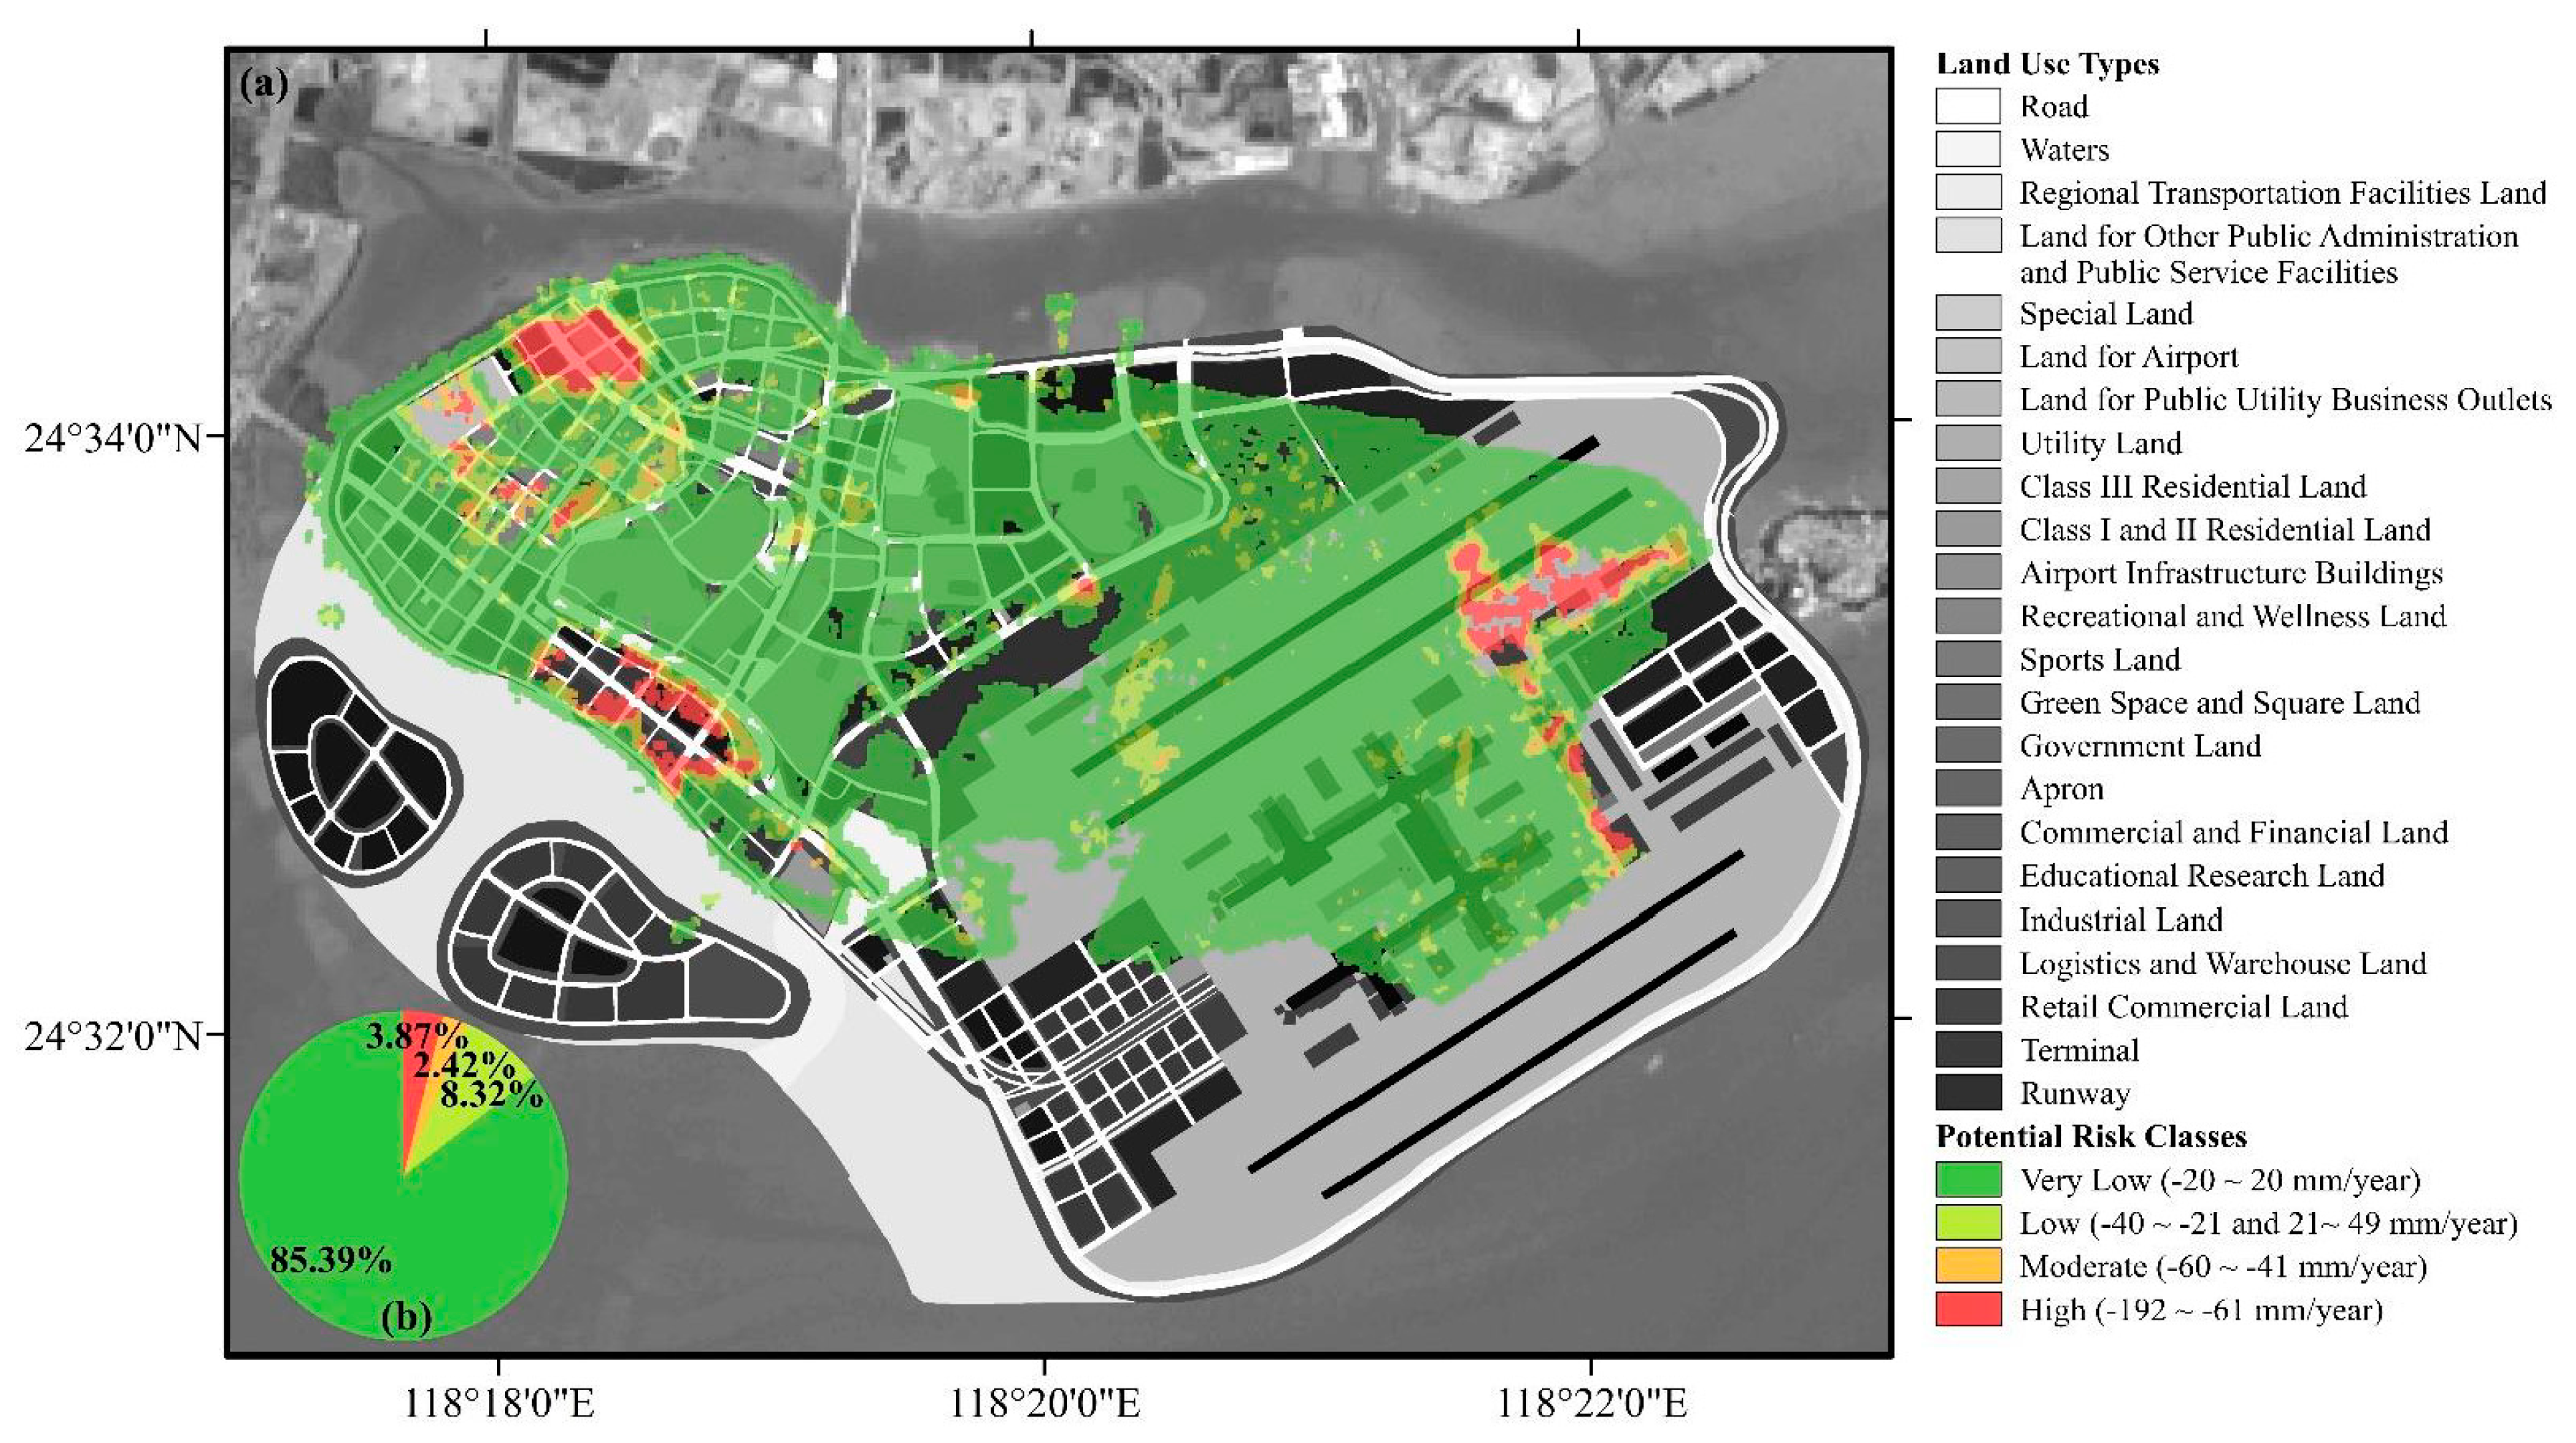
4.2. Main Subsidence Areas Combined with Land Reclamation and Land Use Planning information
5. Discussion
6. Conclusions
Author Contributions
Funding
Conflicts of Interest
References
- Xu, B.; Feng, G.; Li, Z.; Wang, Q.; Wang, C.; Xie, R. Coastal Subsidence Monitoring Associated with Land Reclamation Using the Point Target Based SBAS-InSAR Method: A Case Study of Shenzhen, China. Remote Sens. 2016, 8, 652. [Google Scholar] [CrossRef] [Green Version]
- Yang, M.; Yang, T.; Zhang, L.; Lin, J.; Qin, X.; Liao, M. Spatio-Temporal Characterization of a Reclamation Settlement in the Shanghai Coastal Area with Time Series Analyses of X-, C-, and L-Band SAR Datasets. Remote Sens. 2018, 10, 329. [Google Scholar] [CrossRef] [Green Version]
- Aimaiti, Y.; Yamazaki, F.; Liu, W. Multi-Sensor InSAR Analysis of Progressive Land Subsidence over the Coastal City of Urayasu, Japan. Remote Sens. 2018, 10, 1304. [Google Scholar] [CrossRef] [Green Version]
- Jones, C.E.; An, K.; Blom, R.G.; Kent, J.D.; Ivins, E.R.; Bekaert, D. Anthropogenic and geologic influences on subsidence in the vicinity of New Orleans, Louisiana. J. Geophys. Res. Solid Earth 2016, 121, 3867–3887. [Google Scholar] [CrossRef]
- Tosi, L.; Teatini, P.; Strozzi, T. Natural versus anthropogenic subsidence of Venice. Sci. Rep. 2013, 3, 2710. [Google Scholar] [CrossRef] [Green Version]
- Pepe, A.; Bonano, M.; Zhao, Q.; Yang, T.; Wang, H. The Use of C-/X-Band Time-Gapped SAR Data and Geotechnical Models for the Study of Shanghai’s Ocean-Reclaimed Lands through the SBAS-DInSAR Technique. Remote Sens. 2016, 8, 911. [Google Scholar] [CrossRef] [Green Version]
- Zhao, D. Study on the Technology of Foundation Treatment and Settlement Effect of Reclamation in Offshore Beach. Master’s Thesis, Chongqing Jiaotong University, Chongqing, China, 2017. [Google Scholar]
- Liu, X.; Zhao, C.; Zhang, Q.; Yang, C.; Zhang, J. Characterizing and Monitoring Ground Settlement of Marine Reclamation Land of Xiamen New Airport, China with Sentinel-1 SAR Datasets. Remote Sens. 2019, 11, 585. [Google Scholar] [CrossRef] [Green Version]
- Jiang, L.; Lin, H. Integrated analysis of SAR interferometric and geological data for investigating long-term reclamation settlement of Chek Lap Kok Airport, Hong Kong. Eng. Geol. 2010, 110, 77–92. [Google Scholar] [CrossRef]
- Hsieh, C.-S.; Shih, T.-Y.; Hu, J.-C.; Tung, H.; Huang, M.-H.; Angelier, J. Using differential SAR interferometry to map land subsidence: A case study in the Pingtung Plain of SW Taiwan. Nat. Hazards 2011, 58, 1311–1332. [Google Scholar] [CrossRef]
- Baek, W.-K.; Jung, H.-S.; Jo, M.-J.; Lee, W.-J.; Zhang, L. Ground subsidence observation of solid waste landfill park using multi-temporal radar interferometry. Int. J. Urban Sci. 2018, 23, 406–421. [Google Scholar] [CrossRef]
- Motagh, M.; Shamshiri, R.; Haghshenas Haghighi, M.; Wetzel, H.-U.; Akbari, B.; Nahavandchi, H.; Roessner, S.; Arabi, S. Quantifying groundwater exploitation induced subsidence in the Rafsanjan plain, southeastern Iran, using InSAR time-series and in situ measurements. Eng. Geol. 2017, 218, 134–151. [Google Scholar] [CrossRef]
- Hu, L.; Dai, K.; Xing, C.; Li, Z.; Tomás, R.; Clark, B.; Shi, X.; Chen, M.; Zhang, R.; Qiu, Q.; et al. Land subsidence in Beijing and its relationship with geological faults revealed by Sentinel-1 InSAR observations. Int. J. Appl. Earth Obs. Geoinf. 2019, 82, 101886. [Google Scholar] [CrossRef]
- Delgado Blasco, J.M.; Foumelis, M.; Stewart, C.; Hooper, A. Measuring Urban Subsidence in the Rome Metropolitan Area (Italy) with Sentinel-1 SNAP-StaMPS Persistent Scatterer Interferometry. Remote Sens. 2019, 11, 129. [Google Scholar] [CrossRef] [Green Version]
- Dai, K.; Li, Z.; Xu, Q.; Burgmann, R.; Milledge, D.; Tomas, R.; Fan, X.; Zhao, C.; Liu, X.; Peng, J.; et al. Entering the Era of Earth Observation-Based Landslide Warning Systems: A novel and exciting framework. IEEE Geosci. Remote Sens. Mag. 2020, 8, 136–153. [Google Scholar] [CrossRef] [Green Version]
- Dai, K.; Li, Z.; Tomás, R.; Liu, G.; Yu, B.; Wang, X.; Cheng, H.; Chen, J.; Stockamp, J. Monitoring activity at the Daguangbao mega-landslide (China) using Sentinel-1 TOPS time series interferometry. Remote Sens. Environ. 2016, 186, 501–513. [Google Scholar] [CrossRef] [Green Version]
- Tomas, R.; Li, Z.; Liu, P.; Singleton, A.; Hoey, T.; Cheng, X. Spatiotemporal characteristics of the Huangtupo landslide in the Three Gorges region (China) constrained by radar interferometry. Geophys. J. Int. 2014, 197, 213–232. [Google Scholar] [CrossRef] [Green Version]
- Wang, X.; Liu, G.; Yu, B.; Dai, K.; Zhang, R.; Chen, Q.; Li, Z. 3D coseismic deformations and source parameters of the 2010 Yushu earthquake (China) inferred from DInSAR and multiple-aperture InSAR measurements. Remote Sens. Environ. 2014, 152, 174–189. [Google Scholar] [CrossRef]
- Qiu, Q.; Hill, E.M.; Barbot, S.; Hubbard, J.; Feng, W.; Lindsey, E.O.; Feng, L.; Dai, K.; Samsonov, S.V.; Tapponnier, P. The mechanism of partial rupture of a locked megathrust: The role of fault morphology. Geology 2016, 44, 875–878. [Google Scholar] [CrossRef]
- Elliott, J.; Walters, R.; Wright, T. The role of space-based observation in understanding and responding to active tectonics and earthquakes. Nat. Commun. 2016, 7, 13844. [Google Scholar] [CrossRef] [Green Version]
- Osmanoğlu, B.; Sunar, F.; Wdowinski, S.; Cabral-Cano, E. Time series analysis of InSAR data: Methods and trends. ISPRS J. Photogramm. Remote Sens. 2016, 115, 90–102. [Google Scholar] [CrossRef]
- Crosetto, M.; Monserrat, O.; Cuevas-González, M.; Devanthéry, N.; Crippa, B. Persistent Scatterer Interferometry: A review. ISPRS J. Photogramm. Remote Sens. 2016, 115, 78–89. [Google Scholar] [CrossRef] [Green Version]
- Moreira, A.; Prats-Iraola, P.; Younis, M.; Krieger, G.; Hajnsek, I.; Papathanassiou, K.P. A tutorial on synthetic aperture radar. IEEE Geosci. Remote Sens. Mag. 2013, 1, 6–43. [Google Scholar] [CrossRef] [Green Version]
- Zhao, Q.; Lin, H.; Gao, W.; Zebker, H.A.; Chen, A.; Yeung, K. InSAR detection of residual settlement of an ocean reclamation engineering project: A case study of Hong Kong International Airport. J. Oceanogr. 2011, 67, 415–426. [Google Scholar] [CrossRef]
- Ding, X.L.; Liu, G.X.; Li, Z.W.; Li, Z.L.; Chen, Y.Q. Ground subsidence monitoring in Hong Kong with satellite SAR interferometry. Photogramm. Eng. Remote Sens. 2004, 70, 1151–1156. [Google Scholar] [CrossRef]
- Jiang, Y.; Liao, M.; Wang, H.; Zhang, L.; Balz, T. Deformation Monitoring and Analysis of the Geological Environment of Pudong International Airport with Persistent Scatterer SAR Interferometry. Remote Sens. 2016, 8, 1021. [Google Scholar] [CrossRef] [Green Version]
- Marshall, C.; Large, D.J.; Athab, A.; Evers, S.L.; Sowter, A.; Marsh, S.; Sjögersten, S. Monitoring tropical peat related settlement using ISBAS InSAR, Kuala Lumpur International Airport (KLIA). Eng. Geol. 2018, 244, 57–65. [Google Scholar] [CrossRef]
- Dai, K.; Shi, X.; Gou, J.; Hu, L.; Chen, M.; Zhao, L.; Dong, X.; Li, Z. Diagnosing Subsidence Geohazard at Beijing Capital International Airport, from High-Resolution SAR Interferometry. Sustainability 2020, 12, 2269. [Google Scholar] [CrossRef] [Green Version]
- Xiang’an New Airport Has High Appearance and Is Expected to Be Basically Completed in 2020. Available online: http://news.xmnn.cn/xmnn/2016/11/17/100124561.shtml (accessed on 17 August 2020).
- Cerovecki, A.; Gharahjeh, S.; Harirchian, E.; Ilin, D.; Okhotnikova, K.; Kersten, J. Evaluation of Change Detection Techniques using Very High Resolution Optical Satellite Imagery. Preface 2015, 2, 20. [Google Scholar]
- Kesikoglu, M.H.; Atasever, U.H.; Dadaser-Celik, F.; Ozkan, C. Performance of ANN, SVM and MLH techniques for land use/cover change detection at Sultan Marshes wetland, Turkey. Water Sci. Technol. 2019, 80, 466–477. [Google Scholar] [CrossRef]
- Berardino, P.; Fornaro, G.; Lanari, R.; Sansosti, E. A new algorithm for surface deformation monitoring based on small baseline differential SAR interferograms. IEEE Trans. Geosci. Remote Sens. 2002, 40, 2375–2383. [Google Scholar] [CrossRef] [Green Version]
- Lanari, R.; Mora, O.; Manunta, M.; Mallorqui, J.J.; Berardino, P.; Sansosti, E. A small-baseline approach for investigating deformations on full-resolution differential SAR interferograms. IEEE Trans. Geosci. Remote Sens. 2004, 42, 1377–1386. [Google Scholar] [CrossRef]
- Goldstein, R.M.; Werner, C.L. Radar interferogram filtering for geophysical applications. Geophys. Res. Lett. 1998, 25, 4035–4038. [Google Scholar] [CrossRef] [Green Version]
- Aimaiti, Y.; Yamazaki, F.; Liu, W.; Kasimu, A. Monitoring of Land-Surface Deformation in the Karamay Oilfield, Xinjiang, China, Using SAR Interferometry. Appl. Sci. 2017, 7, 772. [Google Scholar] [CrossRef] [Green Version]
- Costantini, M. A novel phase unwrapping method based on network programming. IEEE Trans. Geosci. Remote Sens. 1998, 36, 813–821. [Google Scholar] [CrossRef]
- Hooper, A.; Zebker, H.A. Phase unwrapping in three dimensions with application to InSAR time series. J. Opt. Soc. Am. A 2007, 24, 2737–2747. [Google Scholar] [CrossRef] [PubMed] [Green Version]
- Chen, F.; Lin, H.; Zhou, W.; Hong, T.; Wang, G. Surface deformation detected by ALOS PALSAR small baseline SAR interferometry over permafrost environment of Beiluhe section, Tibet Plateau, China. Remote Sens. Environ. 2013, 138, 10–18. [Google Scholar] [CrossRef]
- Chen, G.; Zhang, Y.; Zeng, R.; Yang, Z.; Chen, X.; Zhao, F.; Meng, X. Detection of Land Subsidence Associated with Land Creation and Rapid Urbanization in the Chinese Loess Plateau Using Time Series InSAR: A Case Study of Lanzhou New District. Remote Sens. 2018, 10, 270. [Google Scholar] [CrossRef] [Green Version]
- Deyi, L. Knowledge representation in KDD based on linguistic atoms. J. Comput. Sci. Technol. 1997, 12, 481–496. [Google Scholar] [CrossRef]
- Deyi, L.; Jiawei, H.; Xuemei, S.; Manchung, C. Knowledge representation and discovery based on linguistic atoms. Knowl. Based Syst. 1998, 10, 431–440. [Google Scholar] [CrossRef]
- Wenfeng, C.; Huili, G.; Beibei, C.; Kaisi, L.; Mingliang, G.; Chao-Fan, Z. Spatiotemporal evolution of land subsidence around a subway using InSAR time-series and the entropy method. GISci. Remote Sens. 2016, 54, 78–94. [Google Scholar] [CrossRef]
- Shi, M.; Chen, B.; Gong, H.; Li, X.; Chen, W.; Gao, M.; Zhou, C.; Lei, K. Monitoring Differential Subsidence along the Beijing-Tianjin Intercity Railway with Multiband SAR Data. Int. J. Environ. Res. Public Health 2019, 16, 4453. [Google Scholar] [CrossRef] [PubMed] [Green Version]
- Terzaghi, K.; Peck, R.B.; Mesri, G. Soil Mechanics in Engineering Practice; John Wiley and Sons: Hoboken, NJ, USA, 1996; pp. 1–592. [Google Scholar]


| Parameters | Description |
|---|---|
| Product type | Sentinel-1A TOPS SLC |
| Band | C |
| Wavelength (cm) | 5.63 |
| Beam mode | IW |
| Orbit direction | Ascending |
| Track No. | 142 |
| Polarization | VV |
| Acquisition time | 20180103-20190416 |
| Azimuth/Range pixel spacing (m) | 2.33/13.99 |
| Incidence angle (°) | 33.99 |
| Number of data | 36 |
| Revisit frequency (day) | 12 |
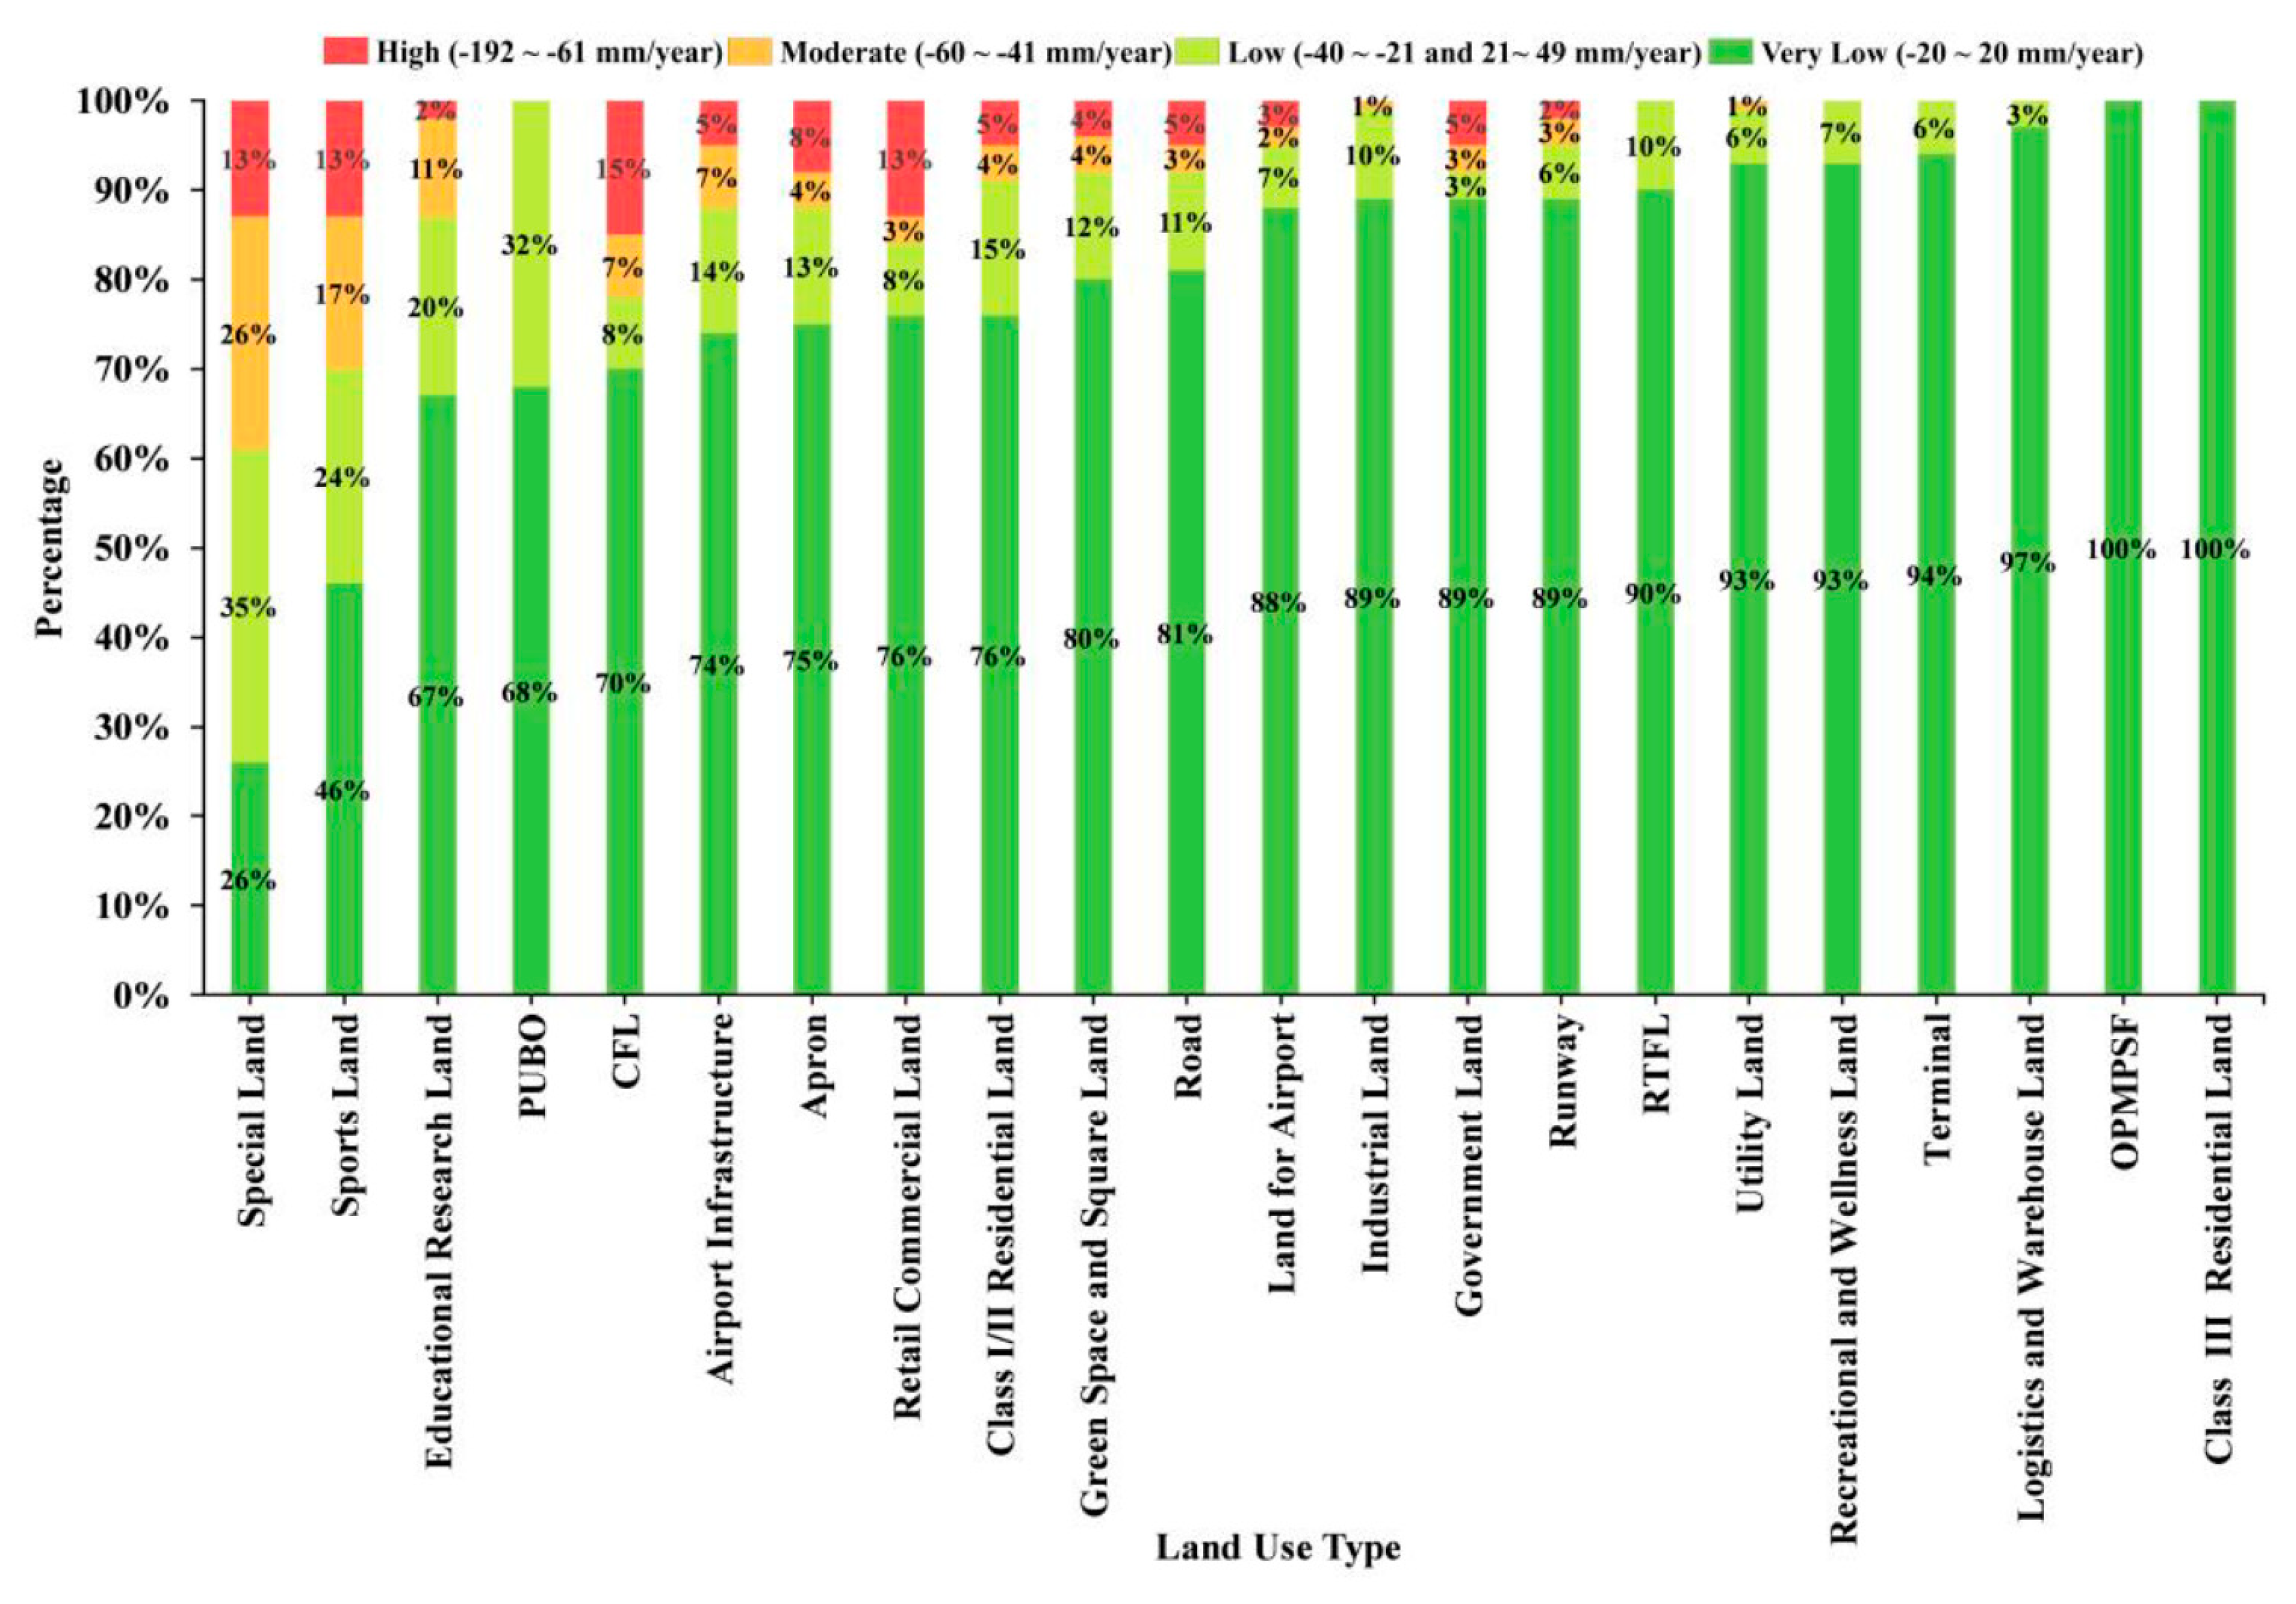
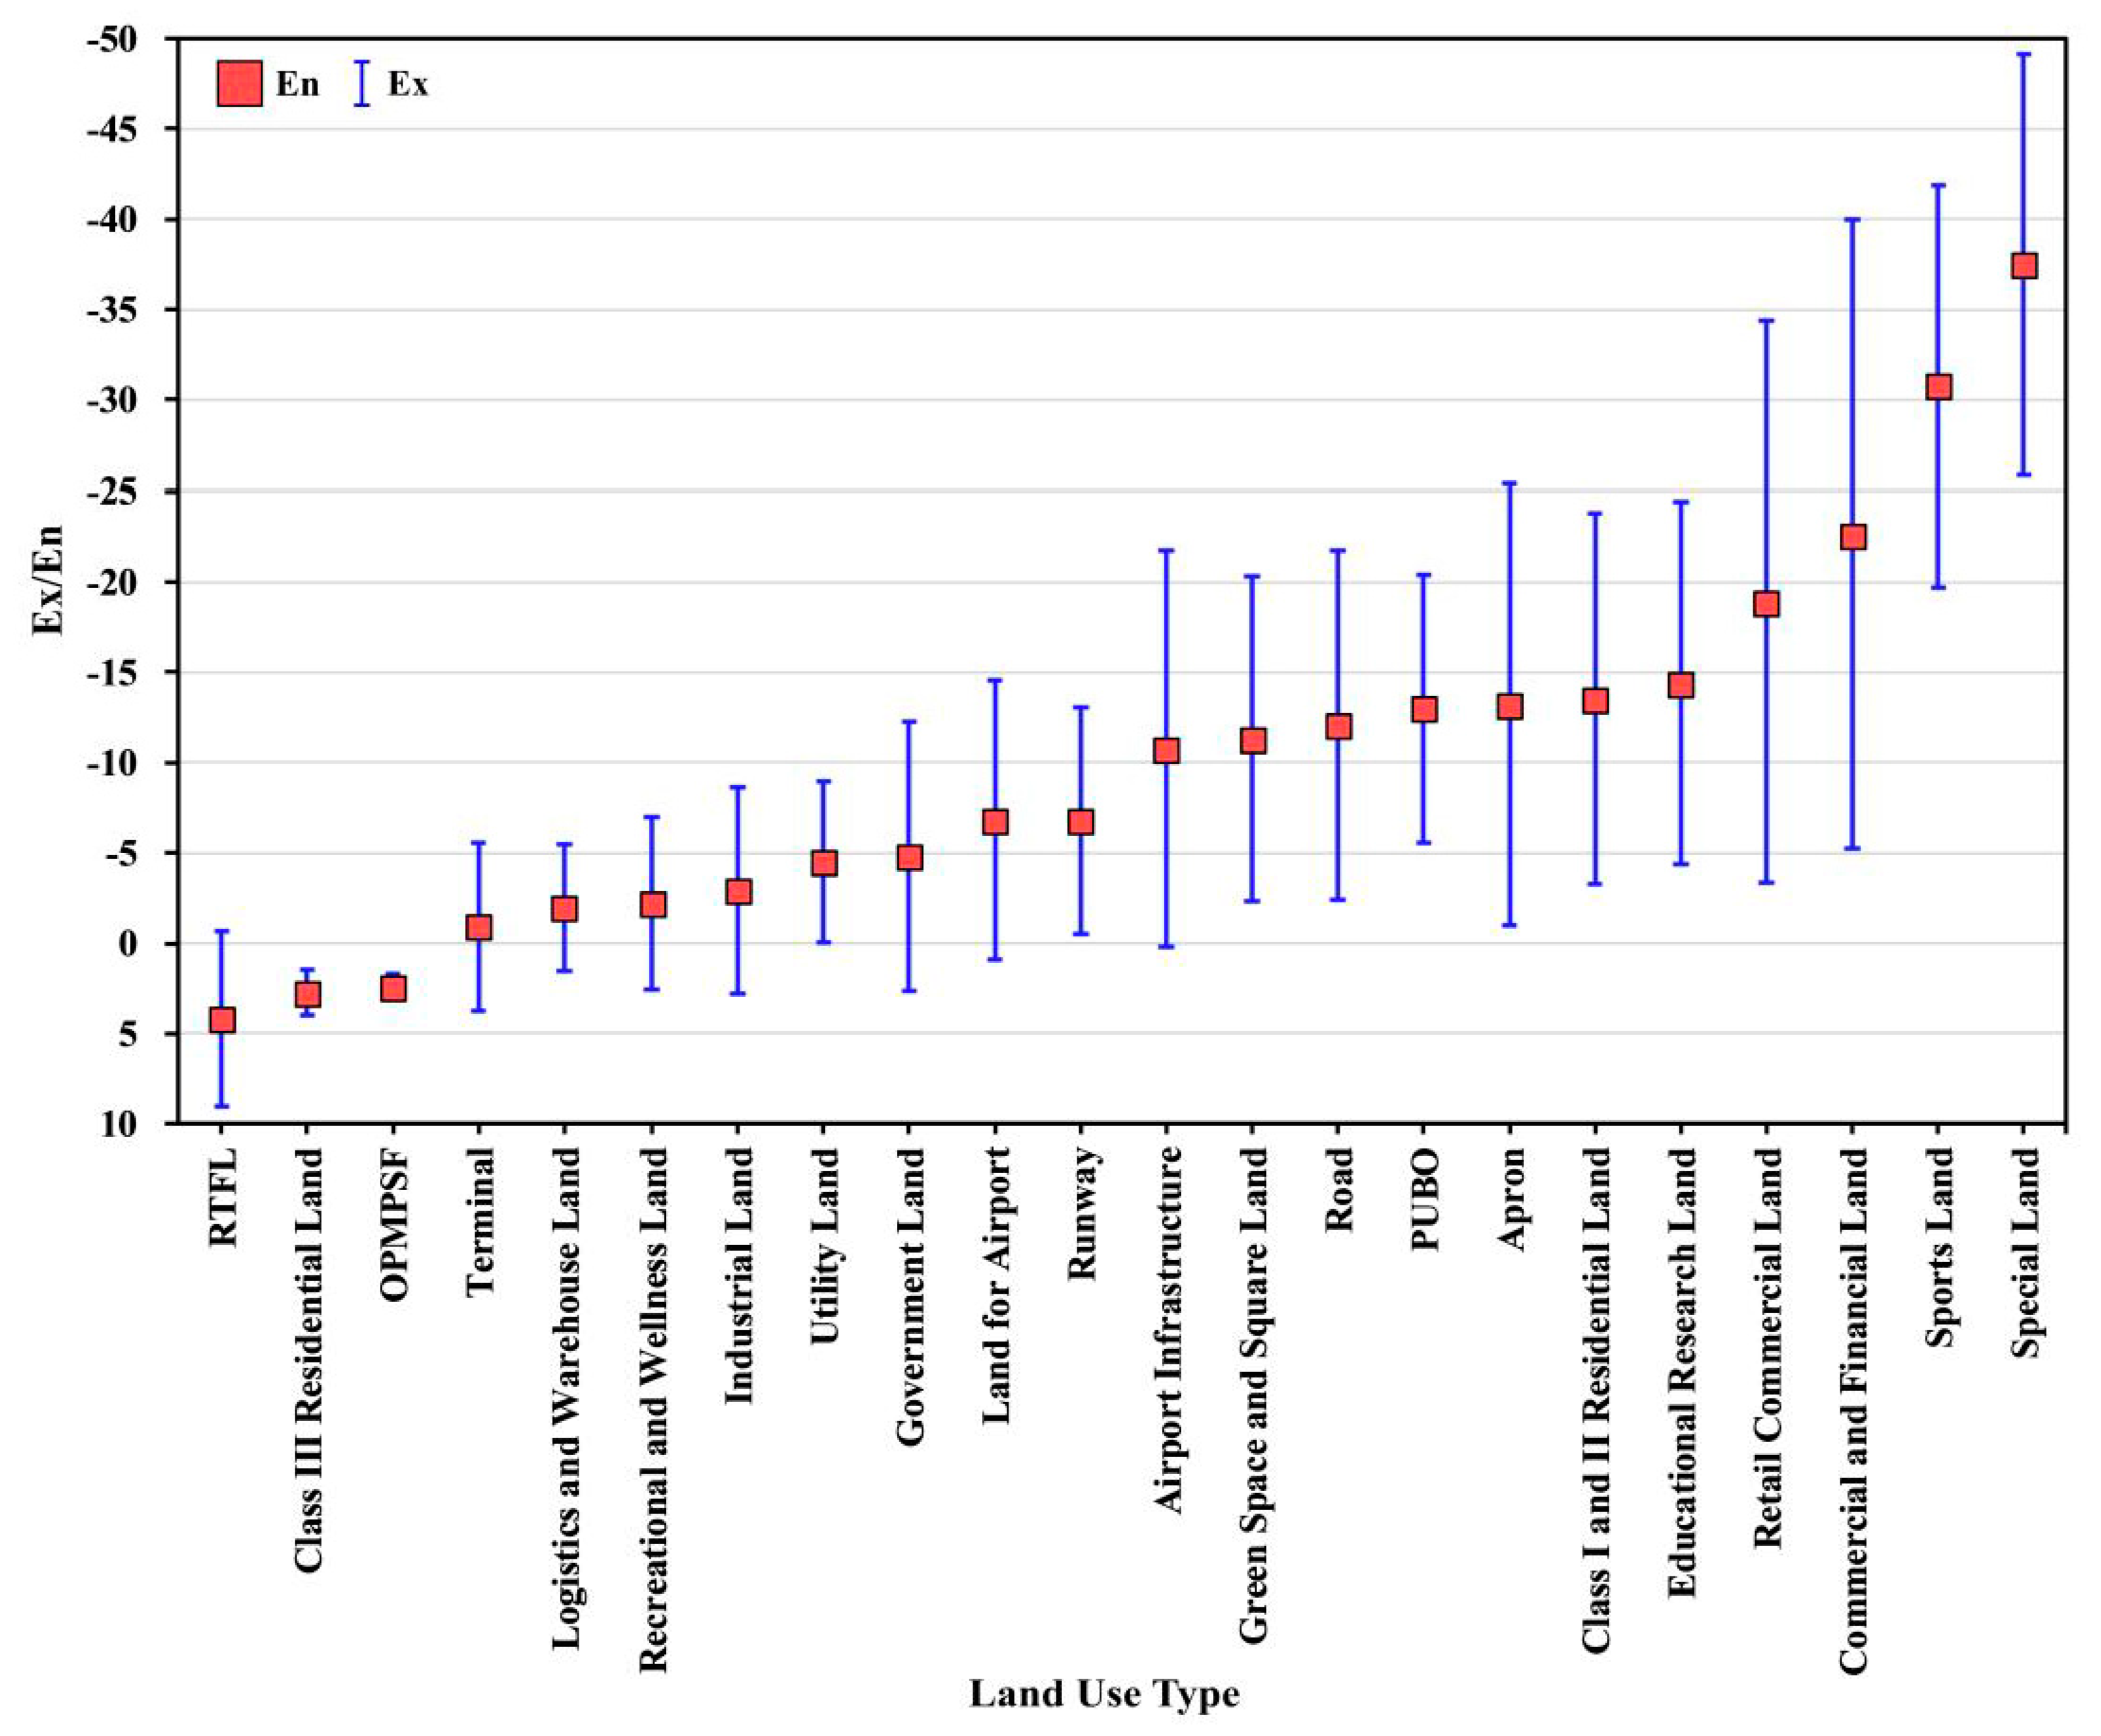
| Land Use Types | Area (10,000 m2, Hectare) | Max Velocity (mm/yr) | Ex | En | |||
|---|---|---|---|---|---|---|---|
| Velocity: −192~−61 (mm/yr) | Velocity: −60~−41 (mm/yr) | Velocity: −40~−21 (mm/yr) | Velocity: −20~20 (mm/yr) | ||||
| Land for Airport | 22.67 | 10.86 | 45.09 | 609.30 | −192 | −6.8 | 15.4 |
| Road | 13.79 | 7.63 | 27.27 | 211.13 | −164 | −12.1 | 19.3 |
| Retail Commercial Land | 12.81 | 3.26 | 7.68 | 73.59 | −168 | −18.9 | 31.1 |
| Apron | 8.26 | 4.08 | 12.80 | 80.90 | −181 | −13.2 | 24.4 |
| Green Space and Square Land | 7.82 | 6.88 | 21.29 | 149.83 | −155 | −11.3 | 18.0 |
| Class I/II Residential Land | 7.74 | 6.59 | 21.91 | 116.83 | −134 | −13.5 | 20.5 |
| Commercial and Financial Land | 6.07 | 2.99 | 3.41 | 29.05 | −169 | −22.6 | 34.8 |
| Special Land | 1.47 | 2.95 | 3.93 | 2.86 | −144 | −37.5 | 23.3 |
| Runway | 1.05 | 1.44 | 3.51 | 48.01 | −89 | −6.8 | 12.5 |
| Airport Infrastructure | 0.90 | 1.26 | 2.44 | 13.27 | −90 | −10.8 | 22.0 |
| Government Land | 0.87 | 0.55 | 0.50 | 16.26 | −105 | −4.8 | 14.9 |
| Educational Research Land | 0.40 | 2.49 | 4.69 | 15.66 | −99 | −14.4 | 20.0 |
| Industrial Land | 0.27 | 1.14 | 8.70 | 104.74 | −91 | −2.9 | 11.4 |
| Sports Land | 0.23 | 0.29 | 0.42 | 0.80 | −84 | −30.8 | 22.2 |
| Utility Land | 0.06 | 0.17 | 0.96 | 15.80 | −92 | −4.5 | 9.0 |
| Logistics and Warehouse Land | 0 | 0.10 | 2.60 | 101.24 | −54 | −2.0 | 7.0 |
| Terminal | 0 | 0.08 | 1.95 | 54.72 | −44 | −0.9 | 9.3 |
| RTFL | 0 | 0.05 | 0.98 | 23.75 | 49 | 4.2 | 9.7 |
| Class III Residential Land | 0 | 0 | 0.70 | 181.33 | −34 | 2.7 | 2.5 |
| Recreational and Wellness Land | 0 | 0 | 0.31 | 3.95 | −38 | −2.2 | 9.5 |
| PUBO | 0 | 0 | 0.20 | 0.43 | −36 | −13.0 | 14.8 |
| OPMPSF | 0 | 0 | 0 | 7.43 | 7 | 2.4 | 1.5 |
© 2020 by the authors. Licensee MDPI, Basel, Switzerland. This article is an open access article distributed under the terms and conditions of the Creative Commons Attribution (CC BY) license (http://creativecommons.org/licenses/by/4.0/).
Share and Cite
Zhuo, G.; Dai, K.; Huang, H.; Li, S.; Shi, X.; Feng, Y.; Li, T.; Dong, X.; Deng, J. Evaluating Potential Ground Subsidence Geo-Hazard of Xiamen Xiang’an New Airport on Reclaimed Land by SAR Interferometry. Sustainability 2020, 12, 6991. https://doi.org/10.3390/su12176991
Zhuo G, Dai K, Huang H, Li S, Shi X, Feng Y, Li T, Dong X, Deng J. Evaluating Potential Ground Subsidence Geo-Hazard of Xiamen Xiang’an New Airport on Reclaimed Land by SAR Interferometry. Sustainability. 2020; 12(17):6991. https://doi.org/10.3390/su12176991
Chicago/Turabian StyleZhuo, Guanchen, Keren Dai, Huina Huang, Shengpeng Li, Xianlin Shi, Ye Feng, Tao Li, Xiujun Dong, and Jin Deng. 2020. "Evaluating Potential Ground Subsidence Geo-Hazard of Xiamen Xiang’an New Airport on Reclaimed Land by SAR Interferometry" Sustainability 12, no. 17: 6991. https://doi.org/10.3390/su12176991