Dynamic Sustainability Assessment Tool: Case Study of Green Biorefineries in Danish Agriculture


1
Department of Agroecology, Aarhus University, Blichers Allé 20, DK-8830 Tjele, Denmark
2
Laboratory for Perceptual and Cognitive Systems at the Faculty of Computing, University of Latvia, Raina bulvaris 19, LV-1586 Riga, Latvia
3
Institute of Microbiology and Biotechnology, University of Latvia, 1 Jelgavas Street, LV-1004 Riga, Latvia
4
Research Department, Riga Stradins University, 16 Dzirciema Street, LV-1007 Riga, Latvia
*
Author to whom correspondence should be addressed.
Sustainability 2020, 12(18), 7389; https://doi.org/10.3390/su12187389
Submission received: 26 June 2020
/
Revised: 4 September 2020
/
Accepted: 7 September 2020
/
Published: 9 September 2020
(This article belongs to the Section Resources and Sustainable Utilization)
Abstract
:In this work, a novel, dynamic sustainability assessment tool is presented and validated in a case study. This tool combines two methods—system dynamics (SD) and temporal soil carbon modelling. The case study for sustainability analysis of Danish agriculture and green biorefineries supply chains in Denmark is used. The development of the Danish agriculture sector is simulated and assessed in relation to the ecosystem’s carrying capacity until 2050, defined as 1.4 livestock units per hectare. The results show that under the current development, the agriculture sector would exceed this carrying capacity shortly after 2030. The results obtained from the dynamic sustainability assessment tool show a more precise and less optimistic projection of future development than the assessment using constant soil carbon modelling values only. The study, therefore, suggests that the use of the temporal aspects in the sustainability assessment should be included and further developed.
1. Introduction
The prominent presence of the UN Sustainable Development Goals [1] prioritizes future research directions needed for a sustainable future. Seventeen interconnected goals cover agriculture, climate change and industry, innovations, and other sectors. Nevertheless, sustainability remains a disputable topic, even when the researchers agree on one common definition of sustainability since different sustainability aspects can be evaluated differently. Based on the International Energy Agency’s definition, the goal of biorefinery corresponds to the same goal of the conventional refinery of crude oil—to maximize the product yield per one unit of input [2].
In contrast to the conventional biorefinery, the “green” biorefineries can have a wider variety of final products’ streams. There are various ways to classify the biorefineries, such as, based on feedstocks, intermediates, and final products. In the case of using biomass as feedstock, the classification distinguishes four concepts—“yellow”, “green”, “blue”, and “grey” biorefineries. Biorefineries using materials from lignocellulose that are “dry” are classified as “yellow”. Biorefineries using lignocellulose materials, but those that are “wet” such as grasses and immature crops, are classified as “green”. “Blue” biorefineries use algae, while “grey”—food waste [3]. In this study, the case study of biorefinery for livestock feed is studied.
In this work, we use the term “biorefinery” to describe a concept when locally produced protein-rich substrate from grass is used in agriculture to substitute import protein-rich feed from soybean and soybean meal and cake. Thus, in this work, we study “green” biorefineries or second-generation biorefineries that use “wet” grass as feedstock.
So far, the majority of studies done on biorefineries are mostly assessing technical, environmental, or economic perspectives under constant assumptions [4,5,6]. In this research, we present a dynamic tool for sustainability analysis of green biorefineries supply chains. We combine two methods: System dynamics (SD) and temporal soil carbon modelling (given in more detail in Section 2.1), thus obtaining a hybrid model.
One of the studies that used SD studied how biorefineries development will affect the forestry sector in Austria, including social, technological, and economic aspects. Some of the major conclusions were that biorefineries would positively affect the competitiveness of the European pulp and paper industry while having no negative impact on other forest-based industries, forestry, sawmilling, and use for energy [7]. Other research was done by Hansen et al. [8] and studied the supply risks at the cellulosic biorefinery. This research shows that using advanced feedstock supply chain reduces the supply risk of biomass shortage by up to 90%.
In this study, the pig and dairy cow production in the Danish agriculture sector is chosen as the case study where the substitution of imported soy protein with locally produced green protein (a product from green biorefinery) is studied as a potentially sustainable solution. Thus, the model covers significant feed flows for animals and animal production, as well as limiting factors in the system, such as the ecosystem’s carrying capacity, total available area, normative regulations, and time delays in decision-making. The development of the Danish agriculture sector is simulated and assessed in relation to the ecosystem’s carrying capacity until 2050, defined as 1.4 livestock units per hectare. Three scenarios are modelled: (1) The reference scenario shows the system’s behavior for the next 30 years under the initial set of data and without any policy intervention, (2) the carrying capacity scenario where the development of pigs’ and cows’ production is limited by the defined carrying capacity of the ecosystem, and (3) biorefineries’ scenario shows the area of agriculture land needed to substitute all demand of soy import and the available land that can be transformed into the production of green protein from alfalfa after the year 2025. The temporal soil carbon modelling is applied in this scenario. The developed model can be further expanded to include the influence of various policy tools or other sectors of the economy.
2. Materials and Methods
2.1. Methodologies Used in the Sustainability Assessment Tool
In this paper, the developed sustainability assessment tool couples temporal soil carbon modelling and SD methodologies.
In this study, soil carbon modelling is used to compare two types of impact accounting—temporal and dynamic soil carbon gains and constant soil carbon gains. Assessment of the temporal soil carbon gains considers the time dynamics and decay effects of soil sequestration abilities. Temporal soil carbon gains is an emerging approach that is used for example in the methodology developed in the works by Levasseur et al. [9] and by Petersen et al. [10], and applied for soil carbon changes in the work by Parajuli et al. [11].
For the calculation of temporal soil carbon gains, the work by Mortenson et al. [12] was used, where authors showed that soil carbon gains follow nonlinear nature that can be described using a power function see Equation (1).
where SCG is soil carbon gain, t C per ha annually, and τ is years since the planting of alfalfa.
SD is a simulation tool that allows us to model feedbacks, non-linearities, and time delays in social, technical, and environmental aspects [13]. The development of the SD model consists of 4 key steps: (1) Problem definition and borders selection, (2) formulation of a dynamic hypothesis, (3) creation of a simulation model, and (4) model validation and testing of scenarios [14]. This methodology identifies the interaction between and among physical activities, information flows, and policy measures, thus revealing the variables’ dynamic nature. The studies on the use of SD for the agriculture sector have been done by Dace et al. [15]. This research shows the dynamics within the agriculture sector using IPCC (Intergovernmental Panel on Climate Change) greenhouse gas inventories and then models the possible further developments using various policy tools.
SD models can be represented in two ways; first, using the causal loop diagram and, second, the stock-flow diagram. These diagrams are developed at different stages of the modeling process, so they are used for various purposes while being complementary to each other.
The causal loop diagram is used to represent the essential information, so it is constructed to depict the case study’s conceptual model. The causal loops define the feedback mechanisms within the system under study (see Figure 1a) [13].
Causal links, given as arrows in Figure 1a, connect the variables. When a causal link is positive, given with “+” sign, an increase in the variable will create the changes in the second variable in the same direction—either increase or decrease. For example, the fewer Potential adopters, given in Figure 1a, on the market, the lower the Adoption rate becomes. When a causal link is negative, given with “−“ sign, a change in one variable will cause a change in other variables in the opposite direction. For example, when the Adoption rate increases, the number of Potential adopters reduces. The causal links create causal loops; they can have either a positive or reinforcing effect given with letter R, either opposing or balancing effect given with letter B [14]. Thus, the causal loop diagram concludes the relationships between the structure of the system, the system’s dynamic behavior, and the representation of these relationships [16,17].
Later, the diagram of causal loops is converted to a stock and flow diagram using a differential equation system to obtain a quantitative mathematical model. The stock-flow diagram is created using a computer simulation tool, which allows for quantitative simulation and analysis [18]. The stock-flow diagram is constructed using four principal components: Stocks, flows, variable parameters, and information links (see Figure 1b). Here, stocks represent the accumulation of values, and flows describe the flow of volumes to, from, and between stocks. These variable parameters that are algebraic, graphical, or constant values that characterize the relationship between system elements and information links serve as connections between elements that transmit information [16,17].
The development of the model for the proposed sustainability assessment tool is following the definition of the model’s structure and boundaries, major flows, and assumptions. First, the causal loop diagram is developed to depict the dynamics and inter-linkages of modeled elements within the biorefinery system. Then, the stock-flow model is built in the PowerSim simulation environment. The simulation time step is one year. After the model’s definition, both structural validation tests (testing the reasonability of the equations and model’s behavior under extreme conditions) and behavioral validation tests (comparing patterns of the major variable to the historical data) will be performed on the model. The mean square error percentage between the simulated and historically obtained data should be less than 10%; in this case, the model will be regarded as valid for the intended use.
2.2. The Case Study—Agriculture in Denmark
For validation of the proposed methodology, the agriculture sector in Denmark was chosen, as agriculture is a historically vital part of Denmark’s economy. This sector is currently exploring ways to transform to more sustainable practices, and there are historical data available to validate the developed model. One of these transformations towards possible sustainable practices are also modelled in this paper, and it includes the substitution of imported soy products for feed with locally produced green protein from alfalfa.
One of the challenges for widespread use of green protein is that there is already a large share of land used for agriculture and further expansion of agricultural land is challenging. In 2018, 60% of Denmark’s total land area was used for agricultural purposes, where around ¾ of agriculture land was used to grow feed [19,20]. Moreover, the available land area for agricultural purposes is declining due to the development of infrastructure and forestry. Although the agricultural sector produced only 2.2% of the total Danish economy output [21] and accounted for the employment of just 1.5% of the workforce [22], the export of agricultural produce is within the top 10 branches of trading in this country.
The share of agricultural export, such as live animals, meat, dairy, eggs, cereals, vegetables, and fruits, accounted for 9.28% of the total export balance [23]. Within the listed categories, the most significant contributor was the export of meat products for about 3.5 billion euros, and dairy and eggs produce for around 2.3 billion euro [23]. Thus, Denmark is currently one of the largest exporters of live piglets and pig meat producers in Europe [24]. Therefore, the model developed in this study simulates pig and dairy cow production in Denmark.
2.3. Definition of the Key Modelling Problem and Variables
In this section, the key modelling problem and variables are defined, and the simulation period is given. Nowadays, pressure on the available land resources is coming from at least two major sectors: Agriculture and biofuels. While the biomass is a renewable resource, it is not unlimited, as growth requires land use, and the land is limited, thus having carrying capacity. The transition from fossil fuels to biofuels will put more pressure on land, water, and mineral use to sustain biomass yields [25].
Therefore, the key dynamic problem is the availability of land resources and the role of biorefineries in the sustainability of the use of the land resources within the carrying capacity of the ecosystem. Two of the key variables that are considered are land use and animal feed. The simulation covers years starting from 2009 until 2050.
Modeling of animal feed is chosen since the current trend is that with a growing population and prosperity, more animal-based products are projected to be demanded [26]. It has been calculated that in 2013, only 55% per calorie of crops accounted for direct human consumption, while 36% for feed and 9% for industrial use, including biofuels. In countries that have a strong dependence on agricultural systems, like Denmark, this proportion is even more dramatic, with 25% of crops used for direct human consumption, 71% for feed, and 4% for industrial use [20].
While a large proportion of land in Denmark is already used for animal feed, 5–14% of the feed for conventional pig farms is still made up of imported soy byproducts [27]. The use of soybean products as animal feed creates a contribution to environmental degradation since soybean production is often linked with intensive deforestation and other ecological and social impacts [28].
The substitution of imported soy protein with locally produced green protein (a product from green biorefinery) is studied as a potentially sustainable solution. The solution is based on the production of “green” protein in the biorefineries from perennial plants. Studies have shown that perennial plants have less environmental impacts in agriculture compared to annual crops, such as cereals [3]. Environmental benefits in converting fields to perennial crops include reduced leaching of nitrogen, the potential to lower use of N-fertilizer and pesticides, and increased carbon storage in soils [29]. In two test sites in Denmark, Manevski et al. [30] demonstrated that fertilized perennial grasses show the reduction of nitrate leached by 70–80% and double biomass N in comparison to the conventional farming methods such as continuous maize or triticale or cereal crop rotation. These results are is achieved because perennial grasses have more extensive root systems than annual crops, thus ensuring also lower soil erosion, higher carbon sequestration, reduced groundwater pollution, and higher biodiversity [31].
Some of the studied perennial grasses are grass-clover, ryegrass, alfalfa, and festulolium [32], and also reed, Napier grass, switchgrass, and others [31]. The study by Parajuli et al. [33] showed that “green” biomass should be preferable over “yellow”, and “yellow” is preferable over “woody”. Thus, this study is focusing on green biomass from perennial crops.
2.4. Ecosystem’s Carrying Capacity of the Modeled System
The general representation of the concept for the Ecosystem’s carrying capacity is given in Figure 2.
When the Exploitation of the ecosystem reaches the Ecosystem’s carrying capacity, firstly, degradation of the Ecosystem’s carrying capacity occurs by moving away from the initial Planetary boundary. While the Ecosystem’s carrying capacity is degraded, the Exploitation of the ecosystem is still developing by inertia, firstly crossing the Threshold, and then further growing “beyond” the Ecosystem’s carrying capacity. At the same time, the Ecosystem’s carrying capacity collapses, triggering a collapse in the Exploitation of the ecosystem as well. Later, when the Exploitation of the ecosystem is again within the Ecosystem’s carrying capacity, a new equilibrium state is achieved, but the new level of the Ecosystem’s carrying capacity might never return to the initial level of the Planetary boundary.
In our model, the maximum number of livestock units per hectare is used as a major limiting factor and as a proxy for the ecosystem’s carrying capacity. Farming of animals is a contributor to numerous environmental problems, both as direct pollution of local ecosystems and indirect contribution towards deforestation in South America [28]. Direct pollution mainly occurs due to nitrogen leaching, ammonia, and odor.
These environmental impacts in Denmark are regulated using the so-called Harmony Rule or action plan on the aquatic environment, where the limit of the application is 170 kg of cattle manure total nitrogen (N) per ha and 140 kg of pig manure N per ha annually. These limits can also be expressed in livestock units of nitrogen (LSU-N) per ha, where one LSU-N is equal to 100 kg of total nitrogen (N) in manure ex store. The LSU-N value for animal types relevant in this model is given in Table 1.
2.5. Causal Loop Diagram
A causal loop diagram is created to explain the dynamic hypothesis [14]. In Figure 3, the dominant causal loops—one reinforcing and two balancing loops included in the model—are given.
Interaction between the Produced number of cows and pigs and the Area of managed agricultural land creates a major reinforcing loop in this model. In this reinforcing loop, the number of produced animals is regulated by the auxiliary exogenous variable Demand for animal products and the Productivity of the cows and pigs production system. The Demand for animal products has a positive causal link with the variable Produced number of cows and pigs, meaning the change in the demand will lead to the alteration in the amount of produced livestock in the same direction. When the demand is rising, the number of animals bred will increase; when demand is falling, the number of animals bred will decrease. Inverse correlation is given for the variable Productivity of the cows and pigs production system with the variable Produced number of cows and pigs, as with increasing productivity, fewer animals will be needed to supply the same amount of final produce demanded.
Next, in the model, the Produced number of cows and pigs links with Demand for animal products. Here, the causal relationship is positive. Import feed demand mainly accounts for the soy used for feed and creates further changes in ecosystems outside of Denmark. Mitigation of ecosystem changes outside of Denmark is out of the scope of the modeled system, therefore it is not assessed further. Local feed demanded is linked with the variable Area of managed agriculture land. Based on the availability of land for growing feed, and the Productivity of the feed production system, the amount of Local feed supplied is available. In this research, the link between Local feed supplied and Produced number of cows and pigs is assumed not to influence the behavior of the modeled system since, in the case of shortage of feed, the needed amounts can be covered by imported feed.
The balancing loop B1 shows that the Area of managed agriculture land is the function of the Total land available for expansion of agriculture practice. In this model, the availability of land for agriculture is one of the governing limiting factors.
The balancing loop B2 depicts another principal limitation included in the model—this is the Ecosystem’s carrying capacity given in livestock units per hectare (LSU-N/ha). In this balancing loop, the Exploitation of the ecosystem is assessed by the ratio of Produced number of cows and pigs and the Area of managed agriculture land. The difference between the Ecosystem’s carrying capacity and Exploitation of the ecosystem. In the case Ecosystem’s carrying capacity is not reached, there are no corrective measures assumed in the model. In the case when Ecosystem’s carrying capacity is reached, and thus the Distance to carrying capacity is equal to zero, the Corrective action via policy tool is “switched on” meaning that no further expansion in the number of housed animals is allowed. Such policy forces animal producers to look for the potential increase in the Productivity of cows and pigs production system while limiting the Produced number of cows and pigs.
Two parallel lines on the causal link show the delay in the system. As can be seen, there is a delay given for the causal links connecting the variable the Exploitation of the ecosystem due to the time needed for measurements, reporting, and perception of the situation. There is a delay between Distance to carrying capacity and Corrective action via policy tool due to administrative and decision-making process, and between Corrective action via policy tool and Productivity of cows and pigs production system due to action delays.
2.6. Assumptions and Scenarios
The major assumption included in the model are as follows:
- The model assumes only conventional system for pigs and dairy production, since, in 2018, in Denmark, conventional pigs’ production accounted for 99.2% of the total number of breeding pigs, 98.3% of the total number of pigs’ farms, and 98.5% of the total agricultural area used for pigs’ production. The shares for conventional dairy cows’ production were: 88.7% of the total number of dairy cows, 87.1% of the total number of dairy cows’ farms, and 83.9% of the total agricultural area used [19];
- The average annual changes in animals produced nationally follow the changes in demand for animal products (exogenous factor in the model)—piglets for meat production and dairy cows for milk production. Based on historical trendlines for the period of 2009–2018 [19], the average growth for piglets is assumed to be 0.32% per year, while for dairy cows it is 0.64% per year, and for all other remaining livestock is 3.5% per year;
- The productivity increase in pigs’ production cycle is modeled assuming a logarithmic function for live-born piglets per sow per year. Remaining values for pigs’ production cycle are modeled according to the estimates given in the latest scientific literature [37,38] and are assumed to remain constant during the simulation, please see the Supplementary Materials Table S1 for the numerical values used;
- The productivity increase in dairy cows’ production cycle is assumed to be constant during the simulation, and values for cows’ production cycle are modeled according to the estimates given in the latest scientific literature [39,40], please see the Supplementary Materials Table S3 for the values used;
- Changes in the area of managed agricultural land are assumed to decline by 0.71% per year due to external change in the demand for land for other purposes (mainly the development of infrastructure and forestry) (exogenous factor in the model), and are based on historical trendlines for the period of 2009–2018 [41];
- The estimates for feed amount and composition are taken from the scientific literature for pigs’ production [27], for dairy cows and bull calf [39,42]. Eighty-one percent to 84% of feed consumed by animals in pigs’ production is modeled, including soy meal, wheat, and barley, and 87% to 96% of feed consumed by animals in cows’ production is modeled, including cereals, grass, soy meal, maize silage, and barley silage. The remaining percentage of feed consumed are not included in this model. Feed efficiency (live weight gain and milk per feed intake) is assumed constant in the model;
- The estimates for alfalfa biorefinery outputs and conversation efficiency for the Danish case study are assumed based on the article by Corona et al. [3]. There are three types of the conversion efficiencies from alfalfa to animal-grade protein considered in the model for the biorefineries. Two are of constant conversion efficiency in all simulation period: (1) 40.5%, according to the research done by Corona et al. [3] for the Danish case study; (2) 50% in personal communication with the researchers’ acquired that current state-of-the-art conversion efficiency on the laboratory scale. Finally, the third conversion efficiency is modeled using the so-called learning curve, which shows the efficiency improvements in the function of the time due to scientific development. In this case, the projected protein extraction efficiency grows as a logarithmic function from 35% in 2010 and converges towards the efficiency of 60% by 2050;
- The simulation model assumes that the introduction of green biorefineries starts from the year 2025 and follows the delay described by the logistic function of the first order;
- Delay in measurements, reporting, and perception of the situation is assumed to be one year, delay due to administrative and decision-making process is one year, and action delays is two years;
- The financial aspects of farms were not modeled in this research since the work by Willems et al. [24] showed that in the period between 2004 and 2008 actual price of the land in Denmark was decoupled from potential production value of agricultural products due to high level of debt and unstable financial market conditions.
- The land area demanded using conversion efficiency at biorefinery of 40.5% is assumed according to the research done by Corona et al. [3] for the Danish case study.
The definition of the scenarios is based on the major limitation in the model—the Ecosystem’s carrying capacity. The following scenarios were studied:
- Reference scenario. The reference scenario shows the system’s behavior for the next 30 years under the initial set of data and without any policy intervention. The results obtained in the reference scenario are compared with the defined carrying capacity of the ecosystem—1.4 LSU-N/ha;
- Carrying capacity scenario. The carrying capacity scenario simulates policy that limits the further expansion of animal production by maintaining a stable absolute number of animals. Thus, in this scenario, the development of pigs’ and cows’ production is limited by the defined maximum number of animals;
- Biorefineries’ scenario. This policy scenario is built upon the results of the 2nd scenario (carrying capacity scenario) and additionally introduces local green protein from alfalfa. This scenario shows the area of agriculture land needed to substitute all demand for soy import and the available land that can be transformed into the production of green protein from alfalfa after the year 2025. The temporal value for soil carbon gains is compared with the use of constant value for the area converted from cropland to alfalfa.
2.7. Creation of a Stock and Flow Diagram
The creation of a simulation model in the software environment or the creation of a stock and flow diagram includes the defined parameters and their associated equations, initial conditions, etc. In the simulation software tool, the dynamic hypothesis and causal loop diagram are transformed into a computer model that mimics the behavior of the system being studied [14].
The stock and flow diagram for the ecosystem’s carrying capacity for the developed model is given in Figure 4 (variables given in color match the results presented in Figure 5 and Figure 6 in the Results and Discussion section).
Figure 4 shows one of the central submodels used in the simulation that outlines the relations between the Exploitation of the ecosystem, all farmed animals, the Ecosystem’s carrying capacity, and the Distance to carrying capacity.
It should be explained that the same variables can be represented in the simulation model using the “shortcut.” For example, the small stock and flow diagram is given in the upper right corner of Figure 4 simulates changes in the Area of managed agriculture land. In other places of Figure 4, a “shortcut” to the stock variable Area of managed agriculture land is given presented with “brackets” around the corners of the rectangular stock variable. These shortcuts are created for clarity of the diagram to avoid the links between variables going over other variables and crossing other links. These “shortcuts” work identical to the “original” variable and use the same mathematical expression. When there are changes in the value for the Area of managed agriculture land, the “shortcuts” for the Area of managed agriculture land have the same changes instantaneously.
Likewise, there are other “shortcuts” given in Figure 4. Three of these shortcuts represent the conventional pigs’ production, and three represent conventional cows’ production. Please see the Supplementary Materials Figures S1–S3 for stock and flow diagram for the production cycle of these animals, Tables S1 and S3 for numerical values assumed for the production cycles, and Tables S2 and S4 for the equations used in the model.
The logic underlying the value of the Exploitation of the ecosystem is by modeling the number of animals farmed per year, applying the constant number of animals per LSU-N (given in Table 1), and dividing with the area of managed agriculture land in the same year. For example, the number of Cows is divided by the Constant LSU-N cows, and the obtained value is given as the variable LSU-N cows. Next, the value of LSU-N cows is divided by the value for the Area of managed agriculture land, thus obtaining the other value given as the variable LSU-N conventional cows per managed agriculture land. Later, these values for various types of animals farmed are summed up to create the value of the Exploitation of the ecosystem all farmed animals.
The obtained value for the Exploitation of the ecosystem all farmed animals is compared with the value given for the Ecosystem’s’ carrying capacity with the delay of 1 year. In the situation when the Distance to carrying capacity is zero, the policy measures are initiated. These policy measures do allow an increase in the number of animals in farms only using the improvements in the productivity of animals’ production. Please see in the Supplementary Materials Figures S1 and S2 that there is a “shortcut” of the variable Distance to carrying capacity in the pigs’ and cows’ production submodels, that regulates these dynamics in the model, and creates a closed-loop.
2.8. Validation and Sensitivity Analysis
The model is validated by applying three different tests: Structural validation, behavioral validation, and historical validation. During structural validation, the reasonability of the structure and elements of the model was tested. Behavioral validation tests the adequacy of the model’s structure, including equations and model behavior under extreme values [14]. Finally, historical validation compares the simulated values of major variables with the historical reported values of these variables. To have a qualitative measure for the historical validation (fit between simulation and historical data), mean absolute percentage error (MAPE) statistics were used; see Equation (2).
where Hi is historical value, and Mi is modelled value or value obtained in the simulation model, and n is the number of data points.
Sensitivity analysis was done on the auxiliary variables to see which of these variables influence the system and what is the magnitude of this influence. For sensitivity analysis, a risk assessment tool integrated into the PowerSim Studio 10 software was used. The Latin Hypercube method was used to model the variances within the chosen variables under the normal distribution of the existing values.
The structural and behavioral validation tests were passed successfully, i.e., the validation indicated that the model is capable of generating the desired right behavior for the right reasons. The summary of historically validated variables with the mean absolute percentage error (MAPE) results is given in Table 2.
Since all tested variables using historical validation showed the value of MAPE < 10%, this model was proven to be valid for the intended use. Please consider that the SD models aim not to give a “point” predictions but to show the patterns of the dynamic behavior of the system under various conditions [14]. Thereof, the model can be considered as reliable and used for scenario development.
3. Results and Discussion
3.1. Analysis of the Reference Scenario
The reference scenario shows the system’s behavior for the variable Exploitation of ecosystem (variable schematically shown in Figure 2 and Figure 3), given as LSU-N per hectare, for the next 30 years under the initial set of data and without any policy intervention, see Figure 5.
The major driving force is the demand for animal products that keeps on increasing the number of farmed animals in the country. The results show a decline in the exploitation of the ecosystem in conventional pigs’ production since more piglets are expected to be exported. Nevertheless, the exploitation of the ecosystem due to other types of farming animals is projected to increase, reaching and exceeding the defined ecosystems’ carrying capacity, expressed as almost 2.0 LSU-N per hectare by 2050. The exploitation of the ecosystem for conventionally farmed pigs reduces from 0.41 LSU-N/ha in 2025 to 0.39 LSU-N/ha in 2050, for conventionally farmed cows increases from 0.52 LSU-N/ha in 2025 to 0.73 LSU-N/ha in 2050, and for remaining farmed animals increases from 0.30 LSU-N/ha in 2025 to 0.82 LSU-N/ha in 2050.
3.2. Analysis of the Carrying Capacity Scenario
The defined boundary for carrying capacity of 1.4 LSU-N per ha is reached between 2030 and 2035. The results presented in Figure 6 give the breakdown for the exploitation of the ecosystem (LSU-N per hectare) for various types of farmed animals, and Figure 7 presents the effects on pigs’ production, cows’ production, soy import, and agriculture land use.
As shown in Figure 6, the exploitation of the ecosystem for conventionally farmed pigs reduces from 0.41 LSU-N/ha in 2025 to 0.38 LSU-N/ha in 2050, for conventionally farmed cows increases from 0.52 LSU-N/ha in 2025 to 0.67 LSU-N/ha in 2050, and for remaining farmed animals increases from 0.30 LSU-N/ha in 2025 to 0.53 LSU-N/ha in 2050. The total value for the exploitation of the ecosystem proceeds to increase from 1.24 LSU-N/ha in 2025 up to 1.58 LSU-N/ha in 2050 even when the production of animals is not allowed to expand in absolute numbers (given in Figure 7a,b). The reason for increasing the exploitation of the ecosystem even after introducing the policy actions is because the variable of the exploitation of the ecosystem (LSU-N/ha) is defined by two variables—number of animals and the land area. As a result of the Danish land management policy, the agriculture land area in Denmark is projected to decline (see Figure 7d). Therefore, the defined carrying capacity of 1.4 LSU-N/ha is reached and then exceeded even in the case when the absolute number of animals is kept stable. The results show the tendency when the reduction of the area available for expansion of agricultural practice puts more pressure on the area already used for agriculture practice.
These findings of reaching the carrying capacity in the agriculture sector and the need for policy tool intervention is in agreement with the work done by Dace et al. [15]. The authors used the SD model to analyze the development of the agriculture sector in Latvia. They found that the increase of welfare stimulates the demand for agriculture products, thus larger area of agricultural land is needed to cover the demand. Due to subsidies to farmers, the land of conventional farming practices is increased, thus increasing the use of fertilizers applied to the soil. Use of fertilizers increased greenhouse gas emissions and nitrogen leaching. To counterbalance this problem, policymakers need to introduce various policy tools regarding pollution prevention and control [15].
The results of our model show that assuming the current trendlines are extrapolated, the export of piglets will increase further, and thus the number of weaners will decline (see Figure 7a). The observed behavior of the piglets’ production system changes the amount and composition of the feed demanded by this sector. Thus, there is declining demand for imported soybean meal (see Figure 7c) and also declining demand for local feed that results in the declining area needed for the feed production (see Figure 7d). This relationship shows how interlinked the production system in agriculture is and how changes in one sector can trigger a cascade of changes in other related industries. Further projections have great importance concerning biorefineries. The further projections of the capacity of biorefineries needed to cover the protein demand for the pigs’ production system might differ if the constant of changing demand for piglets’ export is projected. Therefore, the SD model is, in this case, a valuable tool for policy planning. The developed model can aid to better match the further demand for animal-grade protein and consequently plan and allocate with higher accuracy land area needed and the capacity for installations of future biorefineries.
The results also show that in the case of Denmark, substituting the growing number of weaners with the export of piglets might reduce pressure on agriculture land in Denmark for feed production. Also, the increasing rate of piglets export might reduce the competition between dairy and pig farms on manure application on fields and reduce the need in the future to consider the possibility to export the excess amount of manure [24].
3.3. Analysis of the Biorefineries’ Scenario
Analysis of the policy scenario shows the introduction of biorefineries to produce local green protein and to replace the soy within the carrying capacity limits. The projected demand for the animal-grade protein taken from the policy scenario for carrying capacity that shows the development of pigs’ and cows’ production within the defined carrying capacity of 1.4 LSU-N/ha (see Figure 6). Firstly, the amount of agricultural land needed to substitute all demand for soy import is given in Figure 8, as blue lines. Secondly, the available land area that can be transformed into the production of green protein from alfalfa after the year 2025 is modeled, and results are also given in Figure 8, as green lines.
As Figure 8 shows, the total area of managed agricultural land in Denmark is projected to decline following the historical trendlines for the period of 2009–2018 [41]. The figure shows a yellow line representing the modeled total land demand for animal feed for cows and pigs. The three lines in blue show the demand for the land resources to cover all soy demand for cows and pigs in Denmark using various conversion efficiencies in biorefineries (given as η BR) of the alfalfa to animal-grade protein. The light blue line shows the area demanded using conversion efficiency of 40.5%, according to the research done by Corona et al. [3] for the Danish case study. In personal communication with the researchers, it was acquired that current state-of-the-art conversion efficiency on the laboratory scale has reached around 50%. The difference between land area required in the case of protein extraction efficiency increase from 40.5% up to 50% is shown in the gap between the two light blue dashed lines. Finally, the dark blue line models the learning curve for efficiency improvements. In this case, the projected protein extraction efficiency grows following logarithmic function with an initial efficiency of 35% in 2010 and converges towards the efficiency of 60% by 2050.
Figure 8 also shows that almost the same amount of land already used for animals feed will be required to cover all demand for protein using green biorefineries. Since there is no unused agriculture area available to double the required land demand for animal feed, the scenario where two types of currently used agriculture land will be converted to the production of alfalfa and consequentially animal-grade protein through green biorefinery was studied. The first type of land that was assumed for this conversion is agricultural land currently used for grass silage and grazing of animals in cows’ production model. The second type of land considered is the land that might be “cleared” due to the reduced demand for feed in the pigs’ production. This “cleared” land is a land that now is used to supply feed for pigs’ production but will not be required anymore when the demand for feed reduces (see Figure 8, yellow line). The simulation model assumes that the introduction of green biorefineries starts from the year 2025. The green lines in Figure 8 present the simulation results obtained.
It can be seen in Figure 8 that the area available for alfalfa due to the conversion of grassland is comparable with the potential to convert cropland. The cropland area available for the conversion is obtained as the land that would not be needed anymore for the pigs’ feed production due to the increase of piglets’ export. Since more piglets are exported, fewer slaughter pigs are kept at farms, and thus the demand for feed in pigs’ production reduces.
If the obtained tons of dry matter (t DM) of alfalfa is expressed as the share of covered demand for animal-grade protein in Denmark, then by the year 2050, alfalfa biorefineries supply 30.8% of the projected demand for the animal-grade protein (18.2% from grassland conversion and 12.7% from cropland conversion). Thus, to cover all demand for the animal-grade protein in 2050 (assuming the biorefineries conversion efficiency reached 60% by 2050 or using the so-called learning curve scenario in Figure 8), around 850,000 ha would be required (dark blue line in Figure 8), while about 260,000 ha would be available to grow the feedstock for biorefineries (dark green line in Figure 8). These findings are in agreement with the estimates by Gylling et al. [44] that biorefineries will replace the crop used for feed, and these proportions are in the range of 10–15%.
If the obtained results for the area available for alfalfa are converted into t DM, by the year 2050, around 3.15 million t DM of alfalfa will be available. These approximately 3 million t DM correspond with half of the area under conversion from cereals to grass studied by the Odgaard et al. [45]. The authors concluded that the targeted conversion of most sensitive areas could reduce the costal N load by 66%.
One of the arguments for using alfalfa biorefineries is the conversion of land areas that can store less carbon than alfalfa, for example, cereals [3]. The study by Little et al. [46] show that from the perspective of soil carbon sequestration, alfalfa outperforms corn silage. Also, Hermansen et al. [29] point out that environmental benefits in converting fields to perennial crops include increased amounts of carbon storage in soils. Thus, the area converted from cropland to alfalfa (given with dashed green line in Figure 8) is used to calculate the soil carbon gains for the period of 2025–2050. Two types of methodologies are compared—temporal soil carbon gains and constant soil carbon gains.
For the calculation of temporal soil carbon gains, the equation given in the Materials and Methods sections from work by Mortenson et al. [12] was used (see Figure 9a,b). For the calculation applying the constant carbon gains, a range between 2 t C and 4 t C sequestration per ha annually was used in the calculation (see Figure 9b).
As can be seen from Figure 9a, each curve (light green) shows the annual soil carbon gains, and these gains have a distinct decay line. This decay line is obtained from the experimental work by Mortenson et al. [12] and shows how soil carbon gains decrease non-linearly each year. Additional land area is projected to be converted from cropland to alfalfa; therefore, the soil’s ability to sequester carbon adds annually to the soil’s ability built before (there is the new curve “on top” of the curve for the previous year). These annual individual curves are added together to create cumulative soil carbon gains using alfalfa.
As can be seen in Figure 9b, the soil carbon gains estimated by using the decay function are of different magnitude and nature in comparison to the use of constant value. The results obtained from the dynamic sustainability assessment tool show a more precise and less optimistic projection of future development than the assessment using constant soil carbon modelling values only. The study, therefore, suggests that the use of the temporal aspects in the sustainability assessment should be included and further developed. These findings are in agreement with various works using temporal aspects in modelling, such as by Levasseur et al. [9], by Petersen et al. [10], by Shimako et al. [47], by Timma et al. [48], and by Timma et al. [49]. The attribution of some constant value is arbitrary and strongly depends on the chosen time frame, as found in the research on the decay of greenhouse gas emissions [50].
3.4. Sensitivity Analysis
The results for the sensitivity analysis are given in Figure 10. The sensitivity analysis was done in total for 10 assumed auxiliary variables in the model: (1) Agriculture land decrease rate; the productivity of the pigs’ production expressed as (2) the productivity target and (3) the time needed to reach this target; the dynamics for piglets’ export determined as (4) the target to the exported share of piglets and (5) the time required to achieve this target; (6) the projected demand for piglets; (7) the projected demand for dairy cows; (8) the projected demand for other livestock, and the productivity of the biorefineries expressed as (9) the efficiency alfalfa conversion to animal-grade protein, and (10) the time needed to achieve the projected efficiency. Figure 10 shows how the variance in all of these tested parameters simultaneously affects the results obtained for the variables shown in Figure 8 for the biorefineries’ scenario.
Figure 10 shows that the sensitivity of the value for the variable of the area of managed agriculture land is 3.5% of average value at the upper 90 percentile of confidence and −3.4% of average value at the lower 10 percentile of confidence. The sensitivity of the area needed for protein at the biorefinery (BR) learning curve, the total land demand for animal feed, and the sum of the area of alfalfa available were, accordingly, 15.8% and −15.1%, 9.4% and −9.4%, and 10.8% and −10.7%.
The obtained results are most sensitive to the changes in the dynamics for piglets’ export and the productivity of the biorefineries. As can be seen from the trendlines for the variables under different percentiles, the developed model is robust and shows variability quite symmetrical form the average values with increasing uncertainty level in the future. The parameters given in Figure 10 have variability within the confidence level of 90% in the 30 years of the further prediction within boundaries of 20% uncertainty, which is assumed to be a reasonable confidence level for the intended use of the model.
The results given for the case study of Denmark can be seen from various dimensions. Firstly, as the future prediction for Danish agriculture development, as already shown in the paper. Secondly, the changes in Danish agriculture system can be viewed as a trigger for changes in other linked system on various scales. For example, livestock production in Denmark relies on the import of soy but also leads to the export of dairy and pork products. Nevertheless, the scope of this work was not to study the effect of Danish agriculture system on the global agriculture market but to test the proposed methodology on the case study. Such cascading effects can be used as a base for further research.
Lastly, we invite the researchers to look on this case study as “playground” and to substitute given case study system with any other agriculture system and carry out similar research on a local, regional, or global scale. The major given relationships and major conclusions will be valid for numerous of other similar systems; thus, we see our research as a top-down approach, when carrying capacity of natural ecosystems is defined and within these boundaries’ optimization is done. Similar studies on other systems is of great importance towards a better understanding of the current situation and measures needed for long term sustainability.
3.5. Concluding Remarks on the Ecosystem’s Sustainability
Besides environmental sustainability, the introduction of the biorefineries might have various positive aspects in the agriculture sector. The introduction of biorefineries will require highly skilled personnel and will create more workspaces. This know-how might also become a good source of the knowledge-based export commodity to other countries. Such reasoning is in agreement with research done by Stern et al. [7] on European pulp and paper industry. The authors found that biorefineries will positively affect the competitiveness of this sector. Impacts of biorefineries on employment have shown a very high positive aspect, firstly, by creating new jobs in forest-based industries, secondly, by securing the current workspaces, and finally, by creating additional positions in related industries such as construction and engineering. Finally, the results have shown that the price of the final products from these forestry biorefineries may decrease and substitute imported goods. Thus, the introduction of the biorefineries can have various direct contributions towards achieving the UN Sustainable Development Goals, such as Goal 15 “Life on Land”, Goal 13 “Climate Action”, and Goal 12 “Responsible Consumption and Productions”. Moreover, it will indirectly contribute to Goal 2 “Zero Hunger”, Goal 6 “Clean Water and Sanitation, Goal 8 “Decent work and economic growth”, and Goal 9 “Industry, innovation, and infrastructure”. Similar interconnections between various Sustainable Development Goals in agriculture sector were found across multiple research papers, for example, by Kociszewski et al. [51] and Nong et al. [52].
Nevertheless, the production of green animal-grade protein should be viewed as innovation for “buying” some additional time before the carrying capacity is reached [35], see Figure 11.
In the case study of agriculture sector in Denmark, the local production of animal-grade protein from biorefineries, the improved conversion efficiency of the alfalfa to animal-grade protein, and the increase in the productivity of animals’ production will mitigate environmental pressure through innovation in the same way as schematically given in Figure 11. However, it will not provide a fundamental shift or ultimate solution to the underlying problem—demand for animal products. The same exploitation of the system dynamics is studied for the infrastructure in the cities and population growth by Bettencourt et al. [35]. The authors concluded that innovation cycles must continually accelerate to sustain the growth and to avoid stagnation or the collapse of the system.
Under increasing rates of deforestation and pressure on land from intensive biomass production, we would suggest that the solution is not in the technology alone. The way to sustainability is within changes in demand for products, lifestyle, and diet. The study by Allen et al. [53] shows that meat and dairy products provide only 18% of calories consumed by people, yet at the cost of using 83% of farmland and creating 60% of greenhouse gas emissions from agriculture. Moreover, the consumption of processed and red meat are listed as carcinogens [54]. No actions other than diet changes have such high benefits with such low costs [55]. These results ultimately translate to the need to reduce the consumption of animal-based produce, which would allow using land resources for the production of other high added value products in biorefineries, for example, biofuels for transport and energy supply, various chemical feedstock and materials for industrial applications, as well as food for people [56]. Moreover, the research is emerging on supercritical biorefineries to extract all components for high added value products such as “green” solvents [57]. Also, recovery of nitrogen, potassium, and phosphorus is reviewed as highly recommended to close the nutrient cycle, through recovering these nutrients in biorefinery and then supplying them back to land [58].
Numerous researches link agriculture produce to different ecosystem’s services and optimize these ecosystem’s services [59,60,61,62] instead of considering carrying capacity as a boundary condition and determine maximum animal production as given in this study. Moreover, the recent research by van der Werf et al. [63] summarizes current challenges for adequately representing ecosystem services in life cycle assessment methodology.
Our reasoning behind limiting the growth of animal production system within the ecosystem carrying capacity was rooted in the assumption that ecosystem services can adequately be sustained only in a system that does “work” since the collapse of the system will be occurring operating outside the set of the ecosystem’s boundaries (see Figure 11). As a case study in this paper, we focused on one particular limitation—the ecosystem’s carrying capacity expressed as the maximum number of animals per agriculture area. This specific boundary was selected because of certain factors in the studied system, such as high specialization on animal products in Danish agriculture (more detailed information is given in Section 2.2 and Section 2.3).
Nevertheless, a similar modelling approach can be adapted to study any system since there will always be carrying capacity limits in any structure. Thus, we see that our work can be an effective instrument to support other methodologies on sustainability assessments, such as life cycle assessment and studies on ecosystem services. The results of this paper highlight the importance of considering the ecosystem’s carrying capacity while modelling various ecosystem’s services.
4. Conclusions
In this paper, we presented a novel, dynamic tool where two methods are combined—temporal soil carbon modelling and system dynamics (SD), thus converting the current state-of-art sustainability assessment tool from static to dynamic. Danish agriculture and green biorefineries supply chains in Denmark were used as the case study for sustainability analysis.
The development of the Danish agriculture sector was simulated and assessed in relation to the ecosystem’s carrying capacity until 2050. These simulations were done by testing three policy scenarios. First, the reference scenario showed that under the current development, the agriculture sector would exploit the ecosystem beyond the carrying capacity shortly after 2030. Second, the scenario limiting the expansion of animal production to the level of carrying capacity indicated that the agriculture system will still exceed the carrying capacity due to development inertia and further decreasing agricultural area. Third, the biorefinery scenario tested an introduction of biorefineries within the carrying capacity limits to ensure local protein supply for animal feed instead of imported soybean meal. The results of the third scenario showed that due to the limited agricultural land area, the demand for protein could hardly be satisfied by local biorefineries, i.e., the land area available for alfalfa will be at least six times less than needed to supply protein locally. Thus, it can be concluded that other solutions will be needed to maintain the Danish animal production system within the ecosystem’s carrying capacity.
In this paper, soil carbon gains were used as an example to demonstrate the difference in obtained results between using constant and temporal soil carbon modelling values. Moreover, the variable used for impact assessment also contained time dynamics derived from the SD model, thus showing the application for the developed dynamic sustainability assessment tool. It can be concluded that this dynamic sustainability assessment tool shows a more precise and less optimistic projection of future development than the assessment using constant soil carbon modelling values only. Therefore, the use of the temporal aspects in the impact assessment should be further developed and included in sustainability assessments to yield results with the representation of processes occurring in natural ecosystems.
A similar modelling approach can be adapted to study any system on a local, regional, or global scale, since the major given relationships and major conclusions will be valid for numerous of other similar systems. The results of this paper highlight the importance of considering the ecosystem’s carrying capacity while modelling various ecosystem’s services.
Supplementary Materials
The following are available online at https://www.mdpi.com/2071-1050/12/18/7389/s1, Figure S1: Stock and flow diagram for the submodel of the conventional pig farm, Figure S2: Stock and flow diagram for the submodel of a conventional dairy farm, Figure S3: Stock and flow diagram for the submodel of a conventional bull fattening farm Table S1: Assumed values for auxiliary variables in pigs’ production submodel, Table S2. Equations used in the pigs’ production submodel, Table S3. Assumed values for auxiliary variables in cows’ production submodel, Table S4. Equations used in the cows’ production submodel.
Author Contributions
Conceptualization, L.T., E.D., T.K., and M.T.K.; methodology, L.T.; software, L.T. and E.D.; validation, L.T. and E.D.; formal analysis, L.T., E.D., T.K., and M.T.K.; investigation, L.T.; resources, L.T., E.D., and M.T.K.; data curation, L.T., T.K., and M.T.K.; writing—original draft preparation, L.T.; writing—review and editing, L.T., E.D., T.K., and M.T.K.; visualization, L.T.; supervision, M.T.K.; project administration, L.T., M.T.K.; funding acquisition, L.T. All authors have read and agreed to the published version of the manuscript.
Funding
This research was funded by European Union’s Horizon 2020 research and innovation programme under the Marie Sklodowska-Curie grant agreement No 798365. Contribution of E. Dace to this study was supported by the ERDF Post-doc project No.1.1.1.2/VIAA/3/19/528 “Decision Support Tool for an Integrated Food Waste Valorisation System (DeSTInation)”. The revision by L. Timma was supported by the ERDF Post-doc project 1.1.1.2/VIAA/3/19/520 “Holistic computing within socio-technical systems to design energy efficiency policy tool (HOTSPOT)”.
Acknowledgments
The authors are expressing big and hearty “thank you” to Heidi Mai-Lis Andersen for sharing her expert knowledge during the elaboration of the model. The idea of this paper in the form of one-page abstract and a short publication was selected for presentation in the European Biomass Conference and Exhibition (EUBCE) 2020 conference, which is rescheduled on 6–9 July 2020.
Conflicts of Interest
The authors declare no conflict of interest. The funders had no role in the design of the study; in the collection, analyses, or interpretation of data; in the writing of the manuscript, or in the decision to publish the results.
References
- UN About the Sustainable Development Goals-United Nations Sustainable Development. Available online: https://www.un.org/sustainabledevelopment/sustainable-development-goals/ (accessed on 10 March 2020).
- I.E.A. Bioenergy Task 42. 2009. Available online: http://www.globalbioenergy.org/uploads/media/0909_IEA_Bioenergy_-_Biorefineries_adding_value_to_the_sustainable_utilisation_of_biomass.pdf (accessed on 10 March 2020).
- Corona, A.; Ambye-Jensen, M.; Vega, G.C.; Hauschild, M.Z.; Birkved, M. Techno-environmental assessment of the green biorefinery concept: Combining process simulation and life cycle assessment at an early design stage. Sci. Total Environ. 2018, 635, 100–111. [Google Scholar] [CrossRef]
- Ahlgren, S.; Björklund, A.; Ekman, A.; Karlsson, H.; Berlin, J.; Börjesson, P.; Ekvall, T.; Finnveden, G.; Janssen, M.; Strid, I. Review of methodological choices in LCA of biorefinery systems-key issues and recommendations. Biofuels Bioprod. Bioref. 2015, 9, 606–619. [Google Scholar] [CrossRef] [Green Version]
- Bernstad Saraiva, A. System boundary setting in life cycle assessment of biorefineries: A review. Int. J. Environ. Sci. Technol. 2017, 14, 435–452. [Google Scholar] [CrossRef]
- Julio, R.; Albet, J.; Vialle, C.; Vaca-Garcia, C.; Sablayrolles, C. Sustainable design of biorefinery processes: Existing practices and new methodology. Biofuels Bioprod. Biorefin. 2017, 11, 373–395. [Google Scholar] [CrossRef] [Green Version]
- Stern, T.; Ledl, C.; Braun, M.; Hesser, F.; Schwarzbauer, P. Biorefineries’ impacts on the Austrian forest sector: A system dynamics approach. Technol. Forecast. Soc. Chang. 2015, 91, 311–326. [Google Scholar] [CrossRef]
- Hansen, J.; Jacobson, J.; Roni, M. Quantifying Supply Risk at a Cellulosic Biorefinery. In Proceedings of the International Conference of the System Dynamics Society, Cambridge, MA, USA, 19–23 July 2015; p. 25. [Google Scholar]
- Levasseur, A.; Lesage, P.; Margni, M.; Deschěnes, L.; Samson, R. Considering time in LCA: Dynamic LCA and its application to global warming impact assessments. Environ. Sci. Technol. 2010, 44, 3169–3174. [Google Scholar] [CrossRef] [PubMed]
- Petersen, B.M.; Knudsen, M.T.; Hermansen, J.E.; Halberg, N. An approach to include soil carbon changes in life cycle assessments. J. Clean. Prod. 2013, 52, 217–224. [Google Scholar] [CrossRef]
- Parajuli, R.; Knudsen, M.T.; Birkved, M.; Djomo, S.N.; Corona, A.; Dalgaard, T. Environmental impacts of producing bioethanol and biobased lactic acid from standalone and integrated biorefineries using a consequential and an attributional life cycle assessment approach. Sci. Total Environ. 2017, 598, 497–512. [Google Scholar] [CrossRef] [Green Version]
- Mortenson, M.C.; Schuman, G.E.; Ingram, L.J. Carbon sequestration in rangelands interseeded with yellow-flowering alfalfa (Medicago sativa ssp. falcata). Environ. Manag. 2004, 33, S475–S481. [Google Scholar] [CrossRef]
- Forrester, J.W. Industrial Dynamics; Pegasus Communications: Waltham, MA, USA, 1961. [Google Scholar]
- Sterman, J.D. Business Dynamics: Systems Thinking and Mmodeling for a Complex World; Irwin/McGraw-Hill: Boston, MA, USA, 2000; p. 928. [Google Scholar]
- Dace, E.; Muizniece, I.; Blumberga, A.; Kaczala, F. Searching for solutions to mitigate greenhouse gas emissions by agricultural policy decisions—Application of system dynamics modeling for the case of Latvia. Sci. Total Environ. 2015, 527–528, 80–90. [Google Scholar] [CrossRef]
- Blumberga, A. Sistēmdinamikas modelēšanas pamati/Sistēmdinamika vides inženierzinātņu studentiem; Riga Technical University: Riga, Latvia, 2010. [Google Scholar]
- Dace, E.; Bazbauers, G.; Berzina, A.; Davidsen, P.I. System dynamics model for analyzing effects of eco-design policy on packaging waste management system. Res. Conserv. Recycl. 2014, 87, 175–190. [Google Scholar] [CrossRef]
- Ye, G.; Yuan, H.; Shen, L.; Wang, H. Simulating effects of management measures on the improvement of the environmental performance of construction waste management. Res. Conserv. Recycl. 2012, 62, 56–63. [Google Scholar] [CrossRef]
- Statistics Denmark Profit and Loss Accounts for Full-Time Farms (Average) by Quartile Group, Items, Type of Farm, Annual Work Units and Time. Available online: https://www.statbank.dk/statbank55/SelectVarVal/Define.asp?Maintable=JORD2&PLanguage=1 (accessed on 10 March 2020).
- Cassidy, E.S.; West, P.C.; Gerber, J.S.; Foley, J.A. Redefining agricultural yields: From tonnes to people nourished per hectare. Environ. Res. Lett. 2013, 8, 034015. [Google Scholar] [CrossRef]
- Statistics Denmark Value of IMPORTS and exports by Imports and EXPORTS, time, Country and Main SITC Groups. Available online: https://www.statbank.dk/statbank5a/default.asp?w=1280 (accessed on 10 March 2020).
- Statistics Denmark NABB10. Employment (10a3-grouping) by Socioeconomic Status and Industry. Available online: https://www.statbank.dk/NABB10 (accessed on 10 March 2020).
- Statistics Denmark SITC2R4Y. Value of Imports and Exports (DKK 1,000) by Main SITC Groups, Country and Imports and Exports. Available online: https://www.statbank.dk/statbank5a/SelectVarVal/Define.asp?MainTable=SITC2R4Y&PLanguage=1&PXSId=0&wsid=cftree (accessed on 10 March 2020).
- Willems, J.; Van Grinsven, H.J.M.; Jacobsen, B.H.; Jensen, T.; Dalgaard, T.; Westhoek, H.; Kristensen, I.S. Why danish pig farms have far more land and pigs than Dutch farms? Implications for feed supply, manure recycling and production costs. Agric. Syst. 2016, 144, 122–132. [Google Scholar] [CrossRef]
- De Meester, S.; Callewaert, C.; De Mol, E.; Van Langenhove, H.; Dewulf, J. The resource footprint of biobased products: A key issue in the sustainable development of biorefineries. Biofuels Bioprod. Biorefin. 2011, 5, 570–580. [Google Scholar] [CrossRef]
- Gerbens-Leenes, P.W.; Nonhebel, S.; Krol, M.S. Food consumption patterns and economic growth. Increasing affluence and the use of natural resources. Appetite 2010, 55, 597–608. [Google Scholar] [CrossRef]
- Nguyen, T.L.T.; Hermansen, J.E.; Mogensen, L. Environmental Assessment of Danish Pork; Department of Agroecology, Research Centre Foulum, Aarhus University: Tjele, Denmark, 2011. [Google Scholar]
- Hermansen, J.E.; Knudsen, M.T.; Sørensen, J. Soja og Palmeolie-Certificeringsordninger til Dokumentation af Bæredygtighed i Forbindelse med Produktion; Department of Agroecology, Research Centre Foulum, Aarhus University: Tjele, Denmark, 2013. [Google Scholar]
- Hermansen, J.E.; Jørgensen, U.; Lærke, P.E.; Manevski, K.; Boelt, B.; Jensen, S.K.; Weisbjerg, M.R.; Dalsgaard, T.K.; Danielsen, M.; Asp, T.; et al. Green Biomass–Protein Production through Bio-Refining; DCA-Danish Centre for Food and Agriculture: Tjele, Denmark, 2017. [Google Scholar]
- Manevski, K.; Lærke, P.E.; Olesen, J.E.; Jørgensen, U. Nitrogen balances of innovative cropping systems for feedstock production to future biorefineries. Sci. Total Environ. 2018, 633, 372–390. [Google Scholar] [CrossRef]
- Chen, H.G.; Zhang, Y.H.P. New biorefineries and sustainable agriculture: Increased food, biofuels, and ecosystem security. Renew. Sustain. Energy Rev. 2015, 47, 117–132. [Google Scholar] [CrossRef]
- Corona, A.; Parajuli, R.; Ambye-Jensen, M.; Hauschild, M.; Birkved, M. Environmental screening of potential biomass for green biorefinery conversion. J. Clean. Prod. 2018, 189, 344–357. [Google Scholar] [CrossRef]
- Parajuli, R.; Knudsen, M.T.; Dalgaard, T. Multi-criteria assessment of yellow, green, and woody biomasses: Pre-screening of potential biomasses as feedstocks for biorefineries. Biofuels Bioprod. Biorefin. 2015, 9, 545–566. [Google Scholar] [CrossRef]
- Rockström, J.; Steffen, W.; Noone, K.; Persson, Å.; Chapin, F.S.; Lambin, E.; Lenton, T.M.; Scheffer, M.; Folke, C.; Schellnhuber, H.J.; et al. Planetary boundaries: Exploring the safe operating space for humanity. Ecol. Soc. 2009, 14, 1–33. [Google Scholar] [CrossRef]
- Bettencourt, L.M.A.; Lobo, J.; Helbing, D.; Kuhnert, C.; West, G.B. Growth, innovation, scaling, and the pace of life in cities. Proc. Natl. Acad. Sci. USA 2007, 104, 7301–7306. [Google Scholar] [CrossRef] [PubMed] [Green Version]
- Ministeriet for Fødevarer Landbrug og Fiskeri. Vejledning om Gødsknings-og h Armoniregler; Ministeriet for Fødevarer Landbrug og Fiskeri: Copenhagen, Denmark, 2015. [Google Scholar]
- Pexas, G.; Mackenzie, S.G.; Wallace, M.; Kyriazakis, I. Environmental impacts of housing conditions and manure management in European pig production systems through a life cycle perspective: A case study in Denmark. J. Clean. Prod. 2020, 253, 120005. [Google Scholar] [CrossRef]
- SEGES. Svineproduktion Landsgennemsnit for Produktivitet i Svineproduktionen 2017; SEGES Svineproduktion: Aarhus, Denmark, 2018. [Google Scholar]
- Knudsen, M.T.; Preda, T.; Njakou Djomo, S.; Valbuena, N.P.; Hermansen, J.E.; Smith, L.; Padel, S.; Hörtenhuber, S.; Zollitsch, W. SOLID Sustainable Organic and Low Input Dairying Deliverable D4.3: Assessing Environmental Impact of Low-Input and Organic Dairy Systems; Seventh Framework Programme Collaborative Project Sustainable Organic and Low-Input Dairy Production (SOLID); 2016; Available online: https://cordis.europa.eu/project/id/266367 (accessed on 10 March 2020).
- Knudsen, M.T.; Dorca-Preda, T.; Djomo, S.N.; Peña, N.; Padel, S.; Smith, L.G.; Zollitsch, W.; Hörtenhuber, S.; Hermansen, J.E. The importance of including soil carbon changes, ecotoxicity and biodiversity impacts in environmental life cycle assessments of organic and conventional milk in Western Europe. J. Clean. Prod. 2019, 215, 433–443. [Google Scholar] [CrossRef]
- Statistics Denmark AFG5: Cultivated Area by Region, Unit and Crop. Available online: https://www.statbank.dk/statbank5a/SelectVarVal/Define.asp?MainTable=AFG5&PLanguage=1&PXSId=0&wsid=cftree (accessed on 10 March 2020).
- Mogensen, L.; Hermansen, J.E.; Nguyen, L.; Preda, T. Environmental Impact of Beef by Life Cycle Assessment (LCA)–13 Danish Beef Production Systems; DCA Report No. 61; DCA-Danish Centre for Food and Agriculture: Tjele, Denmark, 2015. [Google Scholar]
- Mogensen, L.; Knudsen, M.T.; Dorca-Preda, T.; Nielsen, N.I.; Sillebak, I.; Kristensen, I.S.; Kristensen, T. Bæredygtighedsparametre for Konventionelle Fodermidler til Kvæg; DCA Rapport Nr. 116; DCA-Danish Centre for Food and Agriculture: Tjele, Denmark, 2018. [Google Scholar]
- Gylling, M.; Jørgensen, U.; Bentsen, N.S.; Kristensen, I.T.; Dalgaard, T.; Felby, C.; Larsen, S.; Johannsen, V.K. The + 10 Million Tonnes Study. Increasing the Sustainable Production of Biomass for Biorefineries, Updated Edition; DCA-Danish Centre for Food and Agriculture: Tjele, Denmark, 2016. [Google Scholar]
- Odgaard, M.V.; Knudsen, M.T.; Hermansen, J.E.; Dalgaard, T. Targeted grassland production–A Danish case study on multiple benefits from converting cereal to grasslands for green biorefinery. J. Clean. Prod. 2019, 223, 917–927. [Google Scholar] [CrossRef]
- Little, S.M.; Benchaar, C.; Janzen, H.H.; Kröbel, R.; McGeough, E.J.; Beauchemin, K.A. Demonstrating the effect of forage source on the carbon footprint of a Canadian dairy farm using whole-systems analysis and the holos model: Alfalfa silage vs. corn silage. Climate 2017, 5, 87. [Google Scholar] [CrossRef] [Green Version]
- Shimako, A.H.; Tiruta-Barna, L.; Bisinella de Faria, A.B.; Ahmadi, A.; Spérandio, M. Sensitivity analysis of temporal parameters in a dynamic LCA framework. Sci. Total Environ. 2018, 624, 1250–1262. [Google Scholar] [CrossRef]
- Timma, L.; Parajuli, R. Time Dynamics in Life Cycle Assessment-Exemplified by a Case Study on Biorefineries. In Proceedings of the European Biomass Conference and Exhibition, Lisbon, Portugal, 27–30 May 2019; pp. 1599–1603. [Google Scholar]
- Timma, L.; Dace, E.; Knudsen, M.T. Temporal aspects in emission accounting—case study of agriculture sector. Energies 2020, 13, 800. [Google Scholar] [CrossRef] [Green Version]
- Cherubini, F.; Fuglestvedt, J.; Gasser, T.; Reisinger, A.; Cavalett, O.; Huijbregts, M.A.J.; Johansson, D.J.A.; Jørgensen, S.V.; Raugei, M.; Schivley, G.; et al. Bridging the gap between impact assessment methods and climate science. Environ. Sci. Policy 2016, 64, 129–140. [Google Scholar] [CrossRef] [Green Version]
- Kociszewski, K.; Graczyk, A.; Mazurek-Łopacinska, K.; Sobocińska, M. Social values in stimulating organic production involvement in farming—the case of Poland. Sustainability 2020, 12, 5945. [Google Scholar] [CrossRef]
- Nong, Y.; Yin, C.; Yi, X.; Ren, J.; Chien, H. Farmers’ adoption preferences for sustainable agriculture practices in northwest China. Sustainability 2020, 12, 6269. [Google Scholar] [CrossRef]
- Poore, J.; Nemecek, T. Reducing food’s environmental impacts through producers and consumers. Science 2018, 360, 987–992. [Google Scholar] [CrossRef] [PubMed] [Green Version]
- American Cancer Society. Known human carcinogens. International Agency for Research on Cancer Group 1: Carcinogenic to Humans. Available online: https://www.cancer.org/cancer/cancer-causes/general-info/known-and-probable-human-carcinogens.html (accessed on 11 March 2020).
- Springmann, M.; Godfray, H.C.J.; Rayner, M.; Scarborough, P. Analysis and valuation of the health and climate change cobenefits of dietary change. Proc. Natl. Acad. Sci. USA 2016, 113, 4146–4151. [Google Scholar] [CrossRef] [PubMed] [Green Version]
- Budzianowski, W.M.; Postawa, K. Total Chain Integration of sustainable biorefinery systems. Appl. Energy 2016, 184, 1432–1446. [Google Scholar] [CrossRef]
- Herrero, M.; Ibañez, E. Green extraction processes, biorefineries and sustainability: Recovery of high added-value products from natural sources. J. Supercrit. Fluids 2018, 134, 252–259. [Google Scholar] [CrossRef] [Green Version]
- Carey, D.E.; Yang, Y.; McNamara, P.J.; Mayer, B.K. Recovery of agricultural nutrients from biorefineries. Biores. Technol. 2016, 215, 186–198. [Google Scholar] [CrossRef] [Green Version]
- Sollen-Norrlin, M.; Ghaley, B.B.; Rintoul, N.L.J. Agroforestry benefits and challenges for adoption in Europe and beyond. Sustainability 2020, 12, 7001. [Google Scholar]
- Mamine, F.; Farès, M. Barriers and levers to developing wheat–pea intercropping in Europe: A review. Sustainability 2020, 12, 6962. [Google Scholar]
- Ortiz, J.; Dube, F.; Neira, P.; Panichini, M.; Stolpe, N.B.; Zagal, E.; Martínez-Hernández, P.A. Soil quality changes within a (Nothofagus obliqua) forest under silvopastoral management in the Andes Mountain Range, South Central Chile. Sustainability 2020, 12, 6815. [Google Scholar] [CrossRef]
- Sheppard, J.P.; Bohn Reckziegel, R.; Borrass, L.; Chirwa, P.W.; Cuaranhua, C.J.; Hassler, S.K.; Hoffmeister, S.; Kestel, F.; Maier, R.; Mälicke, M.; et al. Agroforestry: An appropriate and sustainable response to a changing climate in southern Africa? Sustainability 2020, 12, 6796. [Google Scholar] [CrossRef]
- van der Werf, H.M.G.; Knudsen, M.T.; Cederberg, C. Towards better representation of organic agriculture in life cycle assessment. Nat. Sustain. 2020, 3, 419–425. [Google Scholar] [CrossRef]
Figure 1.
(a) Causal loop diagram, and (b) the stock and flow diagram for novel product diffusion into the market [14].
Figure 1.
(a) Causal loop diagram, and (b) the stock and flow diagram for novel product diffusion into the market [14].

Figure 2.
Representation of the exploitation of the ecosystem reaching the ecosystem’s carrying capacity, degradation of the planetary boundary, and exceeding the threshold. Figure adapted from Rockström et al. [34], Bettencourt et al. [35], and Sterman [14].

Figure 3.
Causal loop diagram for the developed model (exogenous variables depicted in black).
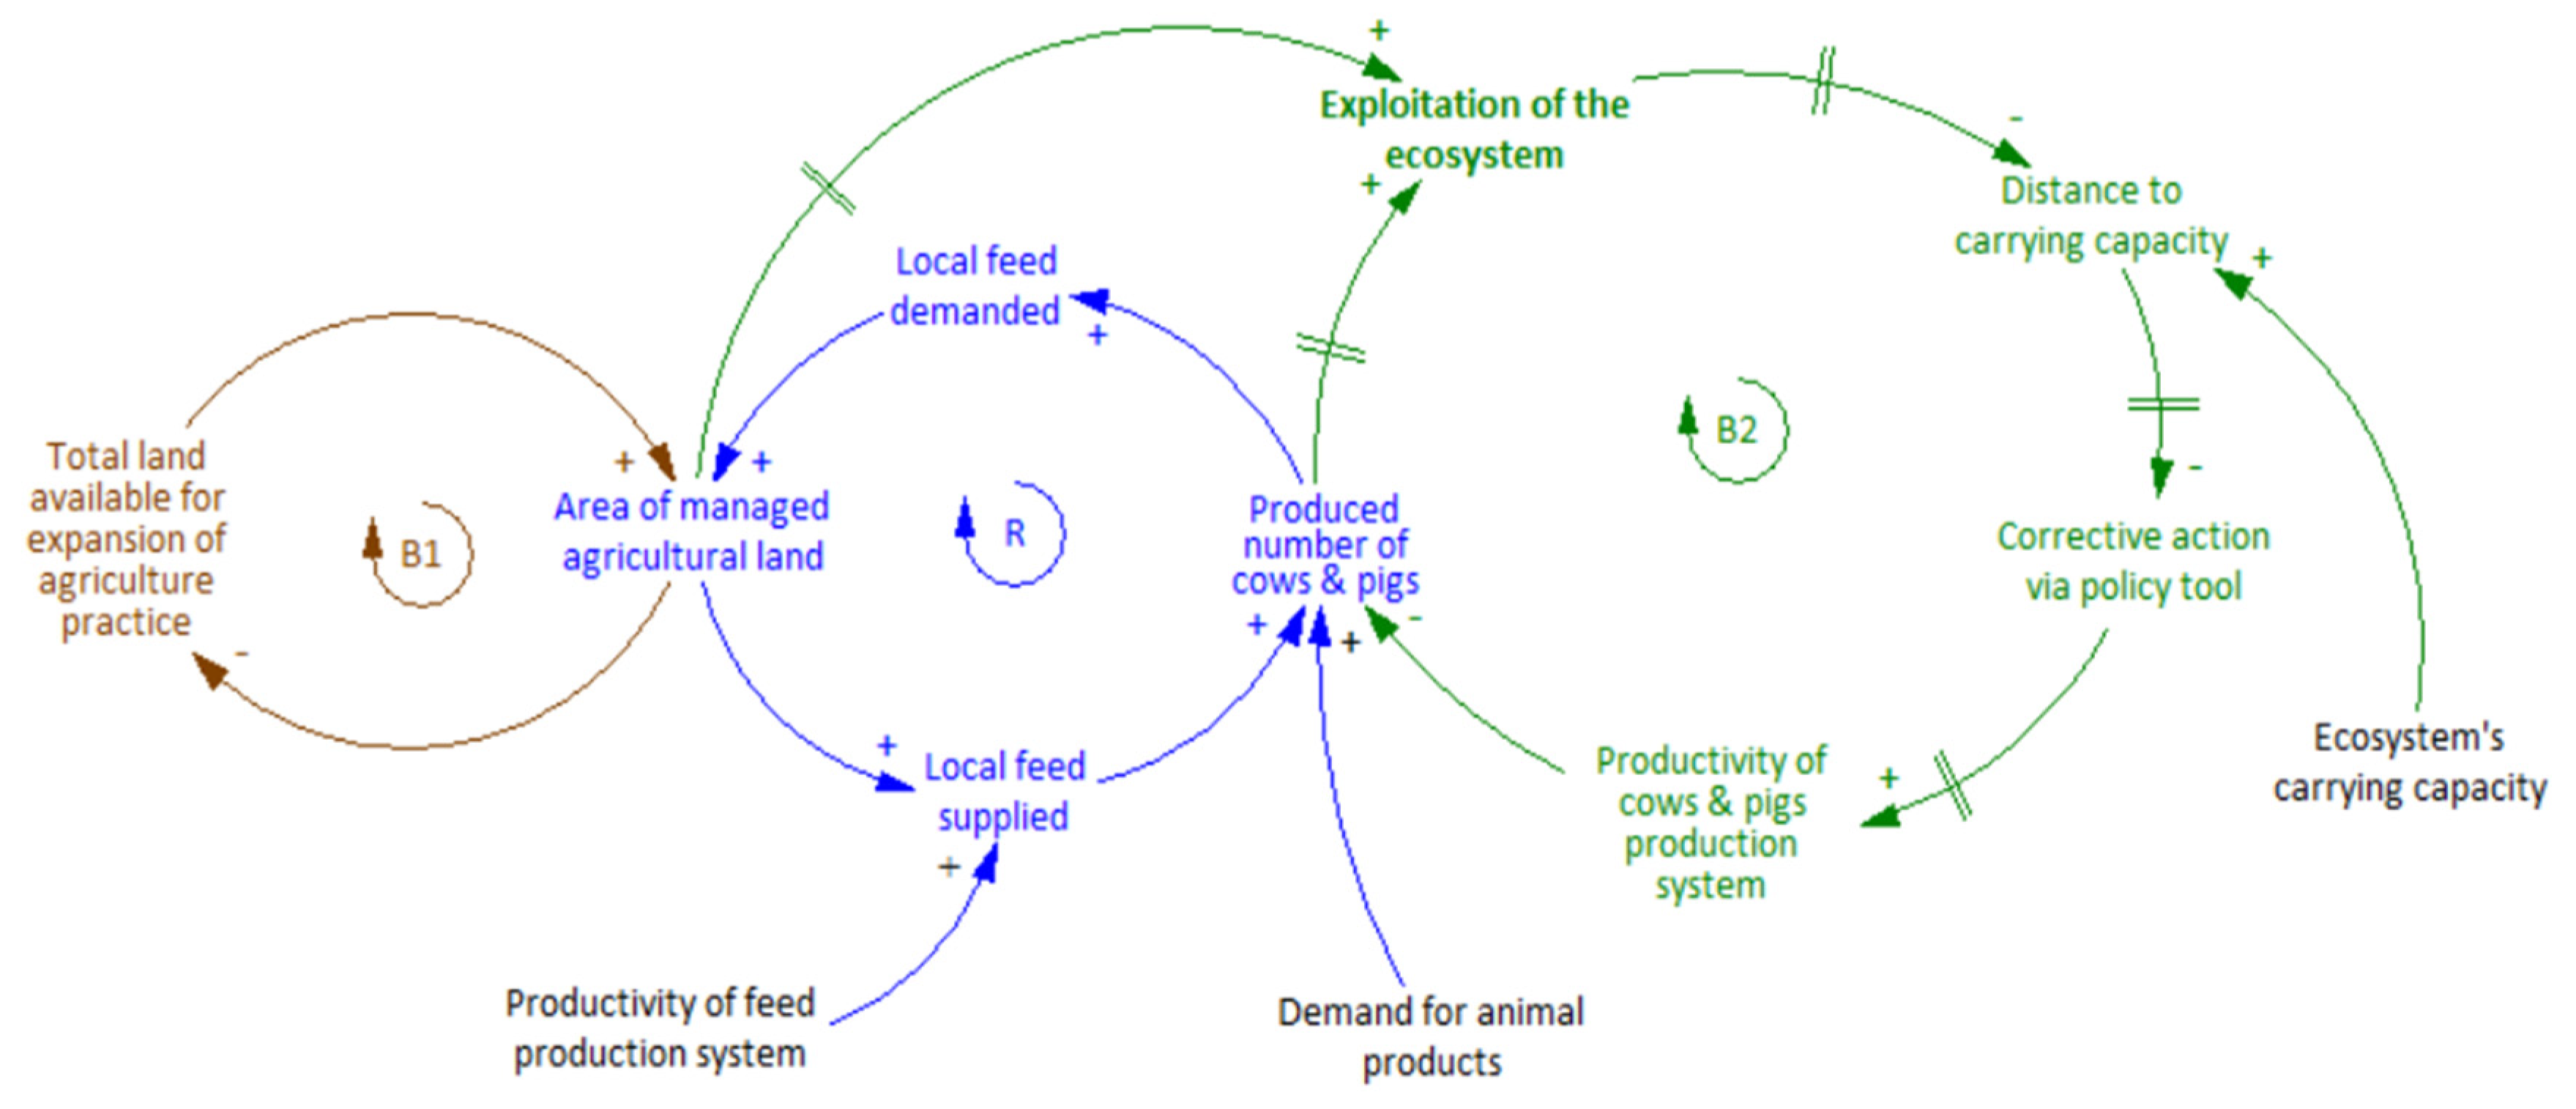
Figure 4.
Stock and flow diagram for the ecosystem’s carrying capacity (variables given in color match variables presented in Figure 5 and Figure 6).

Figure 5.
Results of the reference scenario in livestock density (LSU-N per hectare) used as an indicator for the exploitation of the ecosystem, annual results.
Figure 5.
Results of the reference scenario in livestock density (LSU-N per hectare) used as an indicator for the exploitation of the ecosystem, annual results.

Figure 6.
Results of the carrying capacity scenario in livestock density (LSU-N per hectare) used as an indicator for the exploitation of the ecosystem, annual results.
Figure 6.
Results of the carrying capacity scenario in livestock density (LSU-N per hectare) used as an indicator for the exploitation of the ecosystem, annual results.

Figure 7.
The effect of the policy scenario for the exploitation of the ecosystem within the defined carrying capacity on (a) pigs’ production, (b) cows’ production, (c) soy import, (d) agriculture land use until 2050, annual results.
Figure 7.
The effect of the policy scenario for the exploitation of the ecosystem within the defined carrying capacity on (a) pigs’ production, (b) cows’ production, (c) soy import, (d) agriculture land use until 2050, annual results.

Figure 8.
The effect of a policy scenario introducing biorefineries to produce local green protein from alfalfa on land needed to cover the protein demand until 2050, where η BR is the conversion efficiency of alfalfa to animal-grade protein in biorefineries, annual results.
Figure 8.
The effect of a policy scenario introducing biorefineries to produce local green protein from alfalfa on land needed to cover the protein demand until 2050, where η BR is the conversion efficiency of alfalfa to animal-grade protein in biorefineries, annual results.

Figure 9.
Soil carbon gains for the cropland converted in biorefineries scenario (a) using temporal soil carbon gains approach; (b) the comparison between temporal soil carbon gains and constant soil carbon gains, cumulative annual results.
Figure 9.
Soil carbon gains for the cropland converted in biorefineries scenario (a) using temporal soil carbon gains approach; (b) the comparison between temporal soil carbon gains and constant soil carbon gains, cumulative annual results.

Figure 10.
Sensitivity analysis for the change in the auxiliary variables and the effect on results for the policy scenario of introducing biorefineries to produce local green protein from alfalfa, annual results.
Figure 10.
Sensitivity analysis for the change in the auxiliary variables and the effect on results for the policy scenario of introducing biorefineries to produce local green protein from alfalfa, annual results.

Figure 11.
Representation of (a) the effect of innovation on the response variable, (b) the exploitation of the ecosystem reaching the ecosystem’s carrying capacity after several innovations. Figure adapted from Rockström et al. [34], Bettencourt et al. [35], and Sterman [14].


Table 1.
Livestock unit nitrogen (LSU-N) for animals used in the model [36].
Table 1.
Livestock unit nitrogen (LSU-N) for animals used in the model [36].
| Type of Livestock | Annual Animals per LSU-N |
|---|---|
| Dairy cows | 0.75 |
| Heifers | 2.38 |
| Sow with piglets | 4.4 |
| Piglets | 208 |
| Slaughter pigs | 39 |
Table 2.
Historical validation using a mean absolute percentage error (MAPE).
| Historically Validated Variable in the Model | MAPE, % |
|---|---|
| Cows, animals | 0.51 |
| Sows, animals | 0.29 |
| Livestock density, LSU-N/ha | 3.99 |
| Area of managed agricultural land, ha | 3.49 |
© 2020 by the authors. Licensee MDPI, Basel, Switzerland. This article is an open access article distributed under the terms and conditions of the Creative Commons Attribution (CC BY) license (http://creativecommons.org/licenses/by/4.0/).
Share and Cite
MDPI and ACS Style
Timma, L.; Dace, E.; Kristensen, T.; Trydeman Knudsen, M. Dynamic Sustainability Assessment Tool: Case Study of Green Biorefineries in Danish Agriculture. Sustainability 2020, 12, 7389. https://doi.org/10.3390/su12187389
AMA Style
Timma L, Dace E, Kristensen T, Trydeman Knudsen M. Dynamic Sustainability Assessment Tool: Case Study of Green Biorefineries in Danish Agriculture. Sustainability. 2020; 12(18):7389. https://doi.org/10.3390/su12187389
Chicago/Turabian StyleTimma, Lelde, Elina Dace, Troels Kristensen, and Marie Trydeman Knudsen. 2020. "Dynamic Sustainability Assessment Tool: Case Study of Green Biorefineries in Danish Agriculture" Sustainability 12, no. 18: 7389. https://doi.org/10.3390/su12187389
Note that from the first issue of 2016, this journal uses article numbers instead of page numbers. See further details here.