1. Introduction
The need for sustained energy demand and availability of solar resources led countries to establish large distributed energy systems to secure energy requirements. The photovoltaic grid-connected system (PVGCS) under study was the demonstration project in Ethiopia installed in October 2010/11 GC at Bahir Dar University located 578 km northwest of the capital city Addis Ababa. Ethiopia has already implemented a PVGCS at Bahir Dar University and different standalone systems in rural areas, where it is located in the eastern part of Africa between 3° to 15° north and 33° to 48° east, has abundant solar energy resources.
Since Ethiopia is located near the equator, it has significant potential to use solar energy. The national annual average irradiance is estimated to be 5.2 kWh/m
2/day with seasonal variations that range between the minimum of 4.5 kWh/m
2/day in July to a maximum of 5.9 kWh/m
2/day in March. Though its size is smaller than average, the installed 10kWp PVGCS system under study was the first installed photovoltaic (PV) plant in the country used as a milestone with objectives of establishing a small scale center of excellence in renewable technologies, organizing and providing teaching facilities for undergraduate (UG) and postgraduate (PG) students, and supporting researchers in data registry and system analysis. Besides, this plant aimed to encourage the national strategy for the country to begin the launching and utilization of renewable energy technologies and energy efficiency programs planning for the installation of thousands of megawatt photovoltaic (PV) plants [
1]. The country is currently trying to establish a vast system of 100-Megawatt PV plants in one of the regions called “Methehara” with the company group called Enel [
2]. The grid-connected photovoltaic system under study was installed and has been functional since October 2010. The PVGCS plant was mounted to supply power for the local load and fed excess energy to the grid, providing 4.5–5 kW of power to the commercial loads, and the remaining 5kW is fed to a nearby university’s utility network. The existing PVGCS consists of a total of 56 Webel Solar W1750 PV modules (each representing 180 W) [
3], 24 cells connected in series with a total of 48 V of battery storage, and a charge controller. Renewable energy sources connected to the utility network need proper evaluation of their performance, as they impose perturbations on the grid due to their intermittent nature. Researchers mentioned in
Section 2 assessed the performance of grid-connected photovoltaic plants and therefore their negative and positive impacts on the grid, while factors which affect their performance were also studied. In addition to the technical performance analysis of the PV system, the plants’ economics was also studied. The economic performance evaluation of a building-integrated PV (BIPV) system installed with battery energy storage was conducted in a south Norwegian house for evaluating its contribution to minimizing the annualized energy cost and showed that a BIPV system with energy storage is cost effective with a levelized cost of energy (LCOE) of 0.439 NOK/kWh [
4]. A feasibility assessment of PVGCS systems for residential buildings in Saudi Arabia was conducted while considering its techno-economic viability, and found that the systems were feasible with a levelized cost of energy of 0.0382
$/kWh and a net present value of
$4378 [
5]. A techno-economic evaluation of PVGCS for households was performed with a feed-in tariff and time of day tariff technique using a hybrid optimization model for electric renewables (HOMER) [
6], and the result indicates that the NPC and COE approach zero for low range household consumption with a BIPV application. In [
7], Chiacchio et al. proposed a model-based approach to analyze the techno-economic feasibility of grid-connected PV power plants using ambient variables and stochastic hybrid fault tree automation as input variables and the system was evaluated using the net present value and the payback time. Hoppmann et al. [
8] studied the economic viability of integrating battery storage with small scale PV plants for residential applications. Techno-economic based simulation was utilized for evaluating the profitability of battery storage integrated with PV systems. The net present value as a function of storage and PV system size for different electricity scenarios was evaluated, which showed the use of battery energy storage was economically viable. Nge et al. [
9] proposed a method for maximizing revenue over a given period. A real-time based energy management system connected with the smart grid was used and focused on a reactive real-time control mechanism. The simulation of the system considered the days and solar irradiance profiles as input variables. Liu et al. [
10] conducted an optimization of photovoltaic system connected with battery energy storage and electric vehicle charging stations. The method utilized a cumulative prospect theory and particle swarm optimization algorithm to determine an optimal photovoltaic/battery energy storage/electric vehicle charging stations (PBES) system. Besides the optimization of PV plants, D’Adamo et al. [
11] studied the economic viability of PV plants installed in public buildings using a discounted cash flow methodology. With this method, input variables of the insolation level, plant size, self-consumption share, and electricity purchase price were identified and accordingly the net present value and payback time periods were estimated. In addition to these variables, the grid-connected PV systems operation performance also depended on the climatic condition, orientation, and inclination of the installed PV array, load profile, and inverter efficiency [
12,
13,
14] where these factors were considered in the current study.
In this paper, the performance and techno-economic of the PVGCS integrated with the battery storage system were assessed. The main contribution of this paper includes use of the techno-economic model for evaluating the performance status of the existing PVGCS plant and performing a comparative analysis of this plant with the result of the proposed 5 kWp PV plant in terms of their respective net present cost and cost of energy values. This, in turn, enables the identification of the optimal and economical sizing of entire plant components and efficient utilization of the storage battery to minimize excess electricity. Using the available solar irradiance and dynamic load profiles as an input to the model, the optimization and sensitivity analysis results give the most optimal combination of battery storage, PV array, converter, and grid network usage. To conduct the existing operation performance analysis of the plant, different performance indicators related to energy yield of the entire plant and the performance ratio (Pr) were used. The techno-economic analysis of the PVGCS plant was conducted using a model-based simulation with a hybrid optimization model for electric renewables (HOMER Pro) software. This software is a professional micro-grid analysis tool having Pro edition features, HOMER Pro 3.10.6499.25914 version, and manufactured by HOMER Energy LLC, Denver Colorado, United States of America. In addition to the techno-economic study, the entire PVGCS system was modeled using the Matlab simulation environment to analyze the dynamic response of the plant to the grid network. The results found from this study can be used as valuable input for other photovoltaic plants to be installed and connect with the grid system and hence, enables efficient utilization of PV plants in Ethiopia.
The rest of the sections in the paper are organized as follows:
Section 2 discusses a state-of-the-art review on techno-economic assessments of grid-connected PV plants.
Section 3 describes the proposed model-based simulation methodology for techno-economic analysis and optimization. An overview of the existing infrastructure of the PVGCS is also discussed.
Section 4 describes the existing performance status and techno-economic result of the existing 10 kWp plant compared with the proposed 5 kWp PVGCS system.
Section 5 presents the discussion section. Finally, the conclusion, limitations, and recommendations are offered in
Section 6.
2. State of the Art Review on Techno-Economic Studies of Grid-Connected Photovoltaic Systems
Photovoltaic based renewable energy systems can be found in two ways: as standalone and grid-connected systems. The PV systems are the primary source of energy for the load, while PV grid-connected systems are utilized when a shortage of energy occurs in the grid network [
15]. However, PV energy systems connected to the grid can impose instability problems due to their intermittent nature and high penetration [
16]. Therefore, technical and economic aspects need to be studied before connection of PV systems to the grid network and after they are connected to the grid and on their operational period. So far, scholars mentioned in this section studied the performance assessment, modeling, and techno-economics advantage of photovoltaic plants and their impacts on the grid network. Zhou et al. [
17] developed a hybrid optimization model for electric renewables (HOMER) based simulation and optimization technique for evaluating the techno-economic aspects of a rooftop solar PV system in different climate zone conditions. Based on the analysis made, the result showed that grid-connected PV systems are technically and economically feasible for all climate zones considered. The excess electricity, net present cost, and cost of energy values of the grid/PV systems increased with an increase of PV penetration. This paper lacks an evaluation the plant performance in terms of energy production and impact assessment to the grid, and this was identified as a gap. In addition to the techno-economic study, Lau et al. [
18] analyzed the effects of individual component costs and feed-in tariffs on grid-connected PV systems in a Malaysian residential application. Based on the analysis made, the results indicate that grid-connected PV systems were feasible for a PV system with costs of
$1120/kW or lower. Though the authors provide details of the PV plant’s economic aspects, analysis of the storage battery and its impact on reducing grid dependency is not well addressed. In contrast to the focus of the above authors, Emmanuel et al. [
19] presented a performance and economic analysis of a 10 kWp PVGCS system installed in Wellington, New Zealand. The economic analysis of the PV system was performed by considering the net present cost (NPC), cost of energy (COE), and payback period and this gives promising values for the plant. In line with the techno-economic study of PV plants, Irwan et al. [
20] conducted optimization of a photovoltaic grid-connected system, which was performed by considering two scenarios. The first one was considered by investigating the maximum yield factor as a technical matter, and the second involved maximizing the net present cost value for the economic case. For solving the sizing and optimization issues, a method called the evolutionary programming sizing algorithm (EPSA) was applied. This algorithm mainly uses the PV module and inverter model as the decision variables with an objective function of maximizing the technical or economic performance of the system. In addition, the operational optimization of grid-connected PV plants and the evaluation of small scale PVGCS was studied (
Table 1). Sidrach et al. [
21] assessed the performance of a 2 kWp grid-connected PV system without an energy storage system in Spain in 1998. A single phase-based inverter is used to convert the DC output to AC and connect with the grid network, which is also used for maximum power point tracking (MPPT) purposes. Based on the study made, the system supplied 2678 kWh to the grid within one year, and 7.4 kWh of average daily energy with a monthly average value of daily system efficiency between 6.1% and 8% was attained. For an annual final yield of 1361 kWh/kWp, the daily final yield ranged between 2.2 kWh/kWp in January to 4.8 kWh/kWp in March. The annual performance ratio of these systems was 64.5%. A lack of evaluation on battery storage’s contribution to the system is the gap observed in this paper. Sabounchi et al. [
22] investigated the performance evaluation of a 36 kWp installed capacity photovoltaic based distributed generation system connected with a 400 V low voltage side of a distribution network based on the actual weather conditions of temperature and solar radiation availability. Considering the plant’s one-year performance data, it was concluded that the system performance and efficiency were affected by dust particles deposition on PV modules’ surfaces. Therefore, to attain a reasonable power production, it was recommended that a monthly cleaning of the PV modules surface on regular bases is deduced as a solution. Though the power system performance status and the factors affecting it were presented in detail, the grid’s positive and negative impacts were not mentioned. Common performance evaluation indices were used by Sharma et al. [
23], who also conducted a performance assessment of a 190 kWp grid integrated solar photovoltaic power plant installed at Khatkar-Kalan, India. Based on the study, the final yield, reference yield, and performance ratio vary from 1.45 to 2.84 kWh/kWp/day, 2.29 to 3.53 kWh/kWp/day, and 55% to 83%, respectively. The average annual energy yield of the plant was found to be 812.76 kWh/kWp with a system efficiency of 8.3%. The study also showed that March, September, and October are the months where the maximum energy is generated, and minimum energy is attained in January. Besides, the study suggested that installing solar panels at an optimized tilt angle is very important in providing economic benefits, but the dynamic response of the plant related to transient effect to the grid was not included in the paper.
Kymakis et al. [
24] conducted a performance analysis of the grid-connected photovoltaic park found at Crete, Greece. The photovoltaic park has a peak power of 171.36 kWp. It considers a one-year operation data of the plant for estimation of the performance ratio and the various causes of power losses including due to temperature, soiling, internal network, and power electronics. The PV park injected energy of 229 MWh to the grid during 2007, ranging from 335.48 to 869.68 kWh throughout the year. The final yield (
YF) ranged from 1.96 to 5.07 h/d and provided an annual performance ratio of 67.36%. Similarly, the dynamic response of the plant was not included in the paper. Edalati et al. [
25] performed a comparative analysis between mono and polycrystal based PV modules performance under semi moderate and dry climate conditions. The study was conducted on an existing 11.04 kWp PVGCS system. Besides, an experimental based investigation of this plant was done using one year meteorological and performance data of the plant. Accordingly, the average daily final yield (Y
F) of 5.24 kWh/kWp/day and Performance ratio (Pr) of 80.81% was found. Ayompe et al. [
26] conducted a performance assessment of 1.72 kWp building integrated system and the temperature and solar radiation data used for analysis of the final yield, array yield and performance ratio results. Based on the results found, the average daily final yield and performance ratio were found to be 2.41 kWh/kWp/day and 81.5%, respectively. The annual total energy generated was also found to be 885.1 kWh/kWp. The author utilized experimental and metrological data for analysis purposes but lacked verification of the result by comparing it with the standard or previous studies. Province [
27] analyzed a photovoltaic grid-connected system with 500 kWp capacity that was investigated for its actual performance. Based on the assessment done, 383,274 kWh of system energy was generated for the first eight months and the daily average energy production was 1695.9 kWh. The final yield was found to be in the range of 2.91 to 3.98 h/d, and the performance ratio (Pr) ranged from 70% to 90%. Mondol et al. [
28] assessed a 13 kWp roof mounted grid-connected photovoltaic system performance found in north Ireland that was analyzed on an hourly, daily, and monthly basis using parameters of yield and loss indices. Based on the analysis result, the monthly average performance ratio was consistent which is found to be 70% for DC and 61% for AC system. Comparative analysis between two different PVGCS plants was performed by Micheli et al. [
29]. Different module technologies consideration and their actual performance assessment were done using temperature and irradiance as an effect. The two types of plants investigated confirmed a good performance with a value of 89.1% CTB (Centrale Tecnologica di Basovizza) found in campus of Basovizza, northern Italy and Q2 building of 82.7% performance ratio. Accordingly, the best technology type was recommended but which type external factors can affect each technology type were not explicitly stated. The combination of module technologies provides an array used in the PV plants, and the significance of different PV arrays was compared and investigated by El et al. [
30] for 15 MWp grid-connected installed PV system found in Nouakchott, Mauritania. Analysis and monitoring of results between arrays was compared with PV systems installed in other locations. Besides, performance indices were used for evaluation purposes and a mean value of 67.96% performance ratio was achieved. Drif et al. [
31] analyzed a 200 kWp PVGCS system using production data at the plant monitored through 2000–2003. According to the study, the annual average energy production was 168.12 MWh per year, representing 6.40% of the university campus’s total consumption. An average daily annual performance value of 65% and an average energy yield of 3.91 was found. Shukla et al. [
32] conducted a feasibility study of 110 kWp grid-connected photovoltaic plant to be applied for water pumping, lightening, and other electrical appliances of the selected hospital building. Its feasibility was mainly proved with the help of energy production and performance ratio outputs. The PV modules have been modeled and simulated to determine performance ratios and Energy yield and it was found that the performance ratio (PR) of the PV systems varied from 70% to 88% and their energy yields ranged from 2.67 kWh/kWp to 3.36 kWh/kWp. The authors tried to address the feasibility and performance of the plant in terms of yield factors. But, the economic viability of the system was not addressed for the dedicated application.
In addition to the technical aspects summarized above, the economics of the PV hybrid energy supply systems was assessed by different authors. Some of the studies conducted are briefly presented as follows.
Peerapong [
33] analyzed the increased utilization of photovoltaic resources on diesel-based hybrid energy systems to reduce the cost of electricity generation and decrease the harmful emissions from fossil fuels. The study used a method of net present cost (NPC) estimation to evaluate the optimum hybrid system. The result shows that the hybrid system reduces NPC and COE. The hybrid system can also reduce all air pollutants for sustainable electricity in rural islands. COE decreases from
$0.429/kWh to
$0.374/kWh compared to the existing diesel-based system and can decrease the emissions of both carbon dioxide by 796.61 tons/year and other gasses by 21.47 tons/year. The hybrid PV/diesel system also reduces the diesel fuel consumption of 302,510 L per year due to an optimal 41% PV resource sharing in this system. The authors describe the significance of using a hybrid system compared to diesel. But the contribution of each component, including the storage battery, was not mentioned. Mamaghani et al. [
34] presented an evaluation of an off-grid energy supply system that consisted of a diesel generator, solar panels, and wind turbine units. A dynamic model of the plant was developed with HOMER software to perform a complete parametric analysis of the system configurations and select the most convenient one based on the economic perspectives. Accordingly, the net present cost (NPC), initial capital cost, and cost of energy (COE) were used as economic indicators to define the techno-economic feasibility of the hybrid energy supply system. The gap observed in this paper is that the lack of verification of grid extension distance results compared with standards or references was not included. A comparative study of the hybrid energy system with standalone diesel was conducted by Dursun et al. [
35] considering the techno-economic feasibility of a hybrid renewable energy sources with a battery over that of a standalone diesel system to supply a load at a remote location in Turkey. HOMER software was used for the analysis by considering solar and wind data sources of the hybrid system over the diesel system utilizing different solar global irradiances, wind speeds, and diesel prices. The result suggested that the hybrid system reduces the total NPC and COE and the diesel system’s dependency. Using this hybrid system, the COE decreased by almost 25%. Though the authors presented the advantage of using the hybrid system to reduce diesel dependency, it lacks the result of the contribution of the storage battery system and payback period of the system.
From the literature reviewed above, the following points were summarized:
The use of numerical analysis and simulation is essential to optimize the techno-economic benefits of the PVGCS system, which in turn reduces costs.
The utilization of external factors like temperature, GHI, and tilt angle helps to determine the correct simulation output of the system.
This hybrid system provides a better output based on the net present cost and cost of energy.
Different researchers studied the techno-economic analysis of grid-connected photovoltaic plants under different weather conditions in different countries. But the performance evaluation parameters and indices utilized in the above reviewed papers were not all-inclusive.
In this paper, all primary performance evaluation indices mentioned as a gap in some of the above reviewed papers was considered to conduct a performance assessment and study the techno-economic optimization of the PVGCS system.
Conducting the techno-economic optimization of the PVGCS integrated with a storage battery system provides major significance in terms of:
Evaluating the techno-economic aspect and performance status of the existing 10 kWp grid-connected PV system.
Proposing a techno-economically viable combination for the new PVGCS system.
Identifying the contribution of the PV plant to the grid network.
Using it further as an input for PV plants connected with the country’s grid network in the future.
This paper considers the features of the above-reviewed articles and proposes an analytical and model-based techno-economic evaluation method for the PVGCS plant under study.
3. Methodology and Overview of the Study
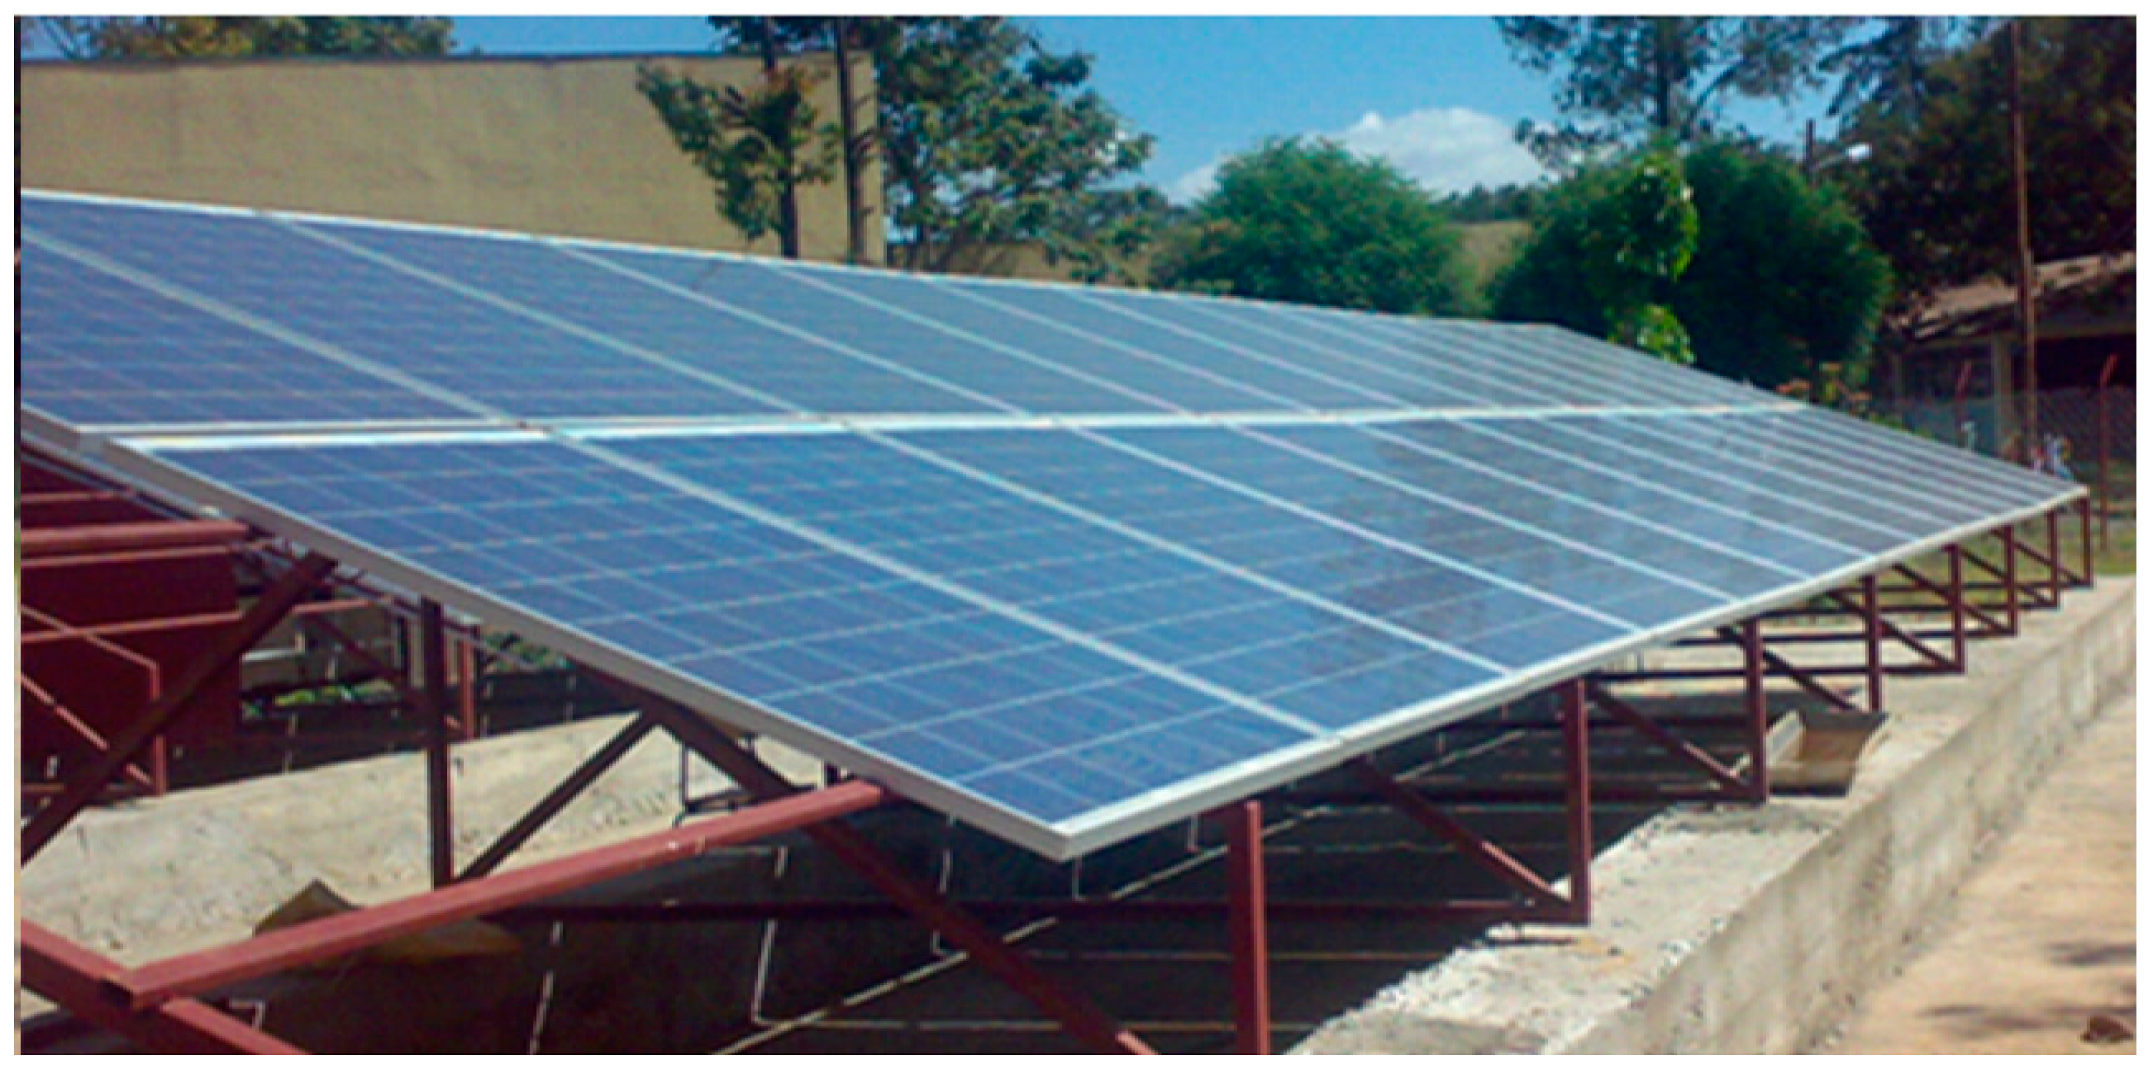
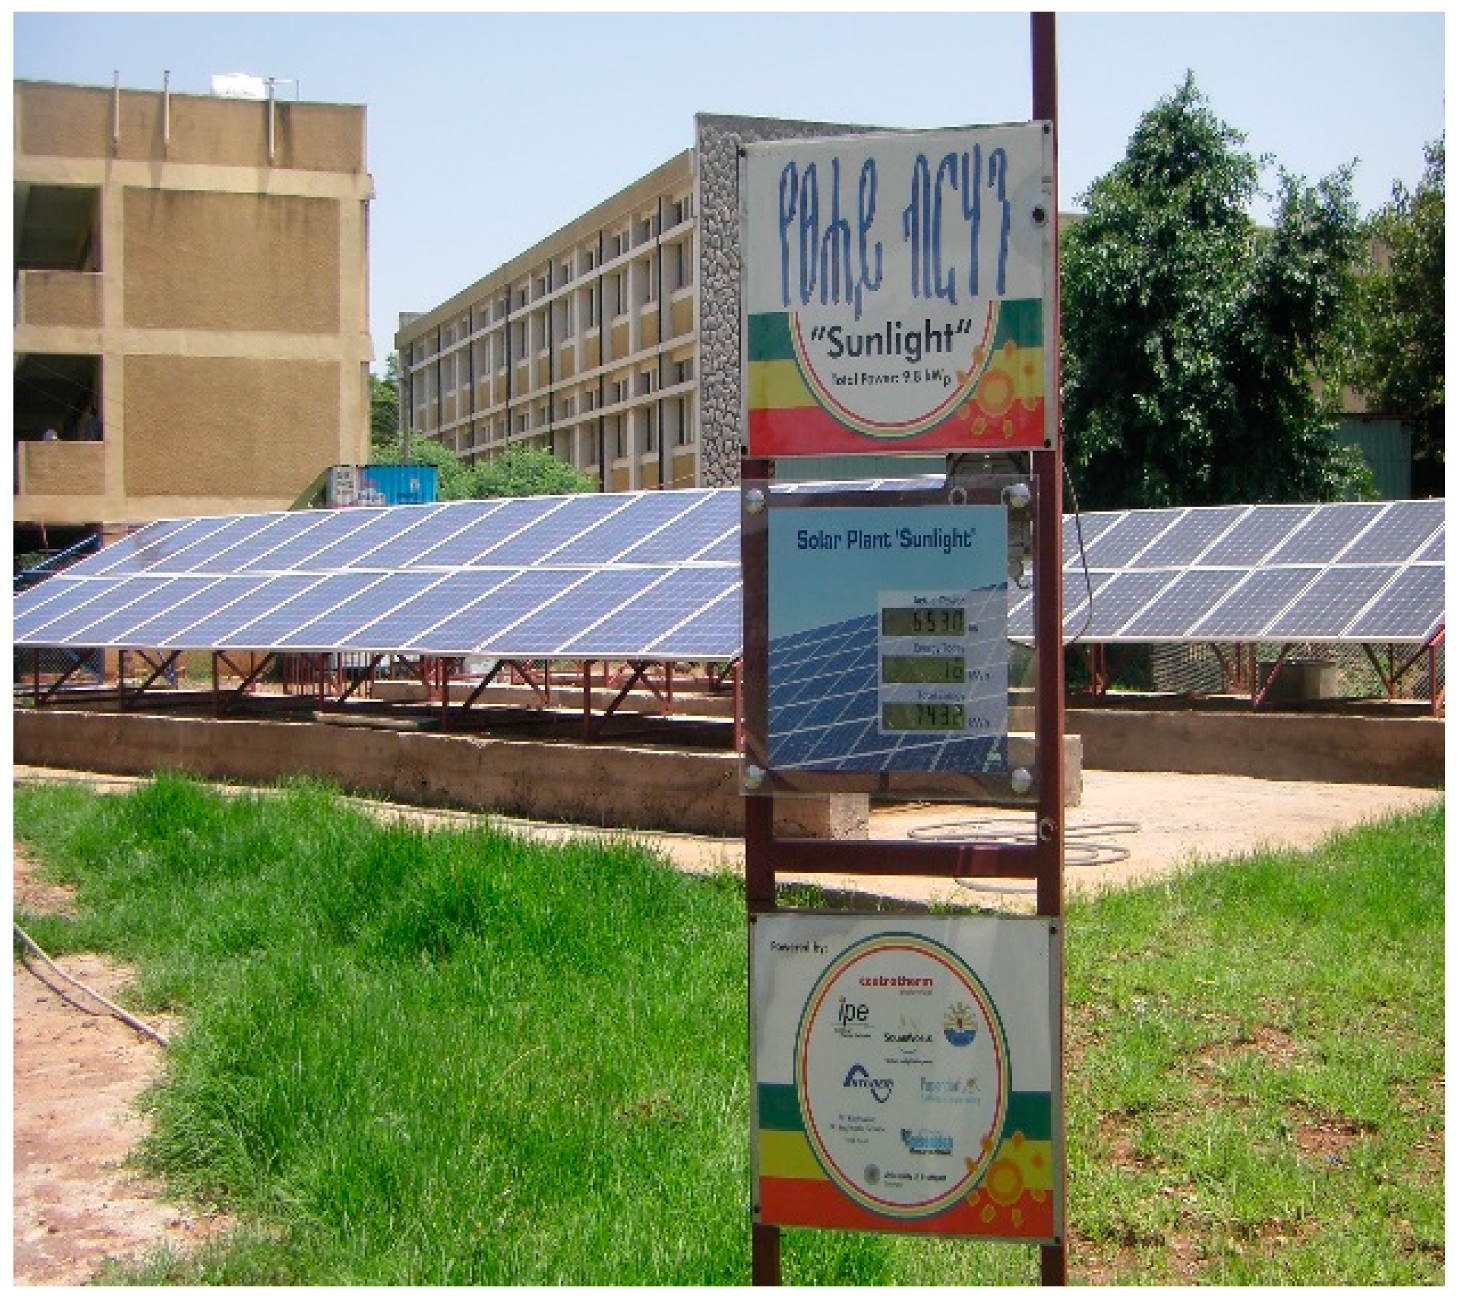
The PVGCS system installed on a 160 m
2 area near to postgraduate laboratory rooms is shown in
Figure 1. The PV system is composed of 56 Webel Solar W1750 PV modules. The PV array is installed at an optimal inclination angle of 16° and an azimuth angle of 0°. Each electrical module provides a short circuit current of 5.35 A, open circuit voltage of 44.5 V, a current of maximum power point (IMPP) of 4.96 A, and a voltage of maximum power point (VMPP) of 36.3 V [
3]. Under these conditions, the nominal power of the PV array is approximately 10 kW at its peak.
The PV plant was connected to the grid and the electrical energy produced by the PV system is fed to the nearby load and the remaining 4.8 to 5 kW is injected into the grid. The storage battery connected to the plant has a voltage of 48 V with 24 cells series connected with a capacity of 800 Ah. From the overall datasheet shown below, a Hoppecke OPzS 800 lead-acid battery is installed at the plant with a nominal discharge capacity of 800 Ah (
Appendix B,
Table A3). The discharge capacity with a 10 h discharge is considered as a maximum of 915 Ah with a respective voltage of 2 V. The cycling capability of 1500 cycles with 80% depth of discharge (DOD) and 20 years of life expectancy is provided. As shown in
Figure 2, there are two arrays each provides a 5 kWp capacity and when the array outputs exceed the local load, the excess energy will be dedicated to charging the battery. However, excess energy is fed to the grid after satisfying the local load and battery charging condition. The second array always gives priority to charging the battery whenever it is fully discharged. The battery was used to be discharged whenever there is no power from the PV system. The solar radiation availability and potential of different cities of the country was presented in
Figure 3. The plant is installed at a geographic location of 11°35′46″ N, 37°23′39″ E at an elevation of 1789 m above sea level. A map and global horizontal irradiation of the installed plant is presented below.
In addition to the above map, the data presented in
Appendix A (
Table A1) shows the average daily global radiation on the horizontal surface of different cities, including Bahir Dar, which is the site under study. The daily sun hour data of Bahir Dar was found to be around 5.8 kWh/m
2 as indicated. For the sake of comparative analysis, the percentage difference of radiation data between data centers is also provided. The data shown in
Appendix A (
Table A2) was also collected for the city of Bahir dar at a latitude of 11°35′46″ (11.60°) north and longitude of 37°23′39″ (37.40°) east. This includes the sunlight potential of the city and the clearness index, which shows the clearness of the respective ambient temperature.
3.1. Performance Parameters Formulation
The characterization of the PV plant production and entire yield was evaluated using performance indices defined by the IEC61724-3 standards [
38] for evaluating the plant performance status. This was achieved through analysis of the energy produced by the PV plant, the energy output of the battery, and energy injected into the grid with the help of the performance evaluation parameters. Accordingly, a daily basis and monthly mean values are considered and then results are provided in terms of the evaluation parameters summarized in
Table 2.
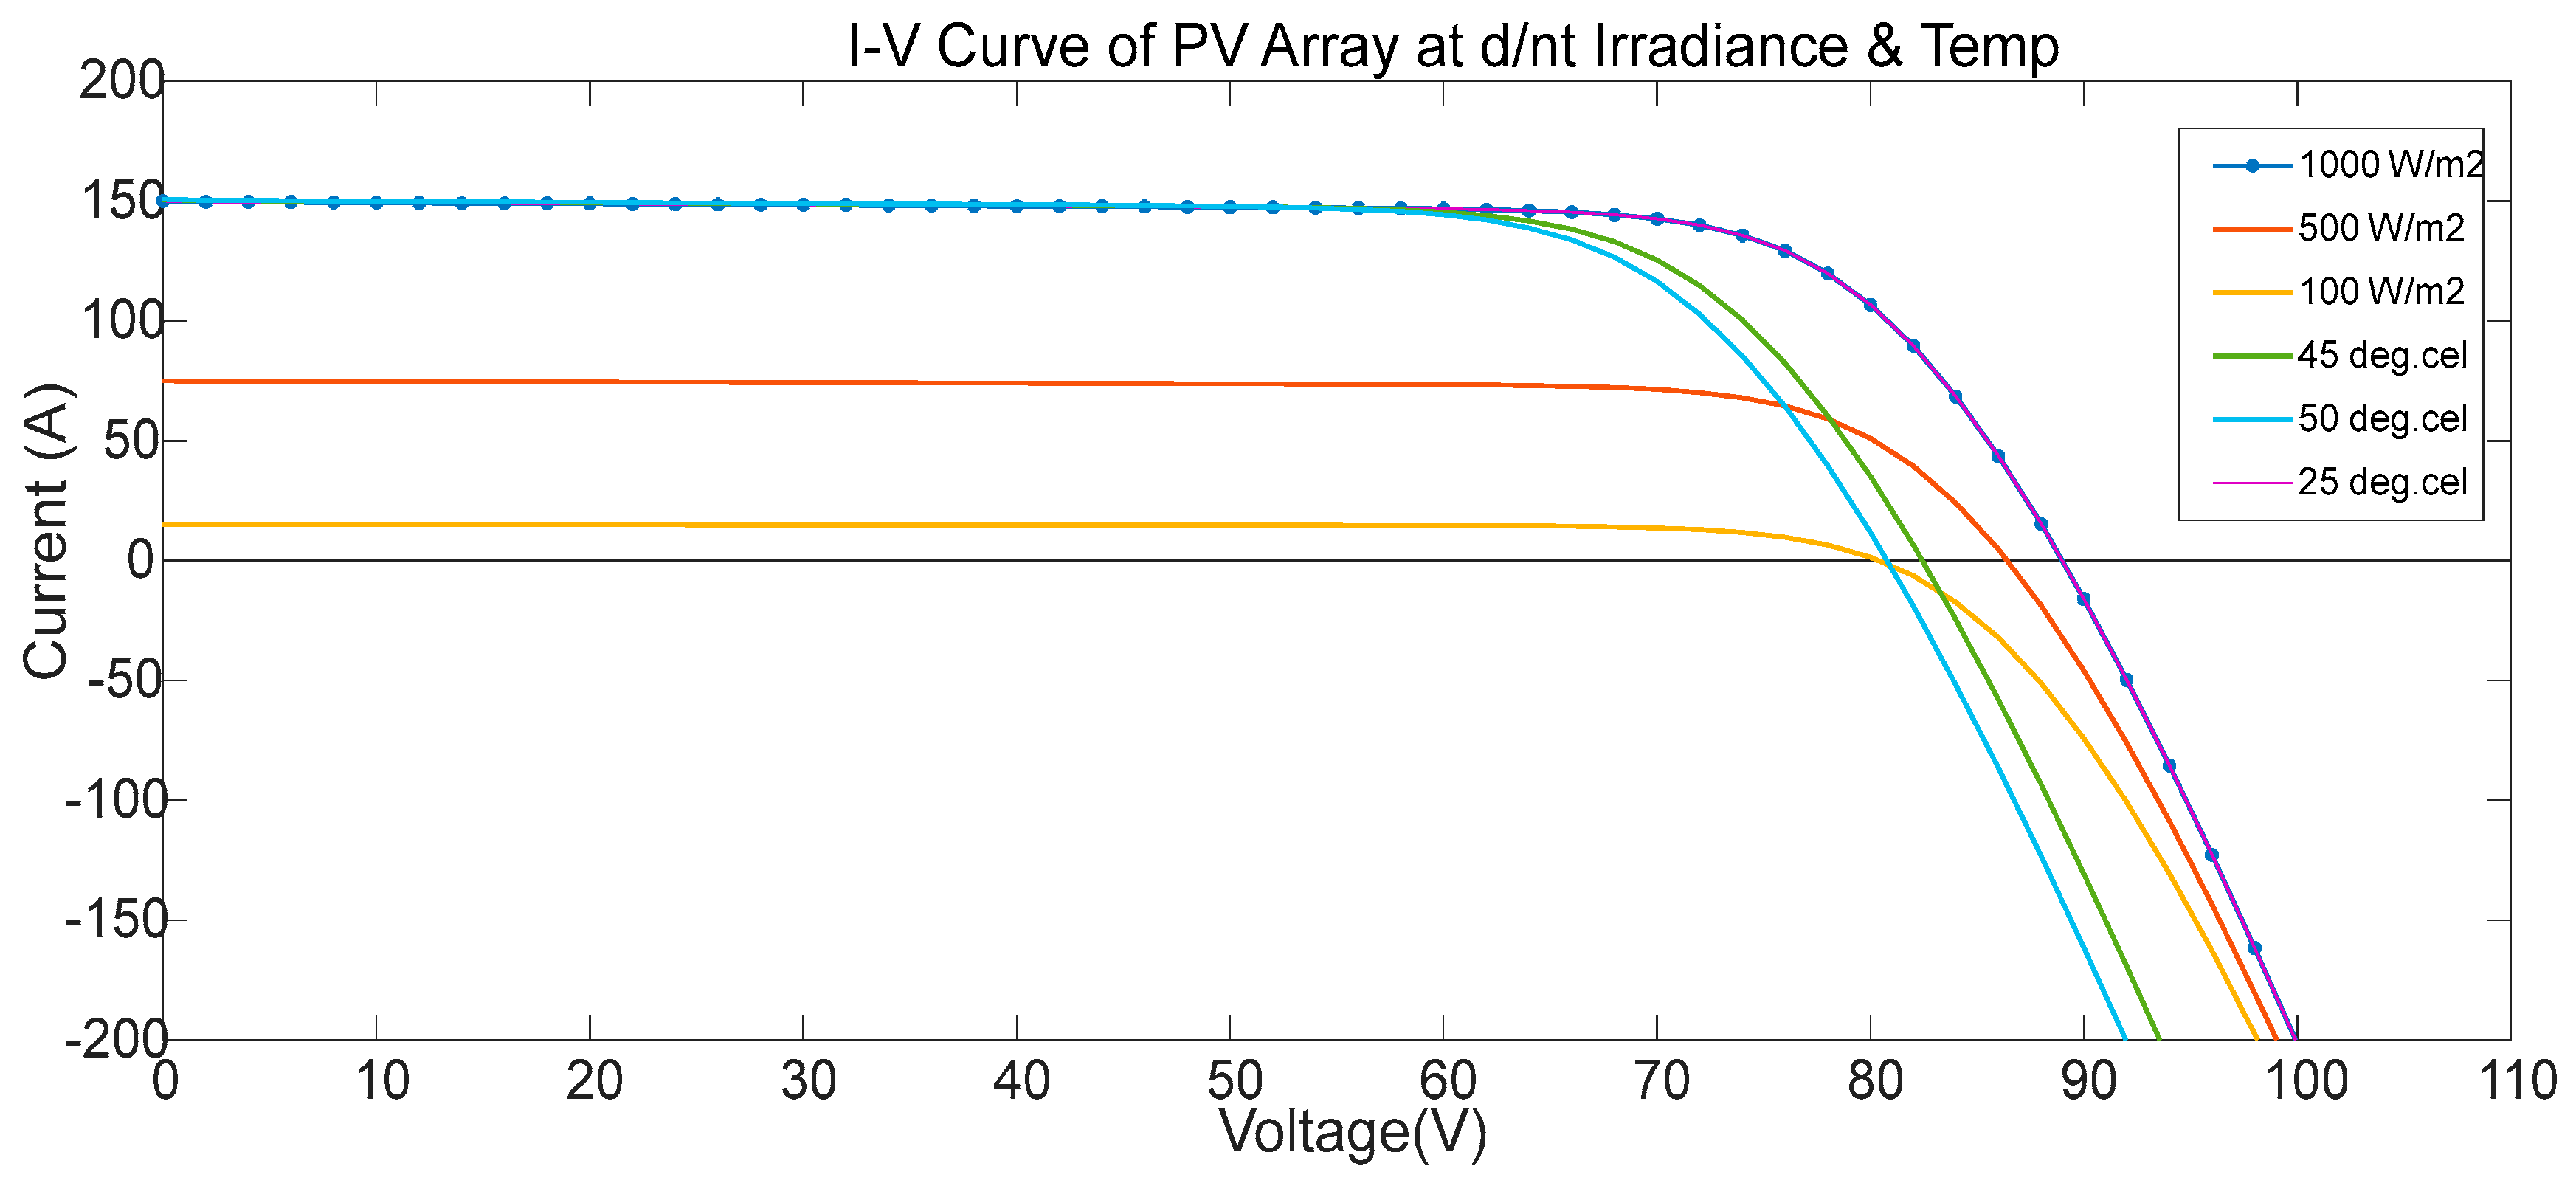
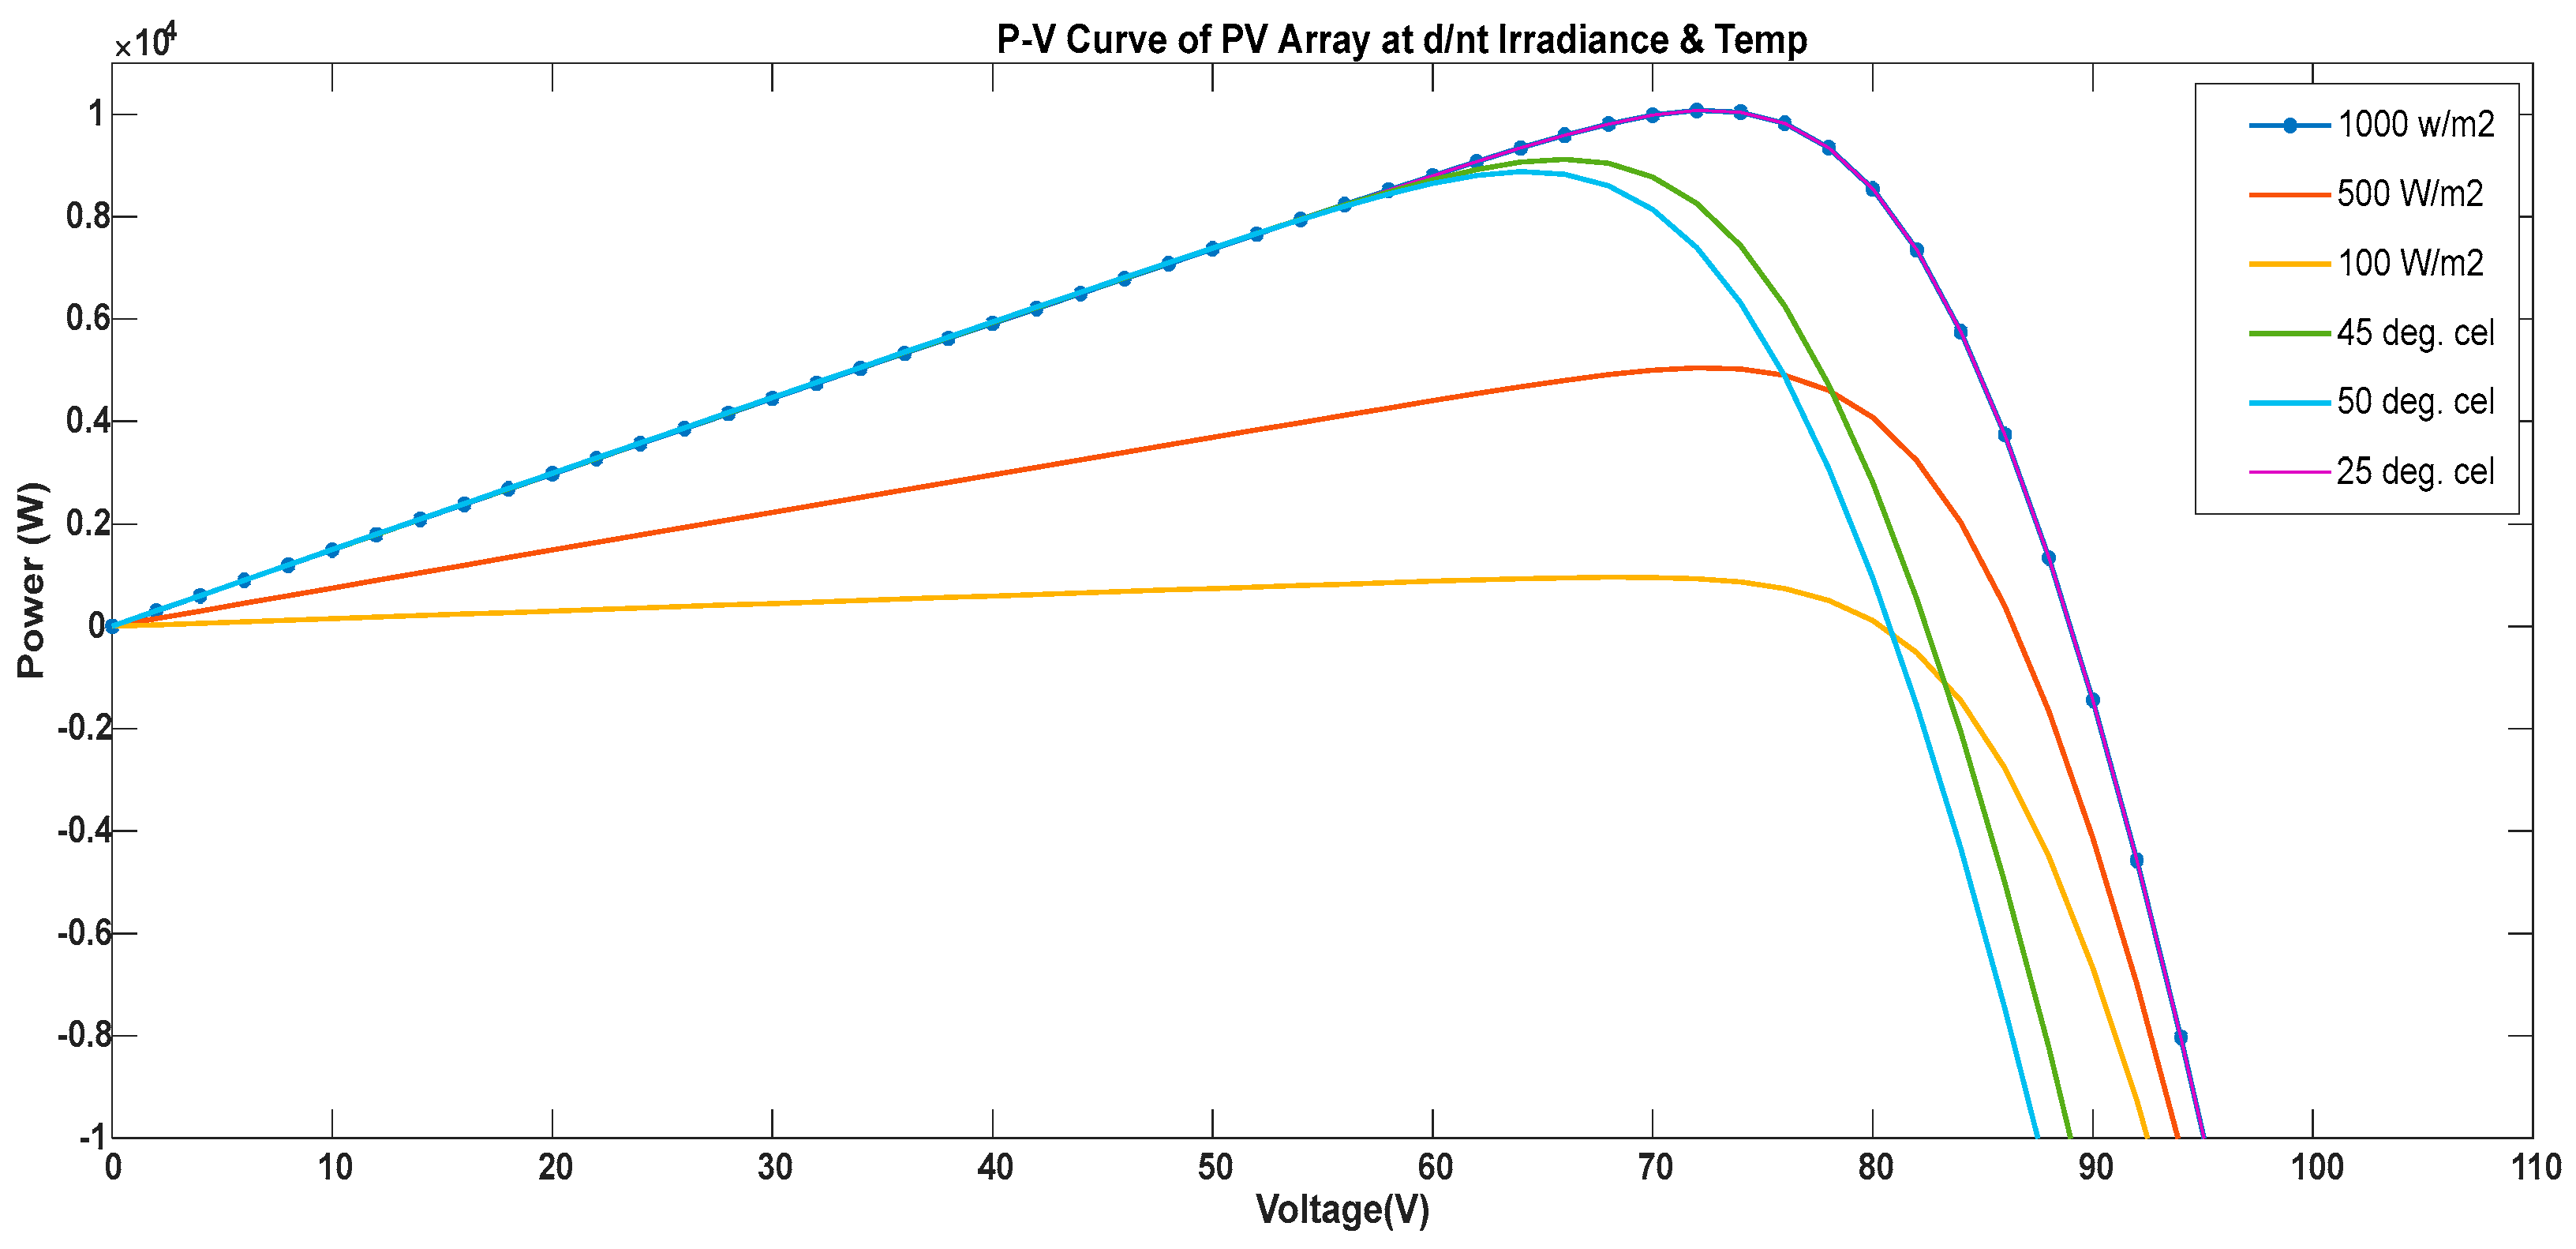
3.2. Modeling of Grid-Connected PV System
In order to model the PVGCS using Matlab, a PV Module datasheet and model parameters at the plant were considered at standard temperature conditions 1000 W/m
2 and 25 °C and necessary parameters are defined. The daily radiation and load profile data have been considered as an input for the PV and nearby load for modeling the overall system. The main purpose of modeling the existing PVGCS system using the Matlab software is to study the plant’s dynamics response and characteristics. The datasheet of the PV module used for system modeling is presented in
Table 3.
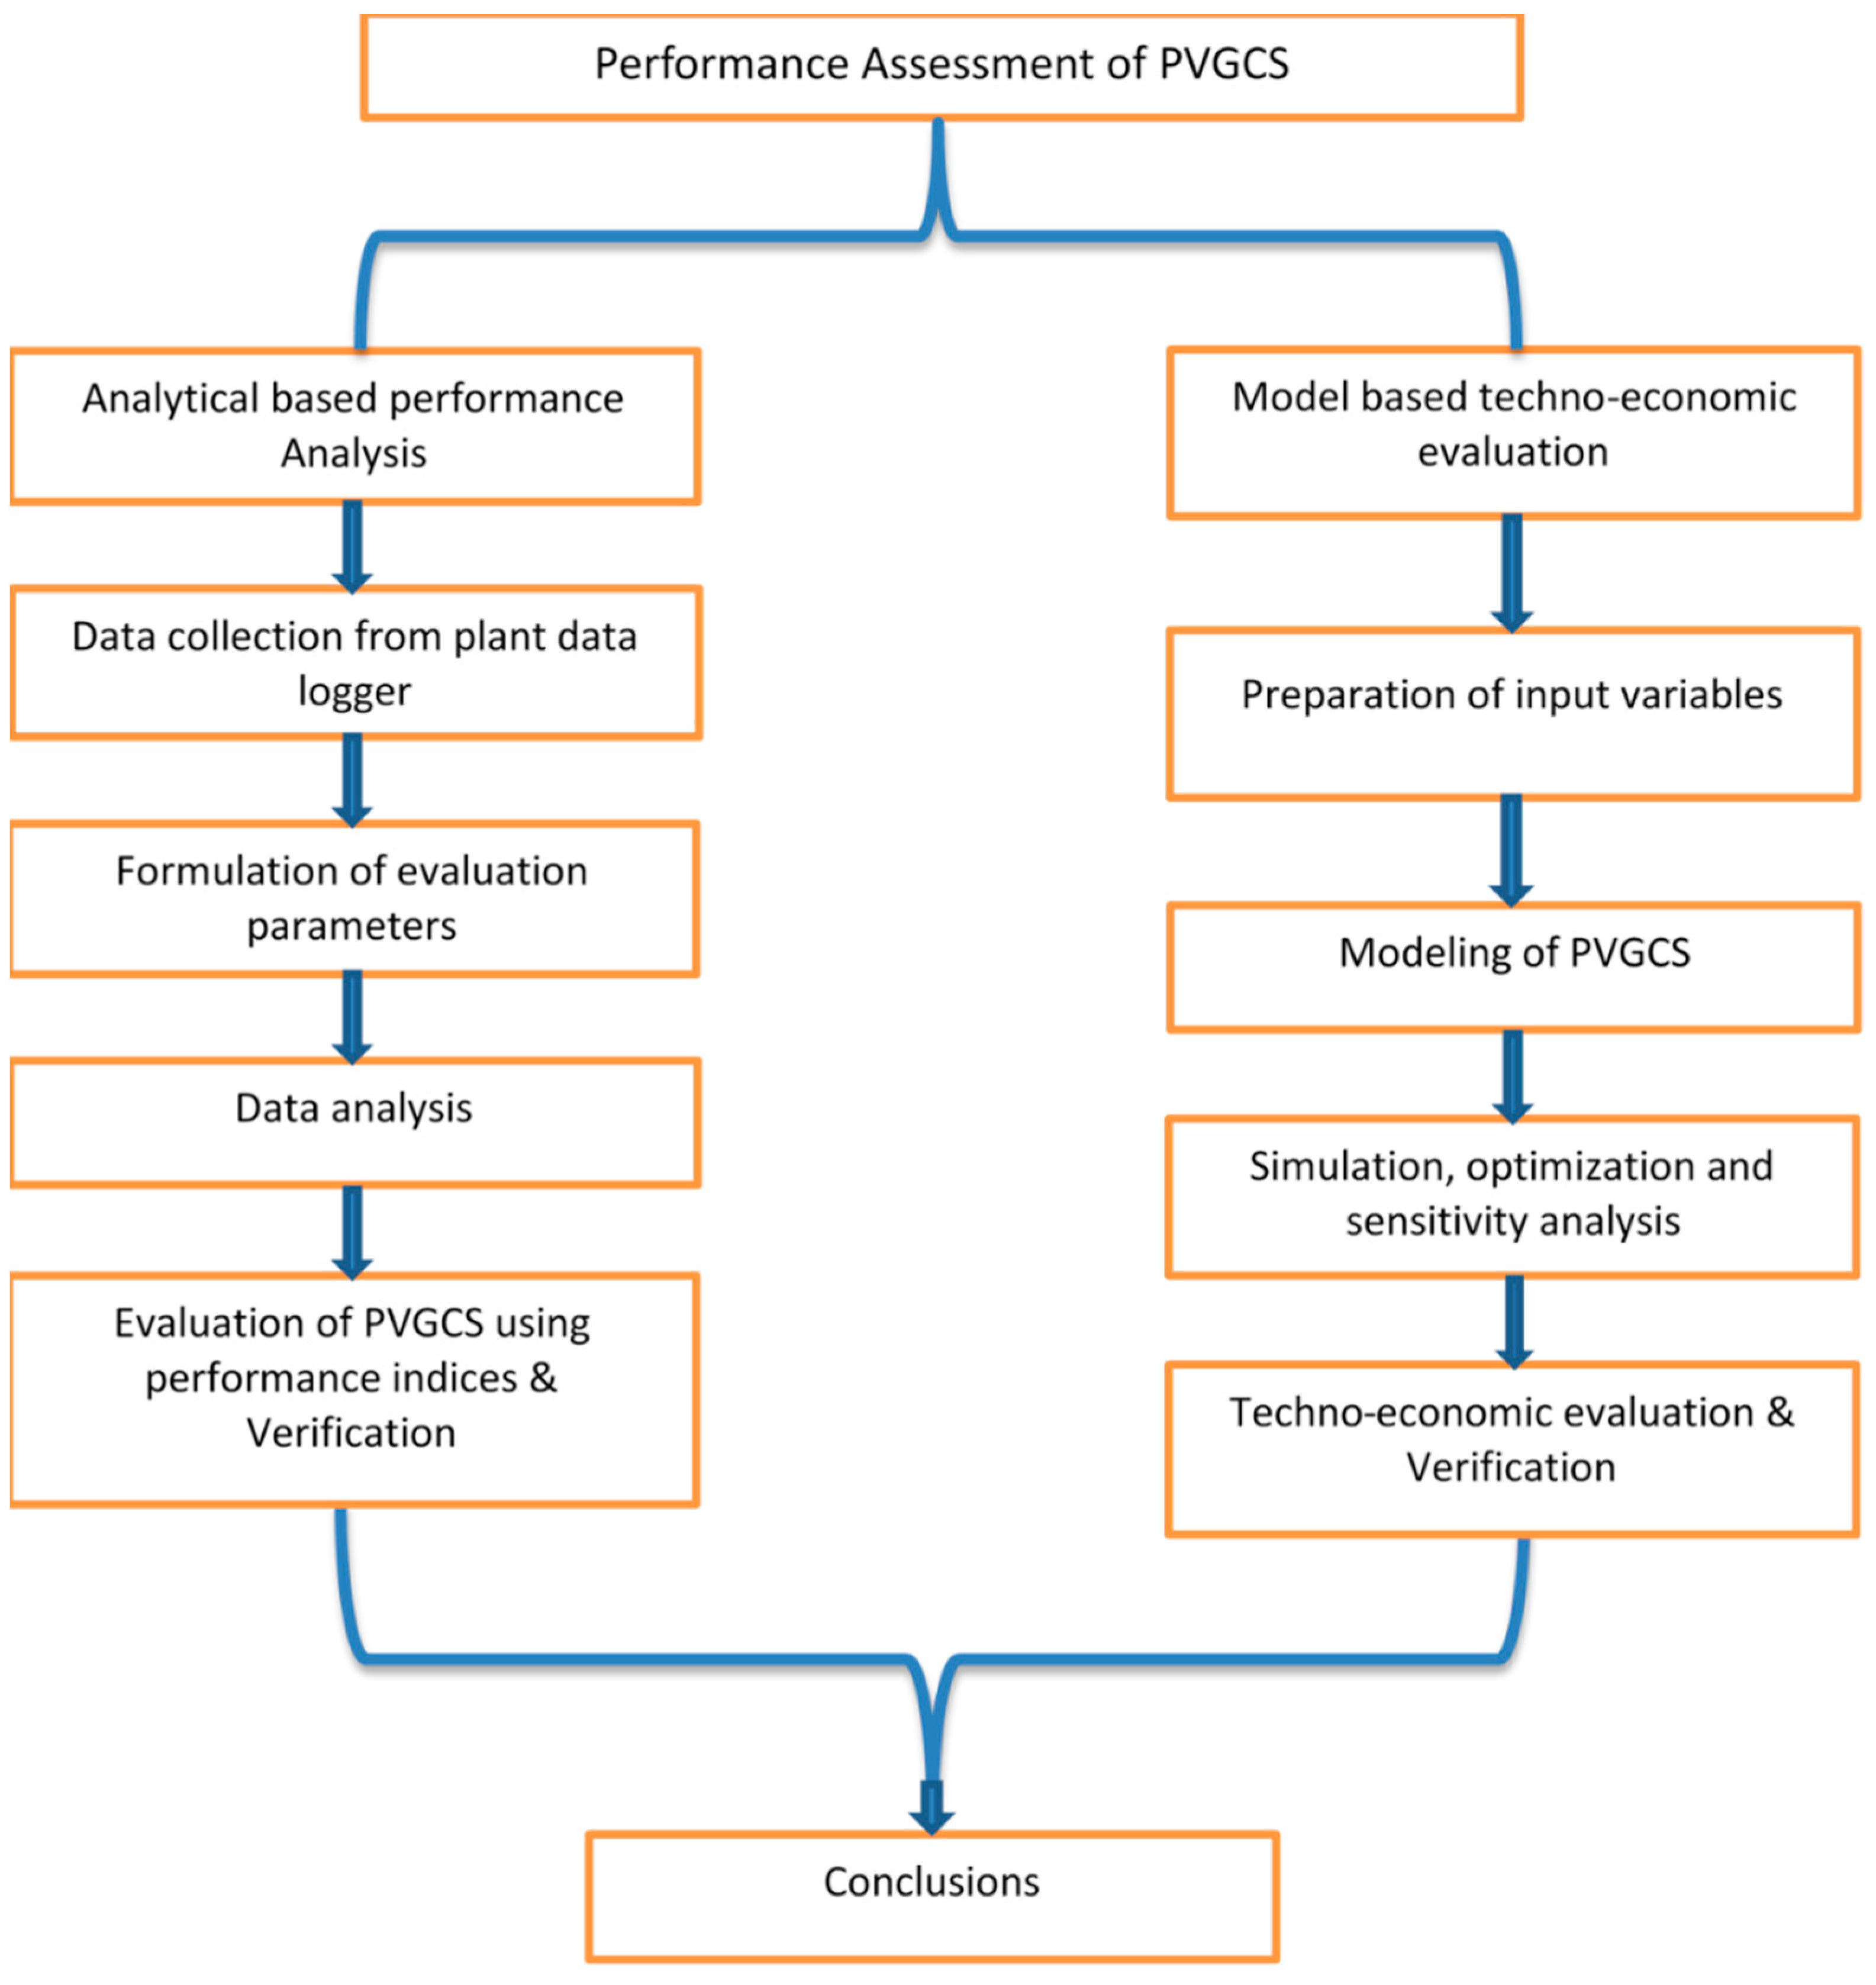
3.3. Methodological Steps for the Proposed Study
A summary of the methodology utilized for conducting the overall performance analysis of the PVGCS is shown in
Figure 6. Modeling, simulation, optimization, and sensitivity analysis of the PVGCS for the selected site was done using Matlab and HOMER Pro, providing the typical data as input varaibles.
3.4. PVGCS System Modeling
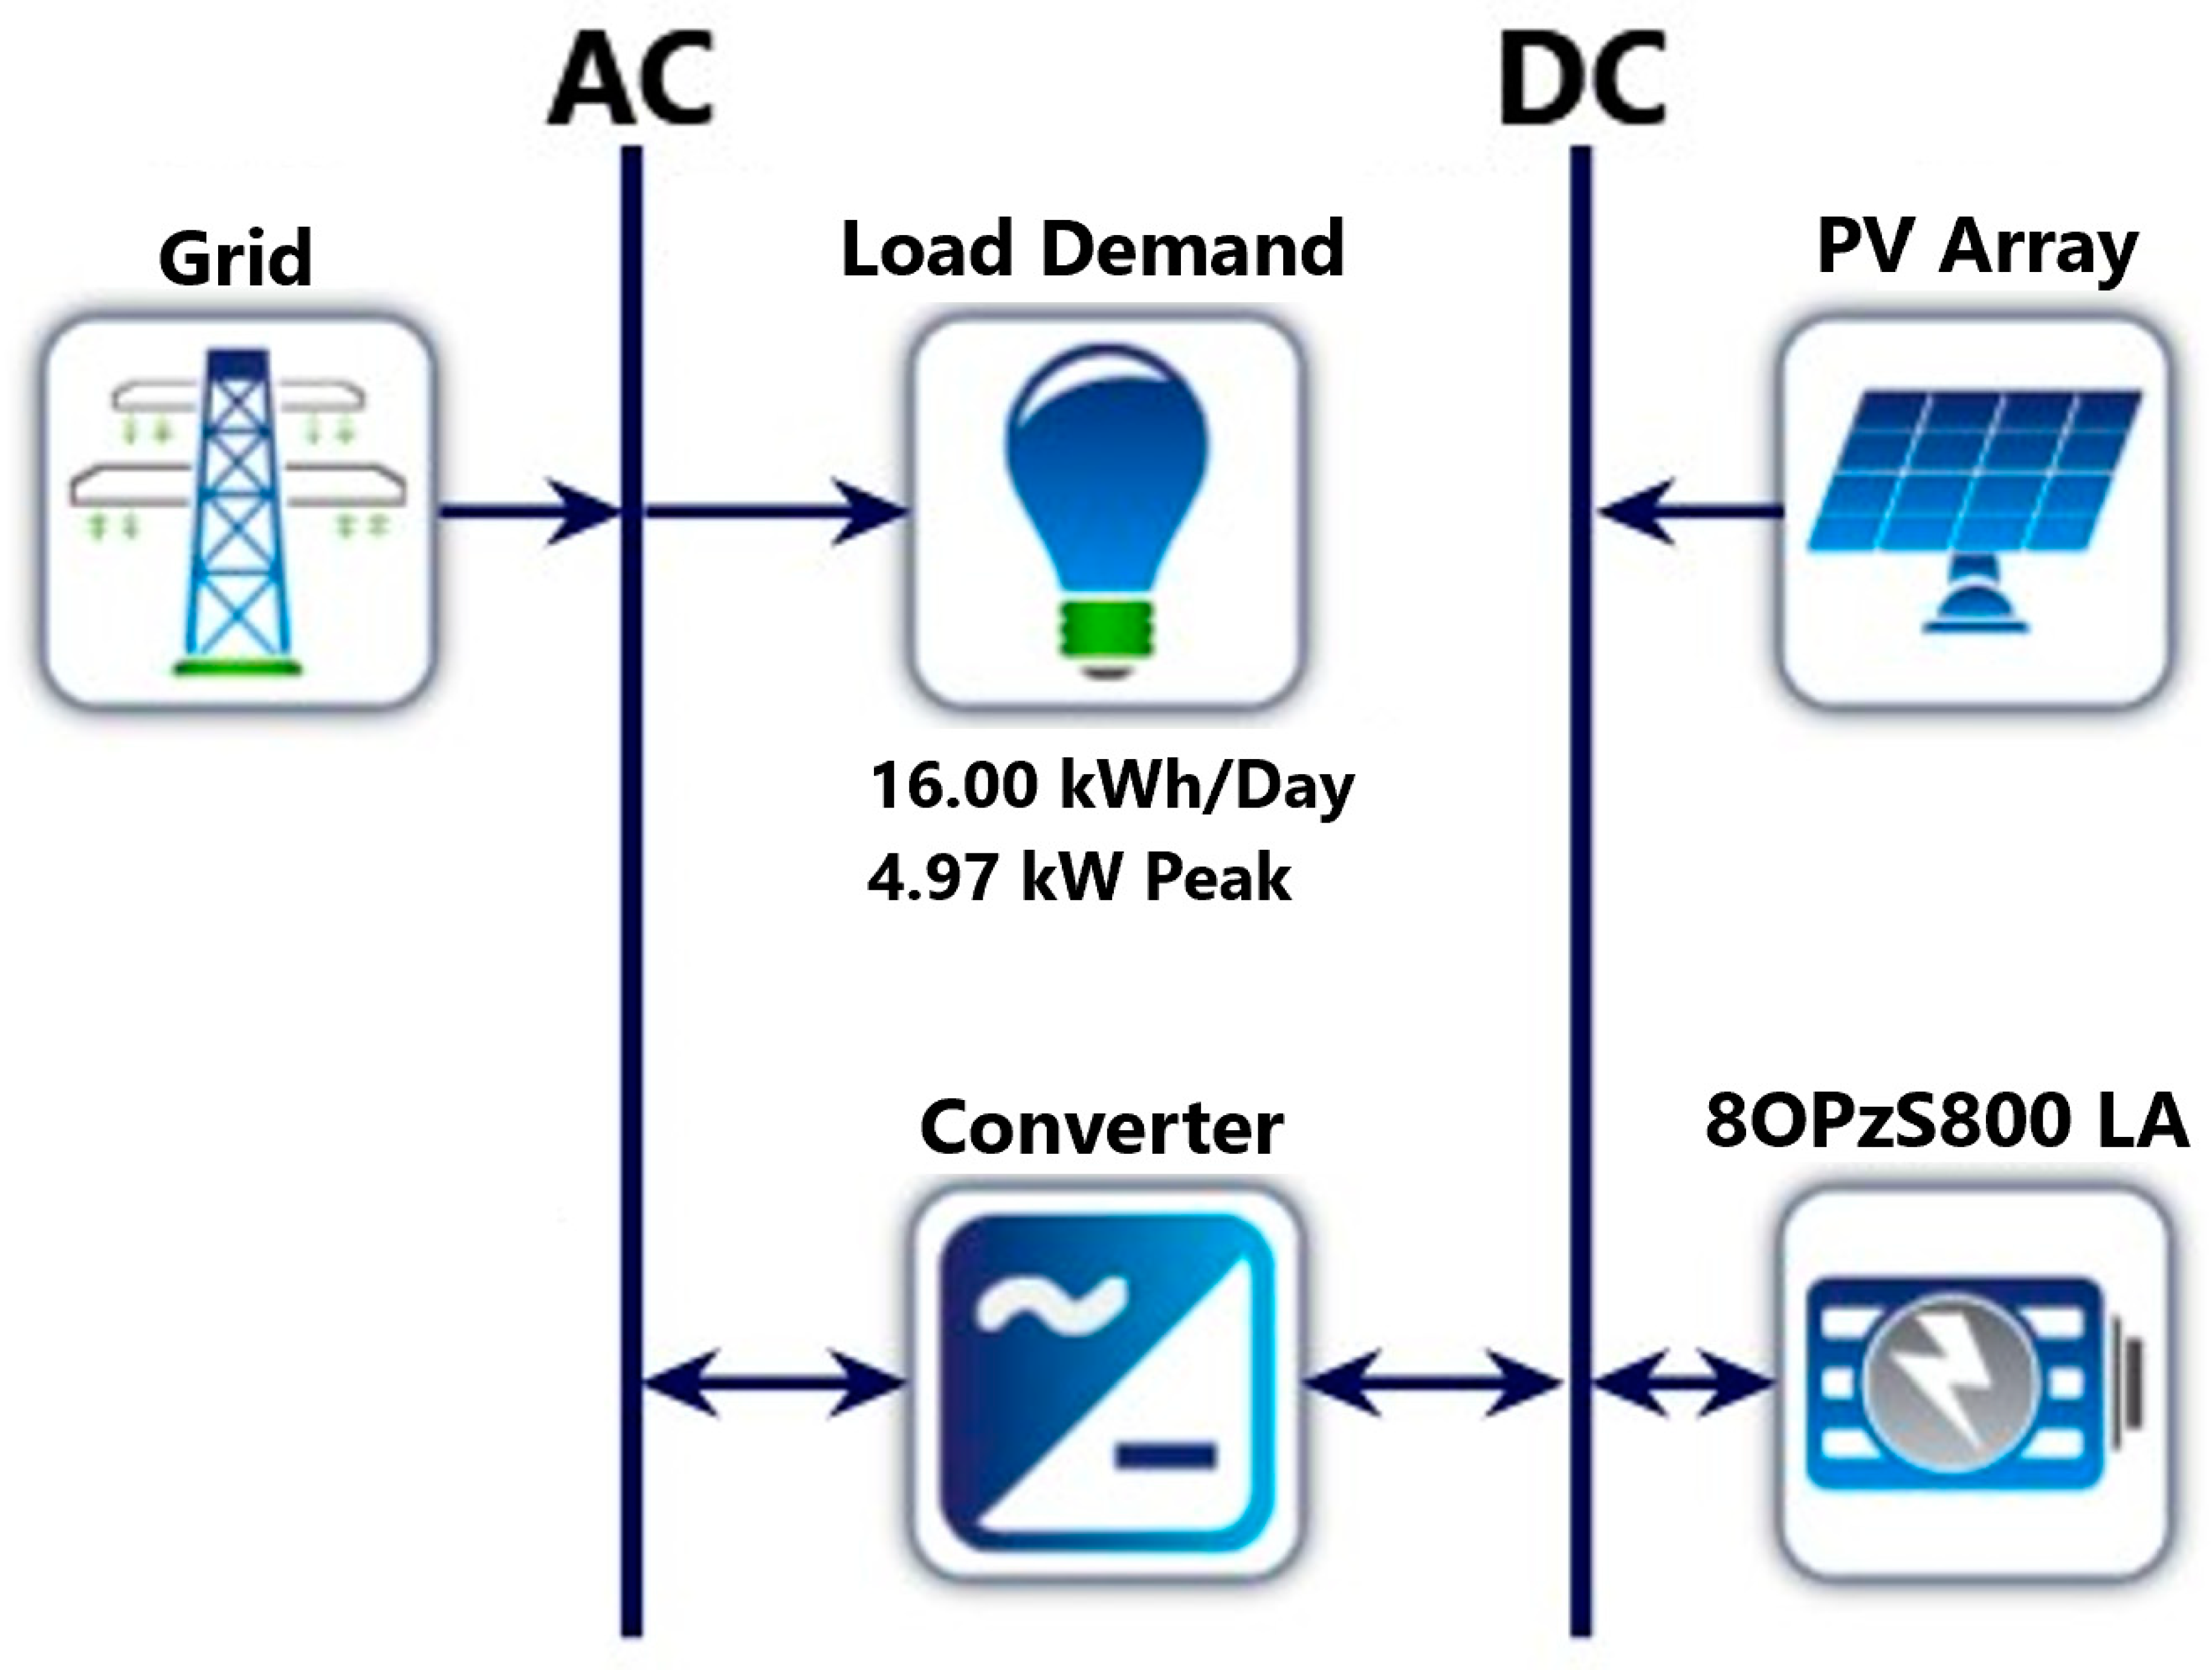
The grid-connected photovoltaic system was modeled using HOMER software, which consists of a 10 kWp PV system, a grid-connected converter of 5 kW capacity with Hoppecke 8OPzS800 lead-acid battery storage, and approximately 5 kWp of load.
The microgrid system consisting of load, a PV array, grid, battery, and converter components modeled with their respective actual ratings as installed at the plant are stated below. The schematic representation of the overall PVGCS system is shown in
Figure 7.
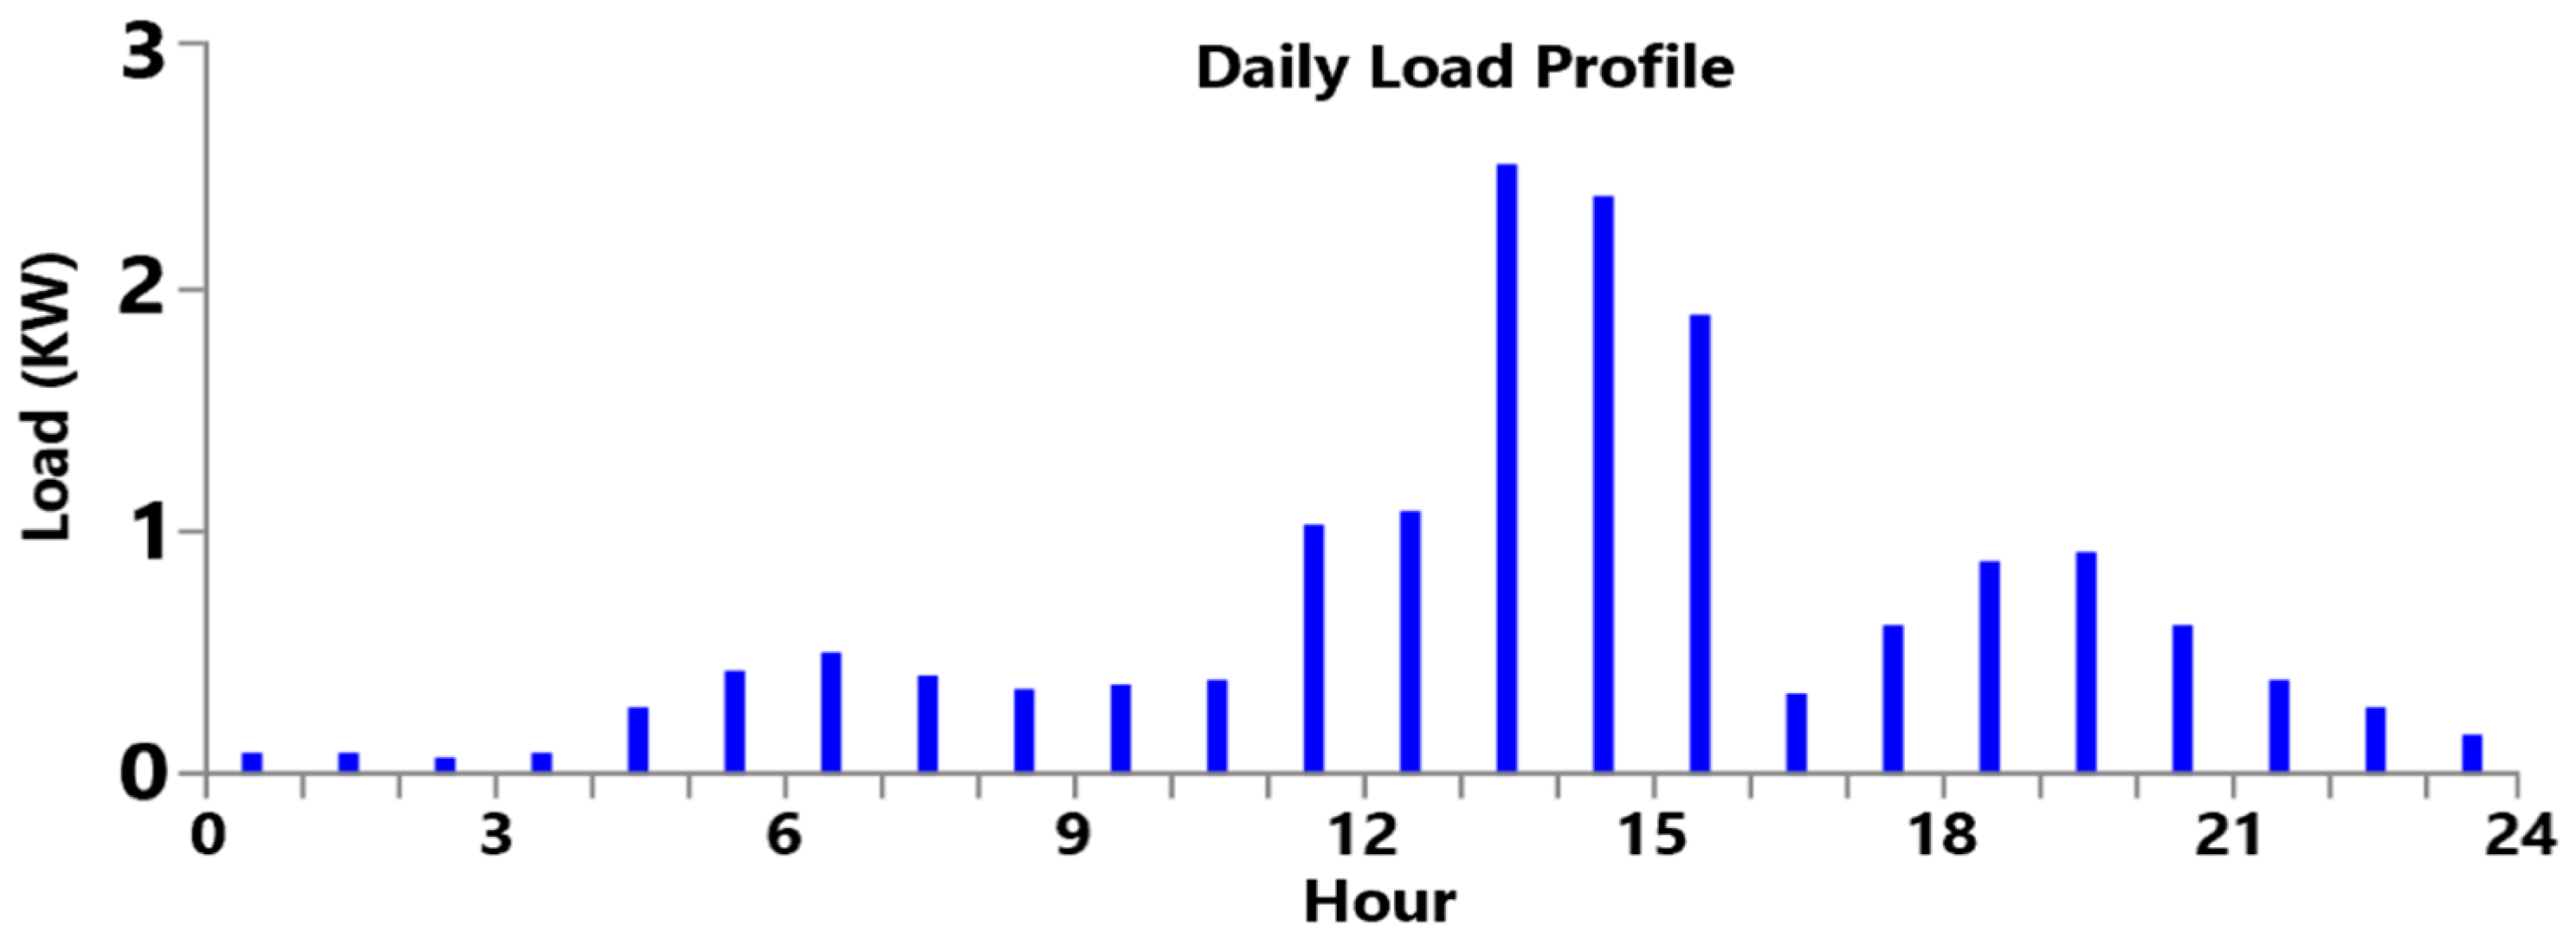
3.4.1. Daily Load Profile
The area under study’s daily electrical load profile is based on the consumption of nearby computer laboratory installed for the students’ facility. According to the collected data at the plant, the load demand of the selected primary load has a maximum of 16 kWh/day energy consumption with 4.97 kW of peak demand. Based on the input data of the site under study’s daily load profile, the average load profile data found from HOMER is shown in
Figure 8.
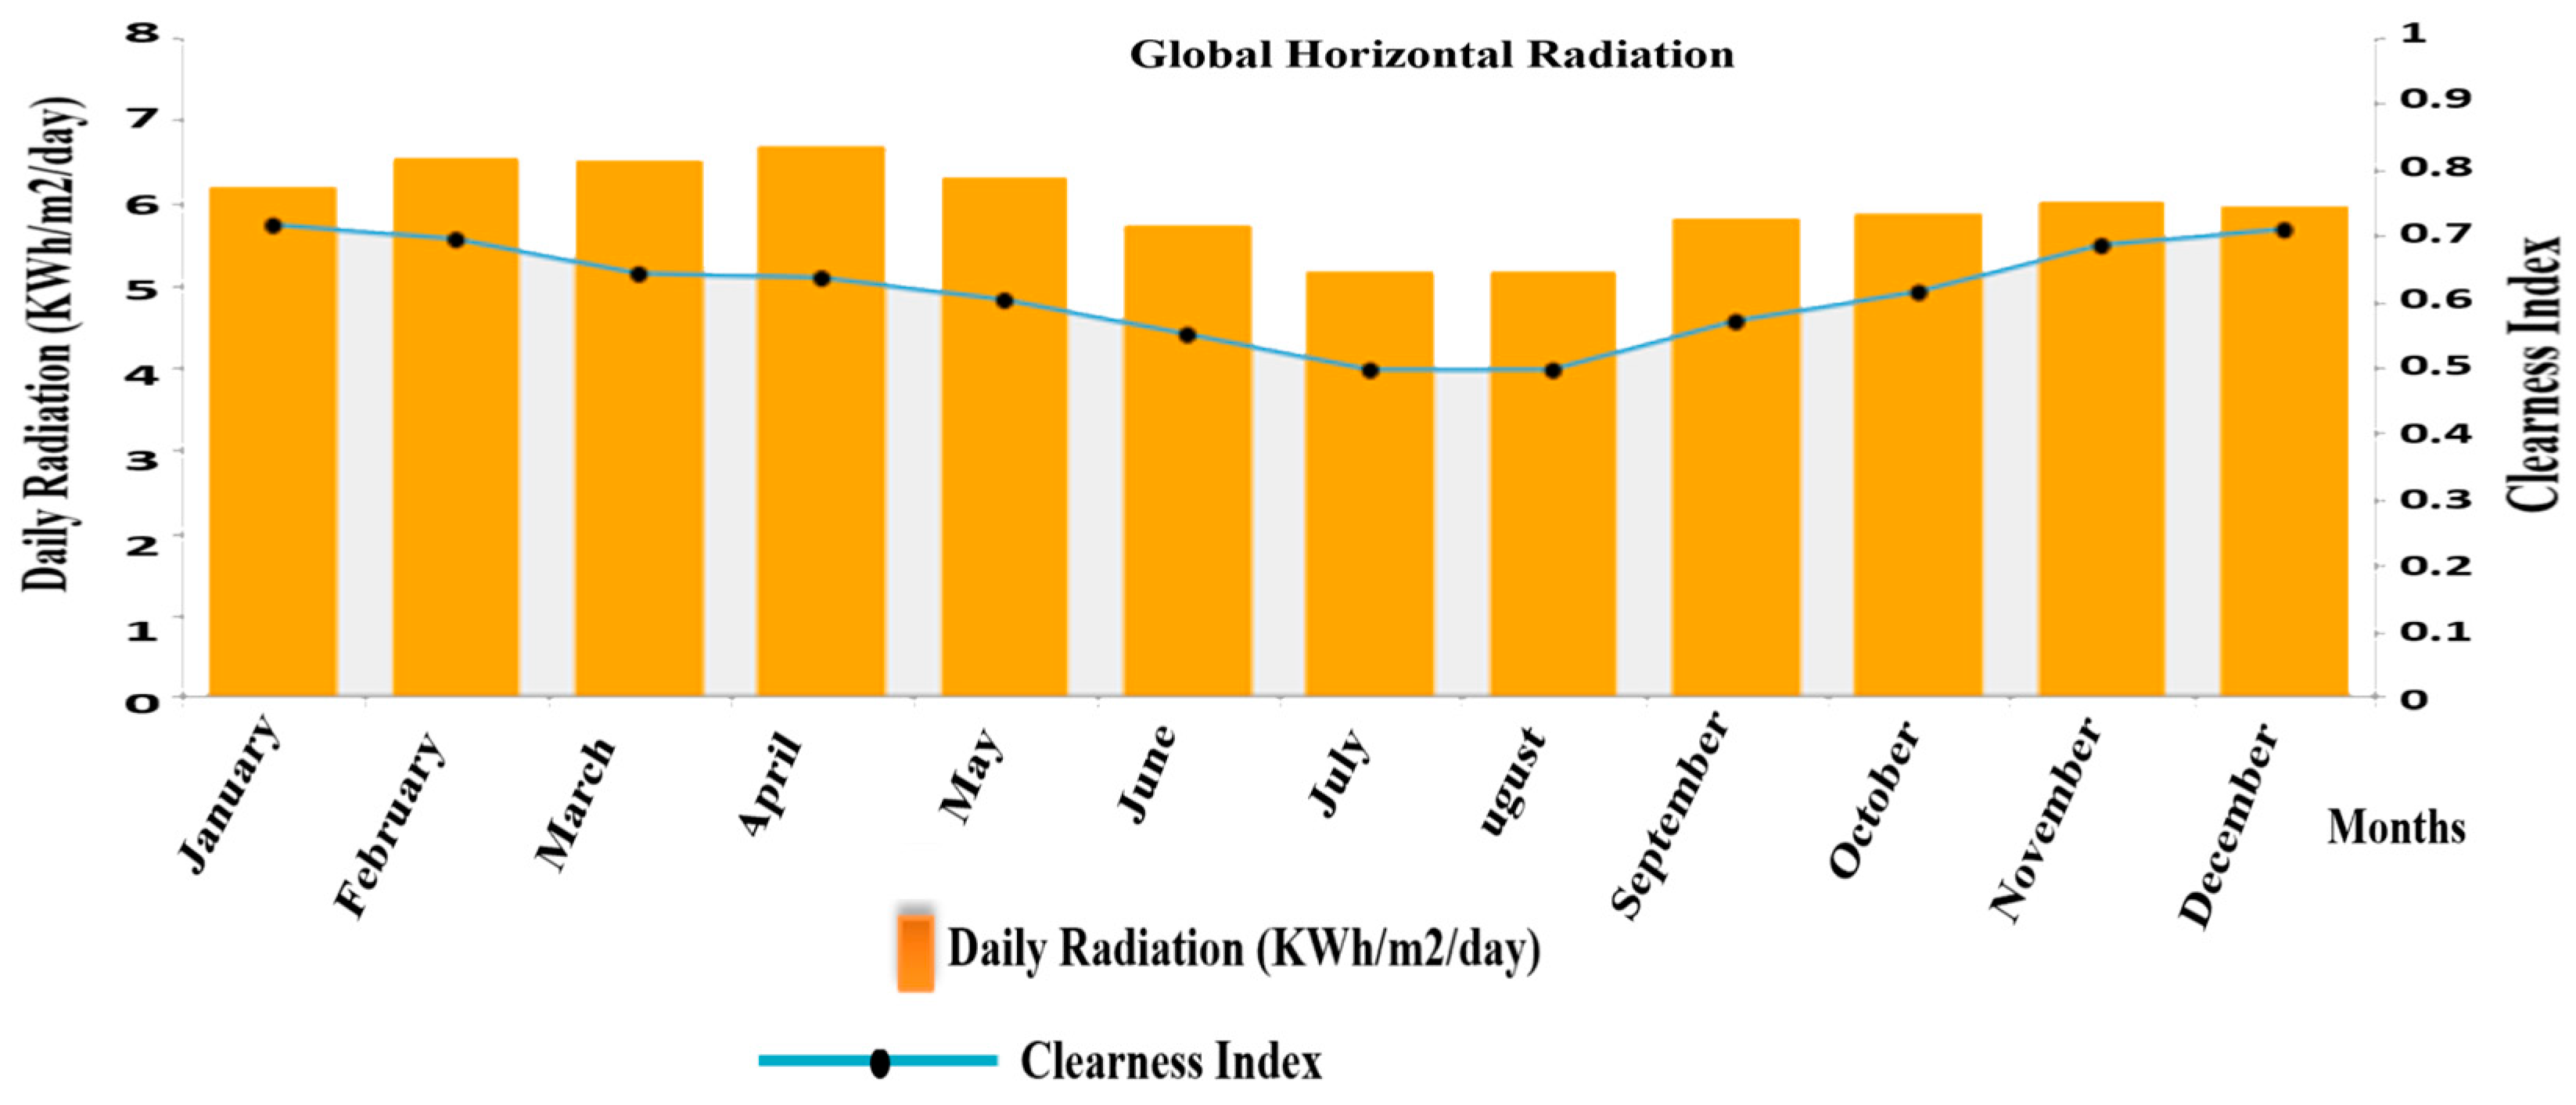
3.4.2. Solar PV Modules
As was described in the above sections, the solar radiation data were taken from the plant and NASA [
43]. Based on the data collected from the plant and analysis made, the average solar radiation of 5.8 kWh/m
2/day and clearness index of 0.6 was obtained as shown in
Figure 9. The clearness index is a measure of the clearness of the atmosphere, which is expressed by the fraction of the solar radiation that is transmitted through the atmosphere to strike the surface of the Earth.
The power output of this photovoltaic plant is dependent on the atmospheric and geographical conditions. The PV array power output (
PPV), can be calculated as:
where
IT is the solar radiation incident on the PV array in kW/m
2,
GPV stands for the PV rated capacity in kW,
fPV represents the derating factor of PV,
IT,STC represents the solar incident radiation at standard temperature conditions (STC) which is considered as 1 kW/m
2,
TC is the cell temperature of the
PV in °C,
αP is the temperature coefficient of power (%/°C), and
TC,STC is the cell temperature under STC (25 °C) of the PV [
44].
3.4.3. Grid System
The photovoltaic grid-connected system (PVGCS) under study operates with a grid to increase the reliability of the supply system. Therefore, the load is supposed to get its power whenever necessary. The electricity prices of the grid were considered as being $0.1/kWh and the grid net excess price considered was $0.05/kWh in the simulation for the case under study.
3.4.4. Battery
The Hoppecke 8OPzS800 lead-acid battery system existing at the plant is considered to supply the required energy when a power shortage occurs in the system. The excess electricity production in the microgrid is stored with a battery energy storage system and provides power to the load when an energy shortage occurs in the system. The energy stored in the battery is given by [
45]
where,
Bbat.0 denotes the initial battery charge while
Vbat and
Ibat are the voltage and current of the battery, respectively. The number of battery cells connected in series to attain the required voltage [
45] is
where
Vbus is the bus voltage of the microgrid system and
Vbat is the voltage rating of a single battery cell. In addition, the maximum charge/discharge power of a single battery is described as:
where
represents the maximum charging current of the battery in amperes [
46]. The battery consists of 24 strings connected in series, with each having 2 V and a total of 48 V.
3.4.5. Converter
The converter considered in this system is used as a bi-directional converter changing the direct current (DC) to alternating current (AC) electric power and vice versa. Its efficiency was assumed to be 95% for the size considered and the lifetime is up to 15 years. The size of this converter mainly depends on peak load demand (
) [
45]. The rating of this converter is given as:
where
stands for inverter efficiency [
46].
3.5. Parameter Formulation of System Economics
The economic viability of batteries and microgrid systems was evaluated based on the levelized cost of energy (LCOE) and the total net present cost (NPC) of the system.
3.5.1. Estimation of Net Present Cost (NPC)
The total sum of initial, replacement, operation, and maintenance costs including fuel cost minus the revenue provides the value of the total net present cost (NPC). The total
NPC was calculated as
where
CRF(
i,n) represents the capital recovery factor while
n and
i represent the number of years and the real annual interest rate, respectively [
45]. The capital recovery factor is also defined as:
where
,
inom stands for the nominal interest rate, and
f represents the yearly inflation rate.
3.5.2. Estimation of Cost of Energy (COE)
The cost of energy (COE) is among the main parameters used for evaluating the economic effectiveness of a given energy system. The COE is defined as the annual cost of all system components divided by total of generated energy [
47]. The
COE is given by
ES is the yearly energy supplied and
CA is the total annual cost [
45]. The total annual cost is the sum of operation and maintenance cost, capital cost, and replacement cost.
5. Discussion
In this paper, a techno-economic optimization study of the PVGCS system was conducted based on the data collected at the existing plant, together with meteorology sources and software-based simulation outputs. The dynamic response of the plant was studied using the Matlab/Simulink environment and furthermore, the techno-economic aspects were analyzed using hybrid optimization model for electric renewables (HOMER) software. As indicated in
Figure 10, the performance assessment of the existing plant was analyzed using the radiation, temperature data, and corresponding performance evaluation indices. Accordingly, the meteorological data gathered were found to be coherent with that of the plant data acquisition system and this made the performance evaluation of the PV plant more effective.
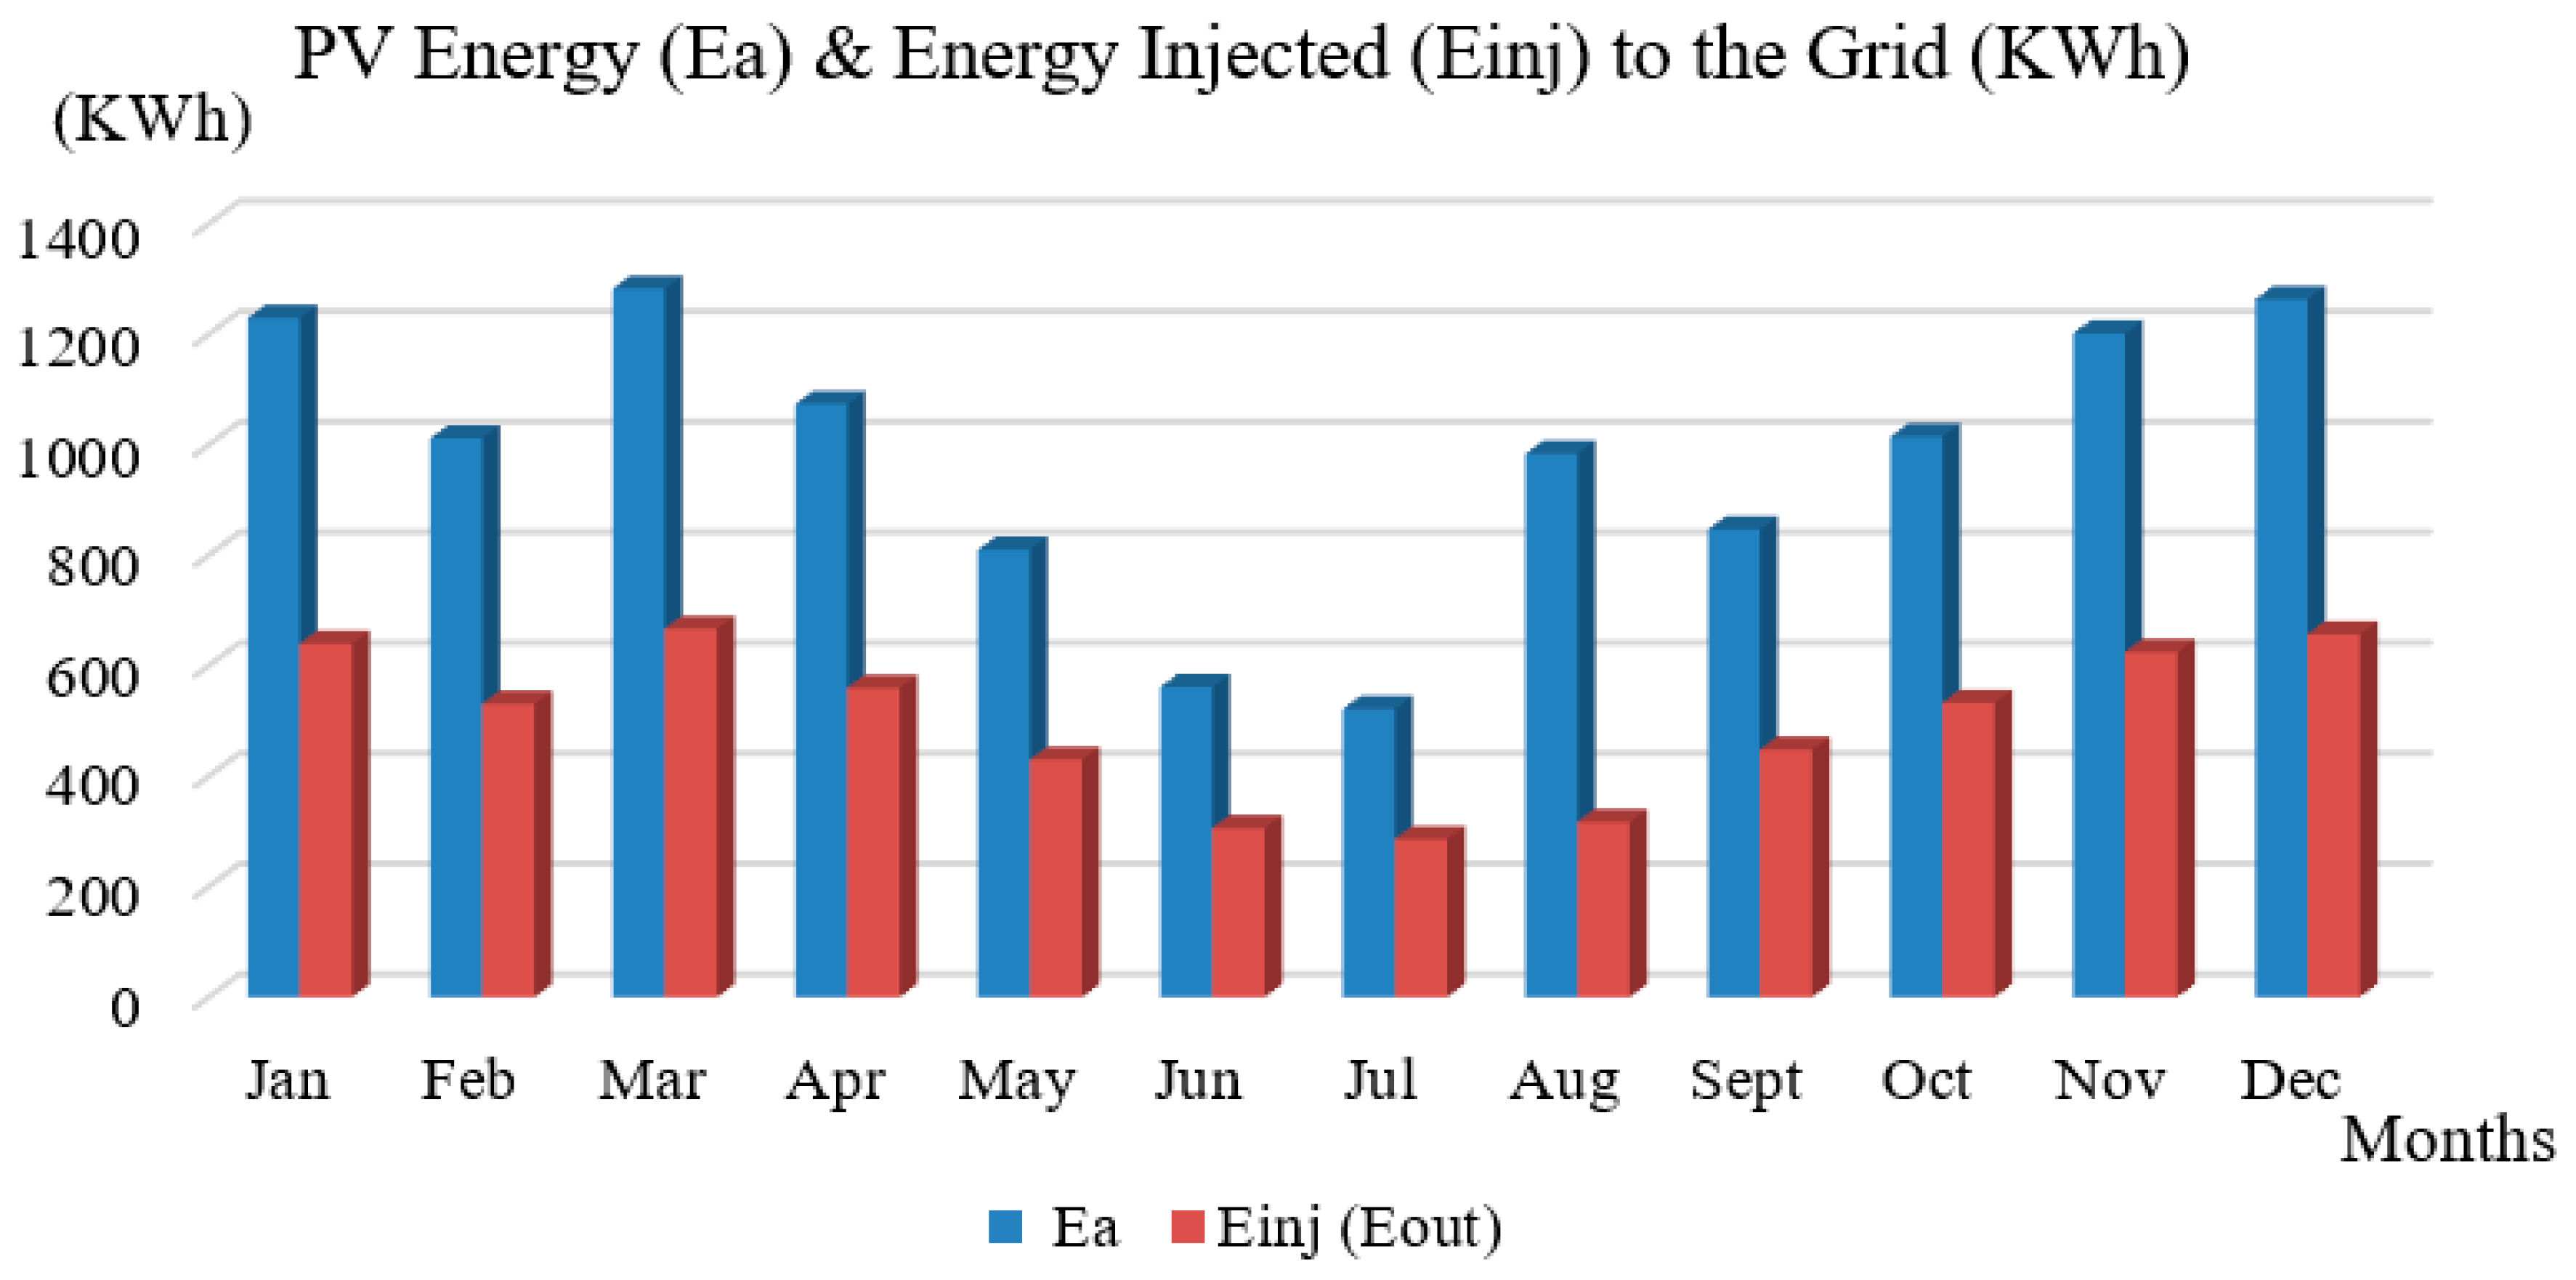
Figure 11 illustrates that the total annual energy produced by the PV array is 11,805 kWh, which varies from a minimum production of 561.8 kWh in July to a maximum of 1283 kWh in March. From the total energy produced, the yearly average energy fed into the grid in one year was approximately 5277 kWh and the rest was supplied to the load. The difference between the two columns in
Figure 11 gives an approximation of the energy consumed by the load, which ranges from 236 kWh to 616 kWh per month.
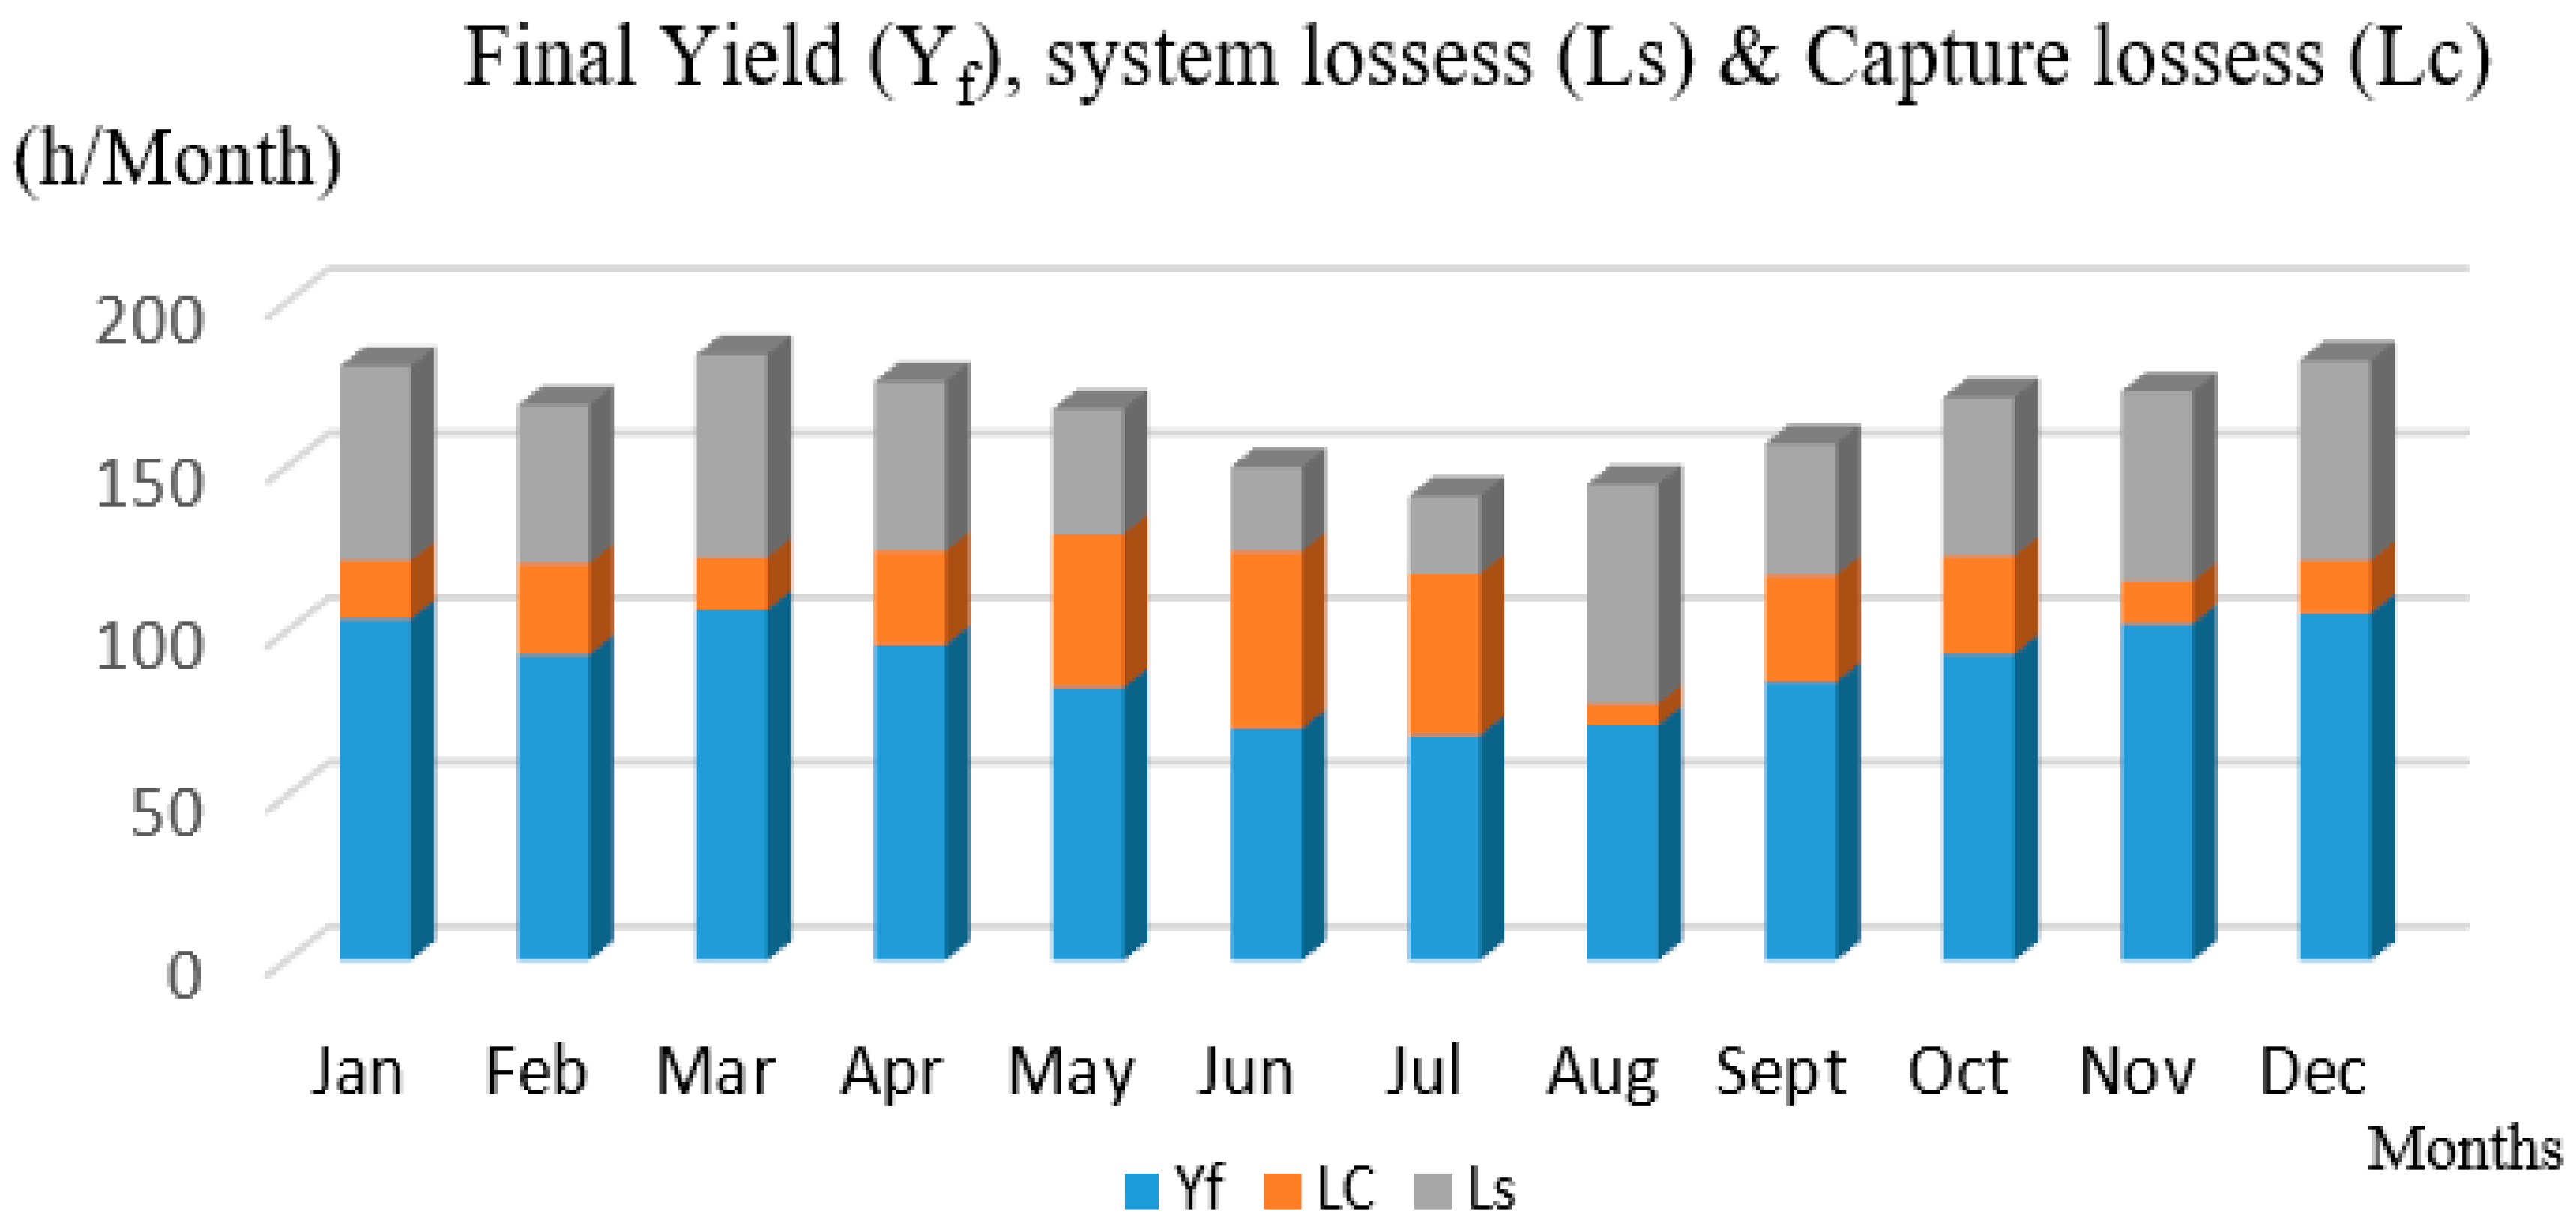
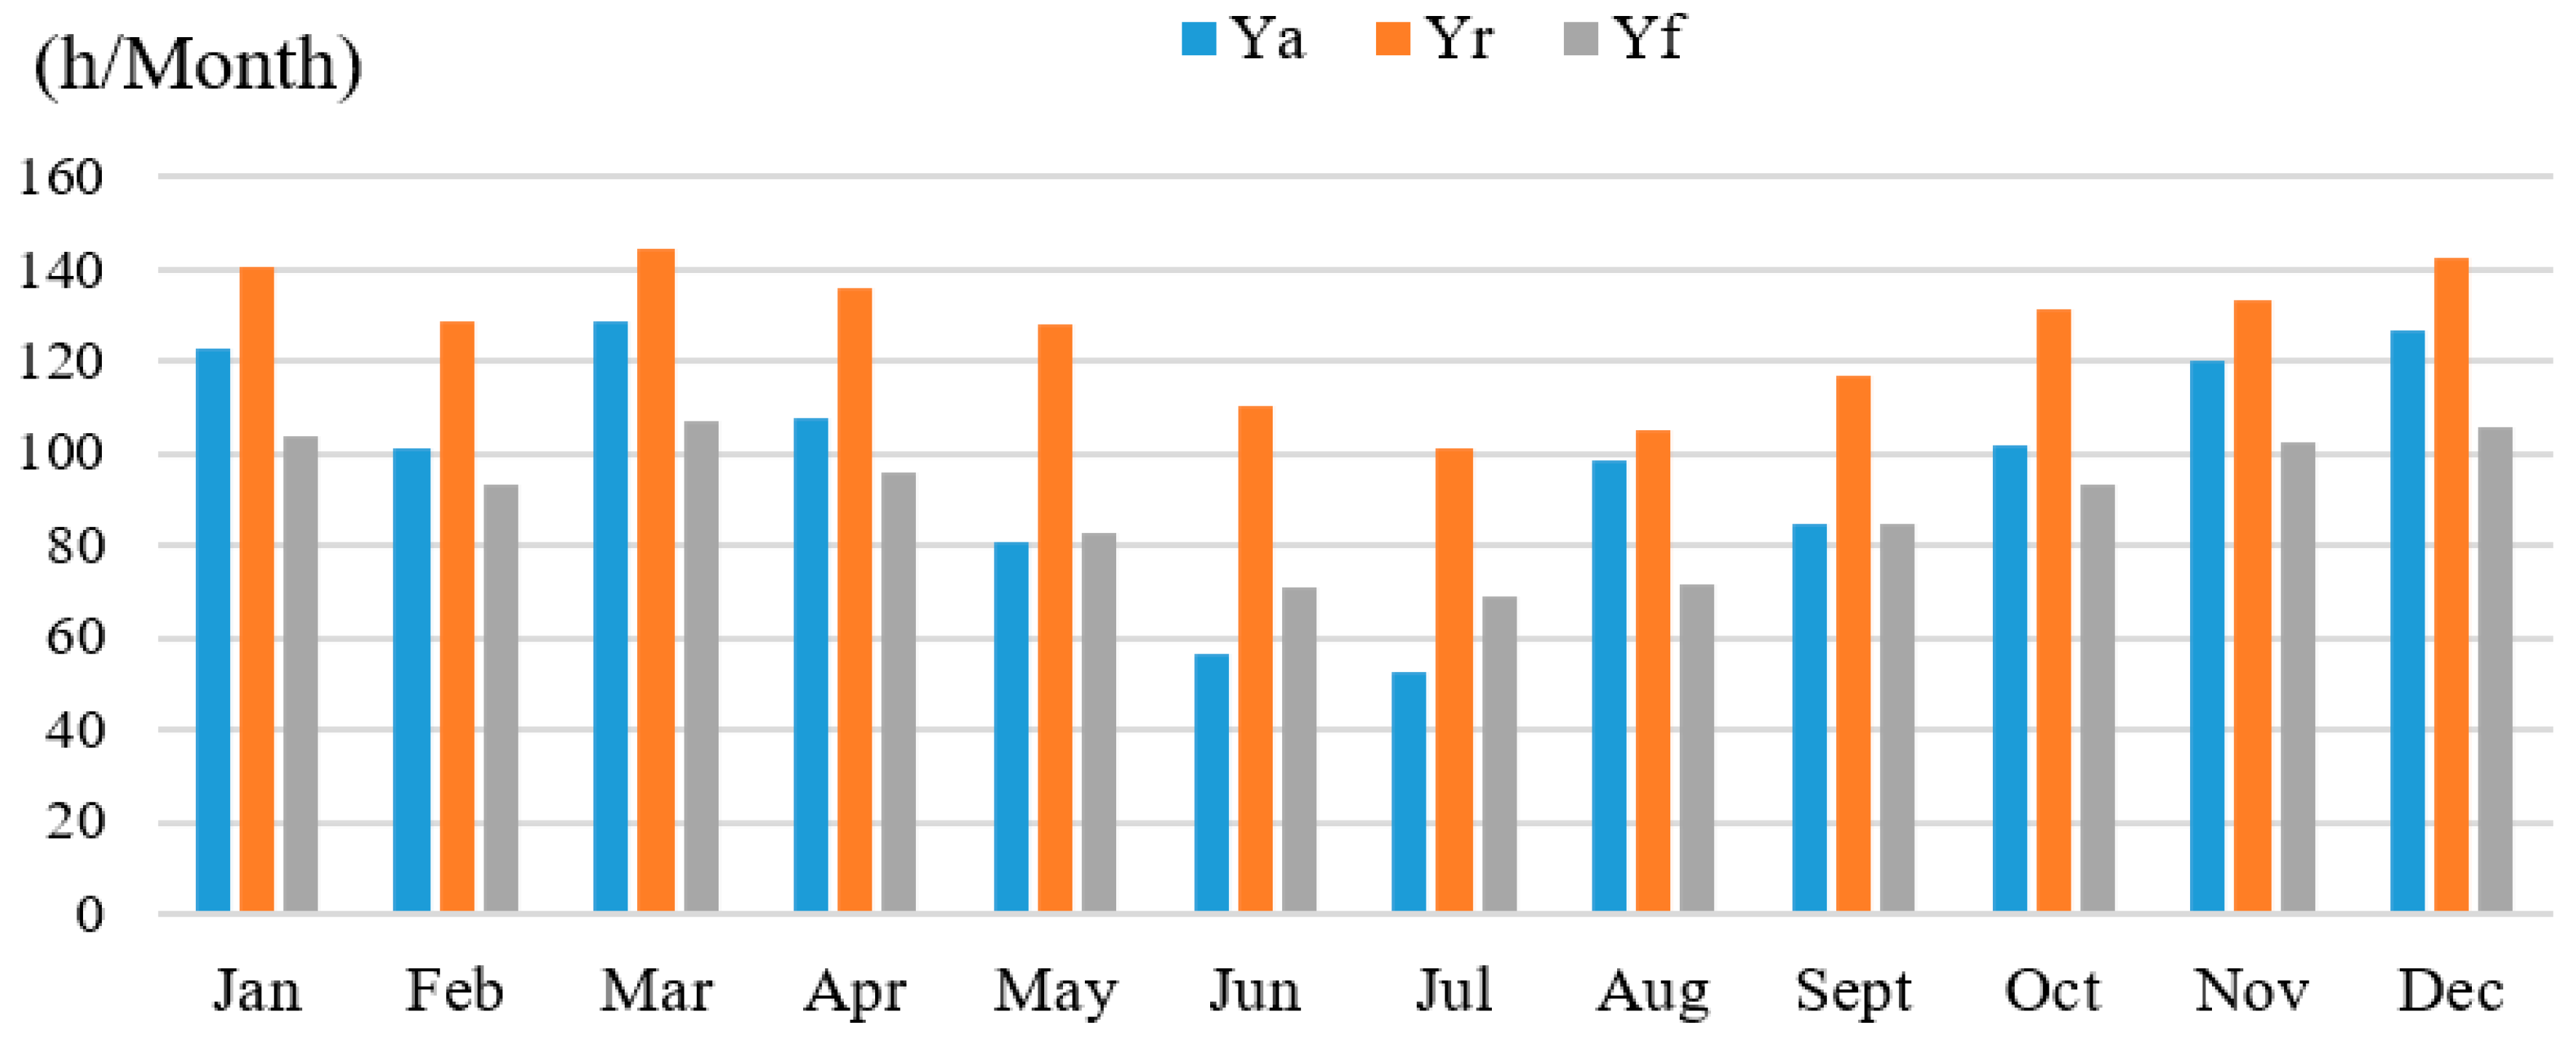
After analysis of the energy production by the source and respective load consumptions, the months of highest and lowest operating hours of energy production were identified as illustrated in
Figure 12. Hence, it was found that the PV array yield (Y
a) operated for 56 h/month or kWh/kWp in June and about 128 h/month during March, when the temperature average was around 25 °C. For the reference yield (Yr), the maximum hours of operation at standard conditions were observed during the months of December, January, and March with 142, 140, and 144 h, respectively. The final yield (Y
F) should be equal to the number of hours that the PV plant must operate at a nominal power of P
0 = 10 kWp in order to produce the daily energy quantity injected into the grid. The number of hours of operation in the month of July was 58 h/month and the equivalent was 96 h/month (kWh/kWp) in March.
In addition to the production aspects, the system’s losses were investigated as indicated in
Figure 13. For the capture losses (Lc), it can be observed that May, June, and July were found to be the months where the highest losses were attained with values of 46, 54, and 49 h/month, respectively. This was commonly caused by the ambient temperature and excessively long wires across the entire plant. On the other hand, system losses (Ls) were more commonly observed in December, March, and August with losses of 60, 61, and 67 h/month, respectively. Such losses mainly occurred due to the higher overheating of inverters.
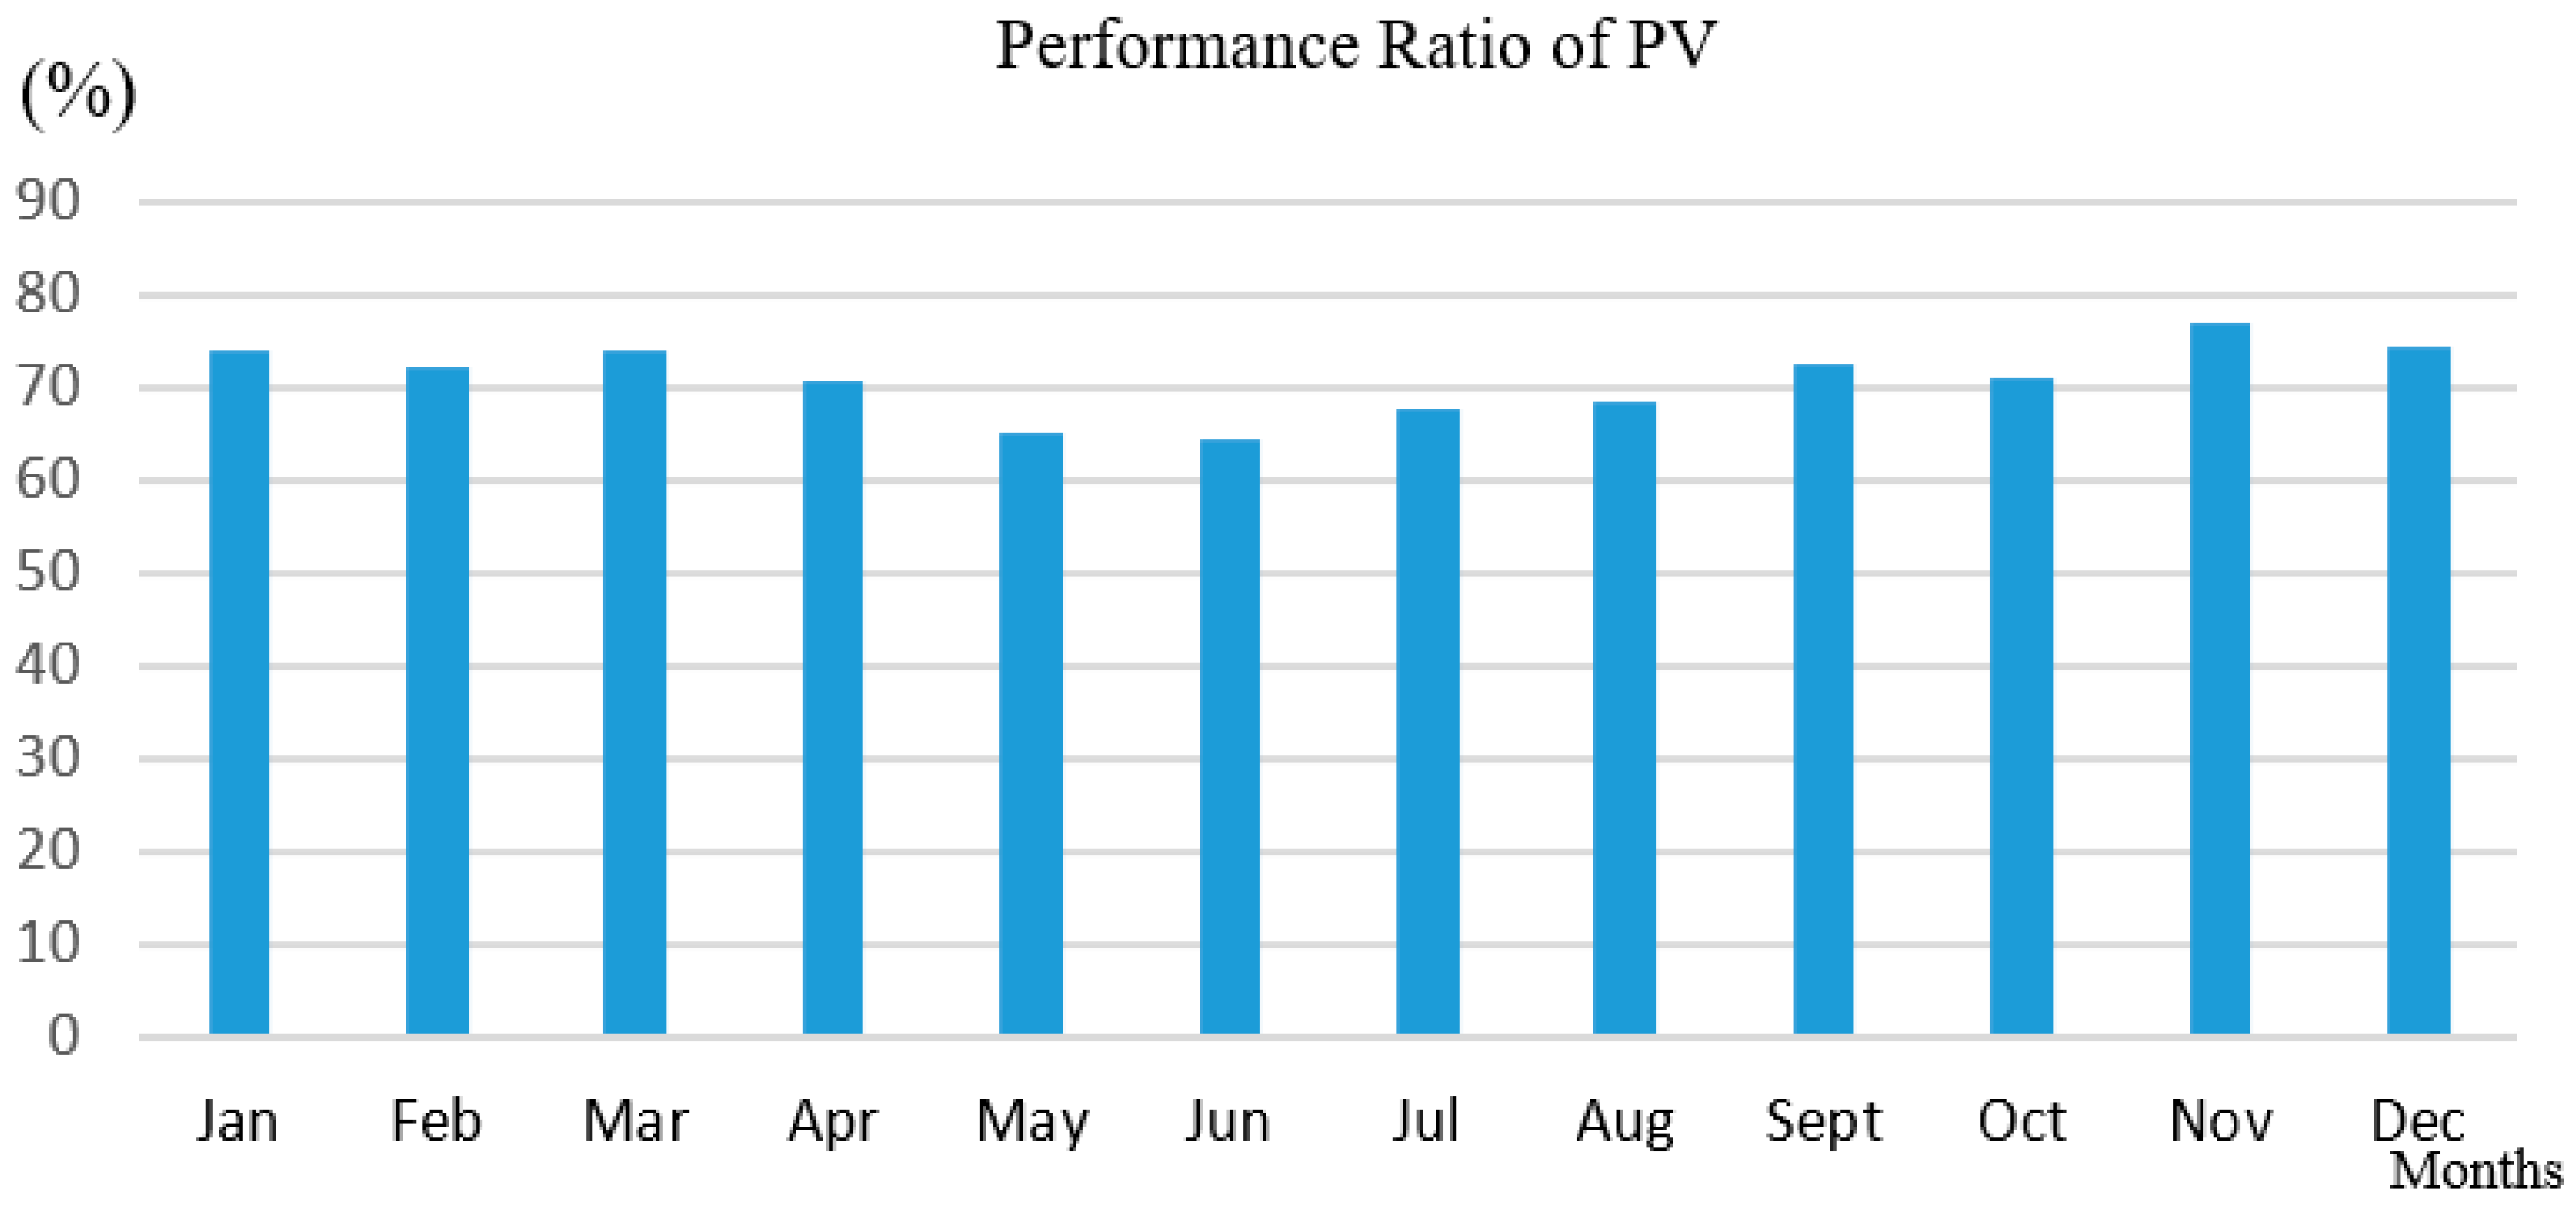
Evaluation of the PV plant performance ratio was also performed to identify the plant’s operational efficiency; the ratio was found to be between 64% in June and 74% in the month of March, as indicated in
Figure 14. This shows that the system is energy efficient with a system efficiency range of 9.3% to 10.7%. The results of the performance ratio and efficiency indicate that the PVGCS plant can be categorized as a well performing plant, as its overall performance ratio values were in the range of permissible limits as compared to the values observed in other countries that are summarized in
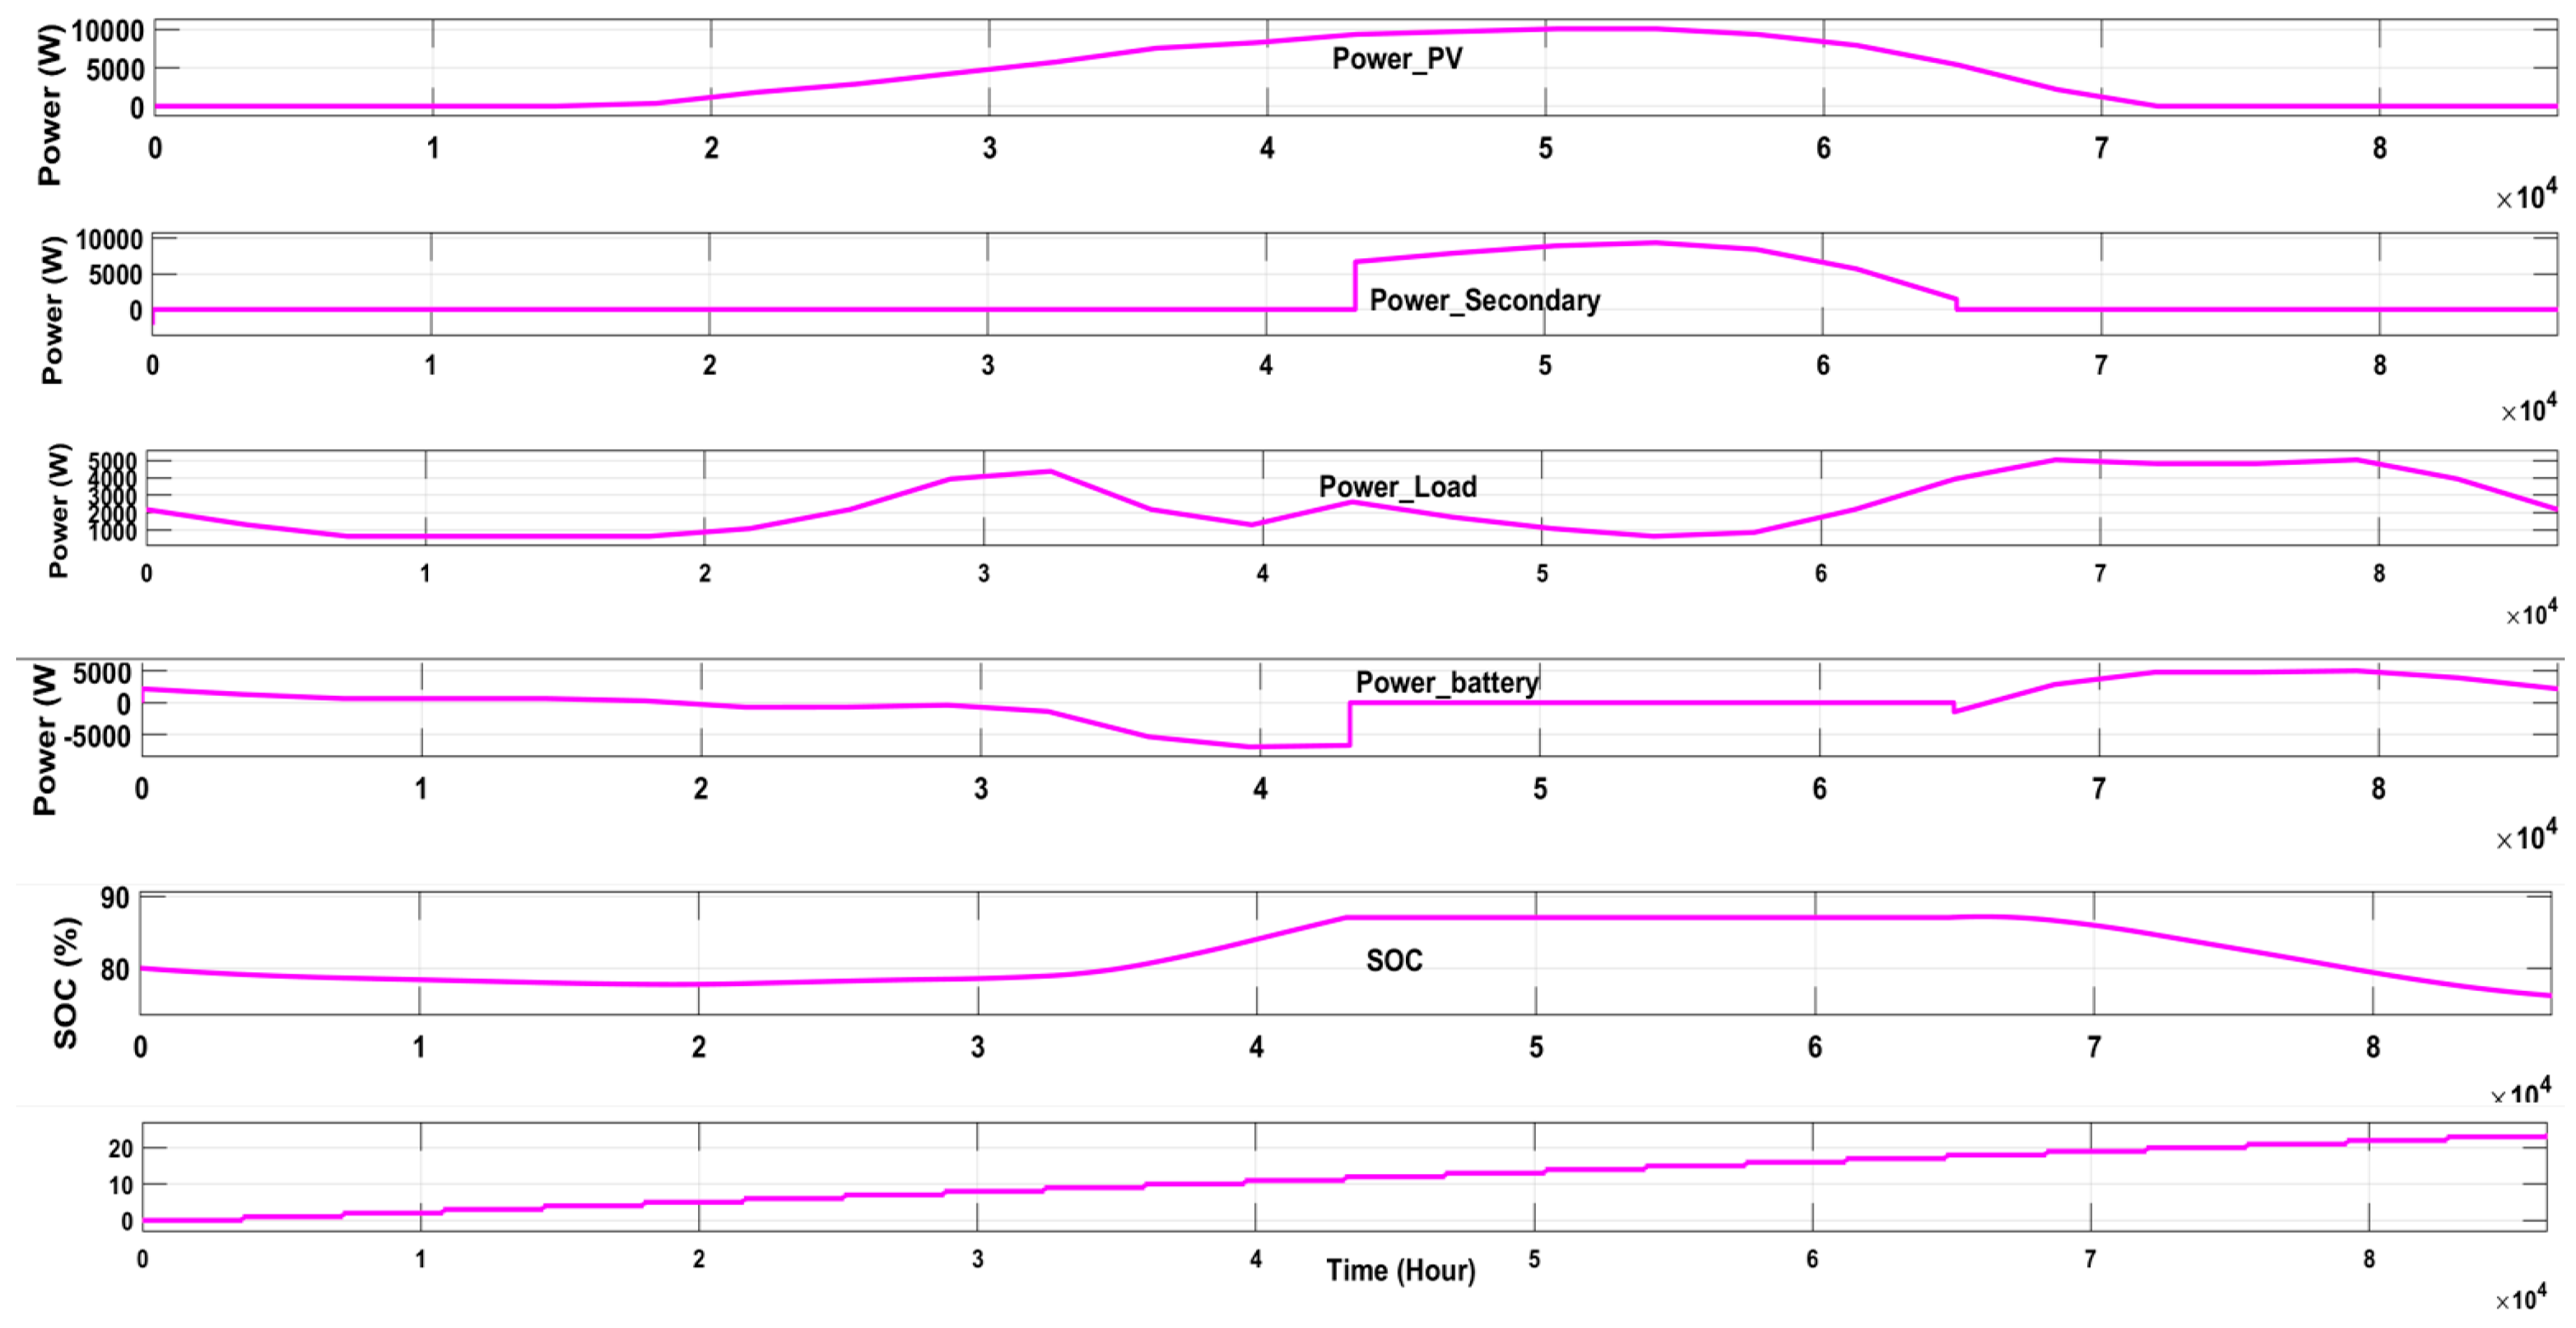
Table 1. The plant dynamics response was also evaluated using Matlab software, as indicated in
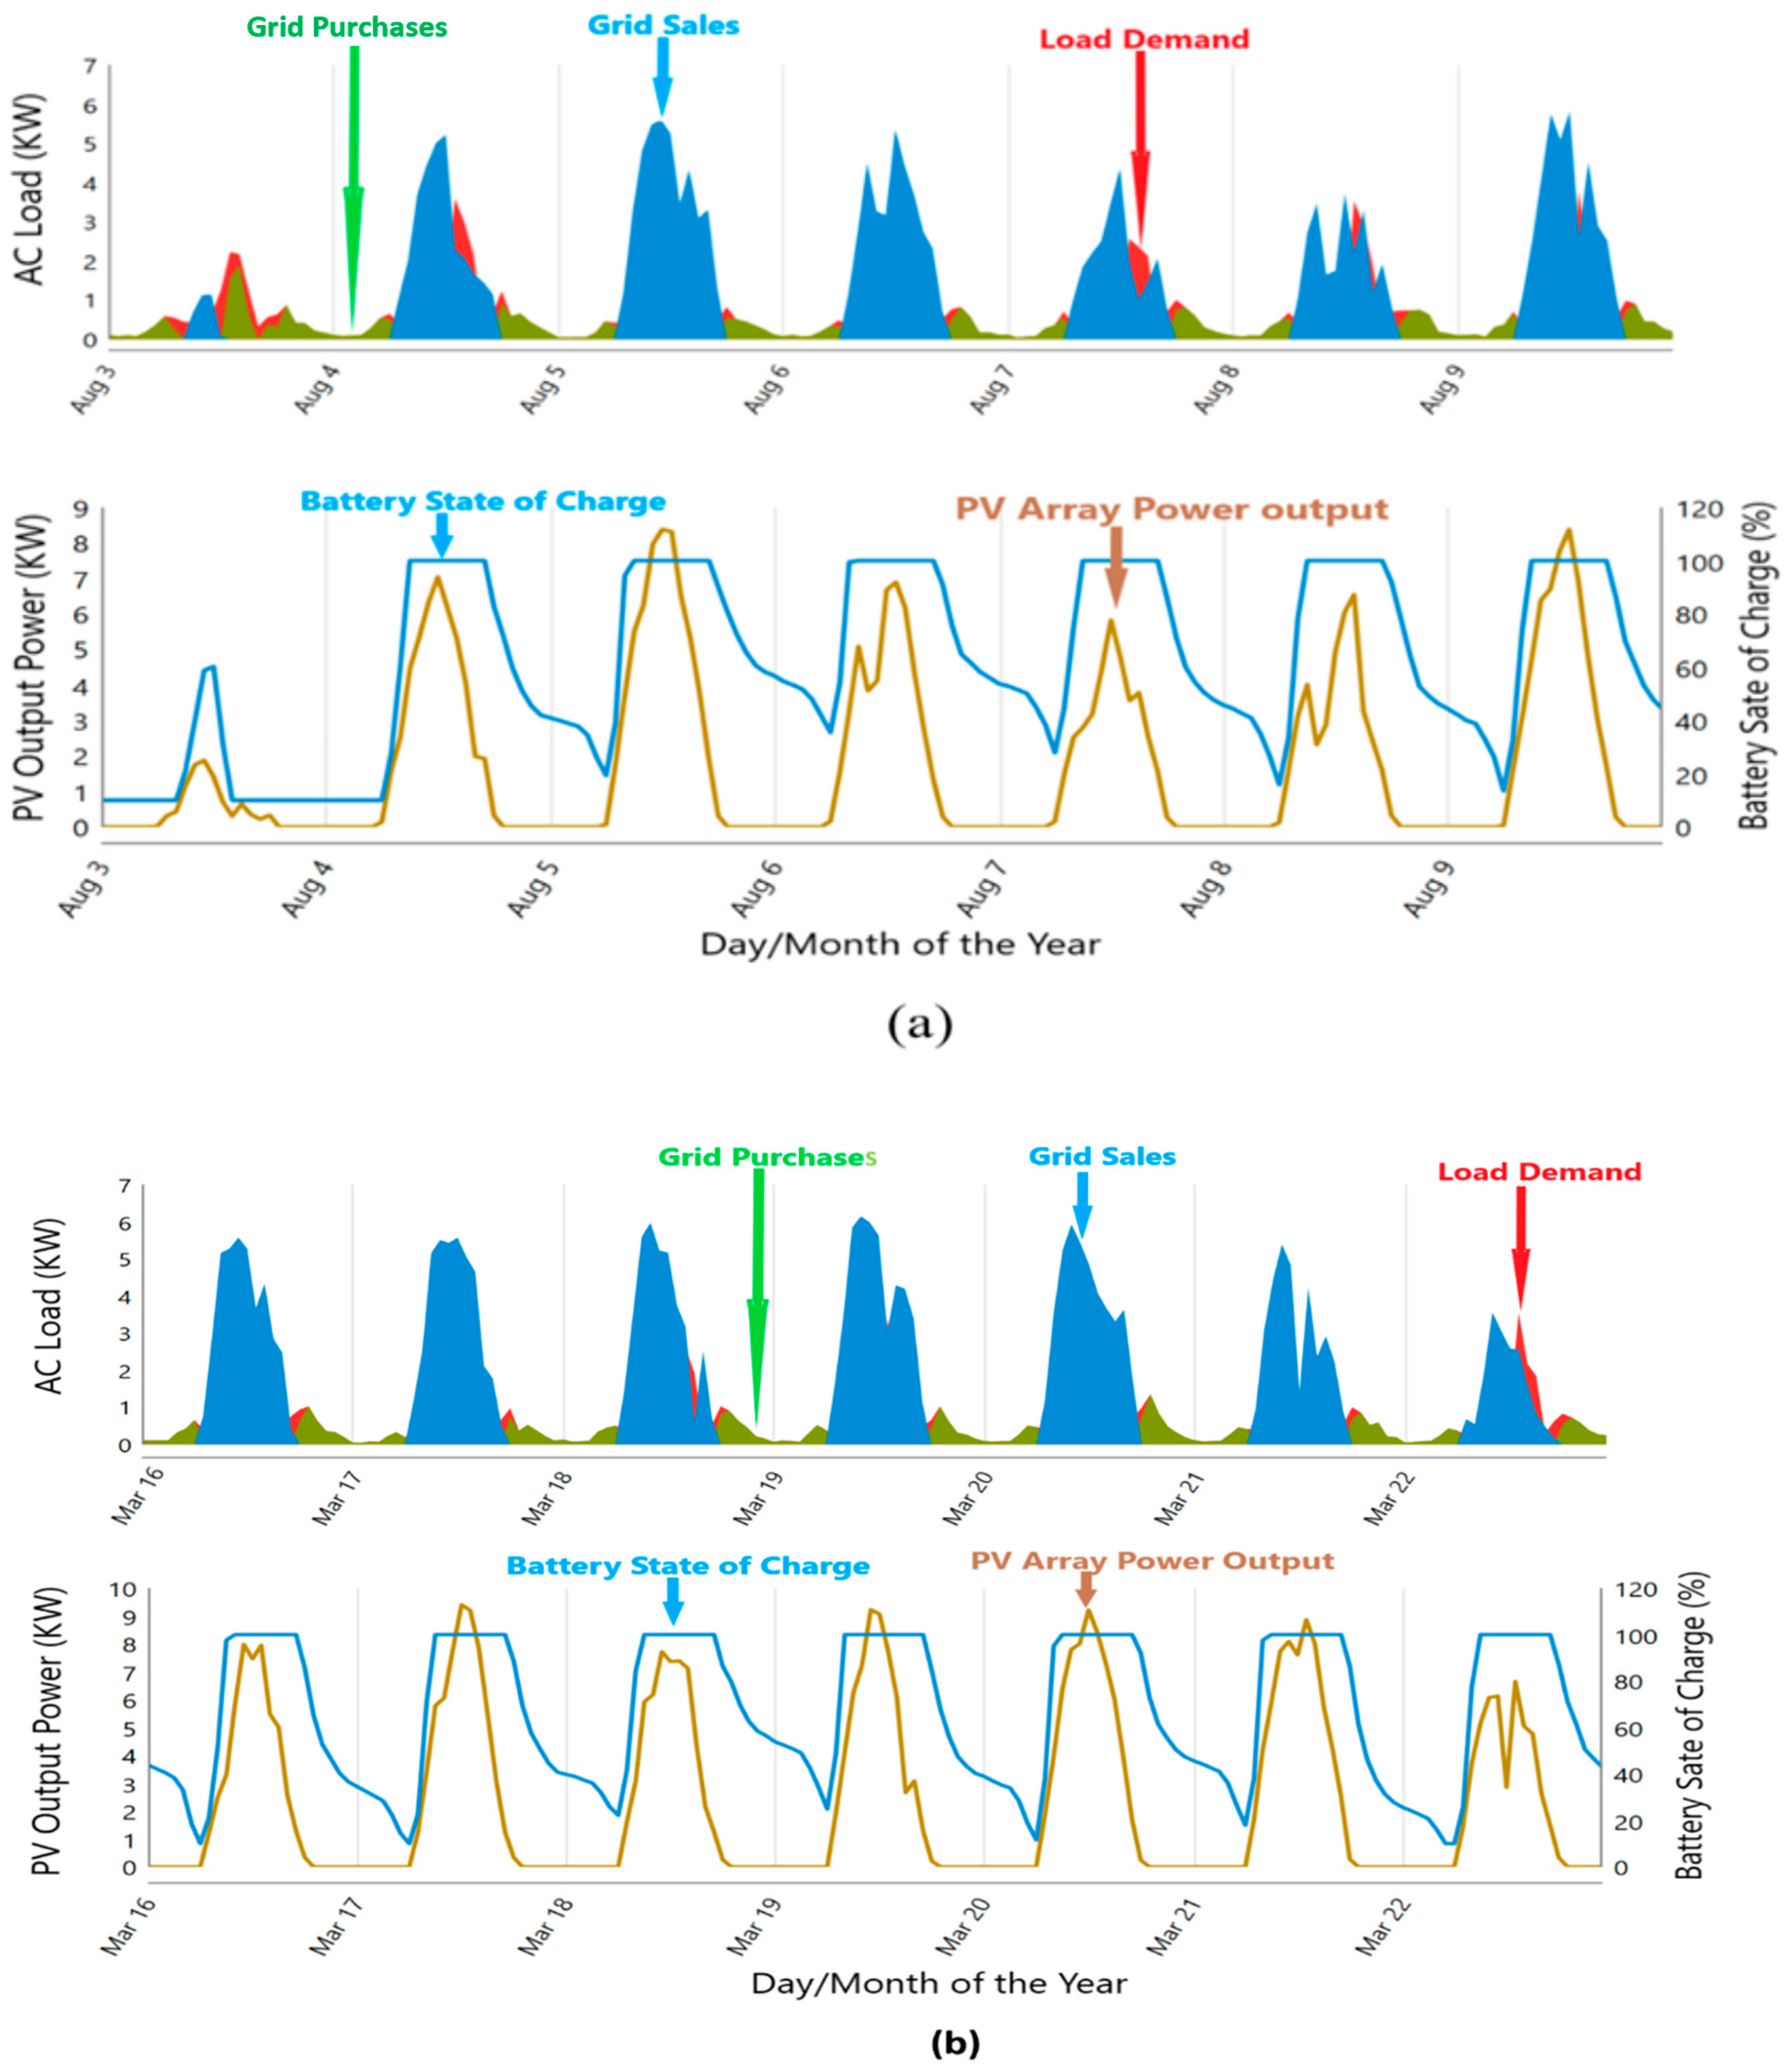
Figure 15. It showed the results of power production and battery response to be coherent with the plant output data. Hence, it showed that the plant dynamic response is good enough. In addition to charging the battery, the excess power from the PV plant is also sold to the grid based on an annual net metering system, which in turn reduces the average cost of electricity. The demand and output power delivered by the PV is shown in
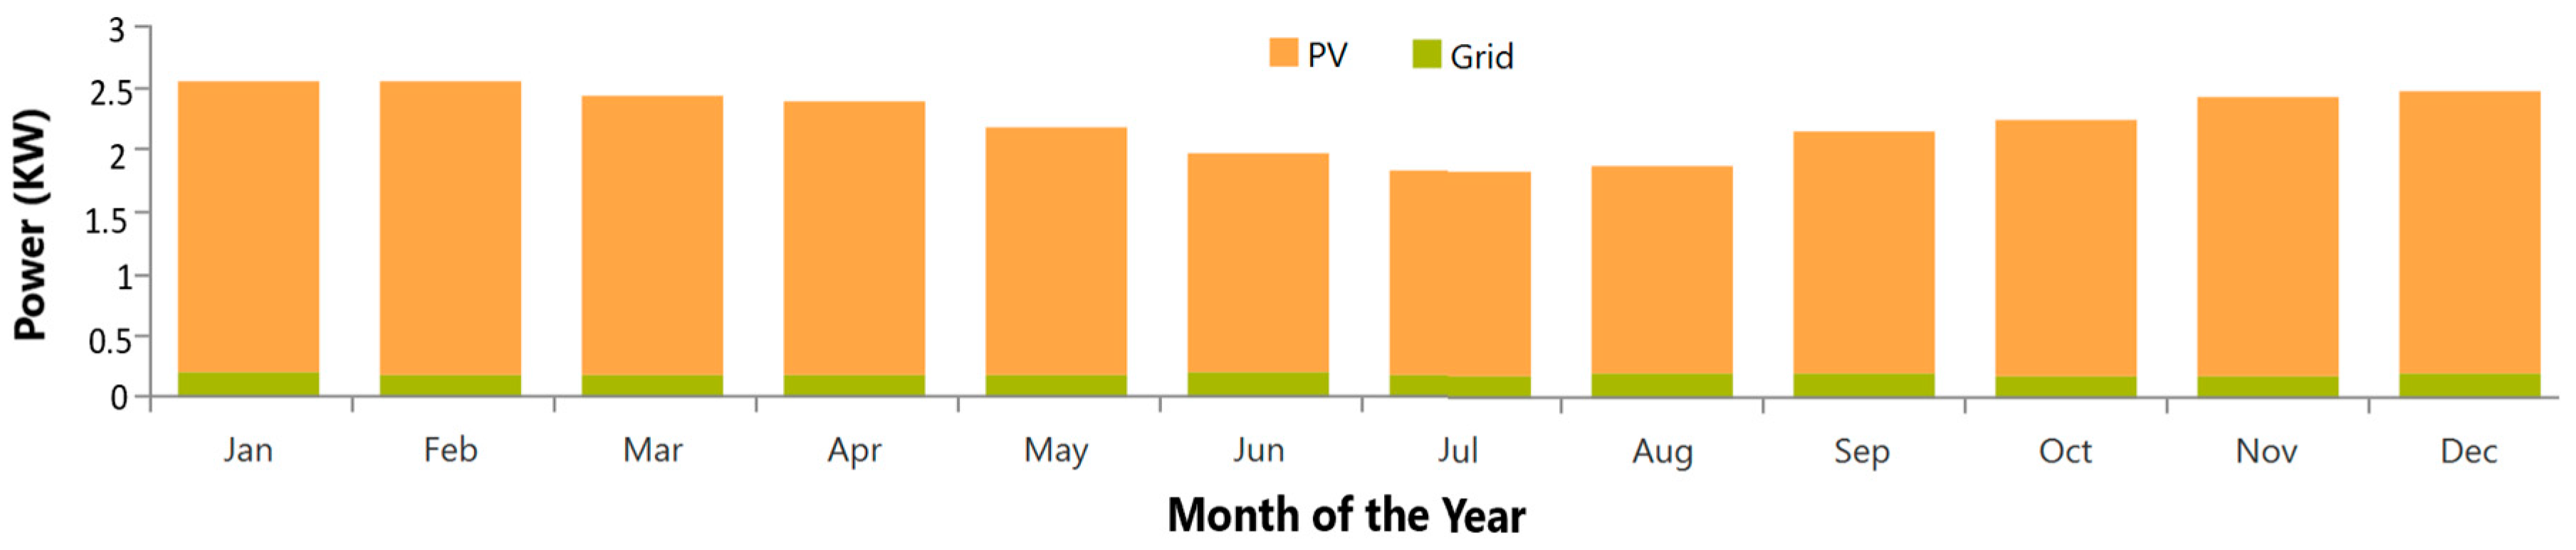
Figure 16 for typical months. In addition, the power supplied by the PV and the battery state of charge are also illustrated. The PV power generation, the grid purchases and sales, demand profile, and battery state of charge were assessed for the months of August and March to see the minimum and maximum production in line with the effect of resource availability. The energy production of the PV and grid components considered in the PVGCS are also presented at
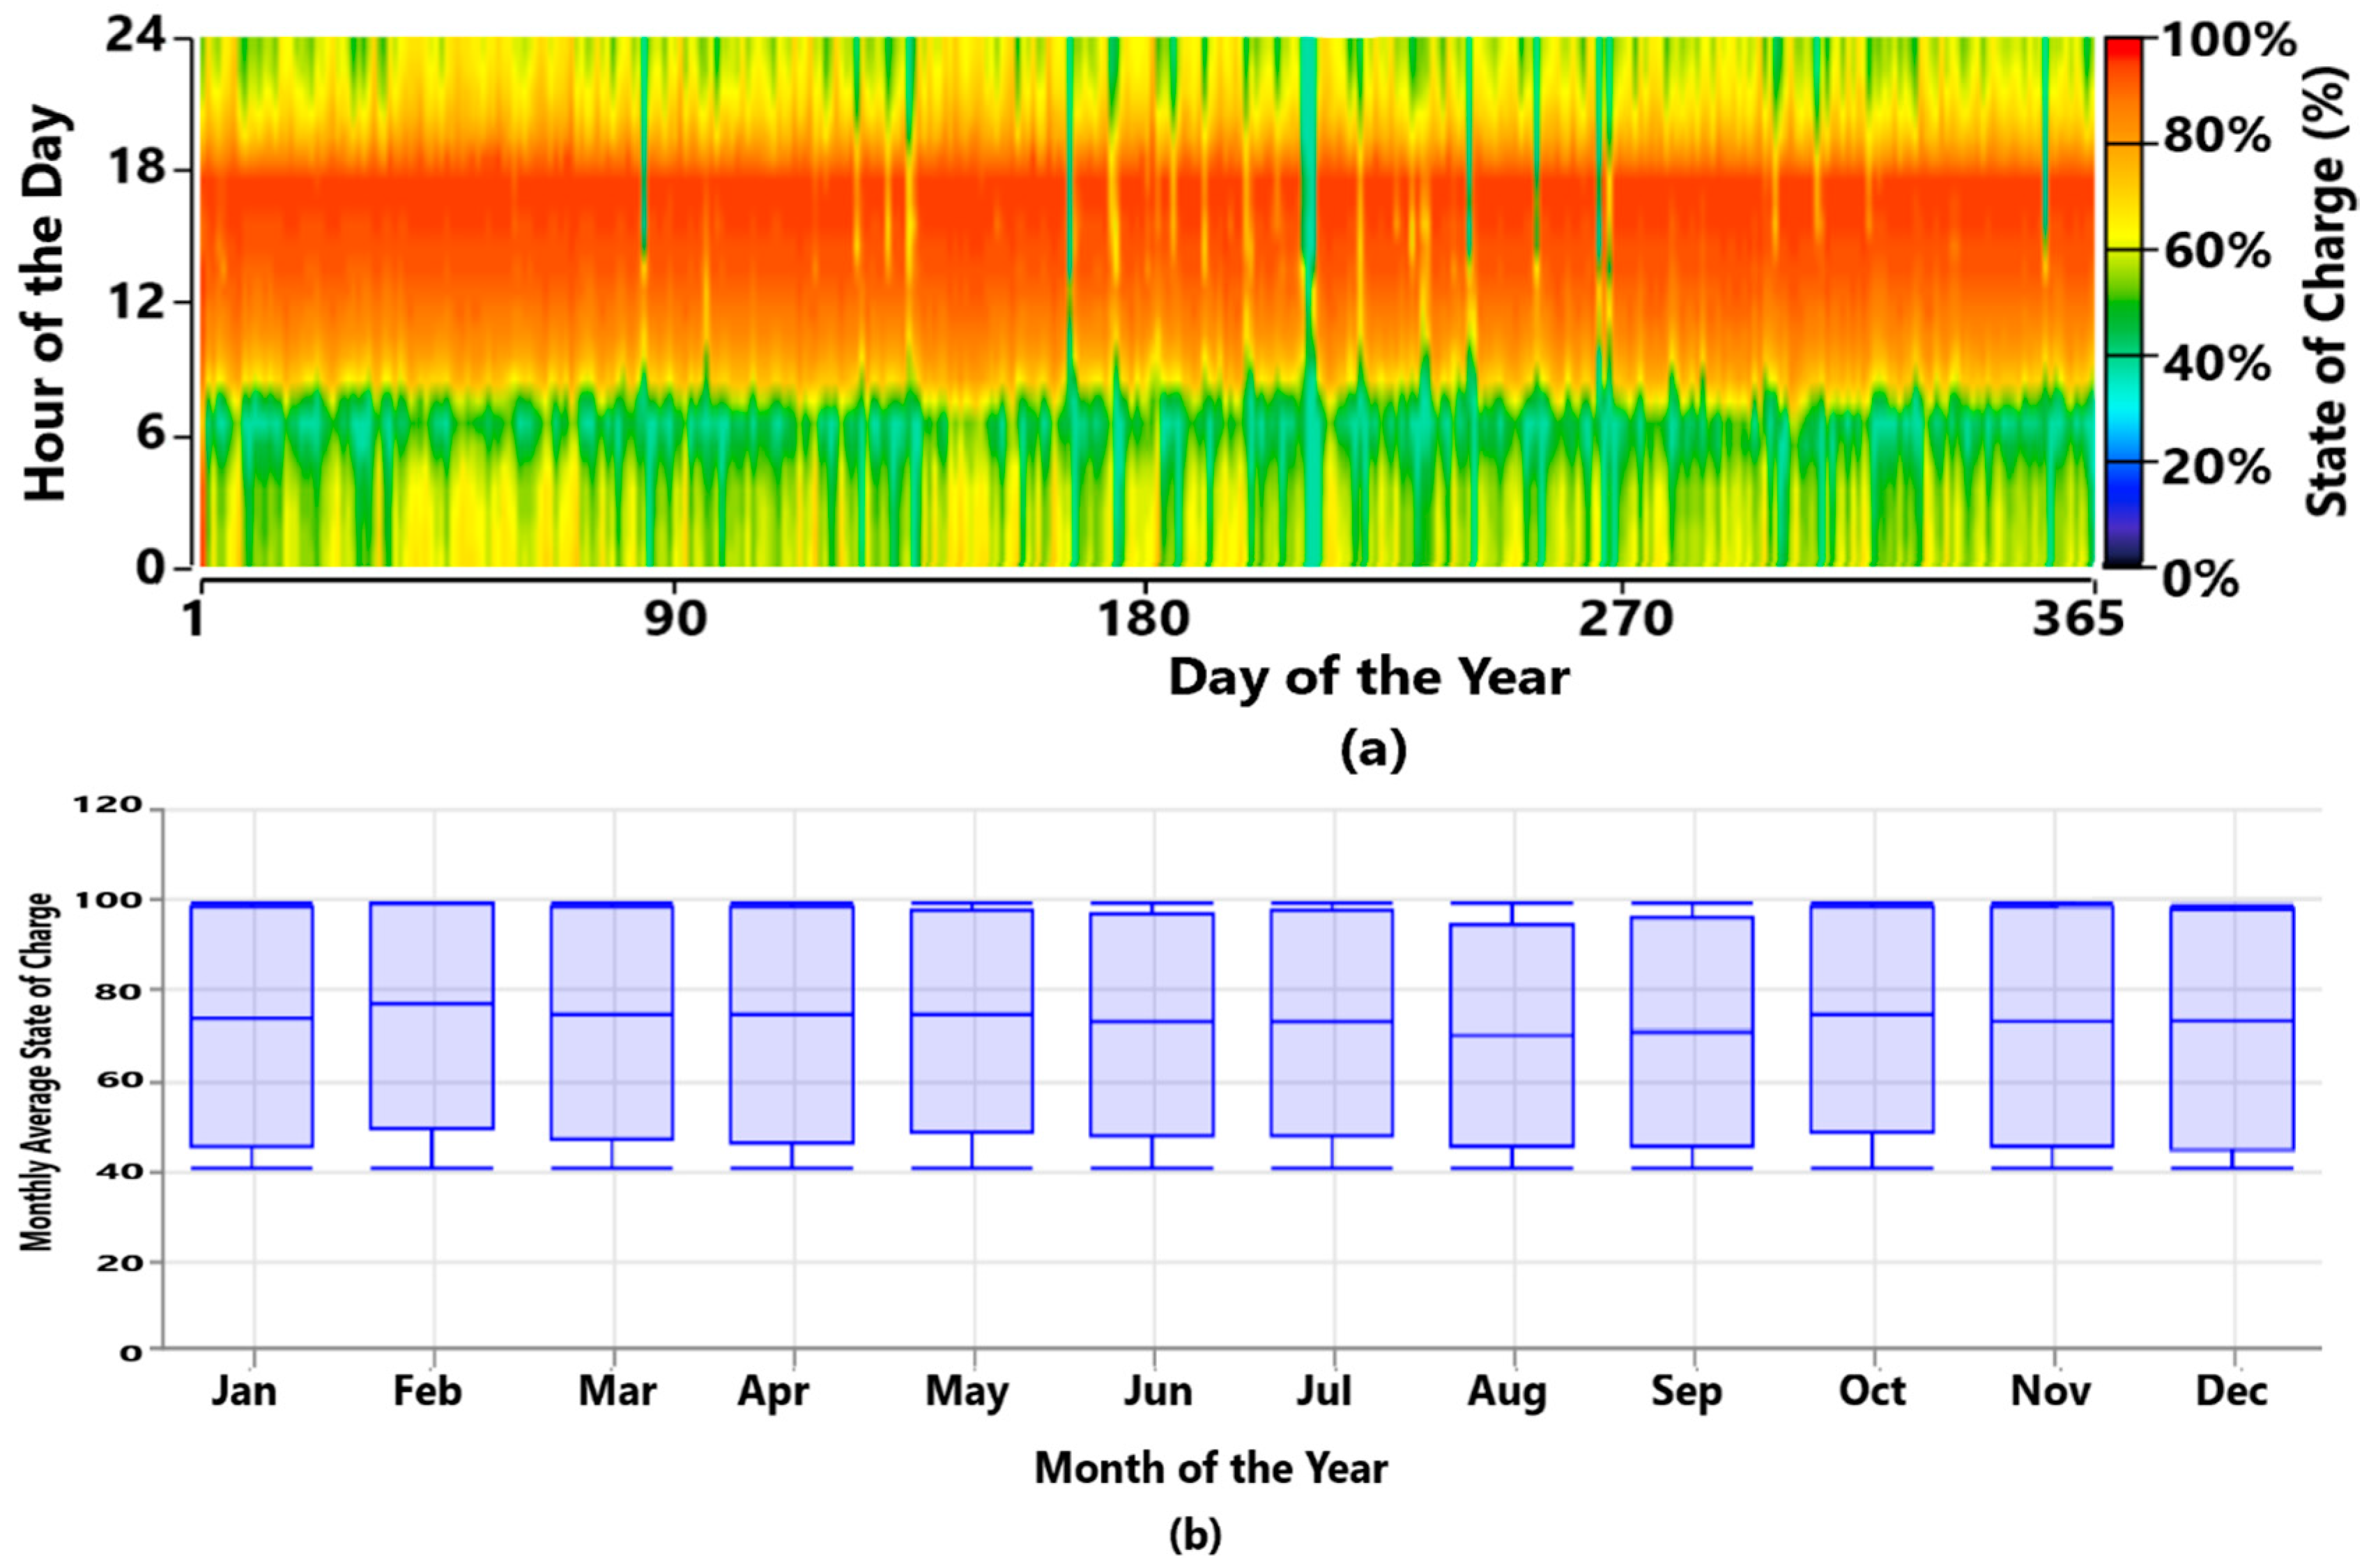
Figure 17. Due to the high irradiance availability at the site where the plant is installed, the PV array took the lead for electricity production throughout the year compared to the grid. The average state of charge (SOC) output of the lead-acid battery is illustrated in
Figure 18. In addition to the technical scenario, the economic aspect of the PVGCS system was analyzed using hybrid optimization model for electric renewables (HOMER) software. As observed from
Table 4, for the existing 10 kWp PV system, the yearly electricity production of 11,812 kWh/Year from PV and 521 kWh/Year from grid (power_secondary) purchases provides a total supply of 12,333 kWh/Year. On the other hand, the electricity consumption of 5840 kWh/Year from AC primary load and 5292 kWh/Year of consumption from grid sales provides a total consumption of 11,132 kWh/Year.
Furthermore, for the case of an optimized 5 kWp PV System, yearly electricity production of 5906 kWh/Year from PV and 976 kWh/Year from grid purchase provides a total supply of 6882 kWh/Year. On the other hand, the electricity consumption of 5840 kWh/Year from AC primary load and 1012 kWh/Year from grid sales provides a total consumption of 6852 kWh/Year, as indicated in
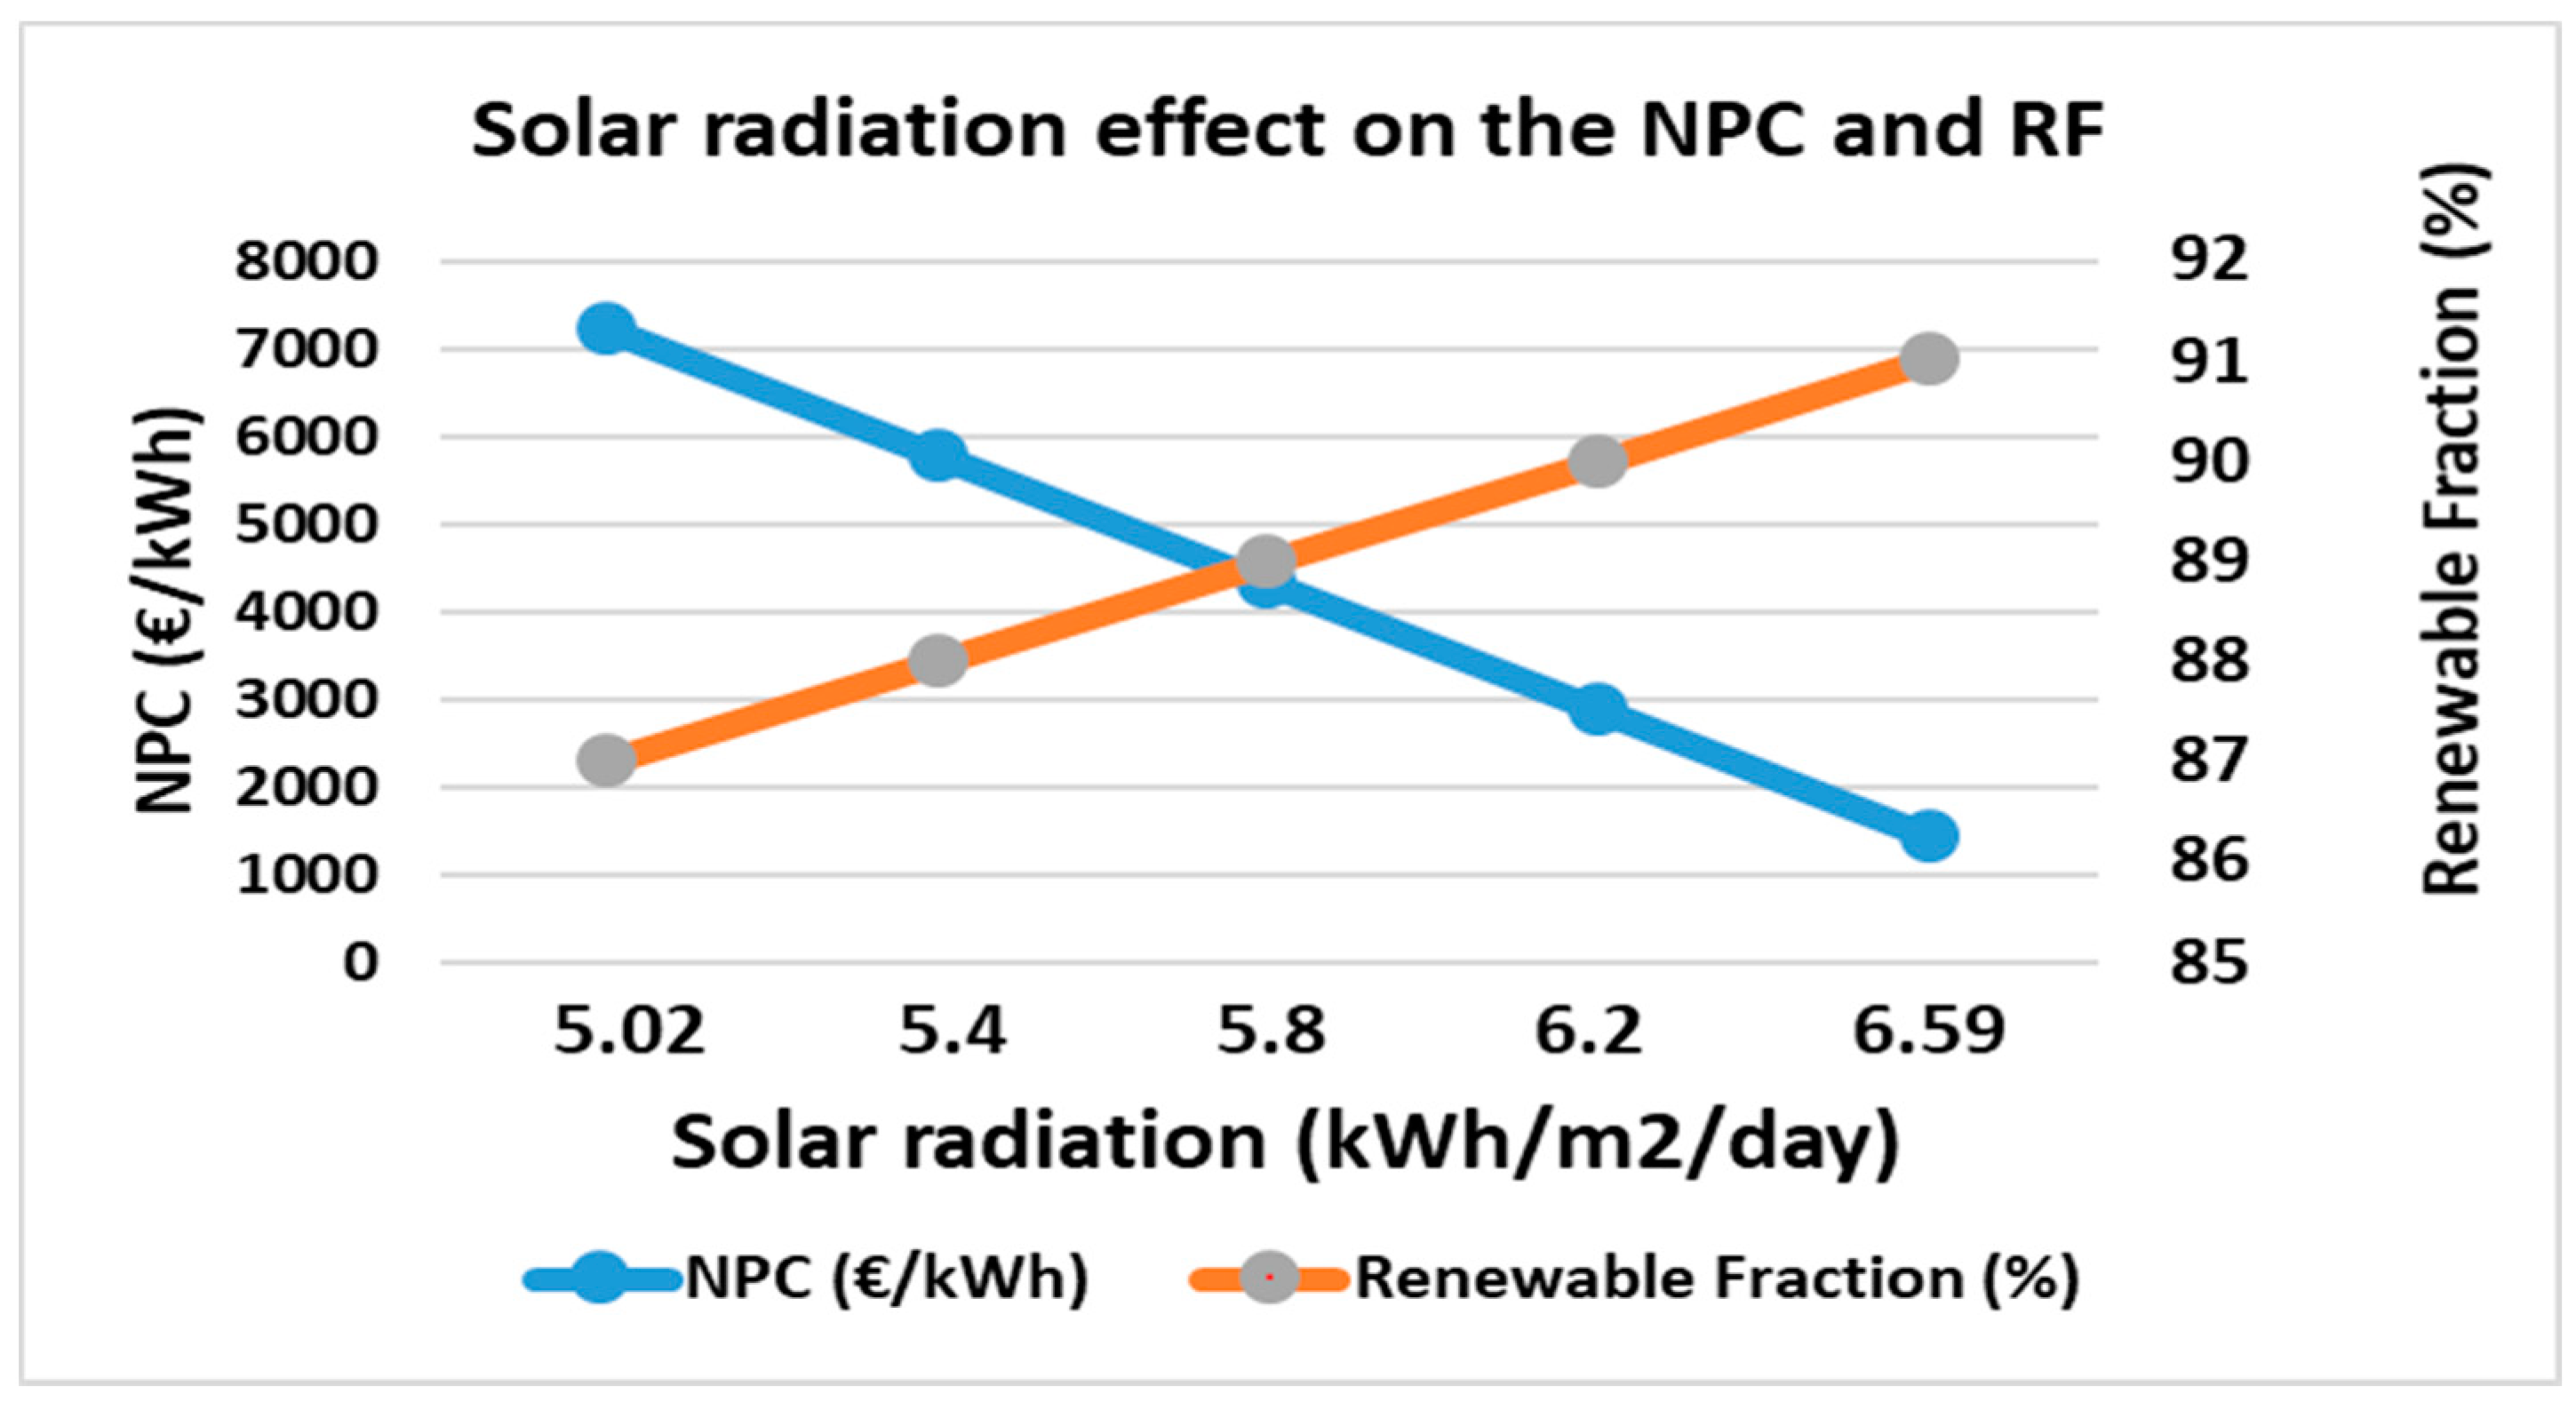
Table 5. Here it is found that the production and consumption of energy is more balanced for the case of a 5 kWp PV array compared to a 10 kWp PV array system. Therefore, excess electricity is reduced from 14.47% to 1.04%, which is almost negligible for the optimized 5 kWp system. Based on the results, the total electricity production and consumption are more balanced and adequately optimized for the 5 kWp PV system than that of the 10 kWp PV for the same load condition. In addition to the plant’s optimization output, sensitivity analysis was also performed to indicate the effect of changing multiple values for input variables on the optimal system design. These variables can be the solar radiation, load demand, PV capital cost, and related parameters that might affect the optimal system’s economic output. As shown from
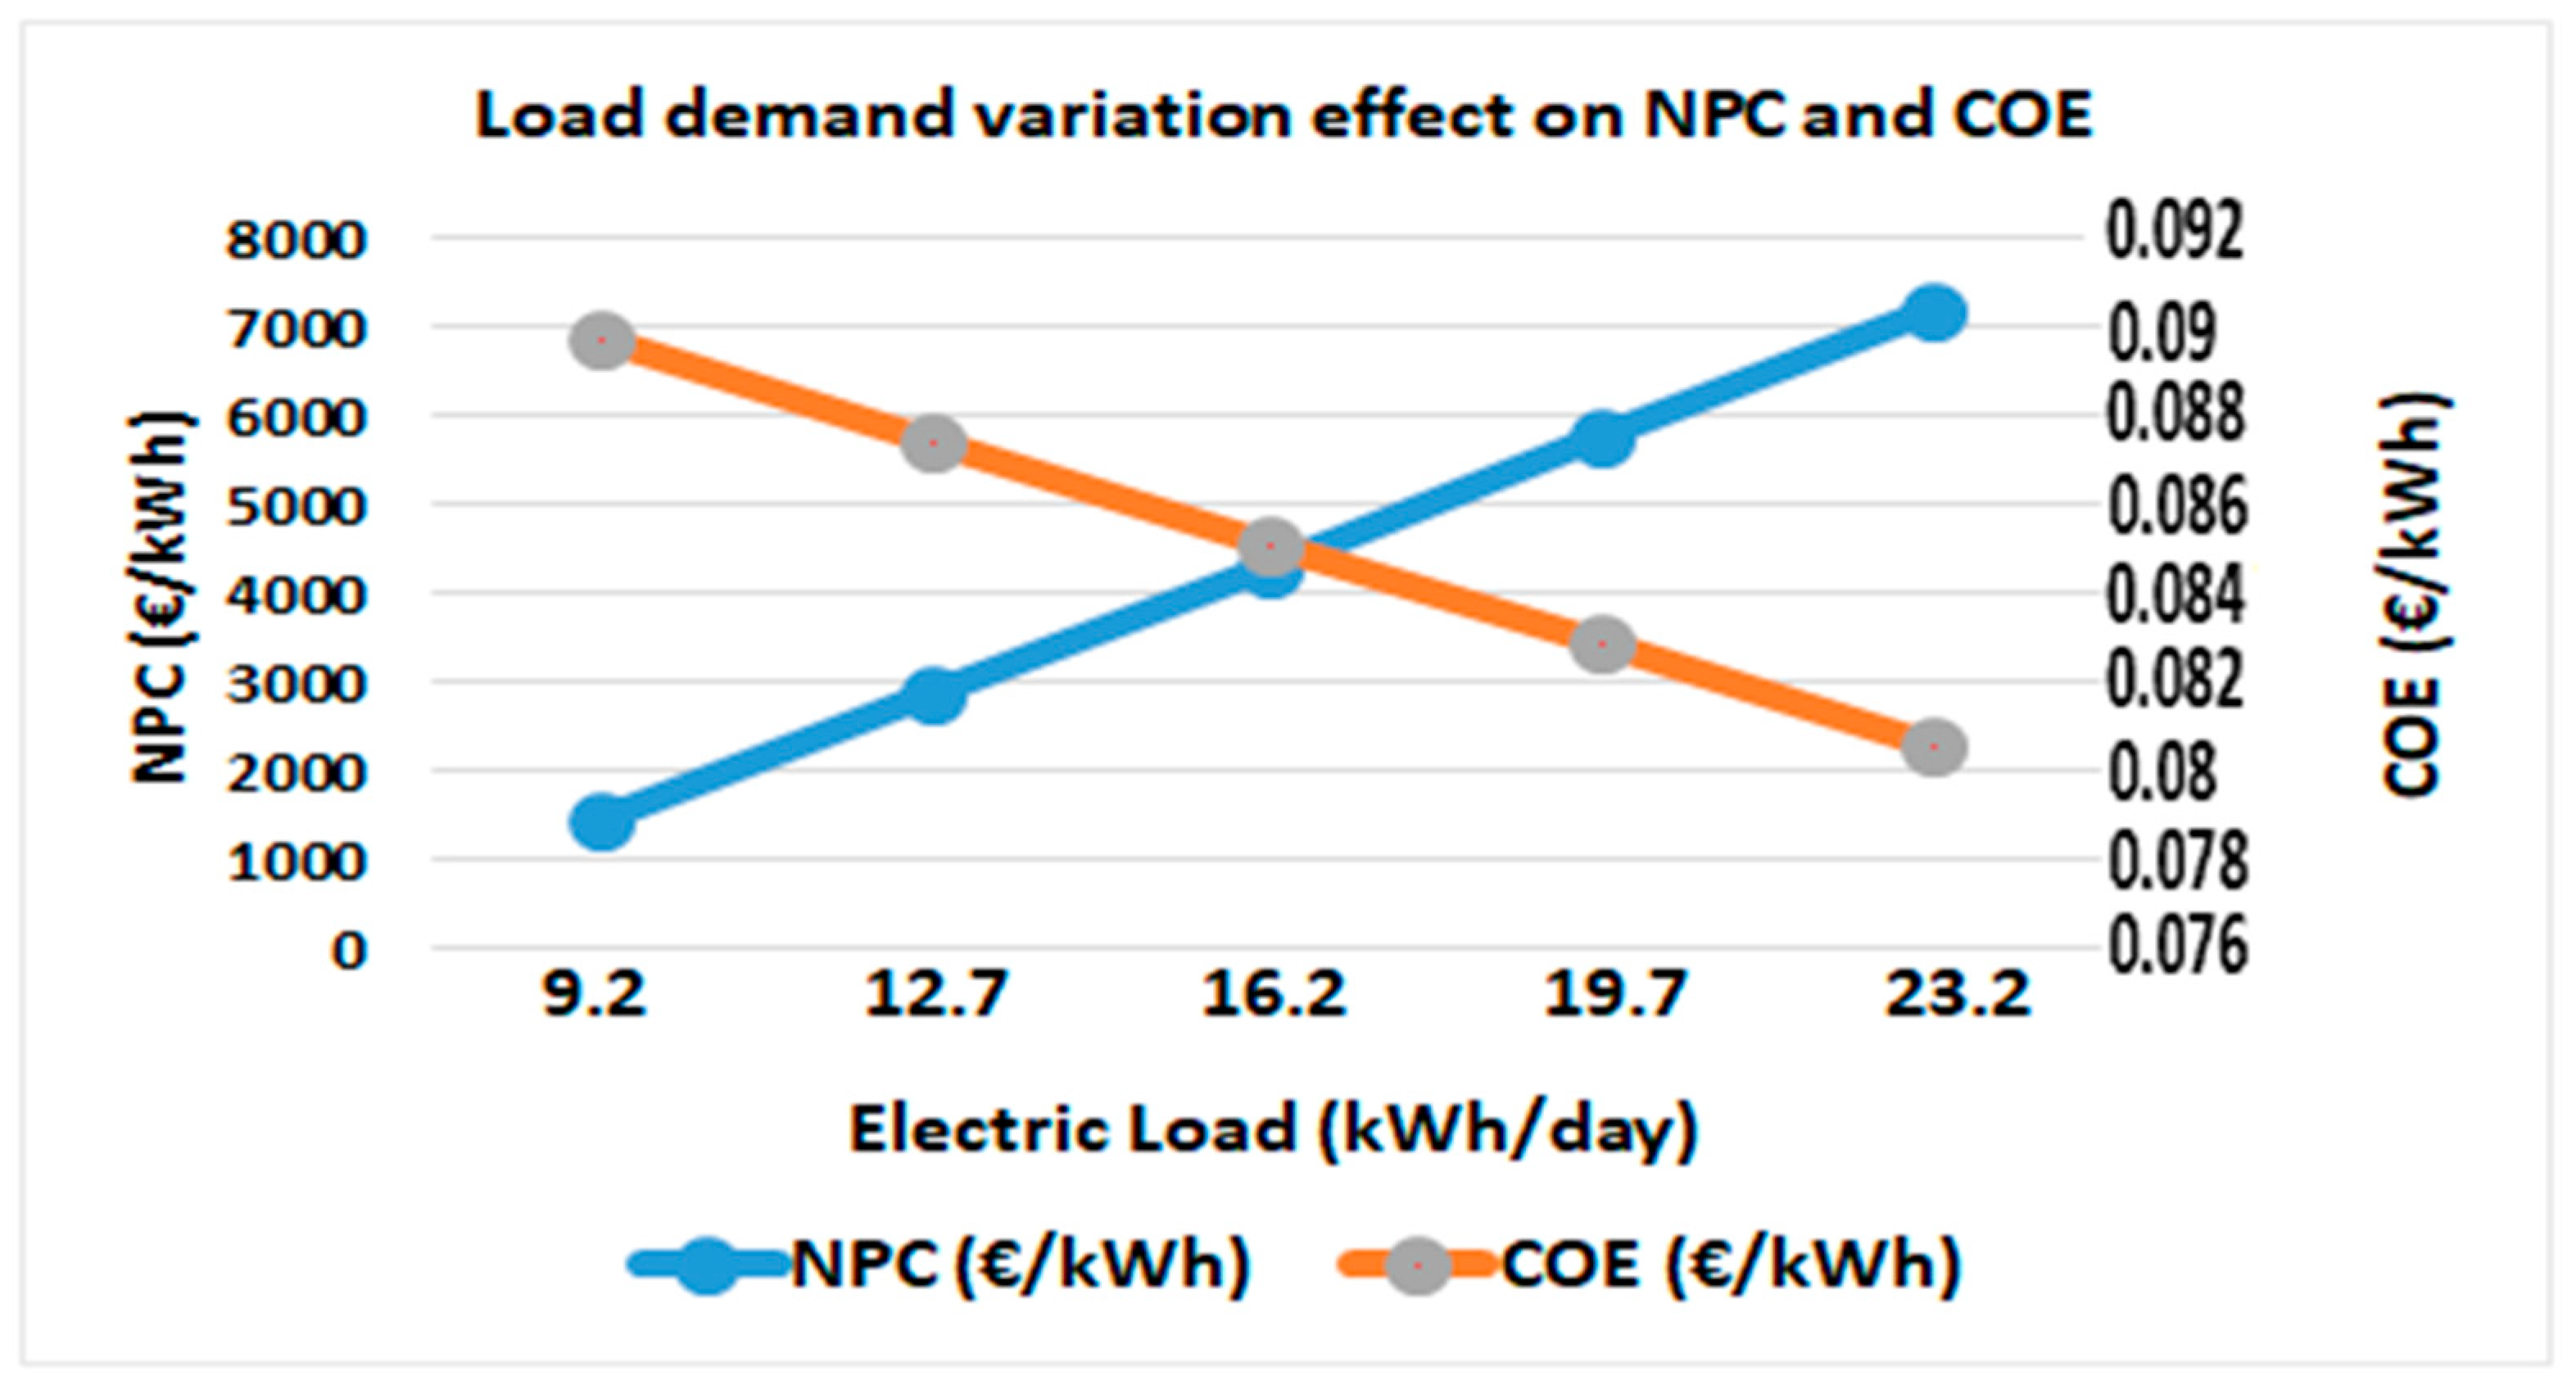
Figure 19, the effect of solar radiation variation was noticed on the NPC and RF value changes. The net present cost found to be decreased as the solar radiation increased. On the other hand, the effect of load demand changes was presented in
Figure 20, which in turn resulted in the NPC and COE value changes of the optimized system. As the load increased, the NPC value increased but the COE decreased. The PVGCS system with a 5 kWp PV array provides an average NPC value of 5770 (€/kWh) and COE of 0.087 (€/kWh) compared to a 10 kWp PV system, which results in a NPC of 6047 (€/kWh) and COE of 0.098 (€/kWh). Moreover, the utilization time and production of the storage battery was also increased from 36.8 kWh to 76.5 kWh with the new optimized system. Therefore, from the study result, the entire plant was found to be more efficient and optimal both technically and economically with an optimized 5 kWp PV system compared to the existing 10 kWp PV system. According to the HOMER result, the optimal 5 kWp PV array configuration provides a system with efficient energy production satisfying the local load, providing a balanced system, negligible losses of electricity, and hence an economically viable system with better NPC and COE values. The methods of techno-economic analysis used in this paper can further be used for commercial sectors while considering the respective resource and demand profiles available at the site to be investigated.
6. Conclusions and Recommendation
In this paper, a techno-economics and operational performance assessment of the PVGCS plant was conducted using collected data, simulation, and optimization of the entire plant. From the measured data at the plant, it was found that, for a yearly average radiation rate of 2378 kWh/m
2/year, the PV plant produces an average energy rate of 11,805 kWh/year with consideration of losses. The results from the analytical performance evaluation technique show that the performance ratio value was found to be in the range of a minimum value of 64% and a maximum value of 74%. Accordingly, the system efficiency was found to be in the range of 9.3% to 10.7%. In addition, December, January, and March were the months where the PV system became most efficient and produced the highest amount of energy. The performance status of the plant under study was compared with previous studies and verified as shown in
Table 1, resulting in promising output levels. To evaluate the dynamic characteristics and response, the plant was modeled using Matlab, provided that each component’s output was within permissible limits and met the demand requirement as needed. Though technically the plant is performing well, according to the optimization and sensitivity results found from HOMER Pro, in terms of economic aspects, the existing 10 kWp PV plant was not well optimized, leading to idle periods for the battery storage and resulting excess electricity. Therefore, based on the simulation output, a 5 kWp PV system was found to be economically more optimal than the existing 10kWp PVGCS system. Accordingly, the system with a 5 kWp PV array provides a net present cost (NPC) value of 5770 (€/kWh) and cost of energy (COE) of 0.087 (€/kWh) compared to the 10 kWp PV system, which results in a NPC of 6047 (€/kWh) and COE of 0.098 (€/kWh). The energy production of the storage battery also increased from 37 kWh to 77 kWh with a 5 kWp PV array system. Therefore, the entire plant was found to be more efficient and optimal both technically and economically with an optimized 5 kWp PV array system, demonstrating that the PV together with the battery storage unit needs to be properly sized for an efficient operation of the system satisfying the variable load demand. In general, the results found from the plant performance assessment and techno-economic analysis could be used as an input for intensive installation and effective utilization of PVGCS systems in Ethiopia.
In the future, the plant’s overall dynamic property and stability impact on the grid can be further investigated by directly collecting solar radiation data at the plant for a couple of years and therefore, the plant performance and economics can be evaluated more efficiently using a feed in tariff estimation mechanism of electricity prices. In addition, the second-life battery energy storage system’s impact on reducing the levelized cost of energy for a grid-connected photovoltaic system could be investigated by comparing it with a fresh battery storage system.

 ,
, 


