The Impacts of the Expansion of Urban Impervious Surfaces on Urban Heat Islands in a Coastal City in China


1
College of Computer and Information Engineering, Xiamen University of Technology, 600 Ligong Road, Xiamen 361024, China
2
Key Lab of Urban Environment and Health, Institute of Urban Environment, Chinese Academy of Sciences, Xiamen 361021, China
*
Author to whom correspondence should be addressed.
Sustainability 2020, 12(2), 475; https://doi.org/10.3390/su12020475
Submission received: 15 November 2019
/
Revised: 20 December 2019
/
Accepted: 5 January 2020
/
Published: 8 January 2020
(This article belongs to the Special Issue Spatio-Temporal Analysis of Urbanization Using GIS and Remote Sensing in Developing Countries)
Abstract
:The effect of the expansion of urban impervious surfaces on surface urban heat islands (UHIs) has attracted research attention due to its relevance for studies of local climatic change and habitat comfort. In this study, using five satellite images of Xiamen city, Southeast China (four images from the Landsat 5 Thematic Mapper (TM) and one from the Landsat 8 Operational Land Imager/Thermal Infrared Sensor (OLI/TIRS)) acquired in summer between 1989 and 2016, together with spatial statistical methods, the changes in impervious surface area (ISA) were investigated, the spatiotemporal variation of the intensity of urban heat islands (UHIs) was explored, and the relationships between land surface temperature (LST) and the percentage of impervious surface area (ISA%), the normalized difference vegetation index (NDVI), and fractional vegetation coverage (Fv) were investigated. The results showed the following: (1) According to the biophysical composition index (BCI) combined with an ISA post-processing method, Xiamen has witnessed a substantial increase in ISA, showing a 6.1-fold increase from 1989 to 2016. The direction of ISA expansion was consistent throughout the study period in each of the five districts of Xiamen; (2) a bay-like UHI form is observed in the study area, which is remarkably distinct from the central-radial UHI form observed in previous studies of other cities; (3) the extent of UHIs in Xiamen greatly increased between 1989 and 2016, experiencing a 4.7-fold increase in UHI areas during this time. However, during the same period, the urban heat island ratio index (URI)—that is, the ratio of UHI area to ISA—decreased slightly. The UHI area decreased in some urban parts of Xiamen due to a significant increase in vegetation coverage, urban village redevelopment, and the construction of new parks; (4) sea ports and heavy industrial zones are the greatest contributor to surface UHI, followed by urban villages; and (5) LST is strongly positively correlated with ISA%. Each 10% increase in ISA was associated with an increase in summer LST of 0.41 to 0.91 K, which compares well with the results of related studies. This study presents valuable information for the development of regional urban planning strategies to mitigate the effects of UHIs during rapid urbanization.
1. Introduction
Over the past several decades, urbanization has progressed at an unprecedented rate throughout the world [1]. In 1950, only 29% of the global population lived in urban areas; however, by 2018, this proportion was 55%. Furthermore, the UN Population Division estimates that the global percentage of urban residents will increase to 68% by 2050 [2]. In 1978, China’s urban population was 170 million, representing 17.4% of China’s population at the time; however, by the end of 2018, more than 831 million Chinese lived in cities, accounting for 59.6% of the country’s population. Coastal urban regions in China have undergone particularly rapid population growth and strong economic growth [3]. Approximately 11.0% of China’s population lives in the Yangtze River Delta, which represents China’s largest “super city” and contributes approximately 23.5% of the country’s GDP (2018 data) [4]. Urbanization inevitably involves the transition from natural vegetation coverage to impervious surfaces (e.g., paved roads, building roofs, and parking lots) [5]. Thus, although it brings great social and economic benefits, urbanization leads to a number of environmental issues, such as urban heat islands (UHIs), the degradation of water quality, and loss of biodiversity [6]. The term “surface UHI” refers to the phenomenon whereby the land surface temperature (LST) in urban areas is higher compared to the surrounding rural areas [7]. The high temperature of UHIs influences not only the local and mesoscale climate but also human health, air quality, and ecosystem functions [8]. Therefore, UHIs have received large research attention around the world [9]. Remote sensing technology can be used to obtain detailed images of land cover with a high temporal resolution, allowing a synoptic and uniform means of mapping urban impervious areas and studying the effects of surface UHIs [10].
In recent years, impervious surface area (ISA) has increasingly been used as a key environmental indicator. Impervious surface areas can reduce water quality and lead to greater soil dryness and higher air temperatures [9]. Numerous methodologies have been constructed for the extraction of the ISA from remote sensing images with various spatial scales in order to map ISA and evaluate their dynamics. Three major classes of algorithms have been used for the extraction of ISA from satellite images, namely machine learning methods, spectral unmixing techniques, and spectral index (SI) methods. Machine learning techniques include artificial neural networks (ANNs) [11], support vector machines (SVMs) [12], decision tree classification (DTC), classification and regression tree (CART) analysis [6], and regression modeling [13]. Methods for the determination of empirical relationships between various spectral and spatial characteristics include linear spectral mixture analysis (LSMA) [14,15,16], and the multiple endmember spectral mixture analysis (MESMA) method [17]. A number of SIs have been constructed to quantify the biophysical characteristics of the earth’s surface, including the impervious surface area index [18], the normalized difference impervious surface index (NDISI) [19], the biophysical composition index (BCI) [20,21], the modified NDISI [22], and the combinational built-up index (CBI) [23]. Spectral indices can be used to derive ISA, usually using a simple linear composition formula for the original image bands, reflected image bands, or other feature index bands obtained from imagery. This index-based method does not require much a priori knowledge of image pre-processing. Therefore, compared to machine learning methods and spectral unmixing techniques, SIs have the advantages of uncomplicated implementation and computational convenience in practical applications [20,21]. Furthermore, some SIs (e.g., the BCI) can be estimated using a wide range of satellite imagery with various spatial resolutions, ranging from coarse resolution (e.g., Moderate Resolution Imaging Spectroradiometer (MODIS)), to medium resolution (e.g., Landsat 5, Sentinel 2), to high resolution (e.g., IKONOS) satellite imagery [20].
Satellite-derived LST has been used to study UHIs, and has been used to inform various strategies for the mitigation of UHIs, climate modeling, and studies of local and global-scale climate change. In recent years, there has been increasing concern regarding the effect of ISA on LST [14,19,24,25]. However, there have been few studies of the effect of urban development on surface UHIs using satellite images taken at different times in the same season, especially in coastal cities.
Therefore, this study aimed to use remote sensing images and spatial statistical methods to assess the effects of rapid urbanization—and particularly the rapid expansion of ISA—on UHIs in the city of Xiamen, China, for a 27-year period from 1989 to 2016. This study focused on the changes in ISA, investigated the area and intensity of UHIs, and revealed the relationships between LST and (1) the percentage of impervious surface area (ISA%), (2) the normalized difference vegetation index (NDVI), and (3) the fractional vegetation cover (Fv). The results of this study could be helpful for the development of regional urban planning strategies to mitigate the effects of UHIs during rapid urbanization.
2. Study Area and Data
2.1. Study Area
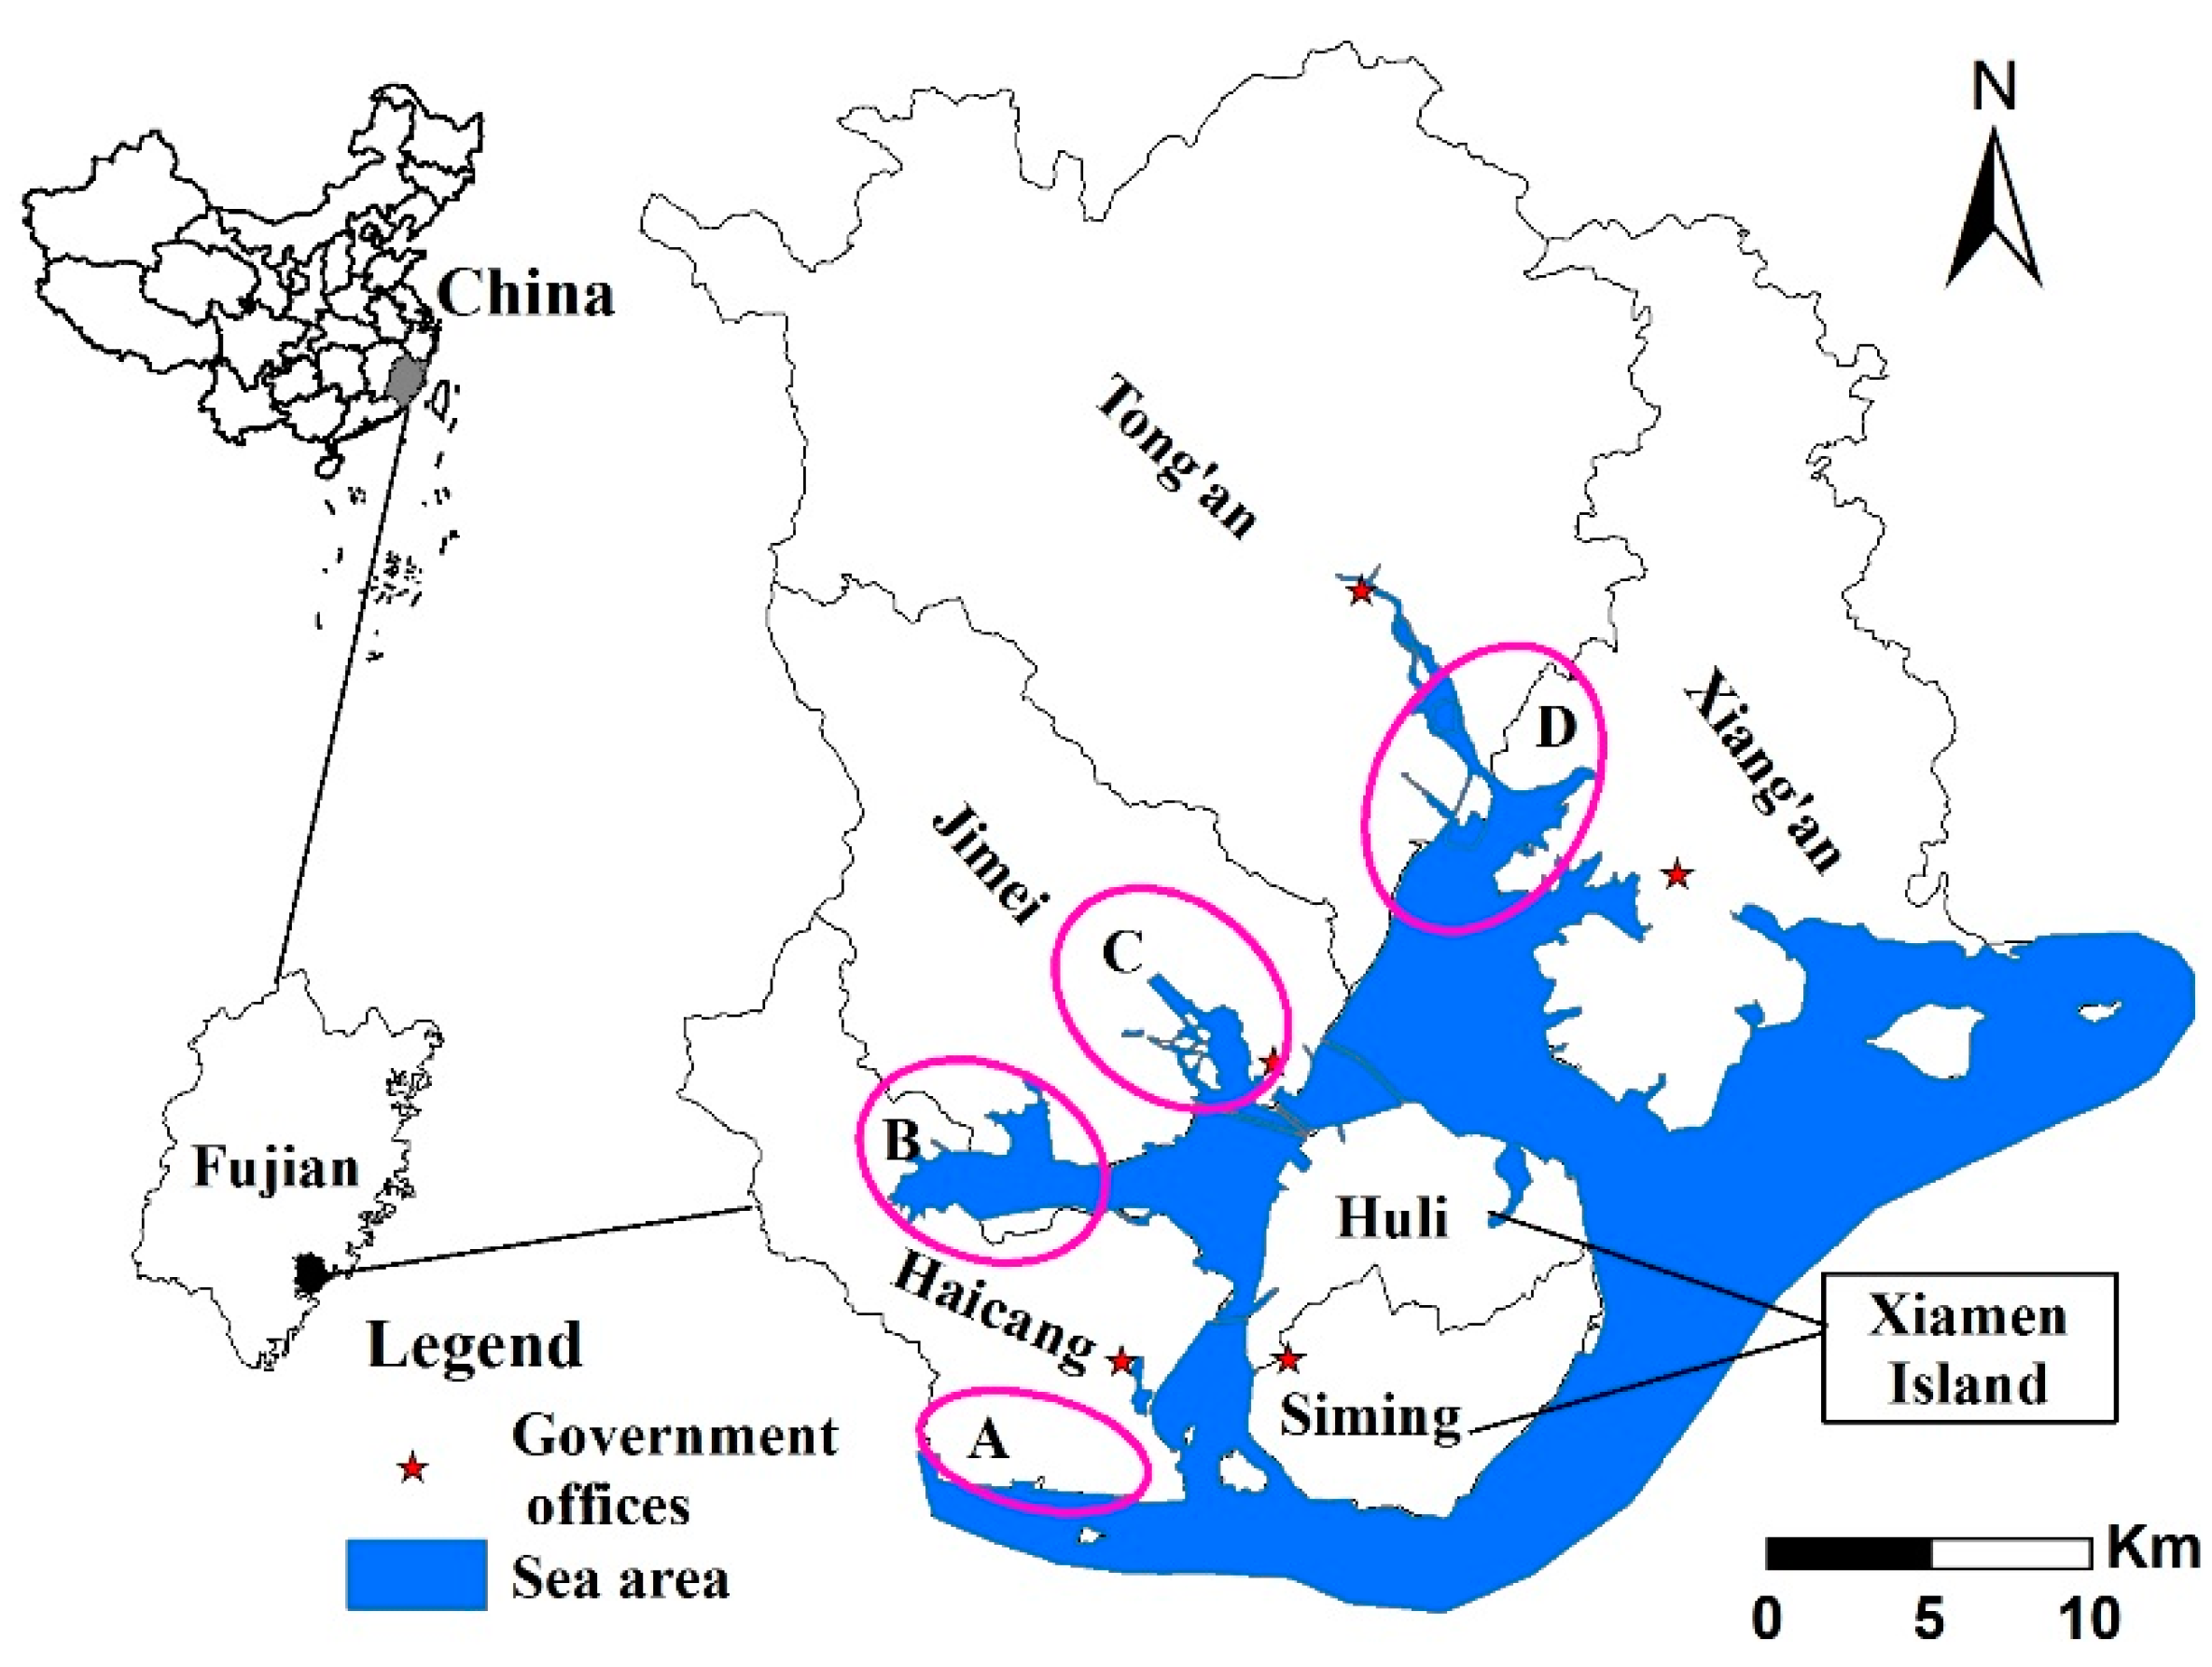
Xiamen city is situated in the SE coast of Fujian Province, China (117°53′–118°26′ E and 24°23′–24°54′ N), and covers an area of 1699.39 km2 (Figure 1). The city has undulating terrain, an elevation range of 0 to 1175 m, and has a subtropical monsoon climate and a mean annual temperature of 21 °C. The city consists of two main areas—Xiamen Island and four suburban districts, namely Jimei, Haicang, Tong′an, and Xiang′an.
Xiamen is one of the four oldest special economic zones in China. In recent decades, due to the high quality of its urban ecological environment and its diversified and growing economy, the city has continuously attracted a huge number of new residents and has experienced significant urban growth [26]. Xiamen has evolved from an “island-like” city to a “bay-like city” with an urban center on Xiamen Island and various surrounding towns and suburban agglomerations located in the bays and plains on the mainland [27]. National census data indicate that Xiamen’s resident population grew from 1.18 million to 4.11 million between 1990 and 2018. The city’s dramatic and rapid urbanization has led to environmental issues, such as the deterioration of water quality, loss of farmland, and the eutrophication of offshore waters [28,29]. This urbanization, combined with the city’s diversity of land-use/land-cover, makes Xiamen an ideal area to investigate the effects of surface urban heat islands.
2.2. Data Collection and Processing
Four Landsat 5 Thematic Mapper (TM) images and one Landsat 8 image (Table 1) were acquired from the website of the United States Geological Survey (http://earthexplorer.usgs.gov/). Digital elevation models (DEMs) were acquired from the Geospatial Data Cloud website (http://www.gscloud.cn/). Landsat 8 is equipped with two instruments, the Operational Land Imager (OLI) and the Thermal Infrared Sensor (TIRS). The Landsat 8 OLI data consist of nine spectral bands. Bands 1–7 and band 9 have a spatial resolution of 30 m, and band 8 is a panchromatic band with a 15-m spatial resolution. The four Landsat 5 TM images have a cloud cover of less than 1.81% and covered remote mountainous areas with forests.
Detailed descriptions of the images used in this study are shown in Table 1. The images were all acquired in the same season with adjacent sun elevation angles and clear sky conditions. All images were divided using the Universal Transverse Mercator projection (zone 50N). The images were georegistered with root-mean-square (RMS) errors of less than 0.5 pixels. The images were pre-processed via an atmospheric correction procedure that is based on the dark object subtraction (DOS) method [30,31].
3. Methods
3.1. Image-Based Atmospheric Correction Method
The DOS method for atmospheric correction [30,31] was applied to both the Landsat 5 TM and Landsat 8 OLI images. It can be expressed as:
where ESUN represents the exo-atmospheric solar spectral irradiance; ρ represents the surface reflectance; Lsat represents the spectral radiance at the aperture of the sensor (W/(m2·sr·μm)); Lhaze represents the path radiance, which is derived using continuous relative scatter [30] for Landsat 5 TM images and using the lowest valid value attribute table method [32] for Landsat 8 OLI images; θ represents the solar zenith angle (°); and D represents the normalized Earth–Sun distance.
Lsat can be written as:
where DN represents the remotely sensed digital number, and Gain and Bias represent the radiometric gain and bias gain for a specific band, respectively, and were obtained from the head files of images.
Lsat = Gain·DN + Bias,
3.2. Retrieval of Land Cover
To determine the recent land surface cover in Xiamen, the main land cover was first retrieved, namely the impervious built land, vegetation, bare land, and water bodies (sea, ponds, beach, rivers, and lakes). Therefore, the land cover in the study was divided into two classes, namely impervious areas and non-impervious areas (i.e., vegetation, bare land, and water bodies).
3.2.1. Retrieval of Vegetation Index
The NDVI was used to extract vegetation [33]. This index is given by:
where ρNIR and ρRed represent the spectral reflectance of the red and NIR bands, respectively, for the Landsat 5 TM and Landsat 8 OLI images.
3.2.2. Retrieval of Water Index
3.2.3. Retrieval of Bare Land Index
The modified normalized difference bare index (MNDBaI) [36] was used to extract bare land. The index is expressed as follows:
where ρRed and ρBlue represent the spectral reflectance of the red and blue bands, respectively, for TM/OLI images.
3.2.4. Retrieval of Impervious Surface Area
Deng et al. [20] proposed the BCI, the calculation of which involved a modification of the Tasseled Cap (TC) transformation, to effectively distinguish impervious surfaces or other impervious features from non-impervious features (e.g., soil and vegetation) based on a vegetation–impervious surface–soil (V-I-S) triangle model. In this study, the BCI was used to distinguish impervious surfaces in order to avoid the shortcomings of spectral mixture analysis (SMA) methods regarding the selection of endmembers and endmember signature specification [15]. The BCI can be calculated as follows:
where H represents the normalized first tasseled cap (TC1) (i.e., high albedo); V represents the normalized second tasseled cap (TC2) (i.e., vegetation); and L represents the normalized third tasseled cap (TC3) (i.e., low albedo). These three factors can be given by the following equations:
where TCi (i = 1,2,3) represent the first three TC components; and TCimin and TCimax represent the minimum and maximum values of the ith TC component, respectively.
The TC transformation was performed by constructing linear combinations of the original or reflected image bands. The TC transformation reflectance coefficients for the TM and OLI images (Table 2) were obtained from Crist [37] and Li et al. [38], respectively:
Water bodies for five different periods from 1989 to 2016 were masked out before estimating ISA using the MNDWI. Then, BCI maps of the study area were produced for the five different periods using Equation (6). Subsequently, impervious surface features were extracted from the BCI maps using optimum threshold values, which were manually adjusted with the aid of Google Earth (GE) images. However, it was found that the Landsat 5 and Landsat 8 BCI images were not very effective for separating impervious surfaces, beach land, and bare soil due to the similarity of the spectral characteristics of these three surfaces in Landsat imagery. This problem was also reported by Deng et al. [20], who determined the BCI in Wisconsin, USA, using Landsat Enhanced Thematic Mapper Plus (ETM+) and IKONOS images. During rapid urbanization, a large amount of bare land is converted from vegetation and water bodies. Furthermore, beach land is one of the most important land cover types for a coastal city, such as Xiamen. To address the problem of their spectral confusion, we first separated ISA and bare soil using Equation (5) and then separated ISA and beach land using a combination of TC3 and the DEM [36].
The overall accuracy (OA) of the three extracted ISA images was assessed. Three higher-resolution images for the corresponding years were used as reference data to assess the accuracy of the ISA classification, namely GE images with a spatial resolution of 1 m, which were acquired in December 2003, October 2009, and June 2016. Six hundred pixels were sampled in each image at random. The determined overall accuracies were 90.67% (2004), 90.50% (2009), and 92.17% (2016), with corresponding Kappa values of 0.813, 0.810, and 0.843. These results suggest that the ISA classification has a relatively high accuracy and is appropriate for the purposes of this study.
3.2.5. Impervious Surface Expansion Index (ISEI) and Fan Analysis
Equation (10) was used to calculate the impervious surface expansion index (ISEI) to determine the intensity of urban growth.
where ISEIi and ISEIj are the ISEI in year i and j, respectively; from year i to year j; and ISi and ISj represent the impervious areas in the study area in year i and j, respectively.
An equal fan analysis [39] was used to characterize the expansion direction of the urban ISA in Xiamen between 1989 and 2016. The government offices of Xiamen Island and the four districts of Xiamen city were chosen as the centers of ISA (Figure 1), respectively, and then five circles were drawn based on the appropriate radius for each area. Additionally, each circle was divided into 16 fans (equally spaced rays). Radar graphs showing the expansion of ISA were drawn by summarizing the ISEI in each fan for Xiamen Island and the four districts for each study year.
3.3. Retrieval of Land Surface Temperature (LST)
The LST is an important indicator for identifying surface UHIs. Therefore, the LST across Xiamen city in each study year was derived to study the effect of ISA expansion on surface UHIs. For Landsat 5 TM images, the thermal band 6 was used to retrieve the LST using the algorithm of Artis and Carnahan [40]. For Landsat 8 TIRS images, thermal band 10 was used in order to retrieve the LST using the modified single channel (MSC) algorithm of Jiménez-Muñoz et al. [41]. The two methods have the following three common processing steps: (1) The digital numbers (DNs) of the thermal band were first converted to a satellite spectral radiance (L) using Equation (11); (2) then, L was further converted to the at-satellite brightness temperature (T, in Kelvin) using Equation (12); and (3) T was converted to the LST using the land surface emissivity (ε), which was estimated from the NDVI [25,41,42]:
where G and B represent, respectively, the rescaled gain factor and bias factor of the thermal band, in W/(m2·sr·m); and K1 and K2 represent the calibration constants. G, B, K1, and K2 were obtained from the head files of the Landsat 5 TM and Landsat 8 TIRS images. Qcal represents the quantized calibrated pixel value (in DN) of the thermal band.
The Artis and Carnahan algorithm is given in Equation (13):
where represents the wavelength of the central band ( = 11.5 μm); ρ = 1.438 × 10⁻² m·K; ε represents the land surface spectral emissivity of band 6 of Landsat 5 TM; and Ts is the land surface temperature (K).
The equation for the MSC algorithm is as follows:
where ψ1, ψ2, and ψ3 represent the atmospheric functions; τ represents the atmospheric transmission; and γ and δ represent two parameters expressed by the following equations:
where bγ is 1324 for the TIRS band 10; τ represents the atmospheric transmissivity; and L↑ and L↓ represent the upwelling atmospheric radiance and the downwelling atmospheric radiance, respectively. The three parameters, τ, L↑ and L↓, were obtained using an atmospheric correction parameter calculator on the NASA (National Aeronautics and Space Administration) website (https://atmcorr.gsfc.nasa.gov/). This calculator requires the following inputs: (1) Geographical location; and (2) the date and time of the Landsat 8 satellite overpass.
3.4. LST Normalization and Determination of Urban Heat Island Ratio Index (URI)
The thermal environment of the urban surface was represented by the LST [43]. To facilitate the comparison of the LST over a period of time, a normalized LST equation was used, which reduces the temporal variability of the LST [25,44]:
where Ui is the value of the i-th pixel of the normalized LST image; Ti is the initial value of pixel i in the LST image; and Tmin and Tmax are the minimum and maximum LSTs on the LST image.
The normalized LST image in urban areas characterized by impervious surface areas was further divided into six levels using a density slice technique based on the mean and standard deviation of the LST in the normalized LST image (Table 3) [45,46]. The combination of level 5 and level 6 was taken to be the UHI distribution zone. Thus, the spatial distribution and temporal variation of UHIs could be simply determined using a single graded urban LST map.
We introduced the urban heat island ratio index (URI) proposed by Xu and Chen [44] in Equation (18), below. The URI is the ratio of the UHI area to the urban impervious area, which has been a key indicator of assessing an urban thermal environment in Technical Criterion for Eco-environmental Status Evaluation (trial) issued by the Ministry of Ecology and Environment of China. The URI can be used to investigate the variations in the UHI intensity using multi-date remote sensing data. Generally, the larger the URI, the stronger the UHI effect is:
where m represents the number of levels in the normalized LST image (m = 6 in this study); i is the level of the UHI; m is the number of normalizations; n is the level of the UHI areas (n = 2 in this study); w is the weight using the value of corresponding level i (w = 5 or 6 in this study); and Pi represents the percentage of level i.
The mean intensity of UHIs is defined as the difference between the LST of the urban area and the background LST of the rural area:
where Im represents the mean intensity of the UHI effect (in K) in the study area, TIS represents the mean LST (in K) of the urban ISA, and Tnon-IS represents the mean LST (in K) in the non-ISA except for the sea area.
Im = TIS –Tnon-IS,
3.5. Statistical Analysis
Regression analysis was employed to quantify the LST relationships to NDVI, ISA% (Equation (20)), and Fv (Equation (21)). A zonal analysis method [14] was used to determine the mean LST at each 0.01 increment of the NDVI from −1 to 1, each 0.01 increment of the Fv from 0 to 1, and each 1% increment of ISA% from 0% to 100%. At each increment of NDVI, Fv, and ISA%, a mean LST value was derived from all corresponding pixels.
The BCI was used to determine ISA%, which was expressed as follows:
where BCInor is the normalized BCI; BCIi is the original BCI value of pixel i; and BCImin and BCImax represent the minimum value and maximum value of the original BCI, respectively.
Fractional vegetation coverage was calculated after Gutman and Ignatov [47,48]:
where NDVI is the NDVI value of a pixel, NDVI0 is the NDVI value for bare soil, and NDVIs is the NDVI value of a surface with an Fv of 100% (which in this study was obtained from extremely dense forest).
fv = (NDVI − NDVI0)/(NDVIs − NDVI0),
4. Results and Discussion
4.1. Changes in Urban Impervious Surface Area (ISA)
The results show that the ISA in Xiamen city increased dramatically over the study period, from 63.06 km2 in 1989 to 447.04 km2 in 2016, a net increase of 384.01 km2 (Figure 2). This corresponds to an average annual increase rate of 14.22%. The majority of the increase in ISA occurred between 2004 and 2016, when the ISA grew by 238.11 km2. The increase in ISA was mostly concentrated in the areas surrounding Xinglin Bay, Tong’an Bay, Malyuan Bay, and Xiamen Island (Figure 2). Between 1989 and 2016, Xiamen underwent a transformation from an “island-like” city to a “bay-like” city. There may be two main reasons for this transformation. Firstly, a development plan was launched in 2003 to combat overpopulation and unbalanced economic development between rural and urban areas in Xiamen, which prioritized the development of areas around the four aforementioned bays to form new urban centers [26]. Secondly, Xiamen’s ISA growth is constrained by its proximity to the coast. The bay-like city form is distinctly different from inland cities, where the main pattern of ISA expansion approximately follows the form of concentric circles surrounding a central area (i.e., “urban sprawl”) [27].
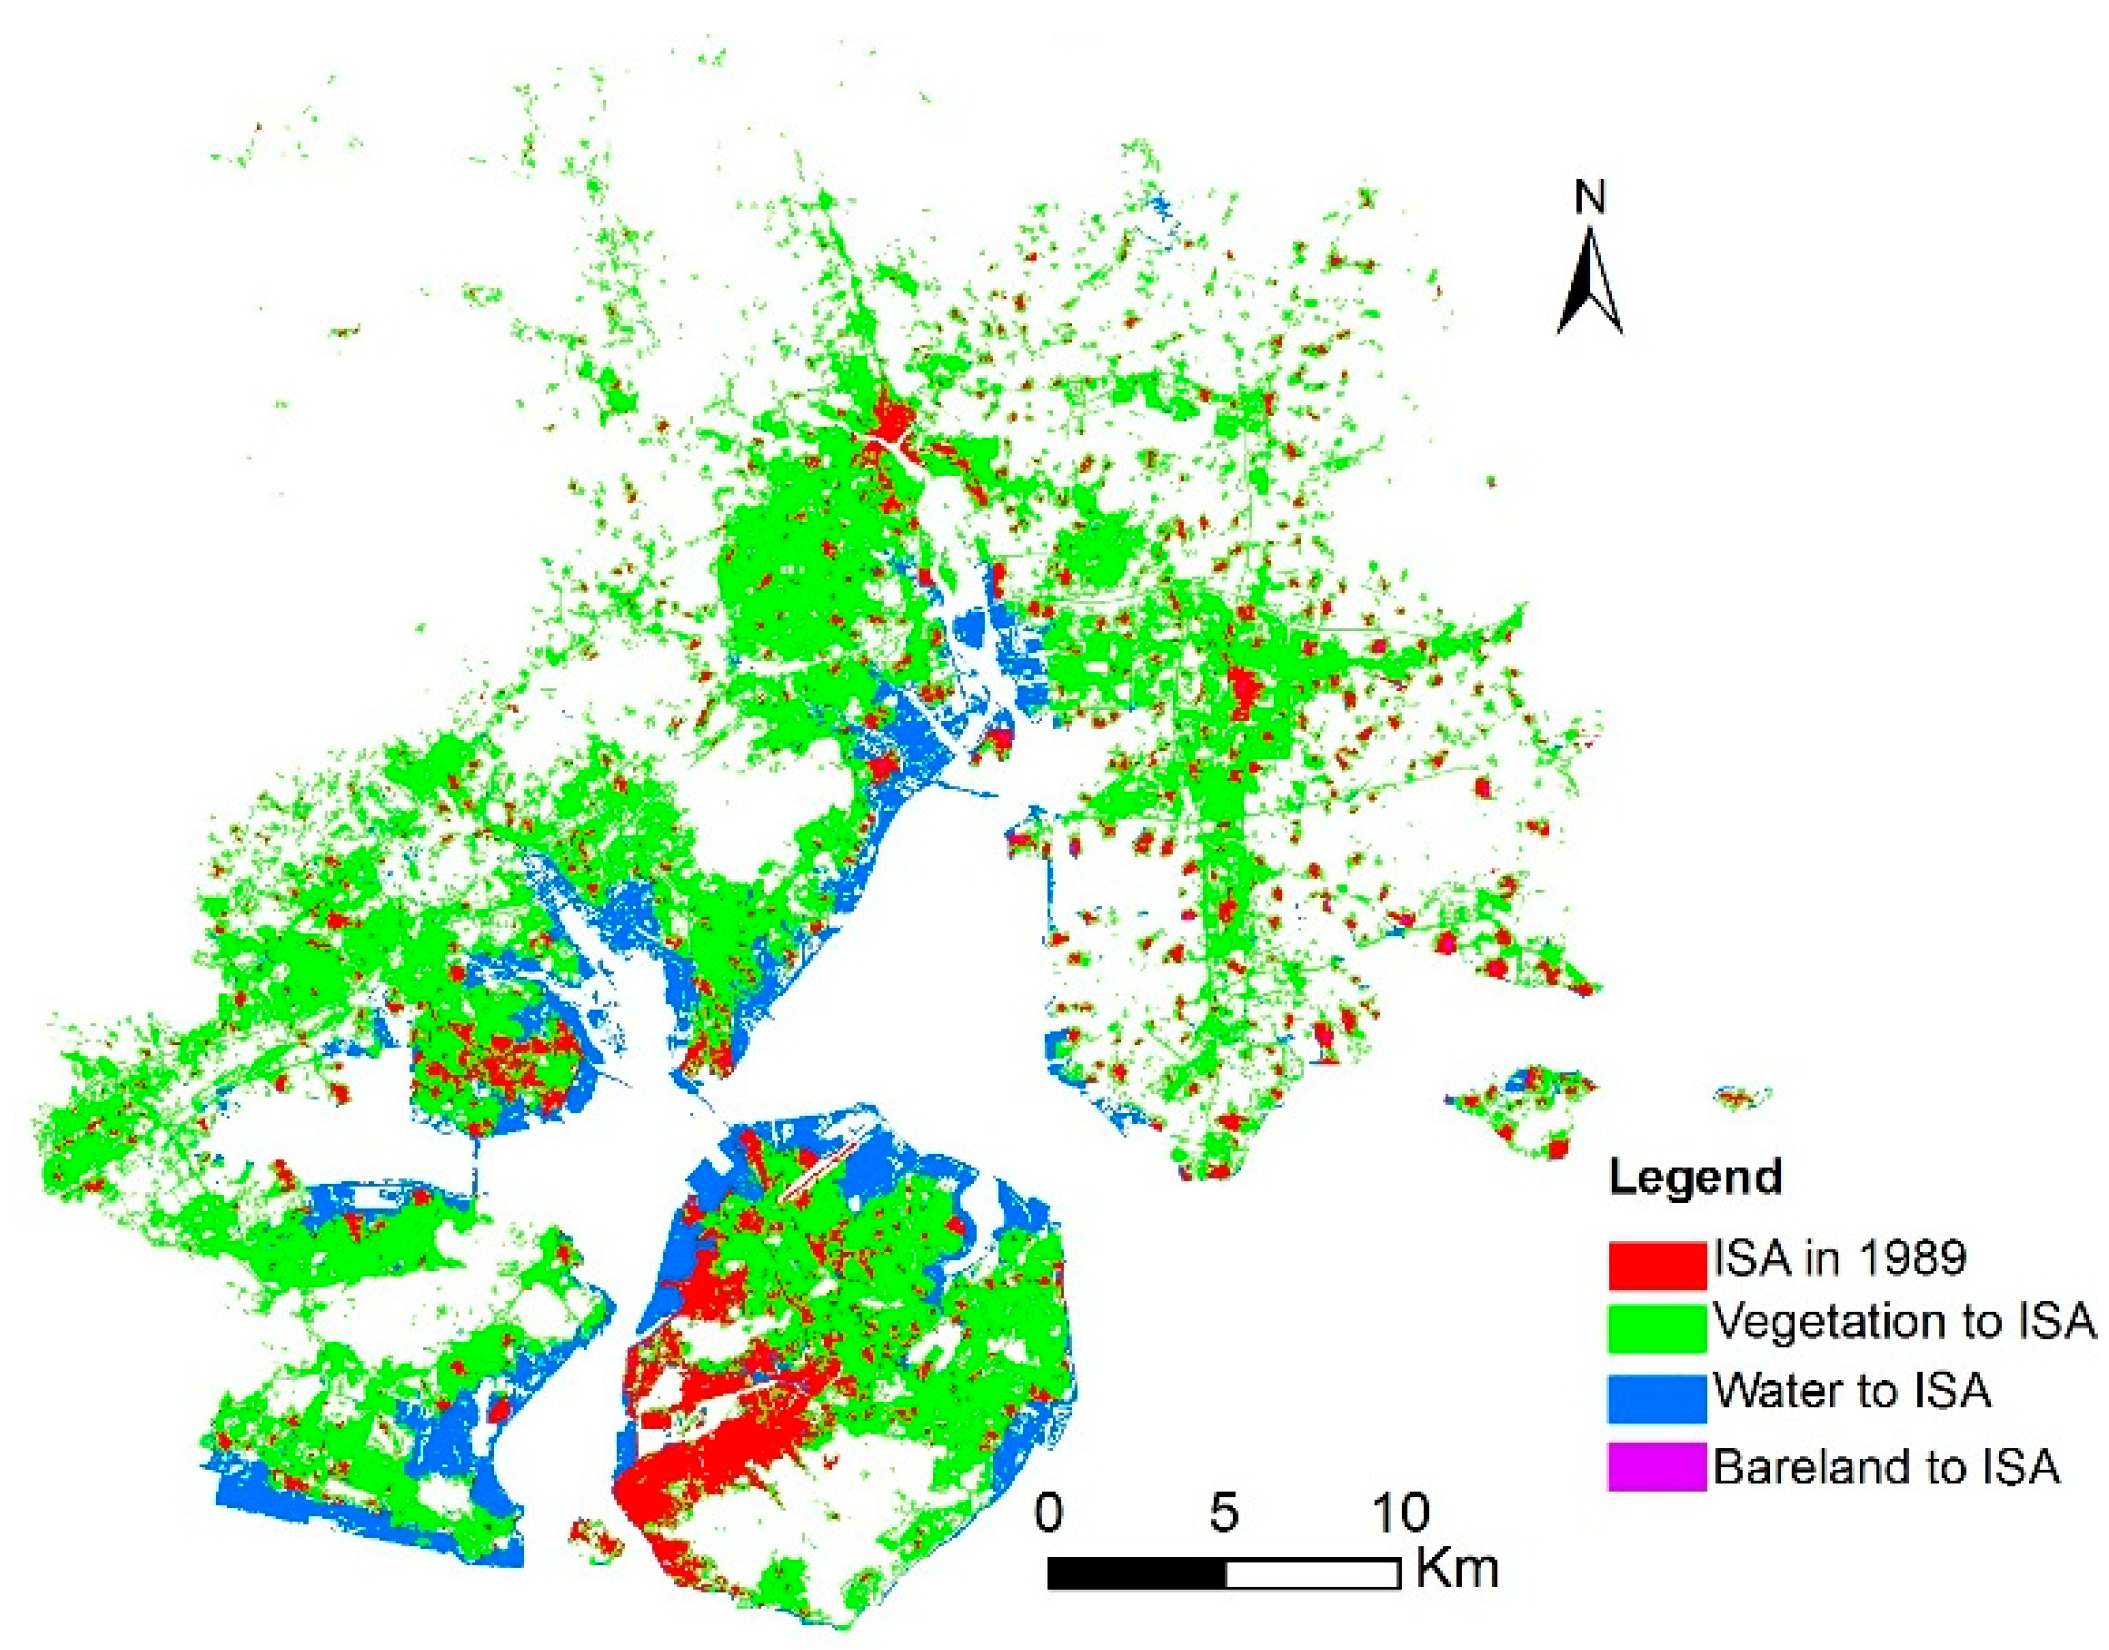
As shown in Figure 3, the increase in ISA in Xiamen between 1989 and 2016 came at the cost of vegetation and water areas. A total of 82.53% of the added ISA, which was constructed between 1989 and 2016, was converted from vegetated areas, representing a loss of vegetated land at a rate of over 11.76 km2 per year. Meanwhile, 17.26% of the added ISA was converted from water areas, mostly sea areas adjacent to land. Only 0.21% of the added ISA was converted from bare land and other land-cover categories. In many coastal cities, coastal reclamation is one of the most important approaches to supply land resources to support an expanding population. However, coastal reclamation can lead to marine environmental problems, such as a reduction in the quality of the marine environment, habitat degradation, and a reduction in coastal biodiversity. In 2016, the Xiamen local government designated 981 km2 of ecologically sensitive areas (such as sea, reservoir water sources, ecological forests, and basic farmland, etc.) as an ecological protection “red line” in an attempt to strictly protect ecological resources and control urban expansion.
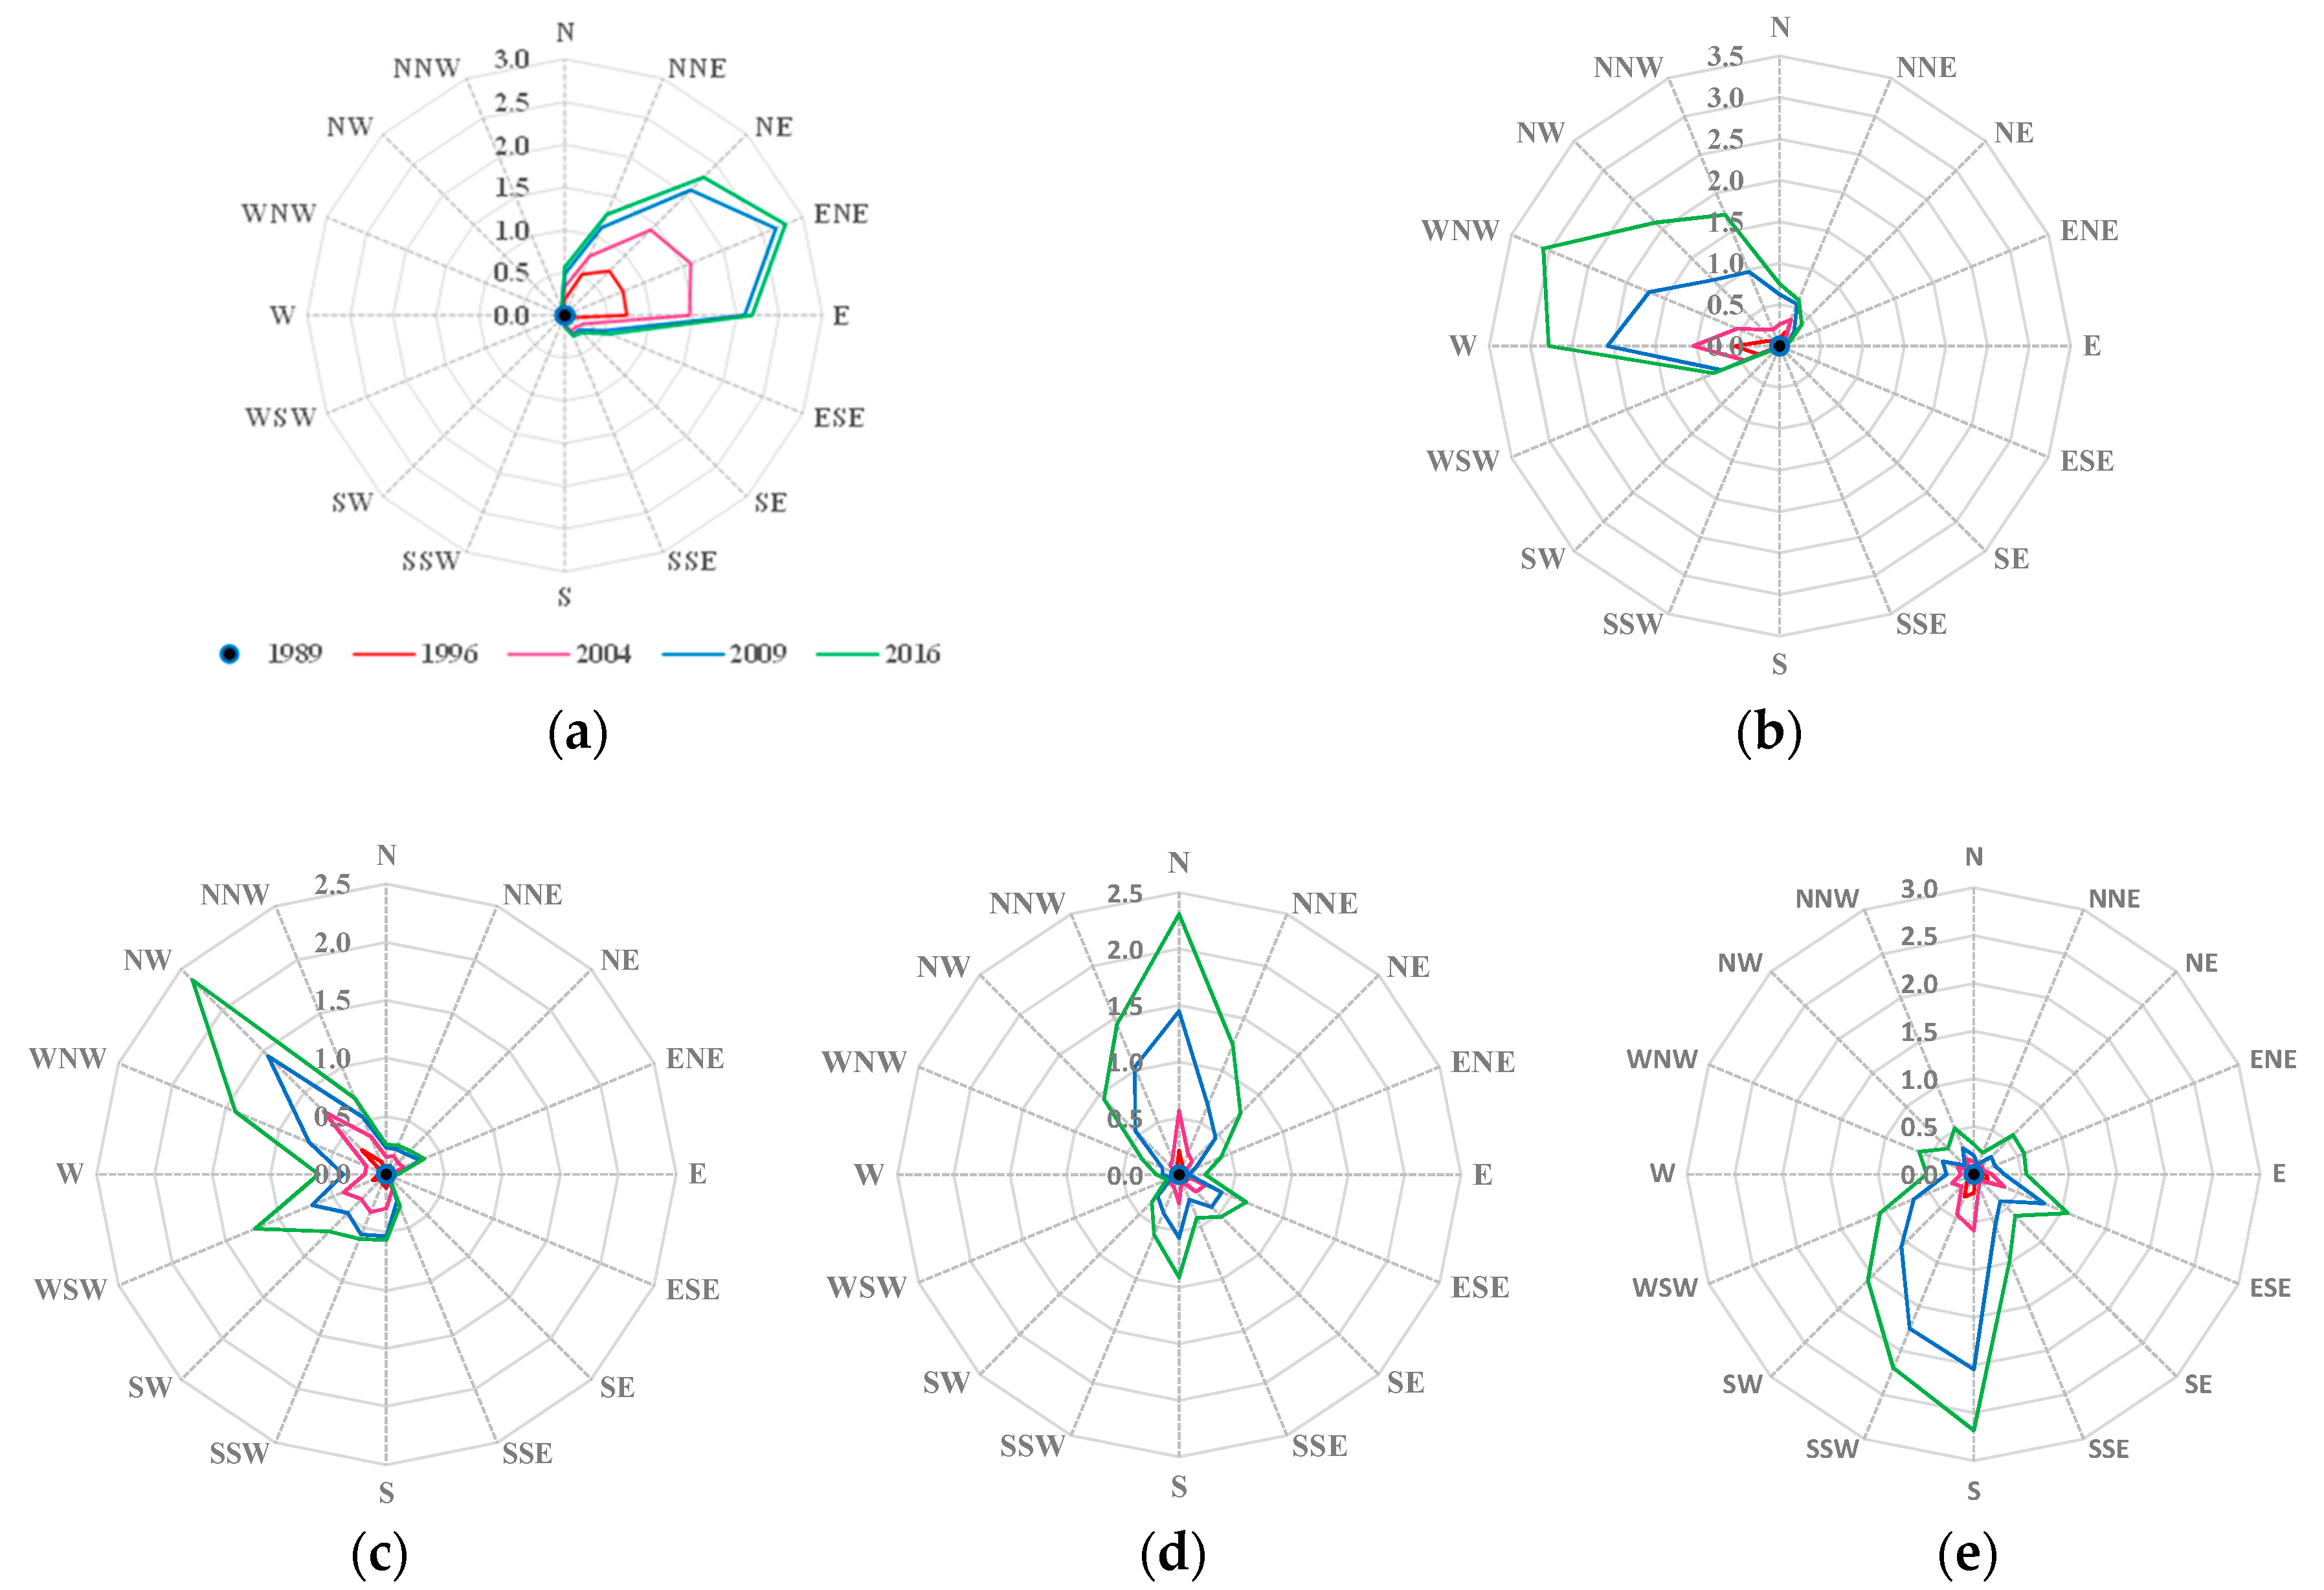
The spatial distribution of the expansion of ISA in Xiamen city during the study period is presented in Figure 4 and Table 4. In Xiamen Island, the ISA expanded multi-directionally before 2009, that is, to the northeast, east-northeast, and east. However, between 2009 and 2016, the expansion was more uni-directional, that is, towards the northeast, and lower ISEI values were observed. In the Jimei, Haicang, Xiang′an, and Ton′g′an districts, the ISA expansion was uni-directional before 2004; however, between 2009 and 2016, the expansion became multi-directional, and higher ISEI values were observed. In Jimei District, the ISA mainly expanded to the west between 1989 and 2004, and then expanded gradually to the west-northwest and northwest between 2004 and 2016. In Haicang District, the ISA expanded to the northwest between 1989 and 1996, to the west-southwest between 1996 and 2004, and to the west-southwest and northwest–west-northwest during 2004–2016. In Xiang’an District, the ISA mainly expanded to the north between 1989 and 2004, and expanded significantly to the north, north-northeast, and north-northwest between 2004 and 2015. In Tong’an District, the ISA mainly expanded to the south-southwest between 1989 and 1996, expanded to the south and south-southwest between 1996 and 2004, and expanded gradually to the south, south-southwest, and southwest between 2004 and 2016. In Xiamen Island, the ISA mainly expanded to the northeast, east-northeast (ENE), and east between 1989 and 2009. However, between 2009 and 2016, the ISA expansion sharply decreased in all directions except the northeast.
4.2. Changes in Urban Heat Islands
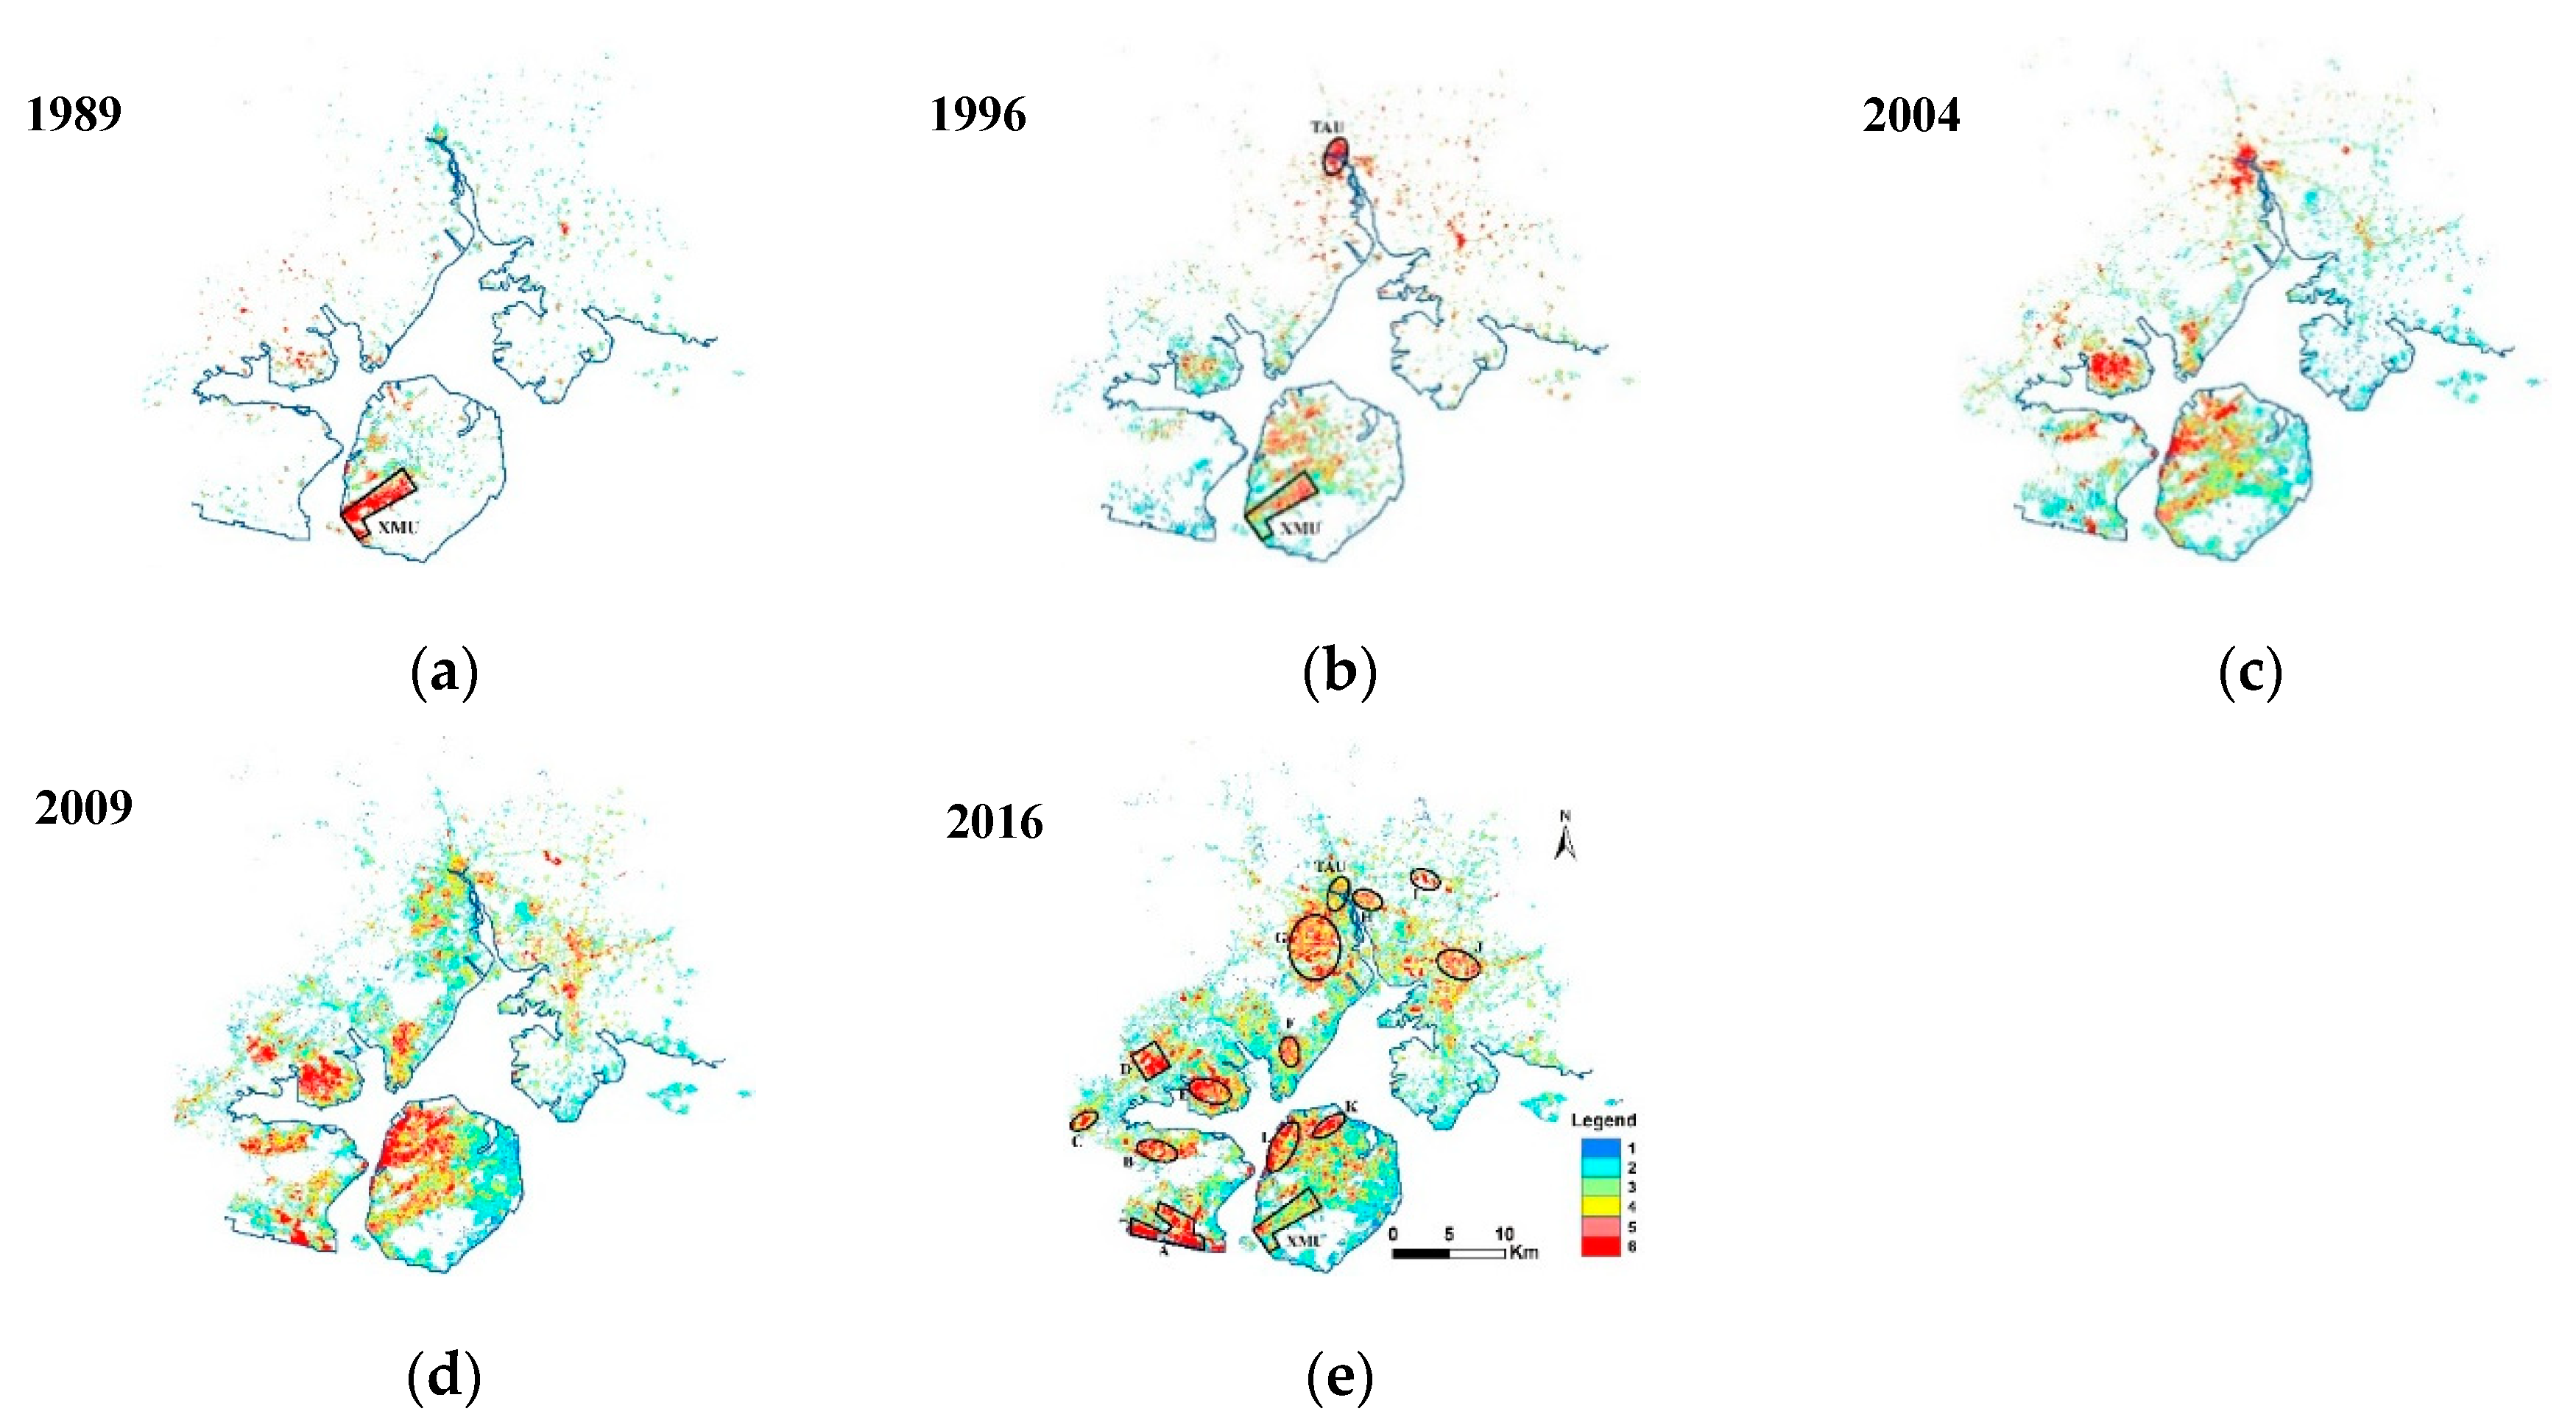
Figure 5a–e shows the distribution of UHIs in Xiamen city over the study period. As can be seen in the figure, similar to the changes in ISA shown in Figure 2, the distribution of UHIs varied significantly.
Table 5 shows statistics of the LST of impervious and non-impervious areas (NIAs) in Xiamen from 1989 to 2016. As shown in the table, in general, impervious areas exhibited a higher LST than non-impervious areas. The mean intensities of the UHIs (that is, the mean difference in LST between the urban ISA and the NIAs) were, on average, 3.56, 2.92, 3.01, 3.93, and 6.36 K in 1989, 1996, 2004, 2009, and 2016, respectively. The large standard deviations of LST for ISA indicate that these surfaces experience a large variation in LST due to the use of diverse construction materials. Furthermore, the higher standard deviation of the LST for NIAs in 2009 and 2016 shows that great temperature fluctuations occurred over the study area in these years (Table 5). These results indicate that urbanization increased the LST by an average of 3.56 and 6.36 K in 1989 and 2016, respectively, by replacing natural environments (vegetation and water) with non-transpiring, non-evaporating surfaces such as stone, asphalt, and concrete. This observation suggests that the construction of ISA could contribute to the development of UHIs much more than the construction of NIAs (such as forestland, water, and cultivated land), and that urban expansion raises the land surface temperature. Therefore, the effects of UHIs can be mitigated by optimizing land development, land-use planning, and constructing areas of natural vegetation.
The distribution and intensities of UHIs in Xiamen city changed greatly from 1989 to 2016. In 1989, the UHI hotspots (i.e., clusters of neighboring thermal patches that have higher UHI grades) [49] mainly occurred in the old downtown area of the city (Figure 5a), which contains a number of urban villages and traditional heavy industries. As urbanization continued, new hotspots appeared in the districts of Jimei, Tong’an, Haicang, and Xiang’an. By 2016, the number of UHI hotspots in the urban area had increased to 12 (Figure 5e). The new hotspots were likely due to the rapid development of airports, seaports (such as the Xiamen Xiangyu Bonded Zone and the Haicang Bonded Port), and heavy industries, such as the food, automobile, petrochemical, and machine-building industries (Figure 5). For example, there are plans to construct an industrial area with a size of approximately 12 km2 in the main industrial zone in Tong’an District, which would become the largest industrial area in Xiamen city. Almost all of the UHI hotspots in Xiamen exist along the coastline of Xiamen Island or in the four bay areas, except for two hotspots in Xiang’an District (Figure 5e). The spatial distribution of UHI hotspots results in a bay-like UHI form. This form is obviously distinct from the central-radial UHI pattern caused by ISA expansion in the form of concentric circles around a central area that was observed in other cities in previous studies. In the central-radial UHI pattern, the highest UHI grades appear in the central area and UHI grades gradually decrease with increasing distance from the center. The central-radial UHI pattern was observed by Mathew et al. [50] in Chandigarh City, India. The UHI form in Xiamen is similar to that reported for Hong Kong by Li and Zhang [51].
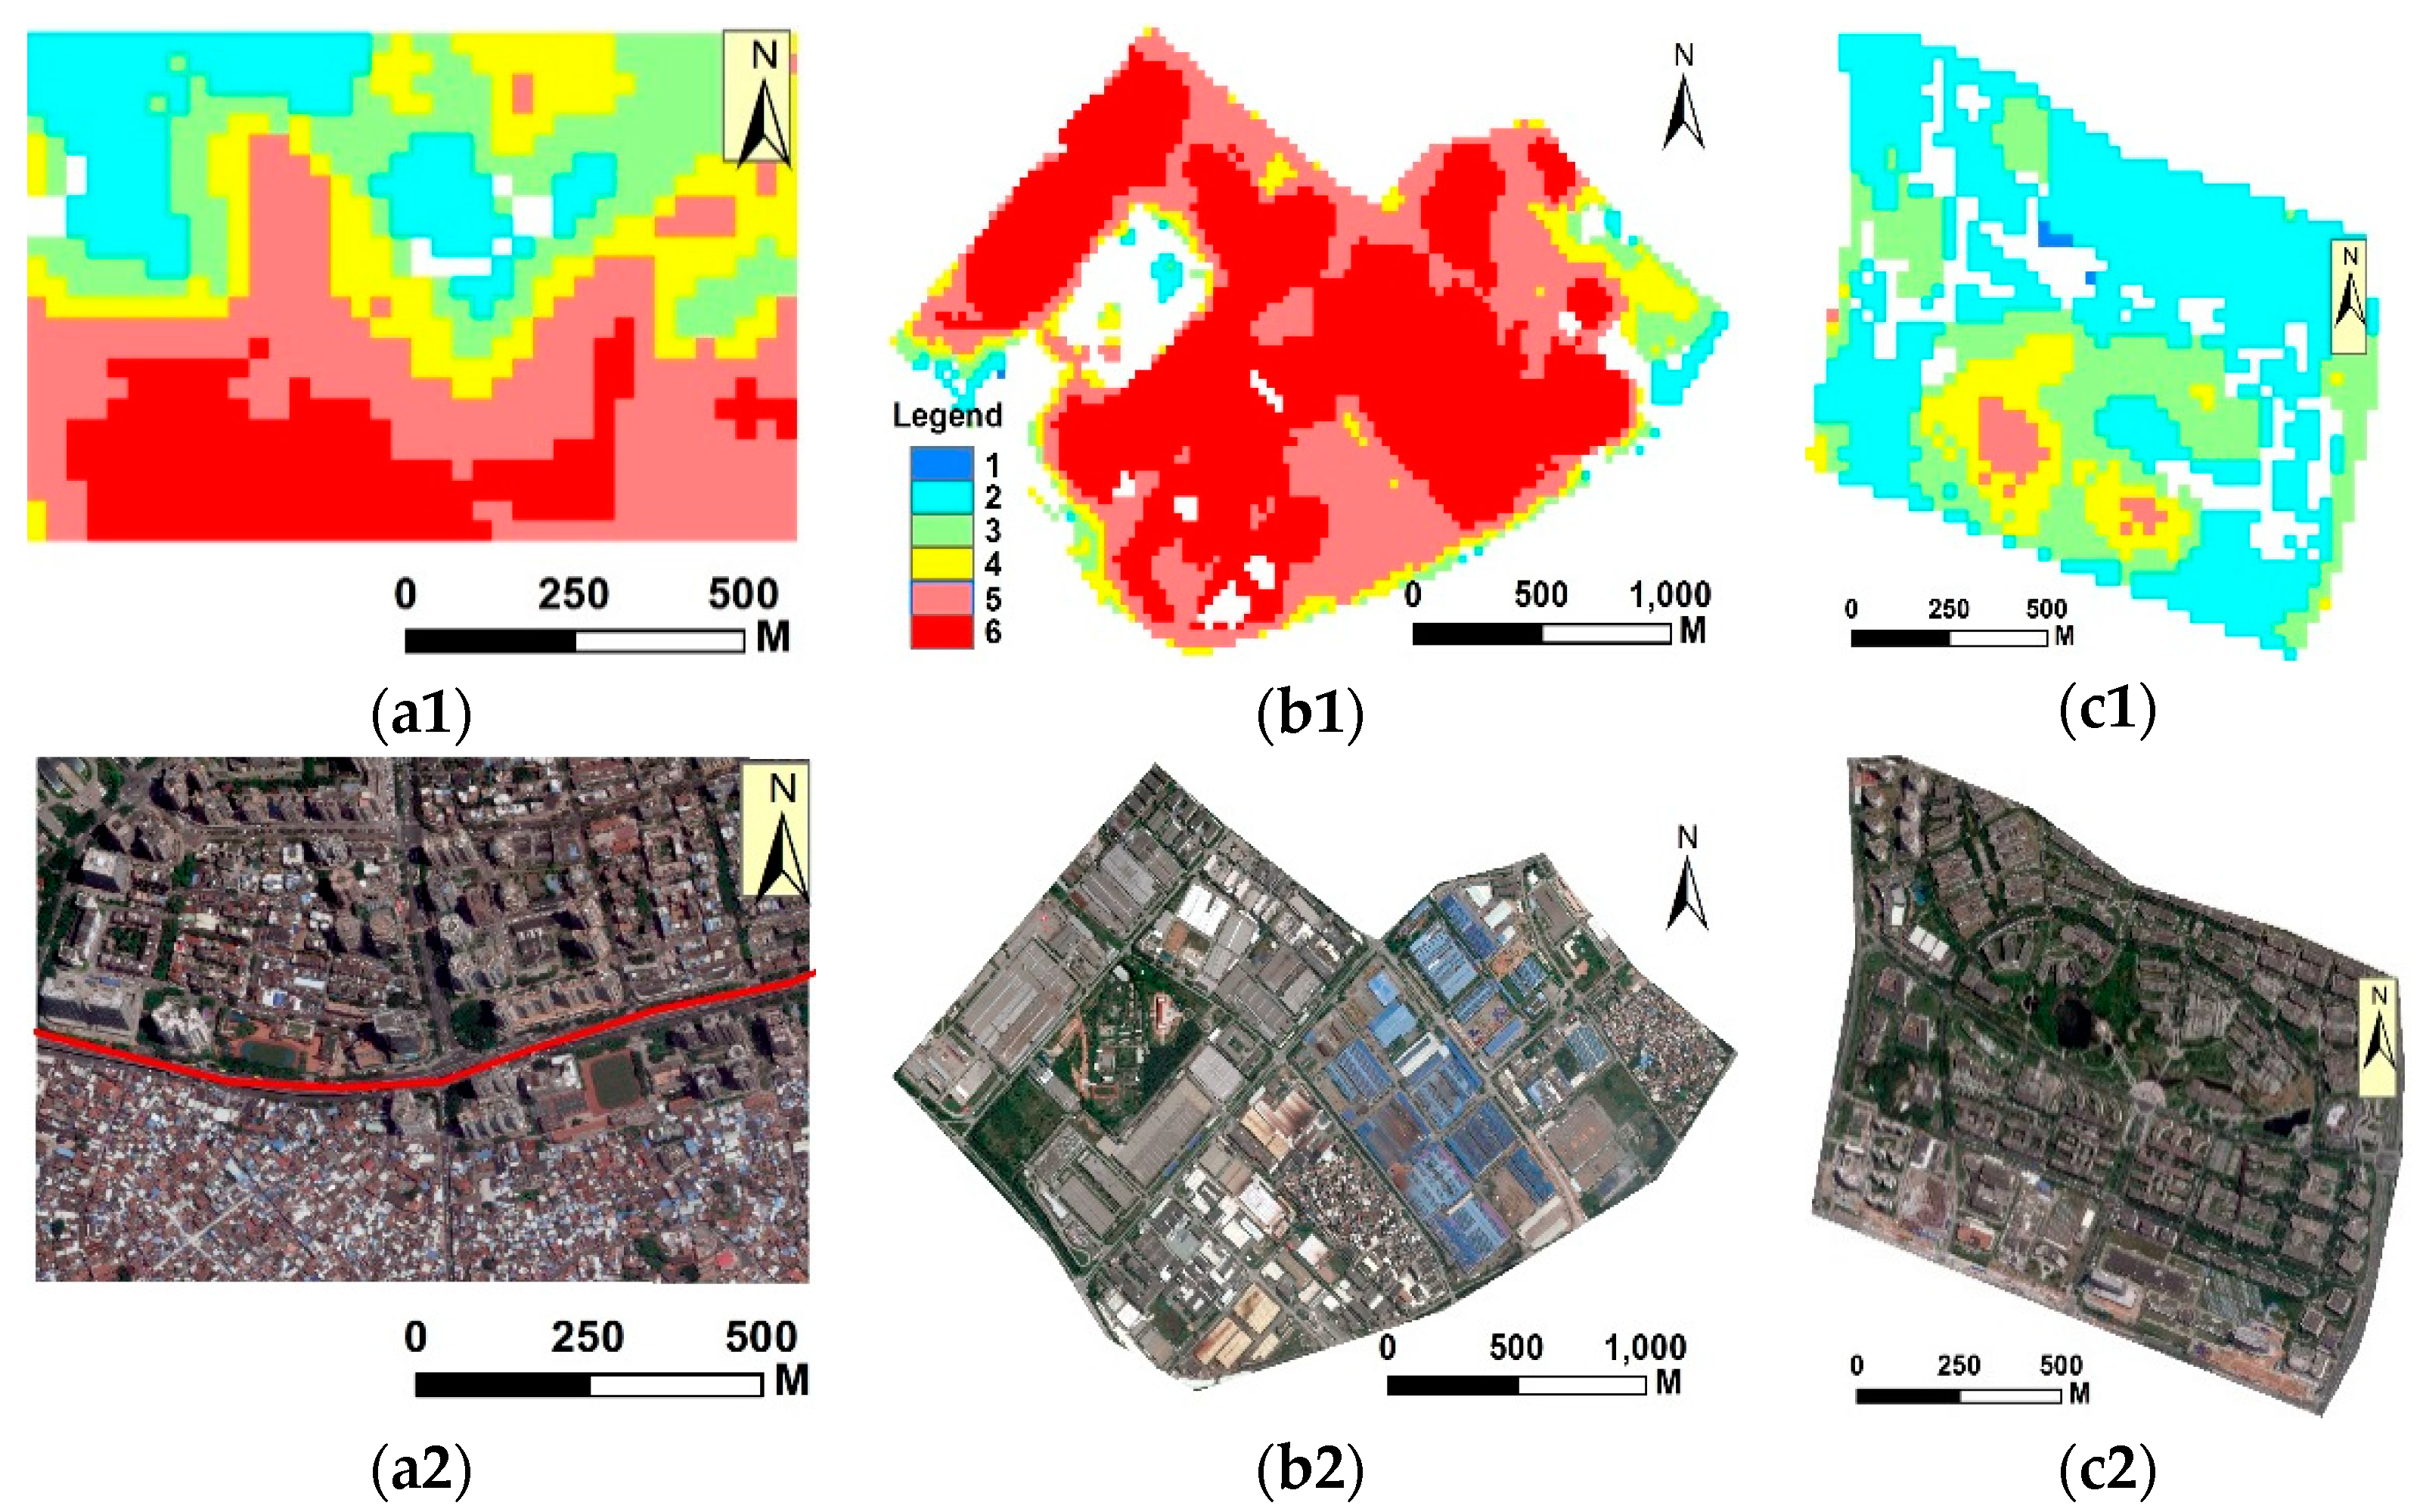
This work suggests that seaports and heavy industrial activities may increase the temperature of the urban environment. For example, seaports that are built on massive areas of reclaimed wetland have extremely high ISA, and could lead to the presence of large UHIs. As shown in Figure 6(b1),(c1), there is a great difference in the UHI level between zones of heavy industry (Guankou industrial area) and zones of high-technology industry (Xiamen software park). Zones of heavy industry have high impervious surface areas, large areas of endothermic roofing, and produce large amounts of waste heat, and could therefore also contribute to the creation of UHIs. This was also noted by Zhao et al. [49]. On the contrary, zones of high-technology industry form “cool” islands as they have low impervious surface areas, lower endothermic roofing area, no waste heat release, and large areas of vegetation. Additionally, from Figure 6(a1), a clear difference can be observed between “cool” islands in high-rise residential areas and heat islands in urban villages. Figure 6(a1) indicates that high-density low-rise urban villages with low vegetation cover are another important thermal source for Xiamen city. There are a number of urban villages in Xiamen. Therefore, re-planning of the old downtown area, from urban villages to high-rise residential areas, is an important approach to mitigate UHIs.
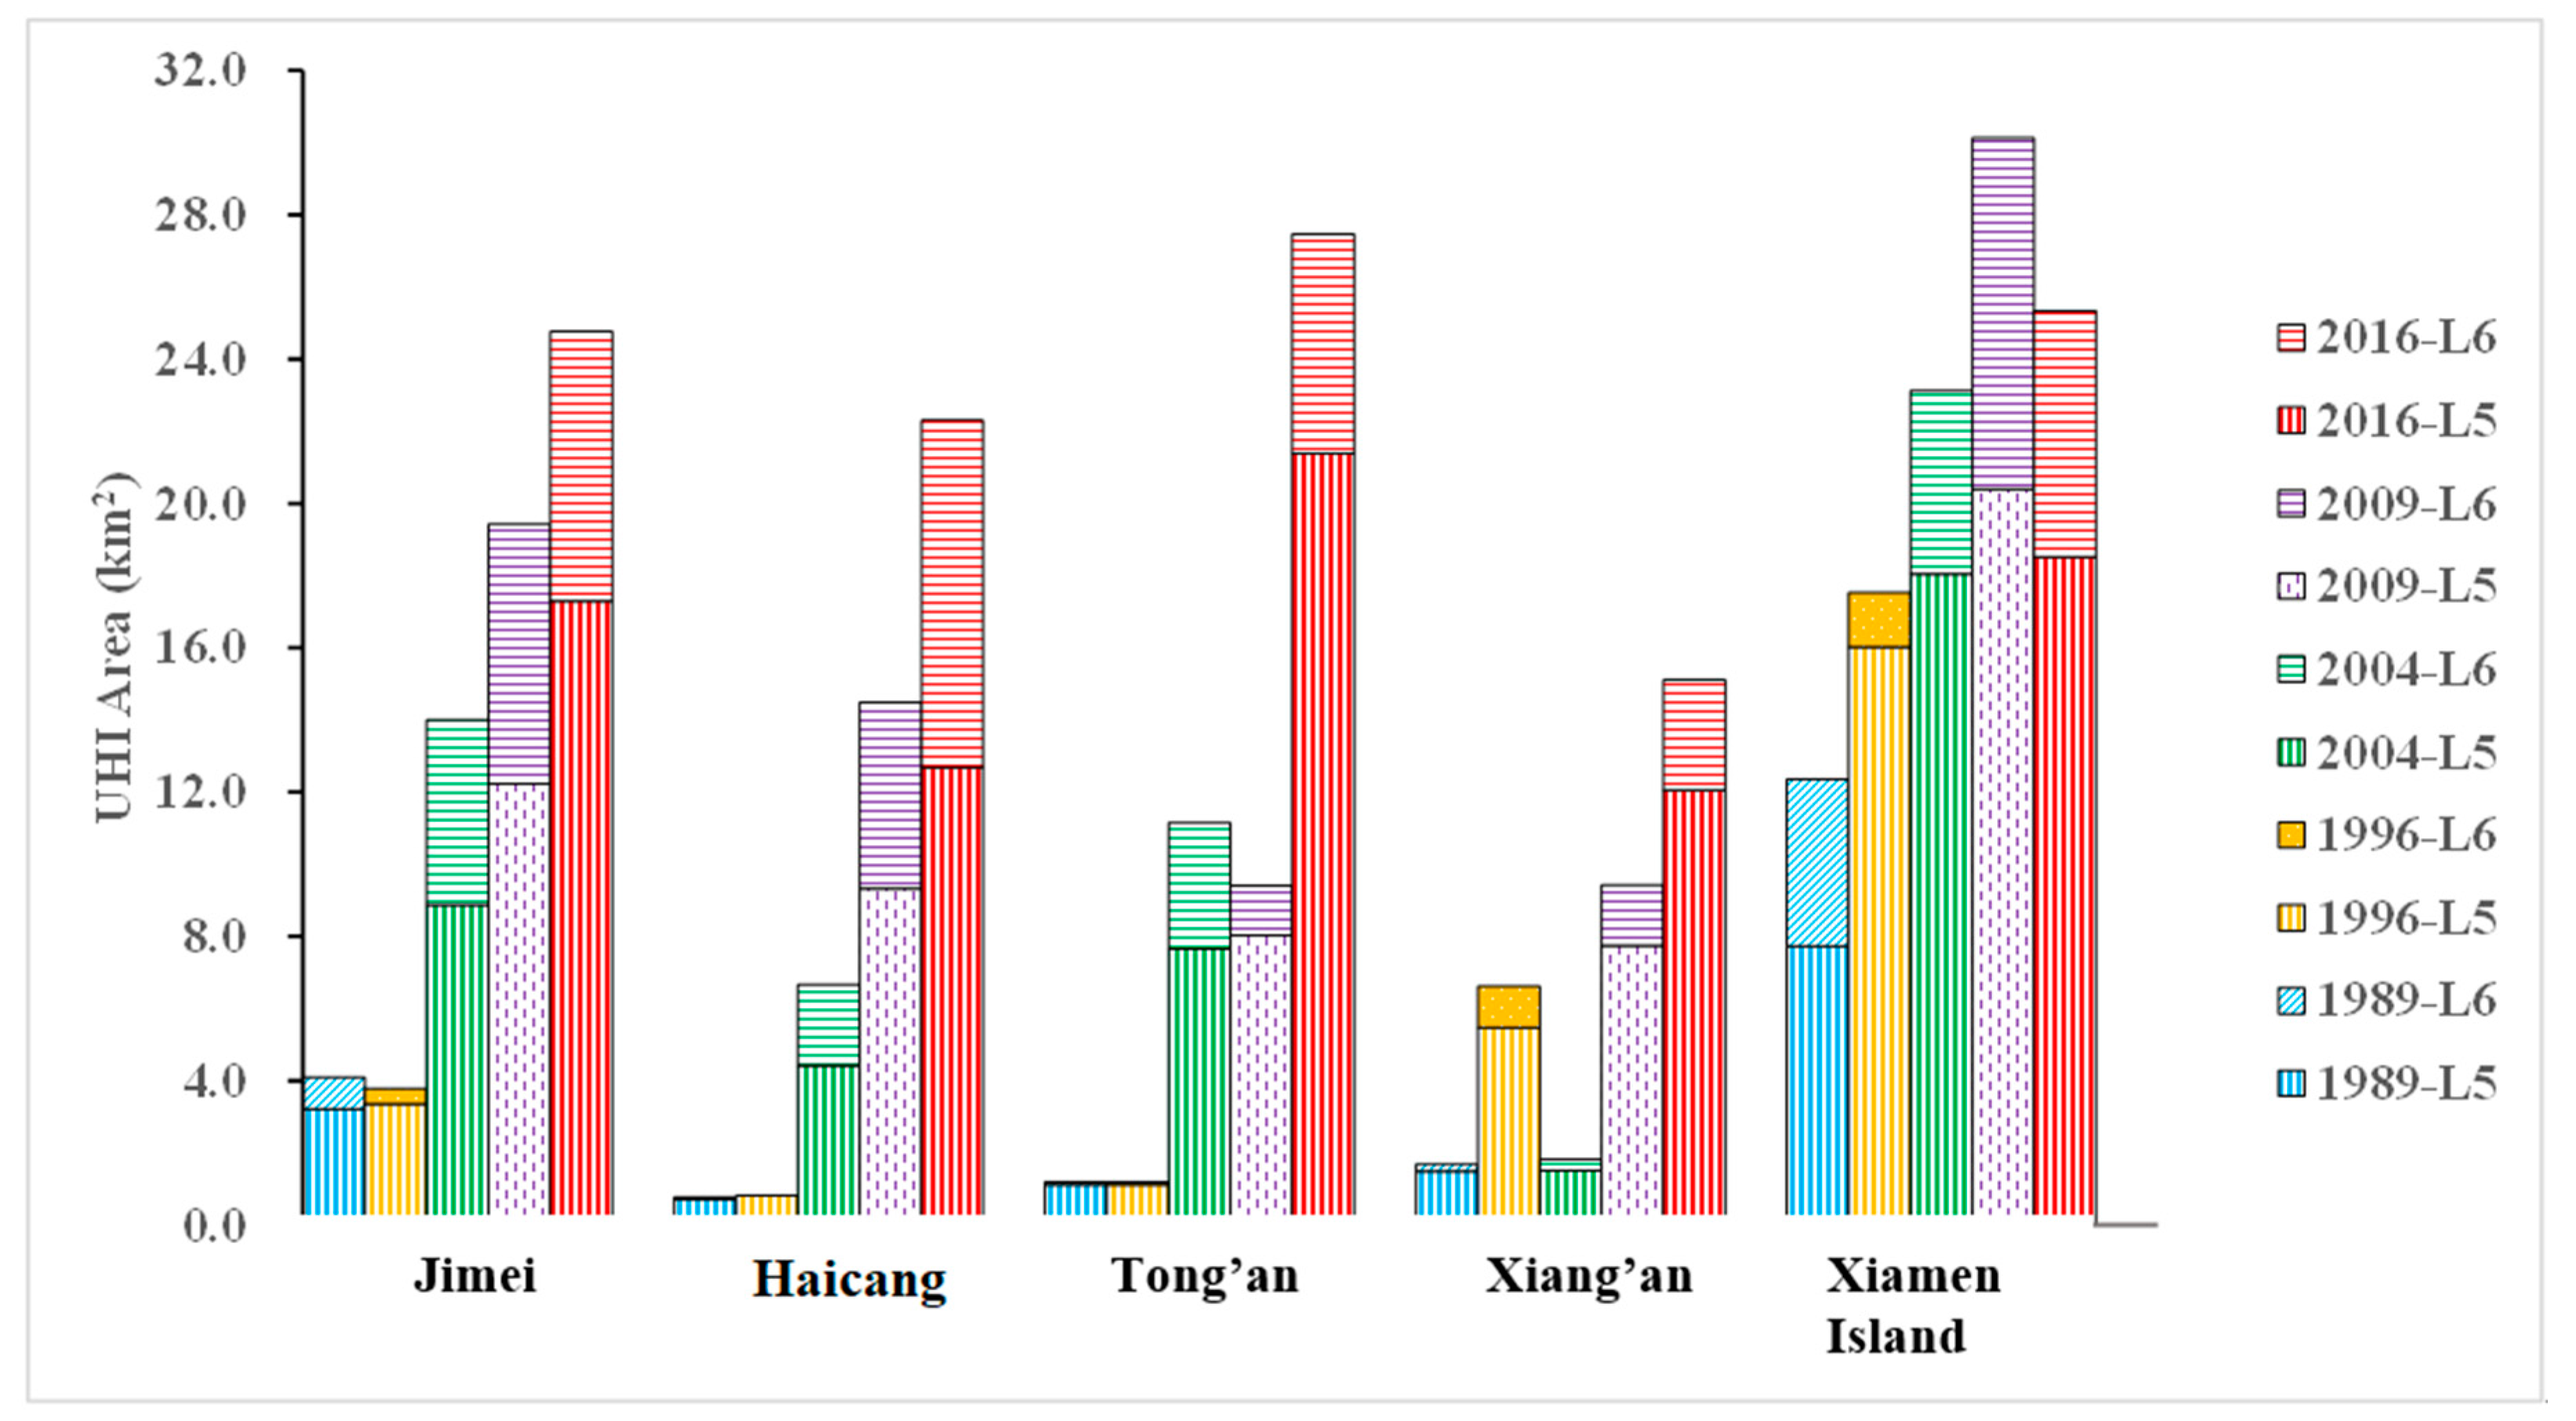
In this study, the UHI distribution zone was defined as the superposition of levels 5 and 6 of the normalized LST data. The total areas of the UHI distribution zone were 20.07, 39.47, 56.73, 82.88, and 114.98 km2 in 1989, 1996, 2004, 2009, and 2016, respectively, accounting for 1.18%, 2.32%, 3.34%, 4.88%, and 6.77% of the total area of the city in that year, respectively. As shown in Figure 7, before 2009, Xiamen Island had the largest UHI area among the five studied zones (Xiamen Island and Jimei, Haicang, Tong’an, and Xiang’an districts). In 2016, the area of UHIs in Tong’an District exceeded that in Xiamen Island, and the area of level-6 UHIs in Jimei District was greater than that in Xiamen Island. This finding suggests that the greatest intensity of UHIs may not always be located in Xiamen Island, and that UHI centers had spread from Xiamen Island to outside of the island by 2016. In 2016, Xiamen Island contained 51.6% of the population of Xiamen city and had a high population density of 12,823 people per square kilometer. However, in the same year, the UHI area in Xiamen Island only accounted for 22.04% of that of Xiamen city. This indicates that population density is not a key factor related to surface UHI in Xiamen city.
The URI values were 0.281, 0.285, 0.239, 0.231, and 0.229 in 1989, 1996, 2004, 2009, and 2016, respectively; that is, while the area of UHIs increased over the study period, the URI decreased. In 1989, 9.23% of the urban area of Xiamen city corresponded to the highest LST level (level 6) while 22.6% corresponded to level 5; by 2016, the same values had reduced to 7.48% and 18.57%, respectively. This can be clearly observed in the old downtown area by comparing Figure 5a,b,e. This indicates that the relative area of UHIs slightly reduced in the old downtown area during the study period. As shown in Figure 5, in 1989, there was a large concentrated area with a level-6 LST in this area; however, the LST of this area had largely reduced to level 4 or 5 by 2004 and had reduced even further by 2016. This change can largely be attributed to the fact that the local government and the public took measures to improve the living environment of the old downtown area. First, in the early 1990s, Xiamen‘s local government proposed a new policy for the development of industry, which encouraged the development of the tertiary industry in Xiamen Island and the removal of primary and secondary industries to areas outside of Xiamen Island. Therefore, a large number of heavy industry factories were moved out of Xiamen Island. Second, since 1989, Xiamen’s ecological green space has been greatly expanded. For example, in 2001, Xiamen had 31 parks with a combined area of 4.51 km2 while in 2016, it had 120 parks with a combined area of 26.04 km2. Moreover, by the end of 2020, the number of parks in Xiamen city (including integrated parks, mountain parks, special parks, and community parks) is expected to reach 342 and cover a total area of 124.20 km2, including 40.52 km2 of green buffers and 83.68 km2 of park green. Additionally, in the 1990s, plans for the redevelopment of urban villages were proposed by Xiamen’s local government. Some urban villages in Xiamen city have been transformed from high-density low-rise residential areas with scarce vegetation cover to low-density high-rise residential areas with high vegetation cover. All of the above efforts have contributed significantly to mitigating the effects of UHIs in Xiamen city.
4.3. Relationships between LST and ISA%, Vegetation Fraction, and NDVI
Impervious surfaces and water and vegetation areas are all critical biophysical components of urban ecosystems, and the interactions between these three components can significantly affect the urban temperature.
As shown in Figure 8(a1–a5), a very strong linear relationship (R2 ≥ 0.93) was observed between the mean LST and the ISA% throughout the study period, with the R2 value exceeding 0.96 between 1989 and 2009. The steepest slope of the linear correlation between LST and ISA% was observed for the Landat-8 image acquired in summer 2016, indicating that the magnitude of UHIs (i.e., the difference in LST between urban and rural areas) was largest in summer 2016. The lowest difference between the LST of rural and urban areas was found for the image acquired in summer 1996, which indicates that the lowest UHI magnitude occurred at this time. Each 10% increase in ISA was associated with an increase in summer LST of 0.41 to 0.91 K, which compares well with the results of related studies. Yuan and Bauer [14] reported a 0.95 K increase in summer LST corresponding to a 10% increase in ISA in the Twin Cities Metropolitan Area, Minnesota, USA while Li et al. [15] observed a 0.52 K increase in summer LST corresponding to a 10% increase in ISA in Shanghai, China.
The relationships between the mean LST and the NDVI are presented in Figure 8(c1–c5). Overall, a negative correlation is found between LST and the NDVI from 1989 to 2016. However, the trends are not stable, with a significant change in behavior being observed at an NDVI of around 0.2 for all the studied years. This indicates heterogeneous effects from various non-vegetated areas, such as wetland, bare soil, and high-density urban surfaces. These observations suggest that using the NDVI to investigate UHIs is complicated since the NDVI is sensitive to land use changes caused by rapid urbanization. Furthermore, previous research found that the relationship between LST and the NDVI experiences strong seasonal changes [14,15].
The Fv has been considered to be a very accurate representation of vegetation abundance [16]. The results of the zonal analysis (Figure 8(b1–b5)) indicate that a strong negative correlation exists between LST and Fv, with R2 values exceeding 0.94 for all the studied years. Each 0.1 increase in Fv was associated with a decrease in summer LST of 0.43 to 0.97 K. This result also compares well with the results of previous studies. Li et al. [15] reported a 0.61 K decrease in summer LST and a 0.31 K decrease in spring LST corresponding to a 0.1 increase while Ma et al. [16] reported a 0.80 K decrease in summer LST corresponding to a 0.1 increase.
Yuan and Bauer [14] and Li et al. [15] observed a strong linear relationship between LST and ISA% using zonal analysis and the LSMA. Conversely, another study [22] found an exponential relationship between these two parameters based on a per-pixel analysis and the NDISI. The results of the present study suggest that a linear relationship exists between LST and ISA% using zonal analysis and the BCI, similar to the findings of Yuan and Bauer [14] and Li et al. [15].
5. Summary and Conclusions
Landsat 5 TM and Landsat 8 TIRS/OLI thermal infrared images are of great use in the analysis of UHIs. Using quantitative remote sensing images and statistical methods, this study investigated the impacts of rapid urban expansion on the UHIs of a coastal city (Xiamen city, China) between 1989 and 2016.
The ISA can be a key environmental indicator. In this study, the ISA was estimated from the remote sensing images using the BCI method. It is essential to distinguish impervious surfaces from bare soil and beach land when using the BCI method to estimate urban ISA in places that have experienced rapid urbanization, especially in coastal cities; however, this is complicated due to the similar spectral properties of these three surface types. The use of the BCI combined with an ISA post-processing method produced satisfactory results in terms of ISA identification accuracy (overall accuracies ≥90.50% and Kappa values ≥0.810).
The results show that the ISA of Xiamen city increased 6.1-fold between 1989 and 2016. This rapid expansion of ISA was mainly attributable to the reclamation of coastal, arable, and forest land. The ISA expansion was gradual, and was mostly focused along Haicang Bay, Xinglin Bay, Tong’an Bay, Malyuan Bay, and the coastline of Xiamen Island. The directions of ISA extension were generally consistent throughout the study period in all of the five districts of Xiamen city.
The results of this study indicate that the intensity, size, and distribution of UHIs in Xiamen city changed during the study period due to urban expansion. The expansion of ISA is a major contributor to the size and intensity of UHIs, and therefore to urban climatic warming. Moreover, the results of this study show that the spatiotemporal variation of UHIs is very likely to be due to surface changes caused by the rapid expansion of ISA, the reduction of vegetated areas, and the development of industries that produce large amounts of waste heat. Due to the fact that ISA expansion is constrained by the coastline, combined with urban development planning, Xiamen has a bay-like UHI form. This UHI form is markedly distinct from the central-radial UHI form observed in other cities in previous studies.
In Xiamen, sea ports and heavy industries are the most important contributors to surface UHIs while another important contributor is urban villages. In contrast, high-rise residential areas and new-technology industry produce relatively “cool” temperature islands. This result suggests that certain measures (e.g., the appropriate distribution of industry, increasing the coverage of forest and park lands, the use of less endothermic roofing material, and the re-planning of urban villages) could effectively alleviate the effect of UHIs, and could thus increase the healthiness of the urban environment and promote sustainable development. Between 1989 and 2016, the total area of UHIs increased 4.7-fold (i.e., the area of UHIs increased at a lower rate than the ISA did). However, during the same period, the ratio of the UHI area to the total ISA decreased slightly. Furthermore, the size and intensity of UHIs reduced in some parts of Xiamen city during the study period due to a significant increase in vegetation coverage, the re-planning of the old downtown area, and the construction of new parks.
The results of the zonal analysis suggest that a strong positive correlation exists between LST and ISA%, consistent with the findings of recent research. Each 10% increase in ISA was associated with an increase in summer LST of 0.41 to 0.91 K, which compares well with the results of related studies. The relationship between LST and the NDVI is more complicated, since the NDVI is sensitive to variations in land use cover and seasonal variations; however, at higher NDVI values, a negative linear correlation is observed between LST and the NDVI. This study indicates that the analysis of the ISA is useful for investigating changes in surface UHIs over time.
This study presents useful information for the sustainable planning of urban areas and for the mitigation of the effects of UHIs. Urban ISA growth patterns may affect the distribution patterns of UHIs. Bay-like cities may be less compact than central-radial cities. Determining which ISA growth pattern(s) are helpful to mitigate UHIs strongly merits future research. Furthermore, it is recommended that more remote sensing images with a higher spatial resolution (e.g., from the Sentinel-2 or Gaofen-1 satellites) and covering more metropolitan areas in different climatic zones should be extensively investigated to improve the quantitative remote sensing of land surface temperature in order to better determine the effects of urban development on the thermal environment of urban areas.
Author Contributions
L.H. made essential contributions to the research design and the image data processing and analysis. L.T. provided important concepts for the study. X.Z. modified the paper critically. Q.N. and F.S. provided original Landsat images, offered analysis tools, and carried out data cleaning. All authors have read and agreed to the published version of the manuscript.
Funding
This research was funded by the National Natural Science Foundation of China (Nos. 41471366, 41501447), the Educational Commission of Fujian Province of China (JAT170420) and the Fujian Natural Science Foundation, China (2017J01469, 2017J01666, 2017J05069).
Conflicts of Interest
The authors declare no conflict of interest.
References
- Vaz, E.; Aversa, J. A Graph theory approach for geovisualization of land use change: An application to Lisbon. J. Spat. Organ. Dyn. 2013, 1, 254–264. [Google Scholar]
- 2018 Revision of World Urbanization Prospects. Available online: https://www.un.org/development/desa/publications/2018-revision-of-world-urbanization-prospects.html (accessed on 16 May 2018).
- Residency Shift Part of Plan to Boost Urban Base. Available online: http://en.ce.cn/main/latest/201904/09/t20190409_31819121.shtml (accessed on 4 April 2019).
- National Bureau of Statistics of China. China Statistical Yearbook 2019; China Statistics Press: Beijing, China, 2019.
- Xu, H.; Lin, D.; Tang, F. The impact of impervious surface development on land surface temperature in a subtropical city: Xiamen, China. Int. J. Climatol. 2013, 33, 1873–1883. [Google Scholar] [CrossRef]
- Xian, G.; Crane, M. An analysis of urban thermal characteristics and associated land cover in tampa bay and Las Vegas using landsat satellite data. Remote Sens. Environ. 2006, 104, 147–156. [Google Scholar] [CrossRef]
- Voogt, J.A.; Oke, T.R. Thermal remote sensing of urban climates. Remote Sens. Environ. 2003, 86, 370–384. [Google Scholar] [CrossRef]
- Grimm, N.B.; Faeth, S.H.; Golubiewski, N.E.; Wu, J.; Bai, X.M.; Briggs, J.M. Global change and the ecology of cities. Science 2008, 319, 756–760. [Google Scholar] [CrossRef] [PubMed] [Green Version]
- Wu, H.; Ye, L.P.; Shi, W.Z.; Clarke, K.C. Assessing the effects of land use spatial structure on urban heat islands using HJ-1B remote sensing imagery in Wuhan, China. Int. J. Appl. Earth Obs. Geoinf. 2014, 32, 67–78. [Google Scholar] [CrossRef]
- Mountrakis, G.; Luo, L. Enhancing and replacing spectral information with intermediate structural inputs: A case study on impervious surface detection. Remote Sens. Environ. 2011, 115, 1162–1170. [Google Scholar] [CrossRef]
- Voorde, T.V.D.; Roeck, T.D.; Canters, F. A comparison of two spectral mixture modelling approaches for impervious surface mapping in urban areas. Int. J. Remote Sens. 2009, 30, 4785–4806. [Google Scholar] [CrossRef]
- Okujeni, A.; Linden, S.V.D.; Hostert, P. Extending the vegetation–impervious–soil model using simulated EnMAP data and machine learning. Remote Sens. Environ. 2015, 158, 69–80. [Google Scholar] [CrossRef]
- Mohapatra, R.P.; Wu, C. High resolution impervious surface estimation. Photogramm. Eng. Remote Sens. 2010, 76, 1329–1341. [Google Scholar] [CrossRef] [Green Version]
- Yuan, F.; Bauer, M.E. Comparison of impervious surface area and normalized difference vegetation index as indicators of surface urban heat island effects in Landsat imagery. Remote Sens. Environ. 2007, 106, 375–386. [Google Scholar] [CrossRef]
- Li, J.; Song, C.; Cao, L.; Zhu, F.G.; Meng, X.L.; Wu, J.G. Impacts of landscape structure on surface urban heat islands: A case study of Shanghai, China. Remote Sens. Environ. 2011, 115, 3249–3263. [Google Scholar] [CrossRef]
- Ma, Y.; Kuang, Y.; Huang, N. Coupling urbanization analyses for studying urban thermal environment and its interplay with biophysical parameters based on TM/ETM+ imagery. Int. J. Appl. Earth Obs. 2010, 12, 110–118. [Google Scholar] [CrossRef]
- Powell, R.L.; Roberts, D.A.; Dennison, P.E.; Hess, L.L. Sub-pixel mapping of urban land cover using multiple endmember spectral mixture analysis: Manaus, Brazil. Remote Sens. Environ. 2007, 106, 253–267. [Google Scholar] [CrossRef]
- Carlson, T.N.; Arthur, S.T. The impact of land use-land cover changes due to urbanization on surface microclimate and hydrology: A satellite perspective. Glob. Planet. Chang. 2000, 25, 49–65. [Google Scholar] [CrossRef]
- Xu, H.Q. Analysis of Impervious Surface and its impact on urban heat environment using the normalized difference impervious surface index (NDISI). Photogramm. Eng. Remote Sens. 2010, 76, 557–565. [Google Scholar] [CrossRef]
- Deng, C.; Wu, C. BCI: A biophysical composition index for remote sensing of urban environments. Remote Sens. Environ. 2012, 127, 247–259. [Google Scholar] [CrossRef]
- Meng, Q.; Zhang, L.; Sun, Z.; Meng, F.; Wang, L.; Sun, Y.X. Characterizing spatial and temporal trends of surface urban heat island effect in an urban main built-up area: A 12-year case study in Beijing, China. Remote Sens. Environ. 2018, 204, 826–837. [Google Scholar] [CrossRef]
- Liu, C.; Shao, Z.F.; Chen, M.; Luo, H. MNDISI: A multi-source composition index for impervious surface area estimation at the individual city scale. Remote Sens. Lett. 2013, 4, 803–812. [Google Scholar] [CrossRef]
- Sun, G.Y.; Chen, X.L.; Jia, X.P.; Yao, Y.J.; Wang, Z.J. Combinational Build-Up Index (CBI) for effective impervious surface mapping in urban areas. IEEE J. Sel. Top. Appl. Earth Observ. Remote Sens. 2016, 9, 2081–2092. [Google Scholar] [CrossRef]
- Onishi, A.; Cao, X.; Ito, T.; Shi, F.; Imur, H. Evaluating the potential for urban heat-island mitigation by greening parking lots. Urban For. Urban Green. 2010, 9, 323–332. [Google Scholar] [CrossRef]
- Xiong, Y.Z.; Huang, S.P.; Chen, F.; Ye, H.; Wang, C.P.; Zhu, C.B. The Impacts of rapid urbanization on the thermal environment: A remote sensing study of Guangzhou, south China. Remote Sens. 2012, 4, 2033–2056. [Google Scholar] [CrossRef] [Green Version]
- Hua, L.Z.; Liao, J.F.; Chen, H.X.; Chen, D.K.; Shao, G.F. Assessment of ecological risks induced by land use and land cover changes in Xiamen city, China. Int. J. Sustain. Dev. World Ecol. 2018, 25, 439–447. [Google Scholar] [CrossRef]
- Hua, L.Z.; Tang, L.N.; Cui, S.H.; Yin, K. Simulating urban growth using the SLEUTH model in a coastal peri-urban district in China. Sustainability 2014, 6, 3899–3914. [Google Scholar] [CrossRef] [Green Version]
- Tang, L.N.; Zhao, Y.; Yin, K.; Zhao, J. City profile: Xiamen. Cities 2013, 31, 615–624. [Google Scholar] [CrossRef]
- Hua, L.Z.; Li, X.Q.; Tang, L.N.; Yin, K.; Zhao, Y. Spatio-temporal dynamic analysis of island-city landscape: A case study of Xiamen Island, China. Int. J. Sustain. Dev. World Ecol. 2010, 17, 273–278. [Google Scholar] [CrossRef]
- Chavez, P.S. Image-based atmospheric corrections—Revisited and revised. Photogramm. Eng. Rem. Sens. 1996, 62, 1025–1036. [Google Scholar]
- Lu, D.; Mausel, P. Assessment of atmospheric correction methods applicable to Amazon basin LBA research. Int. J. Remote Sens. 2002, 23, 2651–2671. [Google Scholar] [CrossRef]
- Ke, Y.; Im, J.; Lee, J.; Lee, J.; Gong, H.; Ryu, Y. Characteristics of Landsat 8 OLI-derived NDVI by comparison with multiple satellite sensors and in-situ observations. Remote Sens. Environ. 2015, 164, 298–313. [Google Scholar] [CrossRef]
- Huete, A.R. A Soil-adjusted vegetation index (SAVI). Remote Sens. Environ. 1988, 25, 295–309. [Google Scholar] [CrossRef]
- Xu, H.Q. Modification of normalised difference water index (NDWI) to enhance open water features in remotely sensed imagery. Int. J. Remote Sens. 2006, 27, 3025–3033. [Google Scholar] [CrossRef]
- Wang, M.Y.; Xu, H.Q. Temporal and spatial changes of urban impervious surface and its influence on urban ecolo-gical quality: A comparison between Shanghai and New York. J. Appl. Ecol. 2018, 29, 236–247. [Google Scholar]
- Hua, L.Z.; Zhang, X.X.; Chen, X.; Kai, K.; Tang, L.N. A feature-based approach of decision tree classification to map time series urban land use and land cover with Landsat 5 TM and Landsat 8 OLI in a coastal city, China. ISPRS Int. J. Geo. Inf. 2017, 6, 331. [Google Scholar] [CrossRef] [Green Version]
- Crist, E.P. A TM tasseled cap equivalent transformation for reflectance factor data. Remote Sens. Environ. 1985, 17, 301–306. [Google Scholar] [CrossRef]
- Li, B.; Ti, C.; Zhao, Y.; Yan, X. Estimating soil moisture with Landsat data and its application in extracting the spatial distribution of winter flooded paddies. Remote Sens. 2016, 8, 38. [Google Scholar] [CrossRef] [Green Version]
- Man, W.; Nie, Q.; Hua, L.Z.; Wu, X.W.; Li, H. Spatio-temporal variations in impervious surface patterns during urban expansion in a coastal city: Xiamen, China. Sustainability 2019, 11, 2404. [Google Scholar] [CrossRef] [Green Version]
- Artis, D.A.; Carnahan, W.H. Survey of emissivity variability in thermography of urban areas. Remote Sens. Environ. 1982, 12, 313–329. [Google Scholar] [CrossRef]
- Jimenez-Munoz, J.C.; Cristobal, J.; Sobrino, J.A.; Soria, G.; Ninyerola, M.; Pons, X. Revision of the Single-Channel Algorithm for Land Surface Temperature Retrieval from Landsat Thermal-Infrared Data. IEEE Trans. Geosci. Remote Sens. 2009, 47, 339–349. [Google Scholar] [CrossRef]
- Sobrino, J.A.; Jimenez-Muoz, J.C.; Soria, G.; Romaguera, M.; Guanter, L.; Moreno, J.; Plaza, A.; Martinez, P. Land surface emissivity retrieval from different VNIR and TIR sensors. IEEE Trans. Geosci. Remote Sens. 2008, 46, 316–327. [Google Scholar] [CrossRef]
- Cai, Y.; Zhang, H.; Zheng, P.; Pan, W. Quantifying the impact of land use/land cover changes on the urban heat island: A case study of the natural wetlands distribution area of Fuzhou City, China. Wetlands 2016, 36, 285–298. [Google Scholar] [CrossRef]
- Xu, H.Q.; Chen, B.Q. Remote sensing of the urban heat island and its changes in Xiamen city of SE China. Int. J. Remote Sens. 2004, 16, 276–281. [Google Scholar]
- Liu, Y.X.; Peng, J.; Wang, Y.L. Diversification of land surface temperature change under urban landscape renewal: A case study in the main city of Shenzhen, China. Remote Sens. 2017, 9, 919. [Google Scholar] [CrossRef] [Green Version]
- Cheng, S.L.; Wang, T.X. Comparison analyses of equal interval method and mean-standard deviation method used to delimitate urban heat island. Geo Inf. Sci. 2009, 11, 145–150. [Google Scholar]
- Gutman, G.; Ignatov, A. The derivation of the green vegetation fraction from NOAA/AVHRR data for use in numerical weather prediction models. Int. J. Remote Sens. 1998, 19, 1533–1543. [Google Scholar] [CrossRef]
- Xu, H.Q.; Hu, X.; Guan, H.; Guan, H.D.; Zhang, B.B.; Wang, M.Y.; Chen, S.M.; Chen, M.H. A remote sensing based method to detect soil erosion in forests. Remote Sens. 2019, 11, 513. [Google Scholar] [CrossRef] [Green Version]
- Zhao, X.F.; Huang, J.; Ye, H.; Wang, K.; Qiu, Q.Y. Spatiotemporal changes of the urban heat island of a coastal city in the context of urbanisation. Int. J. Sustain. Dev. World Ecol. 2010, 17, 311–316. [Google Scholar] [CrossRef]
- Mathew, A.; Khandelwal, S.; Kaul, N. Spatial and temporal variations of urban heat island effect and the effect of percentage impervious surface area and elevation on land surface temperature: Study of Chandigarh City, India. Sustain. Cities Soc. 2016, 26, 264–277. [Google Scholar] [CrossRef]
- Liu, L.; Zhang, Y. Urban heat island analysis using the Landsat TM data and ASTER data: A case study in Hong Kong. Remote Sens. 2011, 3, 1535–1552. [Google Scholar] [CrossRef] [Green Version]
Figure 1.
The location of Xiamen city. A, B, C, and D show Haicang Bay, Maluan Bay, Xinglin Bay, and Tong’an Bay, respectively.
Figure 1.
The location of Xiamen city. A, B, C, and D show Haicang Bay, Maluan Bay, Xinglin Bay, and Tong’an Bay, respectively.

Figure 2.
The calculated expansion of impervious surface area (ISA) in Xiamen city during 1989–2016.
Figure 2.
The calculated expansion of impervious surface area (ISA) in Xiamen city during 1989–2016.

Figure 3.
Map detailing the conversion of water, vegetation, and bare land to ISA in Xiamen between 1989 and 2016.
Figure 3.
Map detailing the conversion of water, vegetation, and bare land to ISA in Xiamen between 1989 and 2016.

Figure 4.
Spatial distribution of the expansion of ISA in various areas of Xiamen city during 1989–2016. (a) Xiamen Island. (b) Jimei District. (c) Haicang District. (d) Xiang′an District. (e) Tong′an District.
Figure 4.
Spatial distribution of the expansion of ISA in various areas of Xiamen city during 1989–2016. (a) Xiamen Island. (b) Jimei District. (c) Haicang District. (d) Xiang′an District. (e) Tong′an District.

Figure 5.
Graded urban land surface temperature (LST) maps indicating the distribution of urban heat islands (UHIs) in Xiamen city from 1989 to 2016. The different colors represent LST levels 1–6, representing increasing LST. XMU: Xiamen old downtown area; TAU: Tong’an old downtown area; A: Haicang bonded port zone; B: Xinyang industrial area (IA); C: Dongfu IA; D: Guankou IA; E: Xinglin IA; F: Northern industrial zone in Jimei District; G: Tong’an IA; H: Tong’an Chengdong IA; I: Xiangbei IA; J: Xiang’an IA; K: Airport industrial and logistics park; L: Xiangyu bonded zone with seaport and logistics park. The blue line indicates the coastline.

Figure 6.
Graded urban land surface temperature (LST) maps for three impervious surface types (“1” suffix) for 2016, and their corresponding Google Earth images (“2” suffix). (a) Residential areas (urban villages and high-rise areas). (b) Guankou industrial area. (c) Xiamen software park. The red line in (a2) indicates the division between urban villages and high-rise residential areas.

Figure 7.
Variations in the area of UHIs in Xiamen city with an LST of level 5 (L5) and level 6 (L6) during 1989–2016.
Figure 7.
Variations in the area of UHIs in Xiamen city with an LST of level 5 (L5) and level 6 (L6) during 1989–2016.

Figure 8.
Relationships between mean LST and (a) ISA%, (b) vegetation fraction, and (c) the normalized difference vegetation index (NDVI) during 1989–2016.
Figure 8.
Relationships between mean LST and (a) ISA%, (b) vegetation fraction, and (c) the normalized difference vegetation index (NDVI) during 1989–2016.


Table 1.
Details of the Landsat images used in this work.
| Image Type | Image Acquisition Date | Sun Elevation Angle (Degrees) | Path/Row | Cloud Cover (%) |
|---|---|---|---|---|
| Landsat 8 OLI/TIRS | 27 July 2016 | 66.42 | 119/43 | 1.81 |
| Landsat 5 TM | 06 Jun 2009 | 66.34 | 119/43 | 0.31 |
| Landsat 5 TM | 23 May 2004 | 64.68 | 119/43 | 0.00 |
| Landsat 5 TM | 20 July 1996 | 56.60 | 119/43 | 0.16 |
| Landsat 5 TM | 15 Jun 1989 | 61.40 | 119/43 | 1.71 |
Note: OLI: Operational Land Imager; TIRS: Thermal Infrared Sensor; TM: Thematic Mapper.
Table 2.
Reflectance coefficients the first three Tasseled Cap (TC) components for Landsat sensors.
| Sensor | TCs | Coastal | Blue | Green | Red | NIR | SWIR1 | SWIR2 |
|---|---|---|---|---|---|---|---|---|
| Landsat 5 TM | TC1 | - | 0.2043 | 0.4158 | 0.5524 | 0.5741 | 0.3124 | 0.2303 |
| TC2 | - | −0.1603 | −0.2819 | −0.4934 | 0.7940 | −0.0002 | −0.1446 | |
| TC3 | - | 0.0315 | 0.2021 | 0.3102 | 0.1594 | −0.6806 | −0.6109 | |
| Landsat 8 OLI/TIRS | TC1 | 0.2540 | 0.3037 | 0.3608 | 0.3564 | 0.7084 | 0.2358 | 0.1691 |
| TC2 | −0.2578 | −0.3064 | −0.3300 | −0.4325 | 0.6860 | −0.0383 | −0.2674 | |
| TC3 | 0.1877 | 0.2097 | 0.2038 | 0.1017 | 0.0685 | −0.7460 | −0.5548 |
Note: SWIR: short-wave infrared.
Table 3.
Details of the density slice technique which was used to divide the normalized land surface temperature (LST) image.
Table 3.
Details of the density slice technique which was used to divide the normalized land surface temperature (LST) image.
| Level | Ui Value | UHI Meaning | Description |
|---|---|---|---|
| 1 | ≤Tm − 1.5Std | Very low-temperature zone | No UHI distribution zone |
| 2 | >Tm − 1.5Std and ≤Tm − 0.5Std | Low-temperature zone | |
| 3 | >Tm − 0.5Std and ≤Tm | Moderate temperature zone | |
| 4 | >Tm and ≤ Tm + 0.5Std | Sub-high-temperature zone | |
| 5 | >Tm + 0.5Std and ≤Tm + 1.5Std | High-temperature zone | UHI distribution zone |
| 6 | >Tm + 1.5Std | Very high-temperature zone |
Note: Tm and Std are the mean and standard deviation of the LST in the normalized LST image, respectively; and Ui is the value of pixel i of the normalized LST image. UHI: urban heat island.
Table 4.
Spatial characteristics of the expansion of impervious surface area (ISA) in Xiamen city during 1989–2016.
Table 4.
Spatial characteristics of the expansion of impervious surface area (ISA) in Xiamen city during 1989–2016.
| District | Period | Increase in ISA (km2) | ΔISEI | Expansion Direction |
|---|---|---|---|---|
| Xiamen Island | 1989–1996 | 22.94 | 0.205 | NE-ENE-E |
| 1996–2004 | 25.81 | 0.202 | NE-ENE-E | |
| 2004–2009 | 16.67 | 0.208 | NE-ENE-E | |
| 2009–2016 | 5.89 | 0.053 | NE | |
| Jimei | 1989–1996 | 10.40 | 0.093 | W |
| 1996–2004 | 15.45 | 0.121 | W | |
| 2004–2009 | 24.65 | 0.308 | W-WNW-NW | |
| 2009–2016 | 29.90 | 0.267 | W-WNW-NW | |
| Haicang | 1989–1996 | 8.41 | 0.075 | NW |
| 1996–2004 | 19.81 | 0.155 | NW, WSW | |
| 2004–2009 | 15.44 | 0.193 | NW-WNW, WSW | |
| 2009–2016 | 21.26 | 0.190 | NW-WNW, WSW | |
| Tong’an | 1989–1996 | 9.17 | 0.082 | SSW |
| 1996–2004 | 15.22 | 0.119 | S-SSW | |
| 2004–2009 | 31.51 | 0.394 | S-SSW-SW | |
| 2009–2016 | 34.45 | 0.308 | S-SSW-SW | |
| Xiang’an | 1989–1996 | 5.07 | 0.045 | N |
| 1996–2004 | 13.52 | 0.106 | N | |
| 2004–2009 | 23.10 | 0.289 | NNW-N-NNE | |
| 2009–2016 | 30.78 | 0.275 | NNW-N-NNE |
Note: ISEI: Impervious Surface Expansion Index.
Table 5.
Statistics of the LST (in K) of impervious and non-impervious areas in Xiamen city from 1989 to 2016.
Table 5.
Statistics of the LST (in K) of impervious and non-impervious areas in Xiamen city from 1989 to 2016.
| Year | Non-Impervious Areas | Impervious Areas | ||||||
|---|---|---|---|---|---|---|---|---|
| Tmin | Tmax | Tmean | SD | Tmin | Tmax | Tmean | STD | |
| 1989 | 297.10 | 307.91 | 301.06 | 1.56 | 298.05 | 307.91 | 304.62 | 1.56 |
| 1996 | 295.35 | 304.74 | 299.22 | 1.55 | 296.73 | 304.74 | 302.14 | 1.23 |
| 2004 | 295.44 | 307.56 | 299.54 | 1.31 | 295.44 | 307.56 | 302.55 | 1.68 |
| 2009 | 295.80 | 312.64 | 301.49 | 1.74 | 298.68 | 312.64 | 305.42 | 1.94 |
| 2016 | 296.45 | 323.11 | 307.20 | 3.07 | 301.55 | 323.11 | 313.56 | 2.39 |
Note: Tmin, Tmax, and Tmean refer to the maximum LST, minimum LST, and mean LST. SD represents one standard deviation of Tmean.
© 2020 by the authors. Licensee MDPI, Basel, Switzerland. This article is an open access article distributed under the terms and conditions of the Creative Commons Attribution (CC BY) license (http://creativecommons.org/licenses/by/4.0/).
Share and Cite
MDPI and ACS Style
Hua, L.; Zhang, X.; Nie, Q.; Sun, F.; Tang, L. The Impacts of the Expansion of Urban Impervious Surfaces on Urban Heat Islands in a Coastal City in China. Sustainability 2020, 12, 475. https://doi.org/10.3390/su12020475
AMA Style
Hua L, Zhang X, Nie Q, Sun F, Tang L. The Impacts of the Expansion of Urban Impervious Surfaces on Urban Heat Islands in a Coastal City in China. Sustainability. 2020; 12(2):475. https://doi.org/10.3390/su12020475
Chicago/Turabian StyleHua, Lizhong, Xinxin Zhang, Qin Nie, Fengqin Sun, and Lina Tang. 2020. "The Impacts of the Expansion of Urban Impervious Surfaces on Urban Heat Islands in a Coastal City in China" Sustainability 12, no. 2: 475. https://doi.org/10.3390/su12020475
Note that from the first issue of 2016, this journal uses article numbers instead of page numbers. See further details here.