Surface Dust and Aerosol Effects on the Performance of Grid-Connected Photovoltaic Systems


Laboratory of Thermodynamics & Thermal Engines, Department of Mechanical Engineering, University of Thessaly, 38334 Volos, Greece
*
Author to whom correspondence should be addressed.
Sustainability 2020, 12(2), 569; https://doi.org/10.3390/su12020569
Submission received: 7 December 2019
/
Revised: 2 January 2020
/
Accepted: 9 January 2020
/
Published: 11 January 2020
(This article belongs to the Special Issue Operational Performance, Degradation and Reliability of Photovoltaic Systems)
Abstract
:A large number of grid-connected Photovoltaic parks of different scales have been operating worldwide for more than two decades. Systems’ performance varies with time, and an important factor that influences PV performance is dust and ambient aerosols. Dust accumulation has significant effects depending the region, and—on the other hand—understanding the role of absorption or scattering in particular wavelengths from aerosols is a challenging task. This paper focuses on performance analysis of a grid-connected PV system in Central Greece, aiming to study these effects. The methodology of analysis follows three directions, namely, PR computations, use of mathematical model’s prediction as reference value, and normalized efficiency calculation. These metrics are correlated with the levels of dust accumulation on PV panels’ surfaces and the ambient aerosol mass concentration. The results show that only heavily soiled surfaces have significant impact on PV performance and, particularly, a decrease of 5.6%. On the other hand, light or medium soiling have negligible impact on PV performance. On the other hand, the impact of ambient aerosol concentration levels on PV efficiency is more complex and requires further study. Aerosol scattering of different wavelengths can possibly affect PV efficiency, however, this fact may be related to the specific spectral response of PV cells.
1. Introduction
Renewable energy has had significant evolution over the last two decades. In many countries, renewable energy produces an important share of the total energy production. Energy policies and incentives against climate change played an important role in this direction. One of the most popular forms of renewable energy was the installation of photovoltaic systems. Especially in Greece, where the solar potential in combination with environmental conditions have significant energy production levels. Photovoltaic (PV) systems have had important growth in the last two decades in Greece because of feed-in tariffs during the first years and feed-in premium and net-metering policies later on. Grid connected photovoltaic systems are responsible for the 45.5% of renewable energy installations in Greece, with 351 ΜWp on buildings’ roofs and 2141 MWp in parks.
The evolution of photovoltaic systems poses several challenging scientific and engineering tasks. The most widespread task is the performance analysis of Photovoltaic systems. Many researchers have proposed methods of performance analysis, because it gives important information on the evaluation of systems’ performance that has scientific and economic impacts [1,2]. Furthermore, performance analysis gives important information on the solar potential of each site, which is a useful tool for energy prediction and appropriate sizing of systems according to demands.
All factors affecting energy production of grid-connected photovoltaic systems must be considered in the analysis procedure. Environmental conditions have a strong impact in energy production of photovoltaic systems. The parameters involved are mainly temperature and solar radiation. However, there are factors that affect solar radiation levels such as relative humidity, aerosols, and spectral effects. Furthermore, dust accumulation on the panels’ surfaces may significantly affect energy production.
The effect of dust accumulation is related with environmental conditions, size of dust particles, and tilt angles of PV panels’ surface. Many researchers study the effect of dust accumulation on energy production in different places with widely varying environmental conditions. Kaldellis et al. studied the effect in urban Athens environment with systematic measurements on roof-to PV panels, which remained exposed to ambient air pollution for certain time periods and then were cleaned in order to be compared with polluted PV panels’ performance. The results showed a 6.5% drop in energy production [3]. The climate of each location also affects the dust effect; in regions with wet climate rainfall, wind and gravity help self-cleaning PV panels’ surfaces. However, in dry regions, precipitation happens only occasionally and dust is an important problem [4]. Ullah et al. studied the effect of soiling on energy production in Pakistan and showed that a lightly soiled panel had a 10% reduction and, respectively, a heavily soiled panel 40% [5]. There are several studies which investigate the dust effect on desert areas. Saidan et al. studied the dust effect using PV panels with direct exposure to weather conditions. Then, the dusted and the reference clean panels were comparatively exposed indoors to a solar simulator. The results show degradation of 6.24–18.74%, depending on the exposure period [6]. Ramli et al. investigated dust effect in Indonesia using an experimental measurement set up and a rule-based model to identify different experimental conditions. Results showed a reduction of 10.8% in outdoor exposure [7]. An important role for the dust effect is played by the ground soil type of the site, as in desert areas this effect is stronger. Massi Pavan et al. studied the soiling effect using regression models, and results show 6.9% losses in a sandy site while losses in compact, firm ground were 1.1% [8]. Beattie et al. proposed models for sand and dust particle accumulation on PV panels based on laboratory investigation on a glass surface. The results qualitatively agree with existing field data. Further, the models are fitted to account for field conditions, including analysis of photovoltaic module tilt, humidity, and wind speed [9]. Javed et al. studied the dust effect using artificial networks and concluded that the two most interactive environmental factors which affect PV soiling are wind speed and relative humidity [10]. The effects of dirt and dust accumulation have been extensively studied also for the related case of solar thermal collectors [11]. One of the earliest studies was that of Hottel and Woertz [12]. These researchers carried out performance tests on collectors with a 30° tilt angle, in an industrial district near a power plant and a four-track railroad. They found that the effect of dirt on the collector’s net performance was surprisingly small (4.7% max.), while the calculations indicated 2.7% max reduction in glass transmittance. They attributed this to the collector’s self-cleaning action due to snow and rainfall in Boston. On the other hand, there are a number of studies in the literature concerning the effect of dust on solar devices in rainless and arid regions [11]. In this study, Hegazy obtained extensive experimental data regarding the effect of dust accumulation on solar transmittance through inclined glass covers in in the Minia region, middle of Egypt, where the Nile Valley is narrow and runs through the Egyptian deserts. He measured the variation of dust deposition with tilt angle for different exposure periods. For a tilt angle of 30 degrees, the maximum dust and sand deposition on the panels did not exceed 4 g/m2. For this high level of deposition, he measured about 15% reduction in glass transmittance.
The size of dust particles and the type of pollutants plays an important role on the behavior of dust on the photovoltaic panels’ efficiency. Abderrezek et al. considered several types of dust (size and type) and studied this effect using a microscope, a spectrophotometer, an I-V photovoltaic modules analyzer, and thermocouples. The results show that the type of dust, level of light transmission, and the glazing temperature affect PV performance [13]. Adigüzel et al. investigated the effect of size and weight of particles on the performance of PV modules by measuring voltage, current, and power. The results show that as the weight increases, the power loss increases, assuming that particle size distribution does not change. On the other hand, with the assumption that particle weight remains the same, as the particle sizes increase, the power loss decreases [14].
A significant role is played by the type of accumulated dust. Dust contents are a mixture of different pollutants and components of the earth’s crust. The pollutants which have a remarkable impact according to the literature are limestone, ash, red soil, calcium carbonate, silica, and sand [4].
Another factor that possibly affects PV efficiency is aerosol concentration in ambient air. Spectral distribution can vary depending on the content of the atmosphere, thus different gases, humidity, particles, or atmospheric pressure can have an impact on the spectrum of light reaching the ground [15]. This, in turn has an impact on PV performance, as each PV technology has a particular spectral response. There are many studies which focus on investigating the aerosol effect in PV performance. Gutiérrez et al. studied the impact of aerosols in PV production from seasonal to multi-decadal time scales. The analysis was based on aerosol and climate simulations, and the results show significant differences in the average annual productivity from 12–16% depending on the installation typology [16]. Neher et al. investigated the impacts of aerosols on PV production using an atmospheric radiative transfer and a PV power model. The study concerns a Sub-Saharan region, and the results show reduction on PV yields from 2–48% [17].
The present study focuses on impacts of dust accumulation and aerosols on PV performance. The analysis procedure is based on optical images of PV surfaces and measurements of aerosols. As far as PV performance is concerned, there exist data sets from routine measurements on a grid-connected PV park. The aim of this work is to describe qualitative correlations between these factors and PV performance. The innovative aspect of this work is its application in grid-connected PV systems in real time operation. Further application of this procedure in scattered places in Greece and other countries with numerous grid-connected systems is expected to give important conclusions about the role of dust and aerosol concentration in PV panels’ performance.
2. Materials and Methods
2.1. Experimental and Testing Layout
A 99.84 kWp grid-connected photovoltaic system in central Greece was monitored for this study. The system comprises 416 PV panels connected to 8 inverters (main technical data in Appendix A). The following data are recorded: Plane irradiance, backsheet temperature, and AC power at inverter inlet. A total of 6 years was recorded (01.01.2013–04.30.2019). Additionally, a Dusttrak 8530 aerosol monitor is installed on site, in a special environmental enclosure. The panels are mounted facing south, with a tilt angle of 30 degrees. The above data are recorded in a data logger at 15 min’ intervals. The specific PV installation lacks a cleaning system for the panels’ surfaces, because it is assumed that the tilting of the panels helps self-cleaning of accumulated dust by frequent precipitation (rain and snowfall). At least once during the monitoring period, the PV panels stayed covered by snow for several days. Daily rainfall data for the period from October 2018 to August 2019 were made available from meteorological stations in the vicinity. Furthermore, optical inspections were conducted in the period from September 2018 to August 2019 in order to assess the accumulated dust levels on the photovoltaic panels’ surface.
2.2. Ambient PM10 Concentration Measurement Setup
The TSI DustTrak 8530 optical particle counter was employed for the PM10 ambient concentration measurements (Figure 1) [18,19]. This is a low-cost instrument which supplies a very good proxy measurement of PM10, based on the measured attenuation of a laser beam and an integral calibration from weighing of a sample of the particular aerosol of the site [20,21]. The instrument is capable of continuous measurement with a time step as low as 1 s. It provides estimates of PM10, by the use of a special inlet diffuser. This type of optical instrument is more sensitive to smaller particle sizes, due to the nature of light scattering from aerosols [22]. Especially when using this type of optical scattering measurement in the presence of close to 100% relative humidity in the sample air (condensing water droplets—fog), an overestimation of PM10 concentration of the order of 20% can be observed.
The instrument is inside a specially designed environmental enclosure (Figure 1). It is placed in situ and left unattended for several months, with low power consumption (main technical data in Table A4, Appendix A).
2.3. Method of Analysis
The aim of these measurements was the correlation between PV performance—ambient aerosol concentration, and PV performance—dust accumulation on PV panels’ surface, based on the monitoring data of the grid-connected operation. Of course, PV performance is influenced by other factors such as solar radiation, temperature, and inverter efficiency. For this reason, an analysis procedure was adopted, which is based on the use of metrics, mathematical models, and a normalization procedure to Standard Test Conditions (STC) (1000 W/m2, 25 °C, AM1.5 spectrum). The analysis procedure is described in detail in [23,24]. The analysis is based on three axes:
- Daily Performance ratio calculation according to EN 61724
- Use of bilinear model as reference value
- Calculation of normalized to STC efficiency
Computation of normalized efficiency was based on irradiance and panel surface temperature measurements. Normalized efficiency is compared among days where the level of dust accumulation on the panels’ surface were markedly different according to the inspections. Furthermore, normalized efficiency is compared with measured aerosol mass concentrations in order to observe possible correlations.
This first axis of the method, which concerns performance ratio, includes computation for days with different cleanliness of PV panels’ surface. The computation is based on equations below [25]:
E denotes the net energy output, PSTC denotes installed power at STC conditions, H the total in plane solar radiation, and GSTC the irradiance at 1000 W/m2. However, performance ratio calculation is influenced by the effect of the panel’s temperature and its seasonal variations [25]. Thus, it is important to use additional models for the analysis procedure.
The second axis involves the use of improved bilinear models to calculate the PV power generation, based on the monitoring data. The computed values are employed as reference values for comparison. The deviation of measured data from the computed values is an indication of possible changes in PV system’s performance. The model is shortly described as follows [26]:
G > 200 W/m2:
G < 200 W/m2:
In these equations, PSTC, GSTC, TSTC are reference parameters for STC conditions, k is a factor for the effect of irradiance levels, and “a” is a coefficient which takes into account the effect of the panels’ temperature. Tc and G are measured parameters. The irradiance factor k is provided by manufacturers as a percentage reduction in efficiency at low irradiance levels (200 W/m2).
The third axis, which is described in [23,24], includes the computation of normalized efficiency, which is not influenced from temperature and solar radiation. This is a metric capable of investigating other factors such as dust, ageing effect, or ambient aerosol concentration effect. The computation of normalized efficiency based on steps below:
DC power calculation.
The DC power is computed based on the recorded AC data at inverters’ inlet, assuming a known inverter’s efficiency [27]:
Temperature normalization.
Temperature normalization according to temperature coefficients supplied by the manufacturer of the Photovoltaic panels (Appendix), based on the equation:
PV efficiency is calculated by Equation (8) [27] based on the calculation of normalized PV power from Equation (7).
Normalized efficiency in different test conditions is useful to be correlated with clearness index and airmass. The clearness index Kt may be considered as an attenuation factor of the atmosphere. On the other hand, air mass quantifies the direct optical path length through the Earth’s atmosphere, and consequently aids performance comparison in different times and seasons of the year.
Clearness Index is defined as follows [28]:
The definition of AM [29] is stated below:
where zs is the sun’s zenith angle, P is the local air pressure, P0 the sea level air pressure, and h the place’s altitude.
3. Results and Discussion
The available datasets span a six-year operation of the grid connected system which is described in Section 2. However, more intensive optical inspections in order to take pictures of PV panels’ surface were conducted in the period from September of 2018 to April of 2019, while measurements of ambient aerosol concentrations were conducted during the same period. Two periods were found in which the PV panels’ surfaces were heavily soiled. Furthermore, the PV panels’ surfaces remained totally covered by snow during a whole week in January 2019. This fact significantly helped self-cleaning of the panels’ surfaces. The following pictures present conditions on a clean surface, a lightly soiled, a medium soiled, and a heavily soiled one.
3.1. Effect of Dust Accumulation
Comparative results of normalized efficiency in correlation with the soiling of the panel’s surfaces are presented in this section. The comparisons concern conditions with different levels of soiling (based on optical inspection). For each condition, two PV cells are compared, one cleaned cell and one cell with a specific grade of soiling. It must be mentioned here that a close optical inspection of the full PV park at specific days indicates that all the panels at each particular time are equivalently loaded by the certain level of dust coverage.
The first comparison concerns clean surface conditions, which act as reference regarding the behavior of normalized efficiency during a day. Figure 2 shows two clean PV cells on 18.03.2019 and two clean PV cells on 20.02.2019.
Figure 3 presents a comparison in normalized efficiency for the conditions of Figure 2. The diagram is completed by application of the third step of the analysis procedure described in Section 2. Normalized efficiency is presented in correlation with time (a) and air mass (b); because air mass is not influenced by the season of year.
No significant differences in normalized efficiency are observed. A deviation of −0.75% in averaged normalized efficiency is observed for 1 < AM < 3. Daily performance ratio for 18.03.2019 is 0.869 in comparison with reference condition 0.892.
The second comparison concerns a lightly soiled surface on 29.04.2019 compared to the clean surface reference conditions of 20.02.2019. Figure 4 shows two PV cells without cleaning on 29.04.2019 and the two reference PV cells on 20.02.2019.
No significant differences in normalized efficiency are observable in Figure 5. A deviation of 0.47% in averaged normalized efficiency is observed for 1 < AM < 3. Daily performance ratio for 29.04.2019 was 0.866 in comparison with reference condition 0.892. The third comparison concerns a medium soiled surface on 23.08.2018 compared to the clean reference conditions on 20.02.2019. Figure 6 shows two PV cells without cleaning on 23.08.2018 and the two clean PV cells on 20.02.2019.
No significant differences in normalized efficiency are observed in Figure 7. A deviation of −0.47% in averaged normalized efficiency is observed for 1 < AM < 3. Daily performance ratio for 23.08.2019 was 0.853 in comparison with 0.892 at reference conditions. The last comparison concerns a heavily soiled surface on 24.04.2019 compared to the clean surface reference conditions of 20.02.2019. Figure 8 shows two PV cells without cleaning on 24.04.2019 and the two clean PV cells on 20.02.2019.
An observable difference in normalized efficiency is observed in Figure 9. A deviation of −5.6% in averaged normalized efficiency is observed for 1 < AM < 3. The daily performance ratio on 29.04.2019 was 0.856 compared to 0.892 at reference conditions.
Table 1 summarizes the results for different levels of soiling for the three steps of the proposed methodology.
It is observed that conditions of medium and light soiling of the panels’ surface have negligible impact on normalized efficiency, in contrast to heavy soiling which resulted in a decrease of 5.6% on 24.04.2019. This would check with a typical dust deposition level of the order of 1 g/m2 as indicated in several studies of percentage transmission spectra of the cover substrate (glass) with the varying levels of dust accumulation. [11,30,31]. The effect of soiling on performance ratio does not show a particular trend in Table 1, however, the largest value is at the reference conditions (20.02.2019), when the panels’ temperatures are lower, (because PR depends on the panel’s temperature). On the other hand, its comparison with the reference value (based on the mathematical model described) indicates a different behavior during the day with a heavily soiled surface (Table 1, last line), which is confirmed by the remarkable difference in normalized efficiency.
In order to observe the dust accumulation effect on the PV panel’s efficiency and the effect of rainfall on the self-cleaning of PV panels, it is important to correlate daily rainfall (in mm) with normalized efficiency as shown in Figure 10, for various time periods during the years 2017, 2018 and 2019.
3.2. Effect of Aerosols
Correlations among the normalized efficiency, irradiance, clearness index, and aerosol concentration are attempted in this section, starting from a correlation of precipitation with aerosol concentration (Figure 11). Three periods with recorded values of ambient aerosol concentration are examined next (Figure 12).
As a starting point, the correlation between normalized efficiency and ambient aerosol concentration is presented in Figure 12 for the specific periods: Several peaks of aerosol concentrations are recorded during the night, due to the effect of water vapor condensation on these nights [19]. Very low aerosol concentration is recorded during rainy days (Figure 11), (which obviously have very low irradiance levels), due to the nucleation and washing of particulate by the rain drops. Also, low aerosol concentration is observed on some cloudy days. The above remarks explain the lack of a straightforward correlation between normalized efficiency and aerosol concentration. Another interesting phenomenon that is observed in these recordings is the transport of African dust in the period from 15.04.2019 to 28.04.2019, depicted in Figure 12d with an increasing trend in ambient PM10 concentration. Again, in this case, there is no obvious direct correlation of ambient PM10 concentration with efficiency. During periods with high relative humidity at the site, one may observe high particulate concentrations at night, where the temperature drops close to the Dew Point. Morning moisture produced by condensation in such cases may contribute to self-cleaning of the panels and increase in PV panels efficiency. This phenomenon is more pronounced in Figure 12f in the period from 26–29.4, where night particulate concentrations are very high, resulting at improvement of PV efficiency during the subsequent days. As observed in Figure 11 for the respective days, no significant precipitation is recorded. Thus, monitoring of precipitation alone cannot explain this type of phenomenon. As a general remark, one could say that the correlation of ambient PM10 concentration with normalized efficiency at a specific day must take into account the PM10 concentration history during the preceding days.
A more rational approach would be to correlate ambient aerosol concentration with clearness index, since it is possible that a portion of the particulate matter would diffuse short wavelengths of solar radiation that activate the PV panels. To this end, the same periods of study presented in the previous Figures are now analyzed in Figure 13, Figure 14 and Figure 15, by presenting normalized PV efficiency as function of atmospheric aerosol concentration (PM10), with clearness index as an additional parameter. Each point in these Figures corresponds to the average of a 15-min interval for all parameters involved.
Figure 13 presents a correlation for the winter season 2018–2019. As expected, high normalized efficiency figures are associated with high values of clearness index. They are generally associated with PM10 concentrations below the levels of 40 μg/m3. Higher PM10 concentrations do not coincide with high normalized efficiency.
Figure 14 presents a correlation for the beginning of spring 2019. Again, high normalized efficiency figures are associated with high values of clearness index, but the highest efficiency values occur with moderate values of clearness index. They are generally associated with PM10 concentrations below the levels in the range 10–50 μg/m3. Higher PM10 concentrations were not observed for this period.
Figure 15 presents a correlation for the spring of 2019. High normalized efficiency figures are generally associated with high values of clearness index, but also occur with moderate values of clearness index. They are generally associated with PM10 concentrations below 50 μg/m3. However, high normalized efficiency figures are also observed during the days with the highest transport of African dust.
4. Conclusions
This paper investigates the effect of dust accumulation and ambient aerosol concentration levels on the performance of a grid-connected photovoltaic system. The method of analysis is based on three axes: calculation of PR, use of a bilinear model as reference value, and calculation of normalized efficiency. The amounts of dust accumulated on the panels were not measured, thus the results are only qualitative. Photographs are cited, which show the dust on PV panels’ surface compared with a reference situation in which surface was clean. The results indicate that dust accumulation has remarkable impact on efficiency. When the PV panels’ surface was heavily soiled, a decrease of 5.6% in normalized efficiency was estimated. During the specific period, the transport of large quantities of African dust was observed in the region. On the other hand, the impact of ambient aerosol concentration levels on PV efficiency is more complex and requires further study. Aerosol scattering of different wavelengths can possibly affect PV efficiency, however, this fact may be related to the specific spectral response of PV cells. High normalized efficiency figures in general coincide with PM10 concentration not exceeding 50 μg/m3. On the other hand, lower clearness index is more directly correlated with lower normalized efficiency. Further investigation is necessary with spectral irradiance measurements in order to be able to correlate absorption or scattering in particular ranges of solar spectrum from atmospheric aerosols.
Author Contributions
Conceptualization, E.R. and T.S.; methodology, E.R. and T.S.; software, E.R.; validation, E.R.; formal analysis, E.R.; resources, T.S.; data curation, E.R.; writing—original draft preparation, E.R.; writing—review and editing, T.S. All authors have read and agreed to the published version of the manuscript.
Funding
This research received no external funding.
Acknowledgments
The authors would like to acknowledge “G. Roupakias Energeiaki” company for providing data and access to the PV system examined in this study.
Conflicts of Interest
The authors declare no conflict of interest.
Appendix A

Table A1.
Technical characteristics of photovoltaic panels.
| Yingli 60 Cell YGE SERIES | |||
|---|---|---|---|
| Module Type | YL240P-29b | ||
| STC | NOCT | ||
| Power Output | W | 240 | 174.3 |
| Module efficiency | % | 14.7 | 13.3 |
| Voltage at Pmax | W | 29.5 | 26.6 |
| Current at Pmax | A | 8.14 | 6.56 |
| Open-circuit voltage | V | 37.5 | 34.2 |
| Short-circuit current | A | 8.65 | 7.01 |
| Normal operating cell temperature (NOCT) | °C | 46+/−2 | |
| Temperature coefficient of Pmax | %/°C | −0.45 | |
| Temperature coefficient of Voc | %/°C | −0.33 | |
| Temperature coefficient of Isc | %/°C | 0.06 | |
| Temperature coefficient of Vmpp | %/°C | −0.45 | |
| Dimensions(L/W/H) | Mm | 1650/990/40 | |
| STC: 1000 W/m2 irradiance, 25 °C cell temperature, AM1.5 G spectrum according to EN 60904-3 | |||
| Average relative efficiency reduction of 5% at 200 W/m2 according to EN 60904-3 | |||
| NOCT: Open-circuit module operation temperature at 800 W/m2 irradiance, 20 °C ambient temperature, 1 m/s wind speed | |||
Table A2.
Technical characteristics and efficiency ratings.
| Fronius IG Plus 150V-3 | ||
|---|---|---|
| PDC,MAX | W | 12,770 |
| IDC,MAX | A | 55.5 |
| UDC,MIN | V | 230 |
| UDC,START | V | 260 |
| UDC,R | V | 370 |
| UDC,MAX | V | 600 |
| PAC,R | W | 12,000 |
| IAC,MAX | A | 17.4 |
| UAC,R | V | 3-NPE 400/230 |
| Maximum efficiency ninv | % | 95.9 |
| ninv at 5% PAC,R (230V/370V/500V) | % | 91.8/92.5/91.1 |
| ninv at 10% PAC,R (230V/370V/500V) | % | 91.0/94.3/93.2 |
| ninv at 20% PAC,R (230V/370V/500V) | % | 94.7/95.1/94.6 |
| ninv at 25% PAC,R (230V/370V/500V) | % | 95.1/95.3/94.7 |
| ninv at 30% PAC,R (230V/370V/500V) | % | 95.1/95.3/94.9 |
| ninv at 50% PAC,R (230V/370V/500V) | % | 95.3/95.9/95.3 |
| ninv at 75% PAC,R (230V/370V/500V) | % | 94.7/95.6/95.4 |
| ninv at 100% PAC,R (230V/370V/500V) | % | 94.0/95.2/95.1 |
| PDC,MAX | W | 12,770 |
| IDC,MAX | A | 55.5 |
| UDC,MIN | V | 230 |
| UDC,START | V | 260 |
Figure A1.
Efficiency curve of inverter with the AC Power for different DC voltages.

Table A3.
Irradiance sensor characteristics.
| Sensor | Mono-Crystalline Si-Sensor |
|---|---|
| Sensor voltage | 75 mV at 1000 W/m2 (exact calibration voltage written on sensor) |
| Accuracy | ±5% (average of a year) |
| Ambient temperature | −40 °C to +85 °C |
| Design | Sensor mounted on z-shaped aluminum profile |
| Dimensions | L × W × H = 55 × 55 × 10 mm |
| Fronius Product Nr. | 4,300,011,189 |
Table A4.
Temperature sensor characteristics.
| Sensor | PT 100 |
|---|---|
| Measuring Range | −40 °C to +188 °C |
| Accuracy | ±0.8 °C (in the range −40 °C to +100 °C) |
| Design | Sensor on an adhesive film for measurements on surfaces |
| Dimensions | 32 × 32 mm |
| Fronius Art.Nr. | 4,300,011,190 |
Table A5.
Aerosols measurement characteristics Dusttrak 8530.
| Sensor Type | 90° Light Scattering |
|---|---|
| Range | 8530 Desktop 0.001 to 400 mg/m3 |
| Resolution | ±0.8 °C (in the range −40 °C to +100 °C) ±0.1% of reading of 0.001 mg/m3, whichever is greater |
| Zero Stability | ±0.002 mg/m3 24 h at 10 s time constant |
| Particle Size Range | Approximately 0.1 to 10 μm |
| Flow Rate | 3.0 L/min set at factory 1.4 to 3.0 L/min adjustable |
| Flow Accuracy | ±5% factory setpoint Internal flow controlled |
| Temperature Coefficient | +0.001 mg/m3 per °C |
| Operational Temp | 0 to 50 °C |
| Storage Temp | −20 to 60 °C |
| Operational Humidity | 0–95% RH, non-condensing |
| Time Constant | Adjustable 1 to 60 s |
| Data Logging | 45 days at 1 min samples |
| Log Interval | 1 s to 1 h |
| Physical Size | (HWD) 5.3 × 8.5 × 8.8 in. |
References
- Kumar, N.M.; Malvoni, M. A preliminary study of the degradation of large-scale c-Si photovoltaic system under four years of operation in semi-arid climates. Results Phys. 2019, 12, 1395–1397. [Google Scholar] [CrossRef]
- Balaska, A.; Tahri, A.; Tahri, F.; Stambouli, A.B. Performance assessment of five different photovoltaic module technologies under outdoor conditions in Algeria. Renew. Energy 2017, 107, 53–60. [Google Scholar] [CrossRef]
- Kaldellis, J.; Kokala, A. Quantifying the decrease of the photovoltaic panels’ energy yield due to phenomena of natural air pollution disposal. Energy 2010, 35, 4862–4869. [Google Scholar] [CrossRef]
- Darwish, Z.A.; Kazem, H.A.; Sopian, K.; Al-Goul, M.; Alawadhi, H. Effect of dust pollutant type on photovoltaic performance. Renew. Sustain. Energy Rev. 2015, 41, 735–744. [Google Scholar] [CrossRef]
- Ullah, A.; Imran, H.; Maqsood, Z.; Butt, N.Z. Investigation of optimal tilt angles and effects of soiling on PV energy production in Pakistan. Renew. Energy 2019, 139, 830–843. [Google Scholar] [CrossRef]
- Saidan, M.; Albaali, A.G.; Alasis, E.; Kaldellis, J.K. Experimental study on the effect of dust deposition on solar photovoltaic panels in desert environment. Renew. Energy 2016, 92, 499–505. [Google Scholar] [CrossRef]
- Ramli, M.A.; Prasetyono, E.; Wicaksana, R.W.; Windarko, N.A.; Sedraoui, K.; Al-Turki, Y.A. On the investigation of photovoltaic output power reduction due to dust accumulation and weather conditions. Renew. Energy 2016, 99, 836–844. [Google Scholar] [CrossRef]
- Pavan, A.M.; Mellit, A.; De Pieri, D. The effect of soiling on energy production for large-scale photovoltaic plants. Sol. Energy 2011, 85, 1128–1136. [Google Scholar] [CrossRef]
- Beattie, N.S.; Moir, R.S.; Chacko, C.; Buffoni, G.; Roberts, S.H.; Pearsall, N.M. Understanding the effects of sand and dust accumulation on photovoltaic modules. Renew. Energy 2012, 48, 448–452. [Google Scholar] [CrossRef] [Green Version]
- Javed, W.; Guo, B.; Figgis, B. Modeling of photovoltaic soiling loss asa function of environmental variables. Sol. Energy 2017, 157, 397–407. [Google Scholar] [CrossRef]
- Hegazy, A.A. Effect of dust accumulation on solar transmittance through glass covers of plate-type collectors. Renew. Energy 2001, 22, 525–540. [Google Scholar] [CrossRef]
- Hottel, H.; Woertz, B. Performance of flat-plate solar-heat collectors. Trans. ASME 1942, 64, 91. [Google Scholar]
- Abderrezek, M.; Fathi, M. Experimental study of the dust effect on photovoltaic panels’ energy yield. Sol. Energy 2017, 142, 308–320. [Google Scholar] [CrossRef]
- Adıgüzel, E.; Özer, E.; Akgündoğdu, A.; Yılmaz, A.E. Prediction of dust particle size effect on efficiency of photovoltaic modules with ANFIS: An experimental study in Aegean region, Turkey. Sol. Energy 2019, 177, 690–702. [Google Scholar] [CrossRef]
- Mussard, M.; Amara, M. Performance of solar photovoltaic modules under arid climatic conditions: A review. Sol. Energy 2018, 174, 409–421. [Google Scholar] [CrossRef]
- Gutiérrez, C.; Somot, S.; Nabat, P.; Mallet, M.; Gaertner, M.Á.; Perpiñán, O. Impact of aerosols on the spatiotemporal variability of photovoltaic energy production in the Euro-Mediterranean area. Sol. Energy 2018, 174, 1142–1152. [Google Scholar] [CrossRef]
- Neher, I.; Buchmann, T.; Crewell, S.; Evers-Dietze, B.; Pfeilsticker, K.; Pospichal, B.; Schirrmeister, C.; Meilinger, S. Impact of atmospheric aerosols on photovoltaic energy production Scenario for the Sahel zone. Energy Procedia 2017, 125, 170–179. [Google Scholar] [CrossRef]
- TSI. Model 8530/8531/8532 DUSTTRAK II Aerosol Monitor, Operation and Service Manual. Available online: https://www.manualslib.com/manual/1378066/Tsi-Instruments-Dusttrak-Ii-8530.html (accessed on 2 January 2020).
- Zogou, O.; Stamatelos, A. Analysis of Data from Ambient PM10 Concentration Monitoring in Volos in the Period 2005–2010. Am. J. Environ. Eng. 2012, 2, 97–108. [Google Scholar]
- Heal, M.R.; Beverland, I.J.; McCabe, M.; Hepburn, W.; Agius, R.M. Intercomparison of five PM10 monitoring devices and the implications for exposure measurement in epidemiological research. J. Environ. Monit. 2000, 2, 455–461. [Google Scholar] [CrossRef] [Green Version]
- Chow, J.C.; Watson, J.G.; Lowenthal, D.H.; Richards, L.W. Comparability between PM2.5 and particle light scattering measurements. Environ. Monit. Assess. 2002, 79, 29–45. [Google Scholar] [CrossRef]
- Kokhanovsky, A. Aerosol Optics: Light Absorption and Scattering by Particles in the Atmosphere; Springer: Berlin/Heidelberg, Germany, 2008. [Google Scholar]
- Roumpakias, E.; Stamatelos, A. Comparative performance analysis of grid-connected photovoltaic system by use of existing performance models. Energy Convers. Manag. 2017, 150, 14–25. [Google Scholar] [CrossRef]
- Roumpakias, E.; Stamatelos, A. Performance analysis of a grid-connected photovoltaic park after 6 years of operation. Renew. Energy 2019, 141, 368–378. [Google Scholar] [CrossRef]
- Marion, B.; Adelstein, J.; Boyle, K.; Hayden, H.; Hammond, B.; Fletcher, T.; Canada, B.; Narang, D.; Kimber, A.; Mitchell, L.; et al. Performance parameters for grid-connected PV systems. In Proceedings of the Conference Record of the Thirty-First IEEE Photovoltaic Specialists Conference, Lake Buena Vista, FL, USA, 3–7 January 2005; pp. 1601–1606. [Google Scholar]
- Marion, B. Comparison of predictive models for photovoltaic module performance. In Proceedings of the 2008 33rd IEEE Photovolatic Specialists Conference, San Diego, CA, USA, 11–16 May 2008; pp. 1–6. [Google Scholar]
- Necaibia, A.; Bouraiou, A.; Ziane, A.; Sahouane, N.; Hassani, S.; Mostefaoui, M.; Dabou, R.; Mouhadjer, S. Analytical assessment of the outdoor performance and efficiency of grid-tied photovoltaic system under hot dry climate in the south of Algeria. Energy Convers. Manag. 2018, 171, 778–786. [Google Scholar] [CrossRef]
- Piliougine, M.; Elizondo, D.; Mora-López, L.; Sidrach-de-Cardona, M. Modelling photovoltaic modules with neural networks using angle of incidence and clearness index. Prog. Photovolt. Res. Appl. 2015, 23, 513–523. [Google Scholar] [CrossRef]
- Wang, H.; Muñoz-García, M.; Moreda, G.; Alonso-García, M. Seasonal performance comparison of three grid connected photovoltaic systems based on different technologies operating under the same conditions. Sol. Energy 2017, 144, 798–807. [Google Scholar] [CrossRef]
- Al Shehri, A.; Parrott, B.; Carrasco, P.; Al Saiari, H.; Taie, I. Impact of dust deposition and brush-based dry cleaning on glass transmittance for PV modules applications. Sol. Energy 2016, 135, 317–324. [Google Scholar] [CrossRef]
- Herrmann, J.; Lorenz, T.; Slamova, K.; Klimm, E.; Koehl, M.; Weiss, K.A. Desert applications of PV modules. In Proceedings of the 2014 IEEE 40th Photovoltaic Specialist Conference (PVSC), Denver, CO, USA, 8–13 June 2014. [Google Scholar]
Figure 1.
PM10 monitoring instrument (Dusttrak 8530) placed inside its environmental enclosure.

Figure 2.
Dust accumulation on PV (photovoltaic) panels’ surface. (a) Clean surface on 18.03.2019. (b) Clean surface on 20.02.2019.
Figure 2.
Dust accumulation on PV (photovoltaic) panels’ surface. (a) Clean surface on 18.03.2019. (b) Clean surface on 20.02.2019.
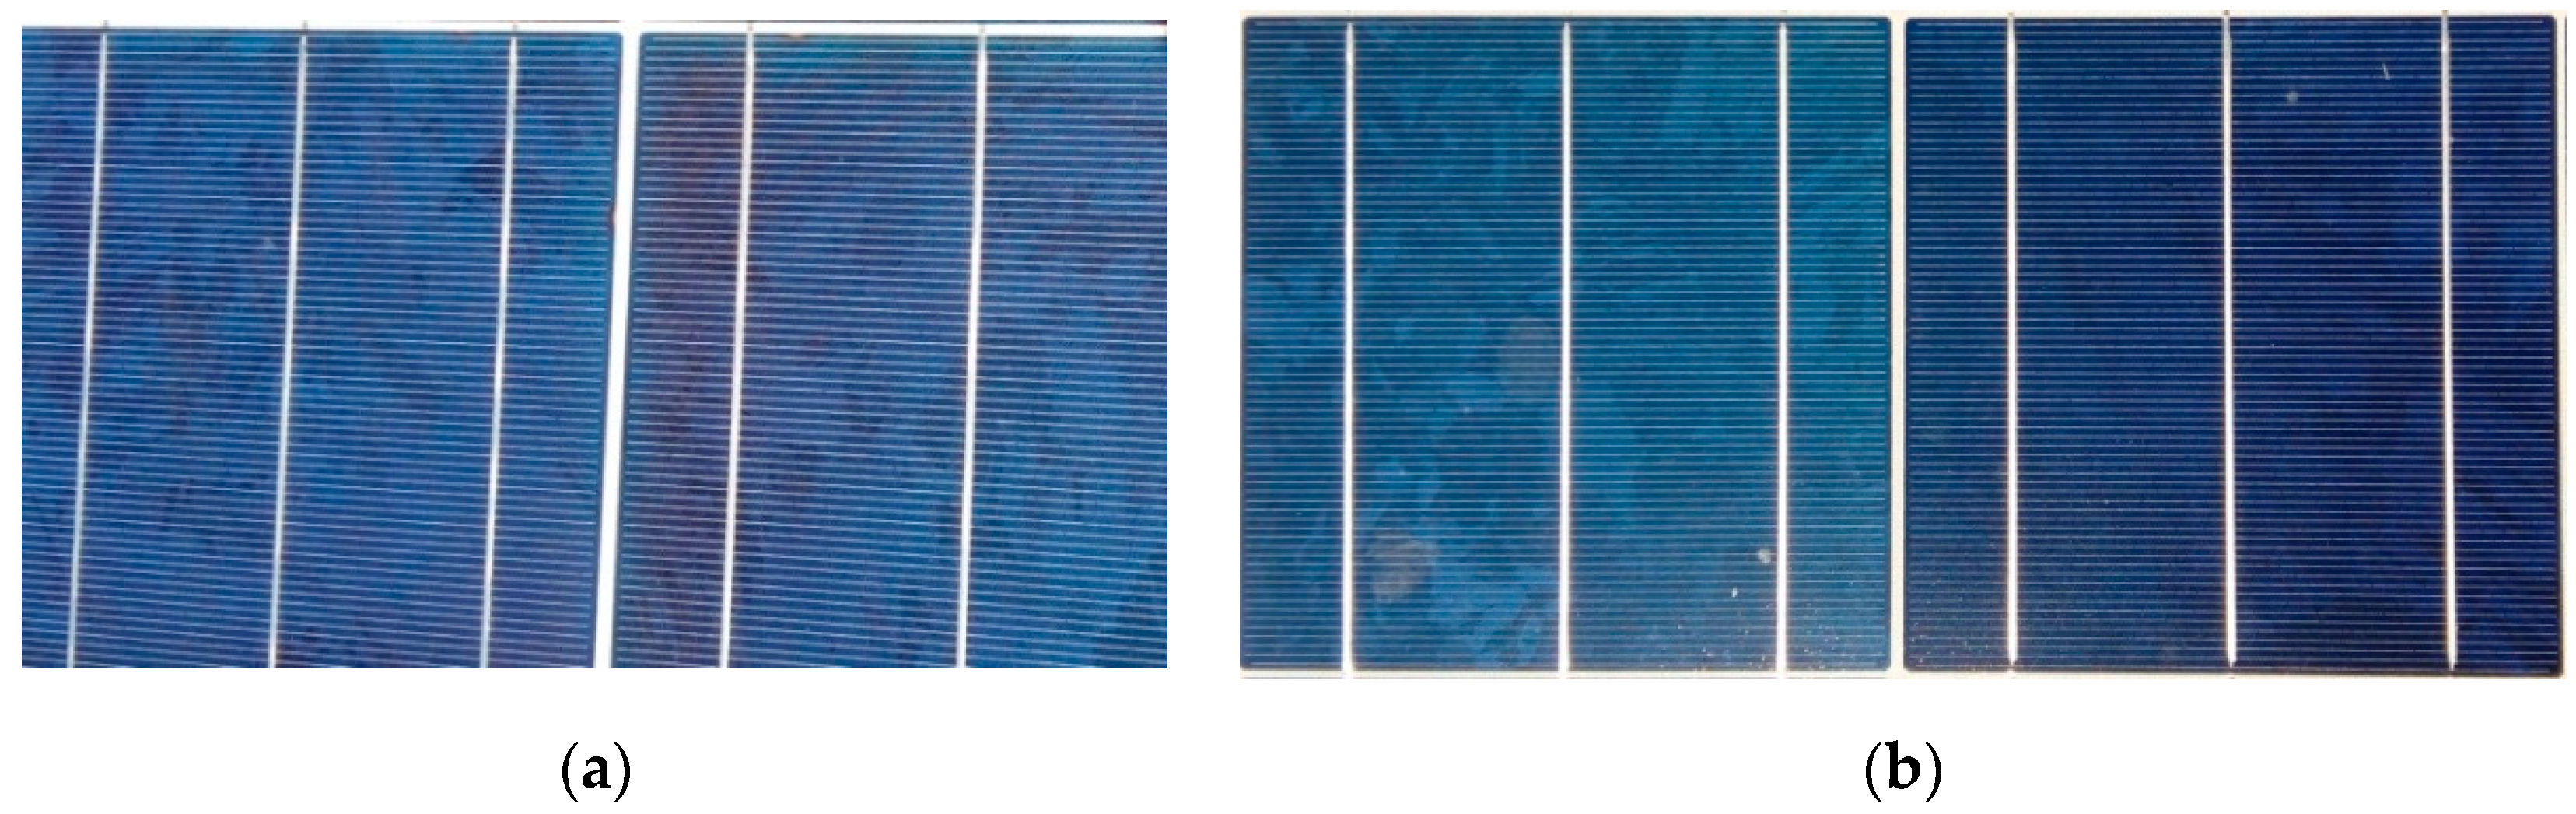
Figure 3.
Comparison in normalized efficiency between clean surface on 18.03.2019 and clean surface on 20.02.2019—reference condition. (a) Normalized efficiency as function of time of day. (b) Normalized efficiency as function of air mass.
Figure 3.
Comparison in normalized efficiency between clean surface on 18.03.2019 and clean surface on 20.02.2019—reference condition. (a) Normalized efficiency as function of time of day. (b) Normalized efficiency as function of air mass.

Figure 4.
Dust accumulation on PV panels’ surface. (a) Lightly soiled surface on 29.04.2019. (b) Clean PV panels’ surface on 20.02.2019.
Figure 4.
Dust accumulation on PV panels’ surface. (a) Lightly soiled surface on 29.04.2019. (b) Clean PV panels’ surface on 20.02.2019.
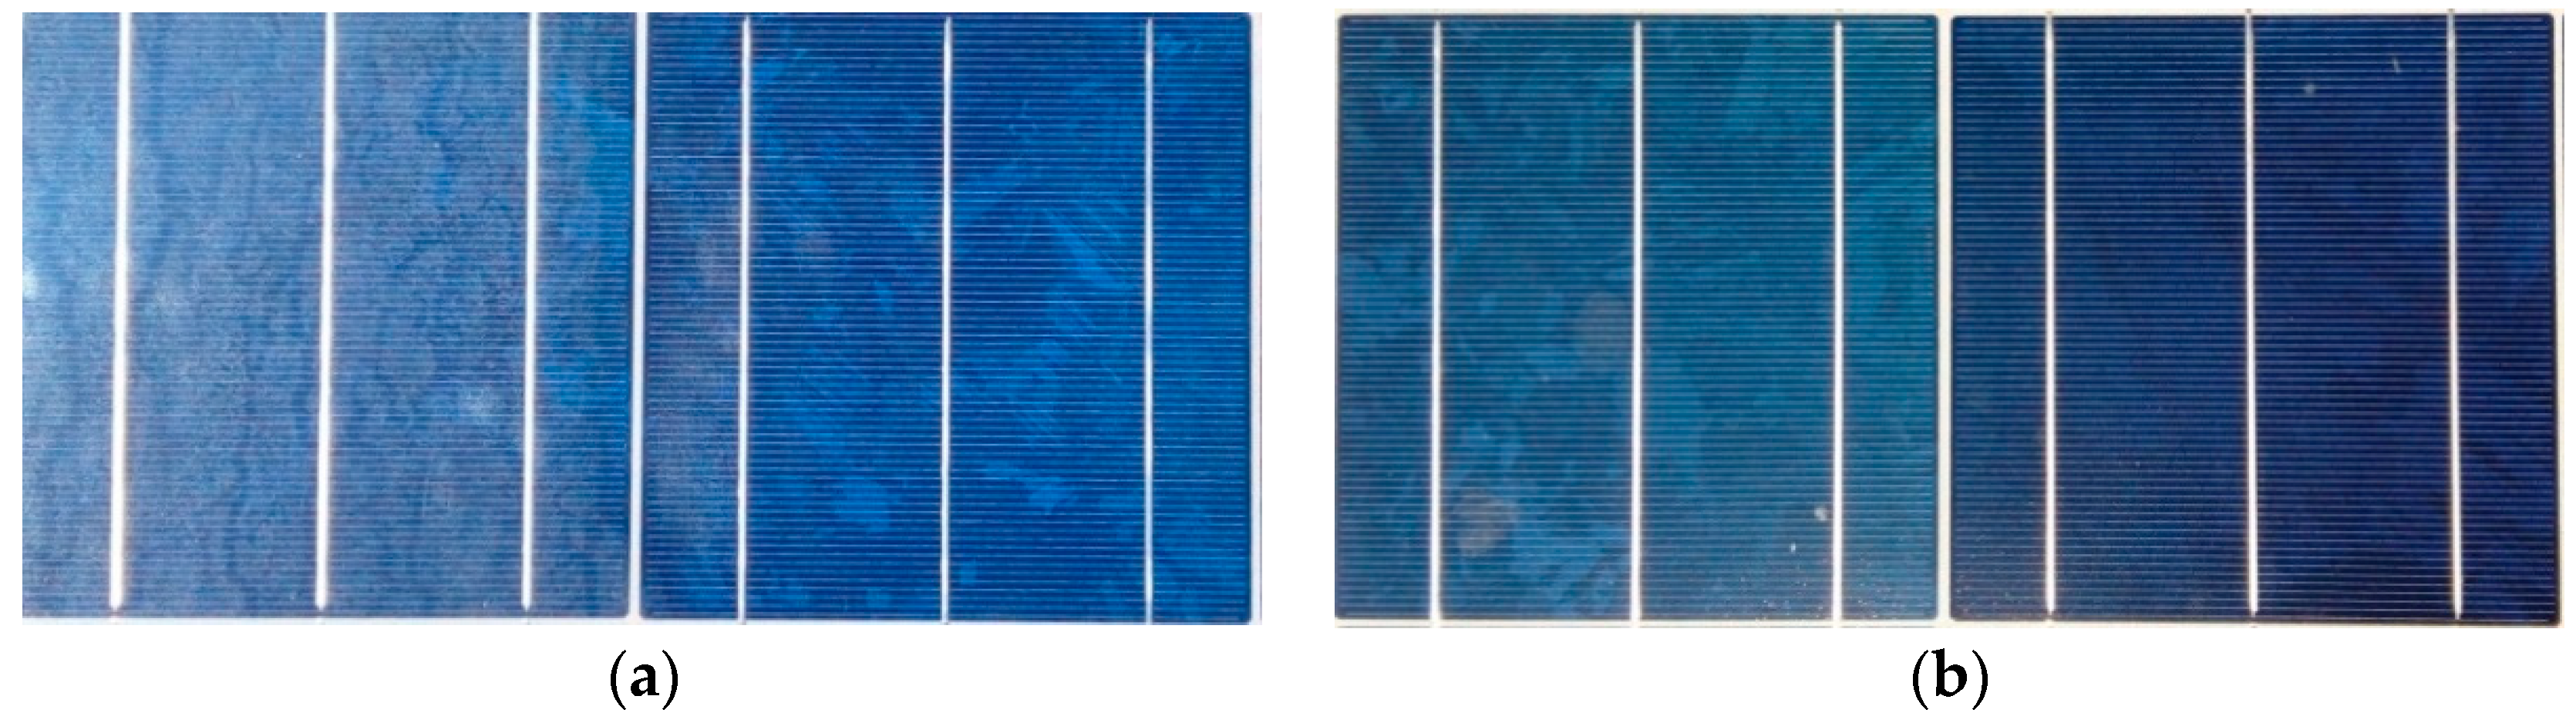
Figure 5.
Comparison of normalized efficiency between clean surface on 29.04.2019 and clean surface on 20.02.2019 reference condition. (a) Normalized efficiency with time of day. (b) Normalized efficiency with air mass.
Figure 5.
Comparison of normalized efficiency between clean surface on 29.04.2019 and clean surface on 20.02.2019 reference condition. (a) Normalized efficiency with time of day. (b) Normalized efficiency with air mass.
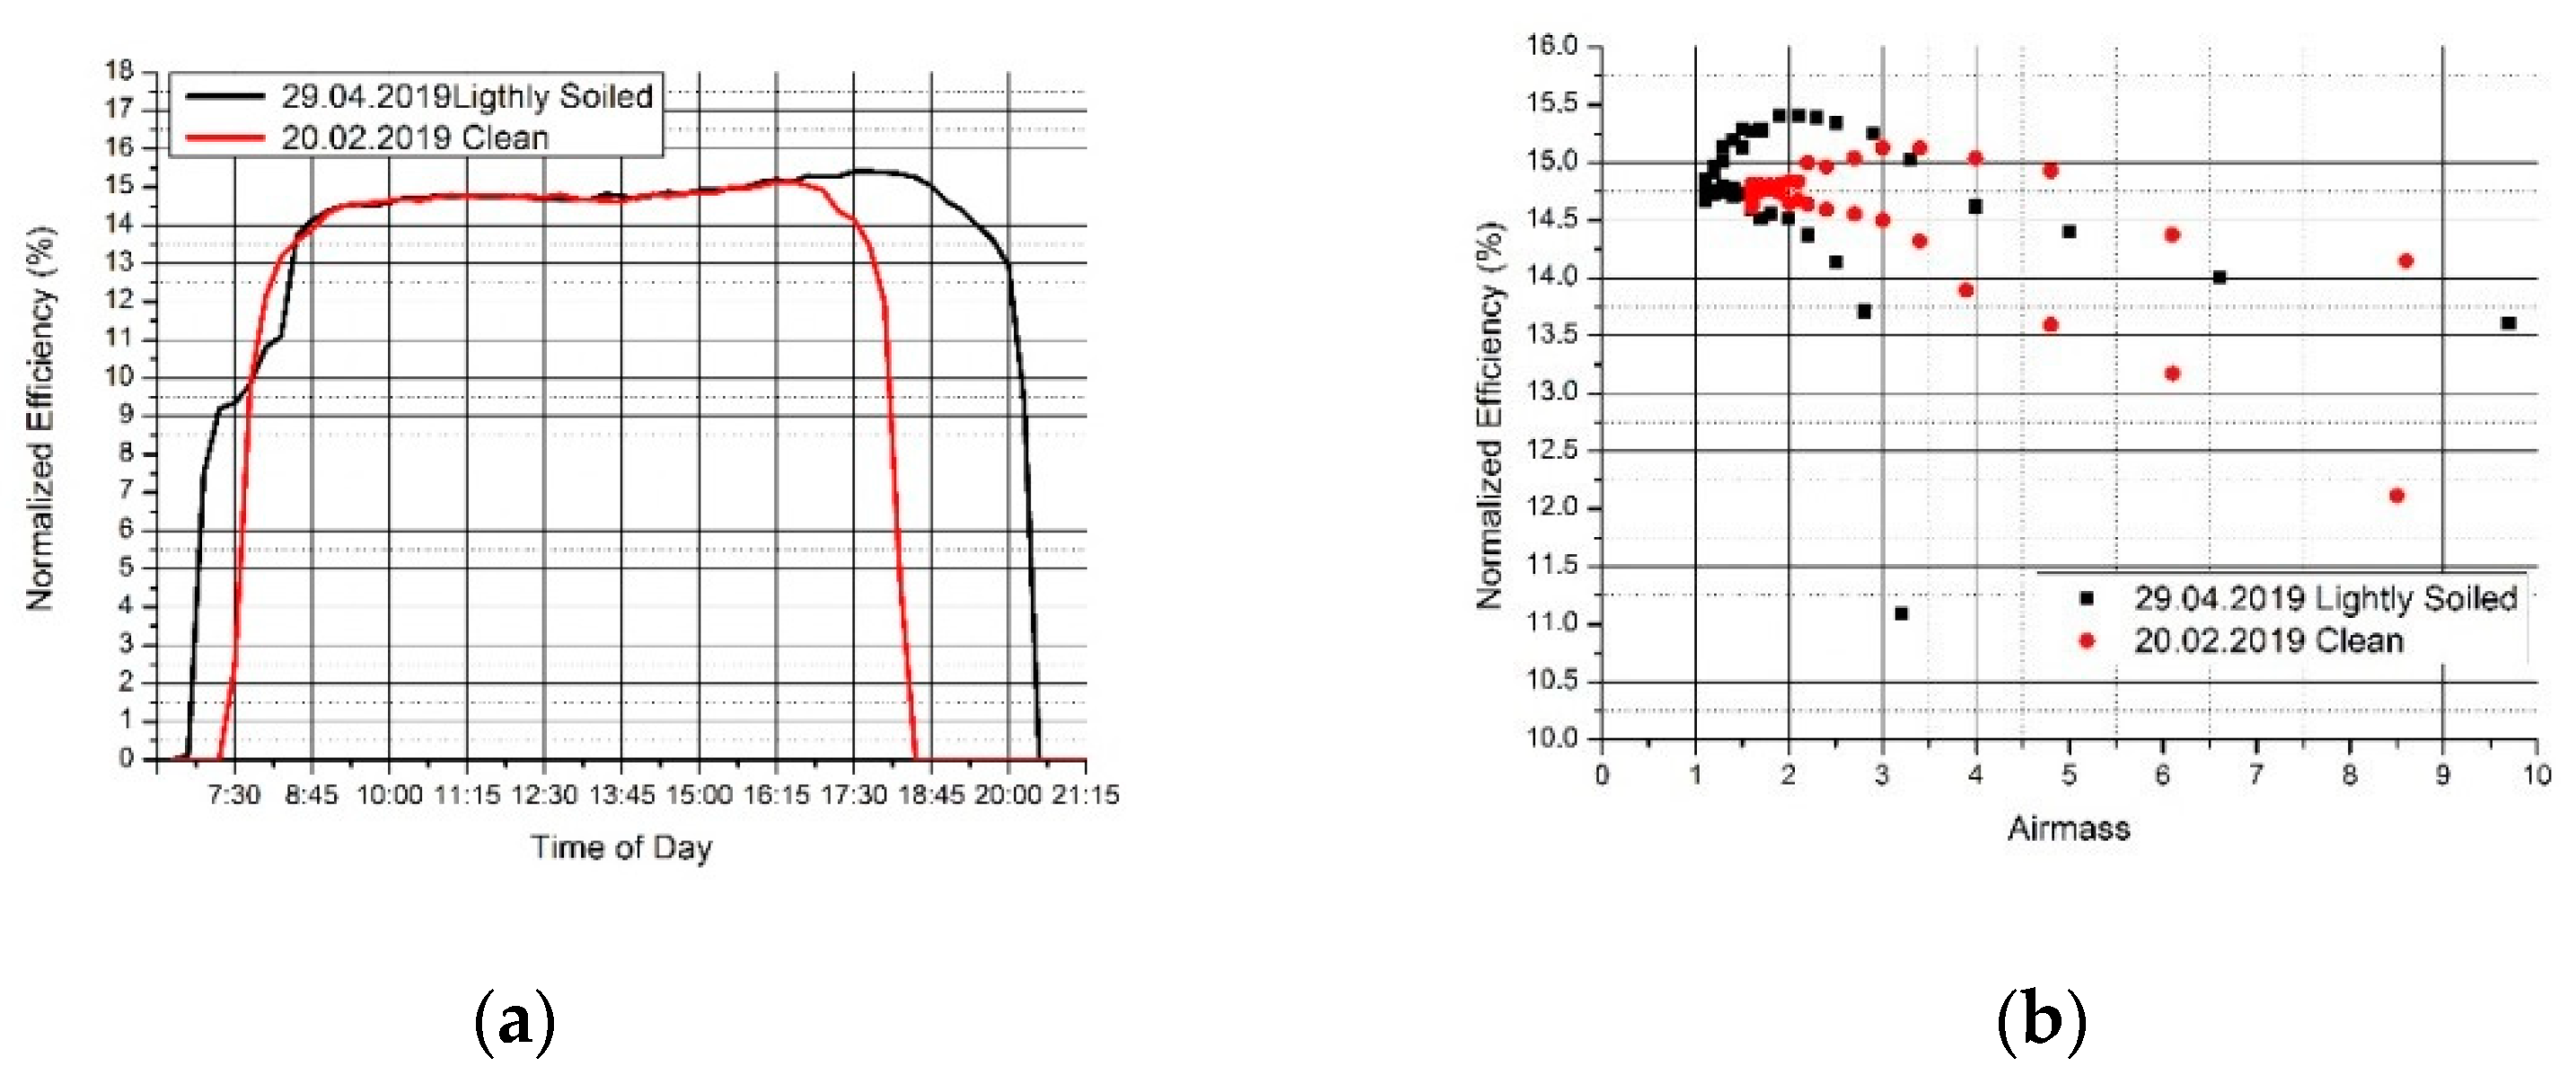
Figure 6.
Dust accumulation on PV panels’ surface. (a) Medium soiled on 23.08.2018. (b) Clean PV panels’ surface on 20.02.2019.
Figure 6.
Dust accumulation on PV panels’ surface. (a) Medium soiled on 23.08.2018. (b) Clean PV panels’ surface on 20.02.2019.
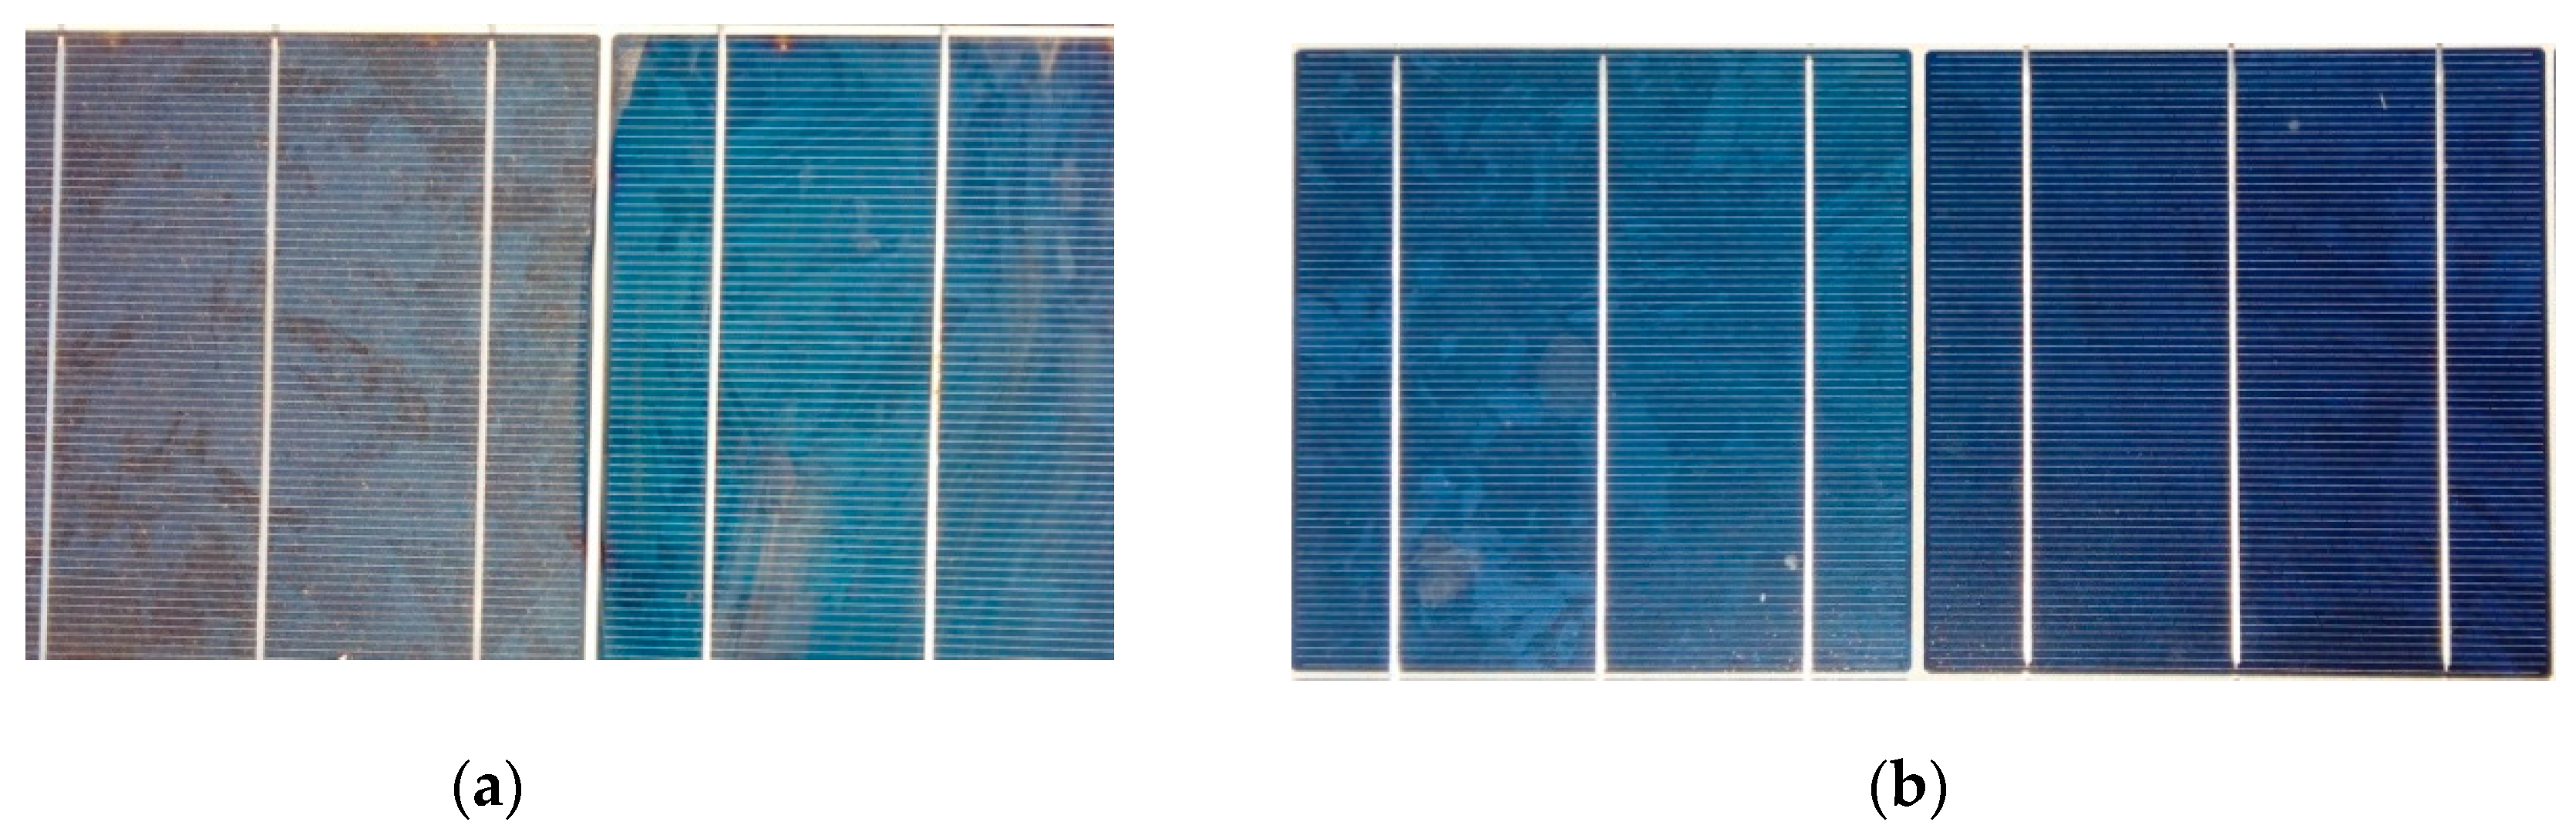
Figure 7.
Comparison in normalized efficiency between a medium soiled surface on 23.08.2018 and a clean surface on 20.02.2019. (a) normalized efficiency vs time of day; (b) normalized efficiency vs Airmass.
Figure 7.
Comparison in normalized efficiency between a medium soiled surface on 23.08.2018 and a clean surface on 20.02.2019. (a) normalized efficiency vs time of day; (b) normalized efficiency vs Airmass.
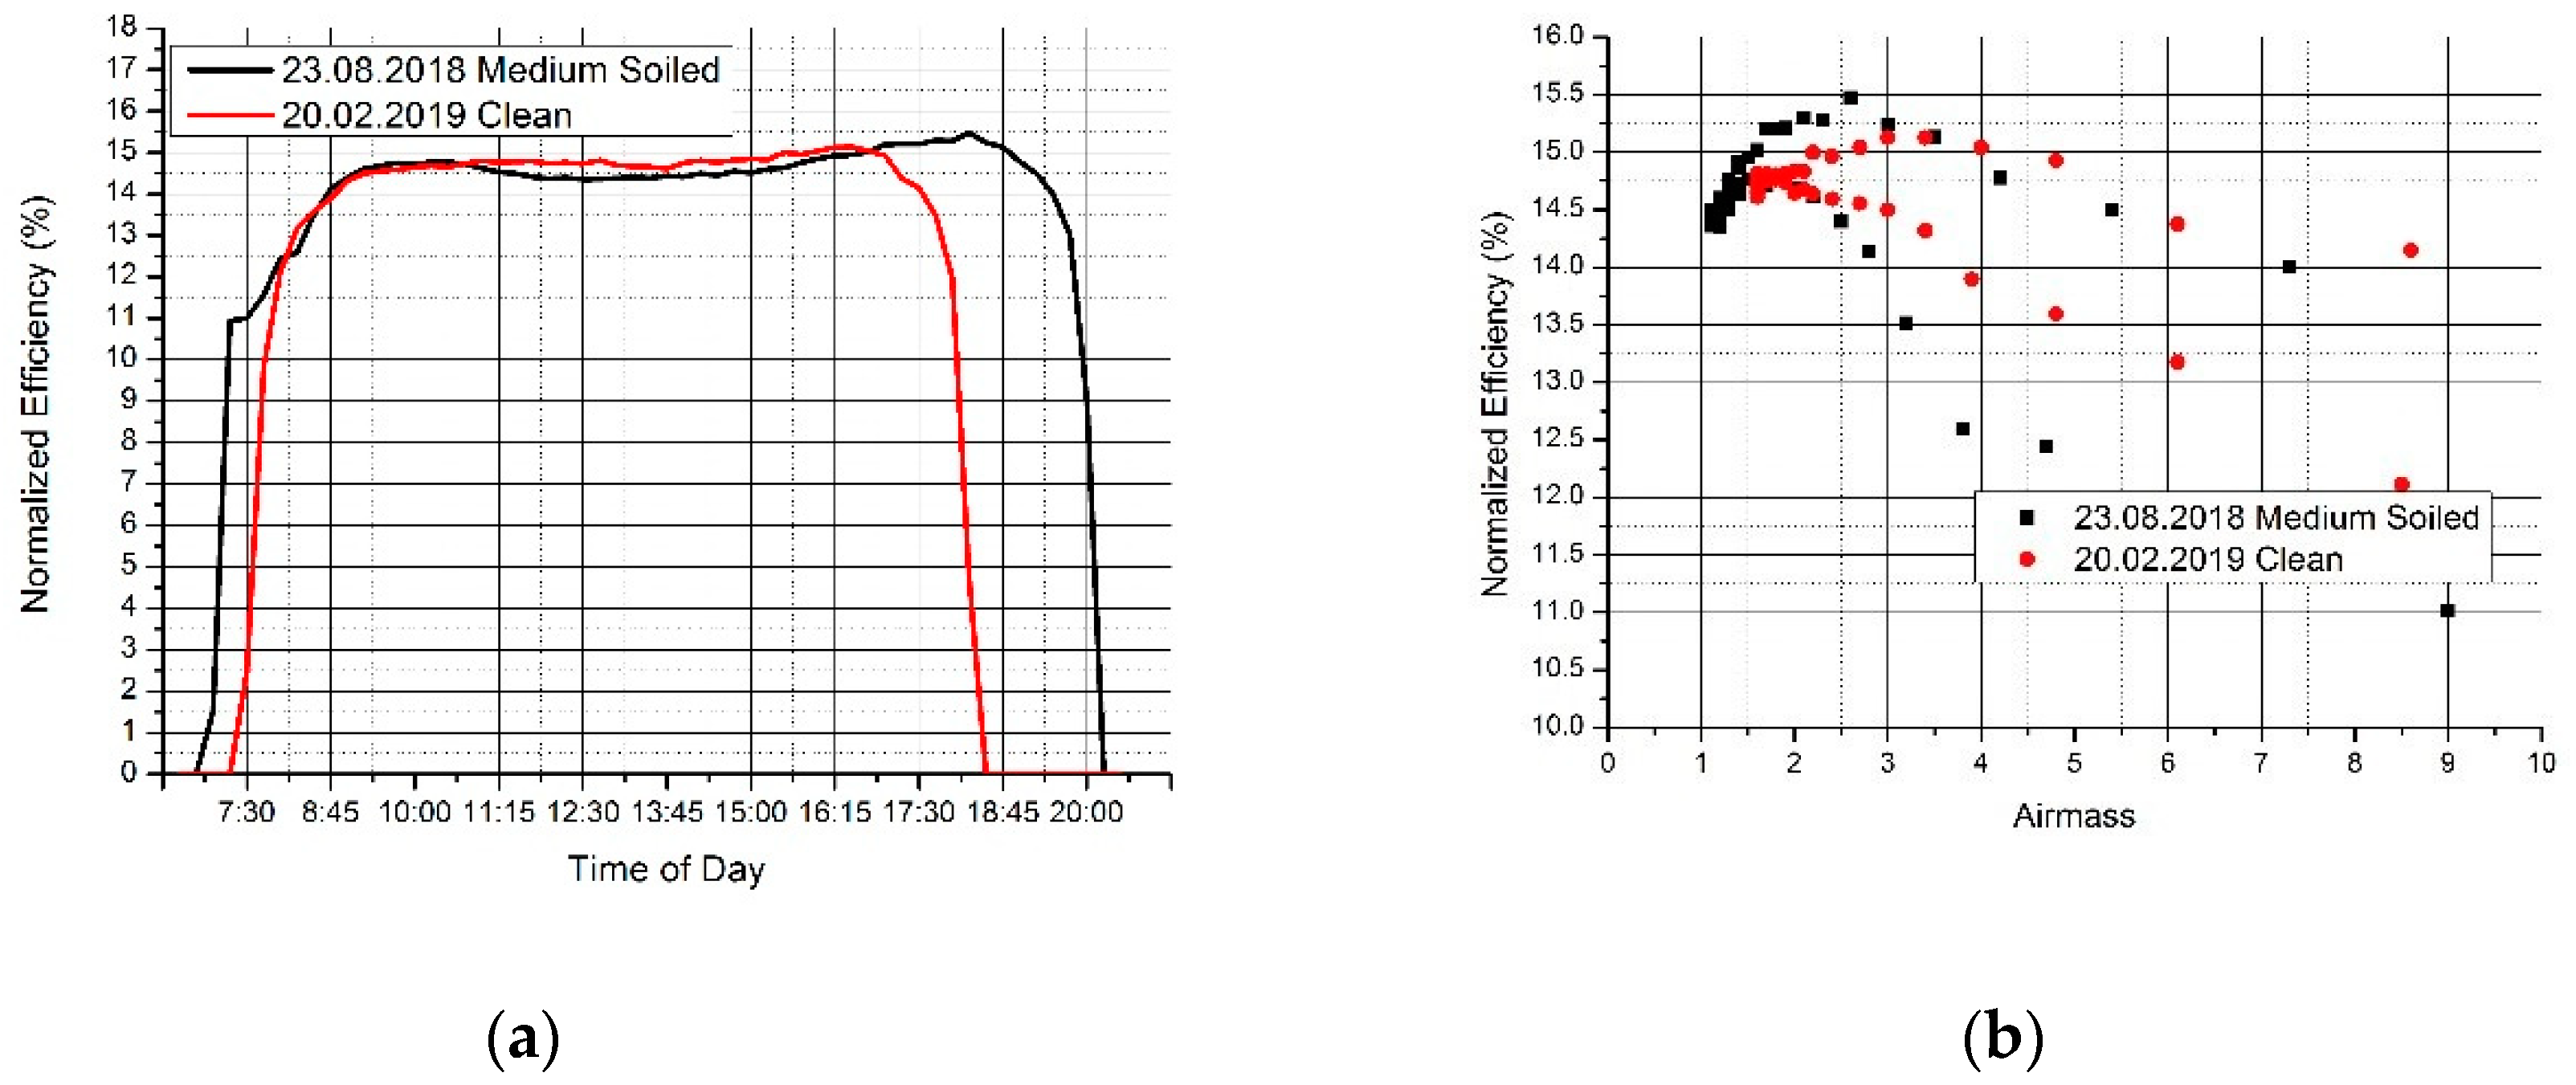
Figure 8.
Dust accumulation on PV panels’ surface. (a) Heavily soiled on 24.04.2019. (b) Clean PV panels’ surface on 20.02.2019.
Figure 8.
Dust accumulation on PV panels’ surface. (a) Heavily soiled on 24.04.2019. (b) Clean PV panels’ surface on 20.02.2019.
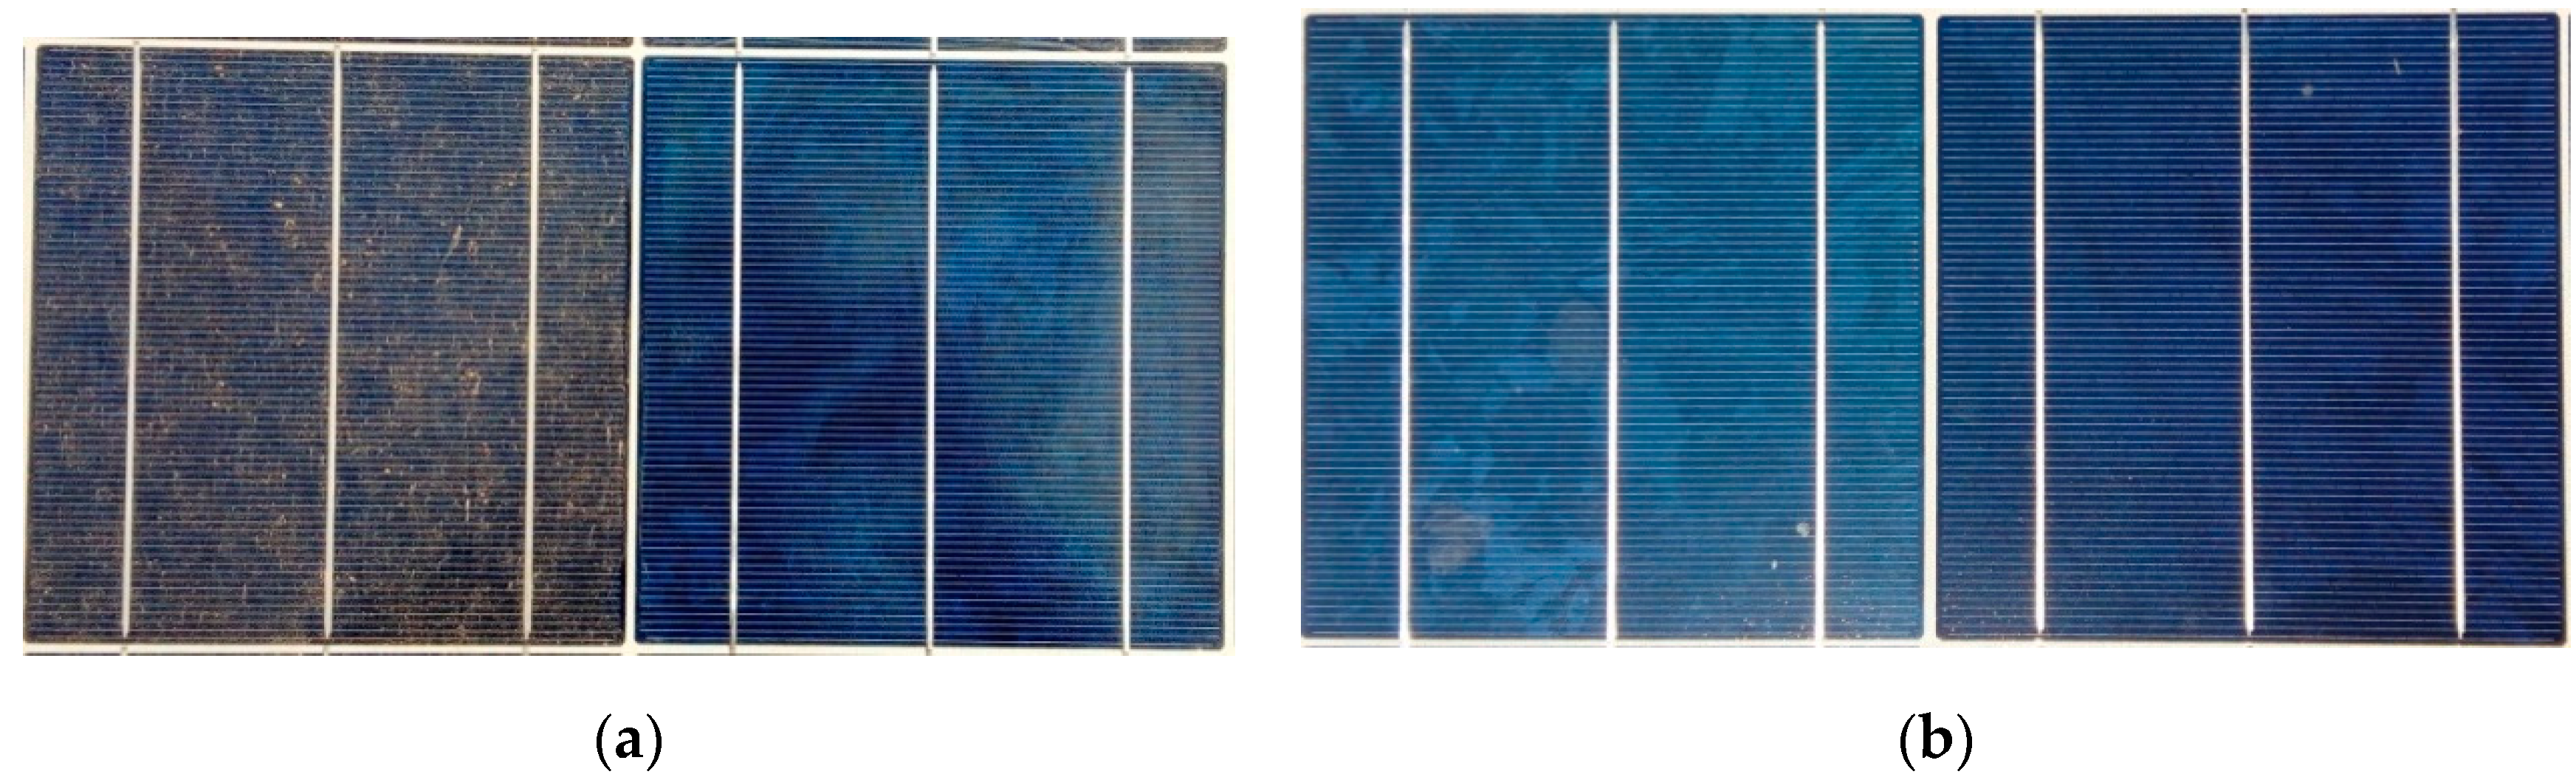
Figure 9.
Comparison in normalized efficiency between a heavily soiled surface on 24.04.2019 and the reference clean surface on 20.02.2019. (a) normalized efficiency vs time of day; (b) normalized efficiency vs Airmass.
Figure 9.
Comparison in normalized efficiency between a heavily soiled surface on 24.04.2019 and the reference clean surface on 20.02.2019. (a) normalized efficiency vs time of day; (b) normalized efficiency vs Airmass.
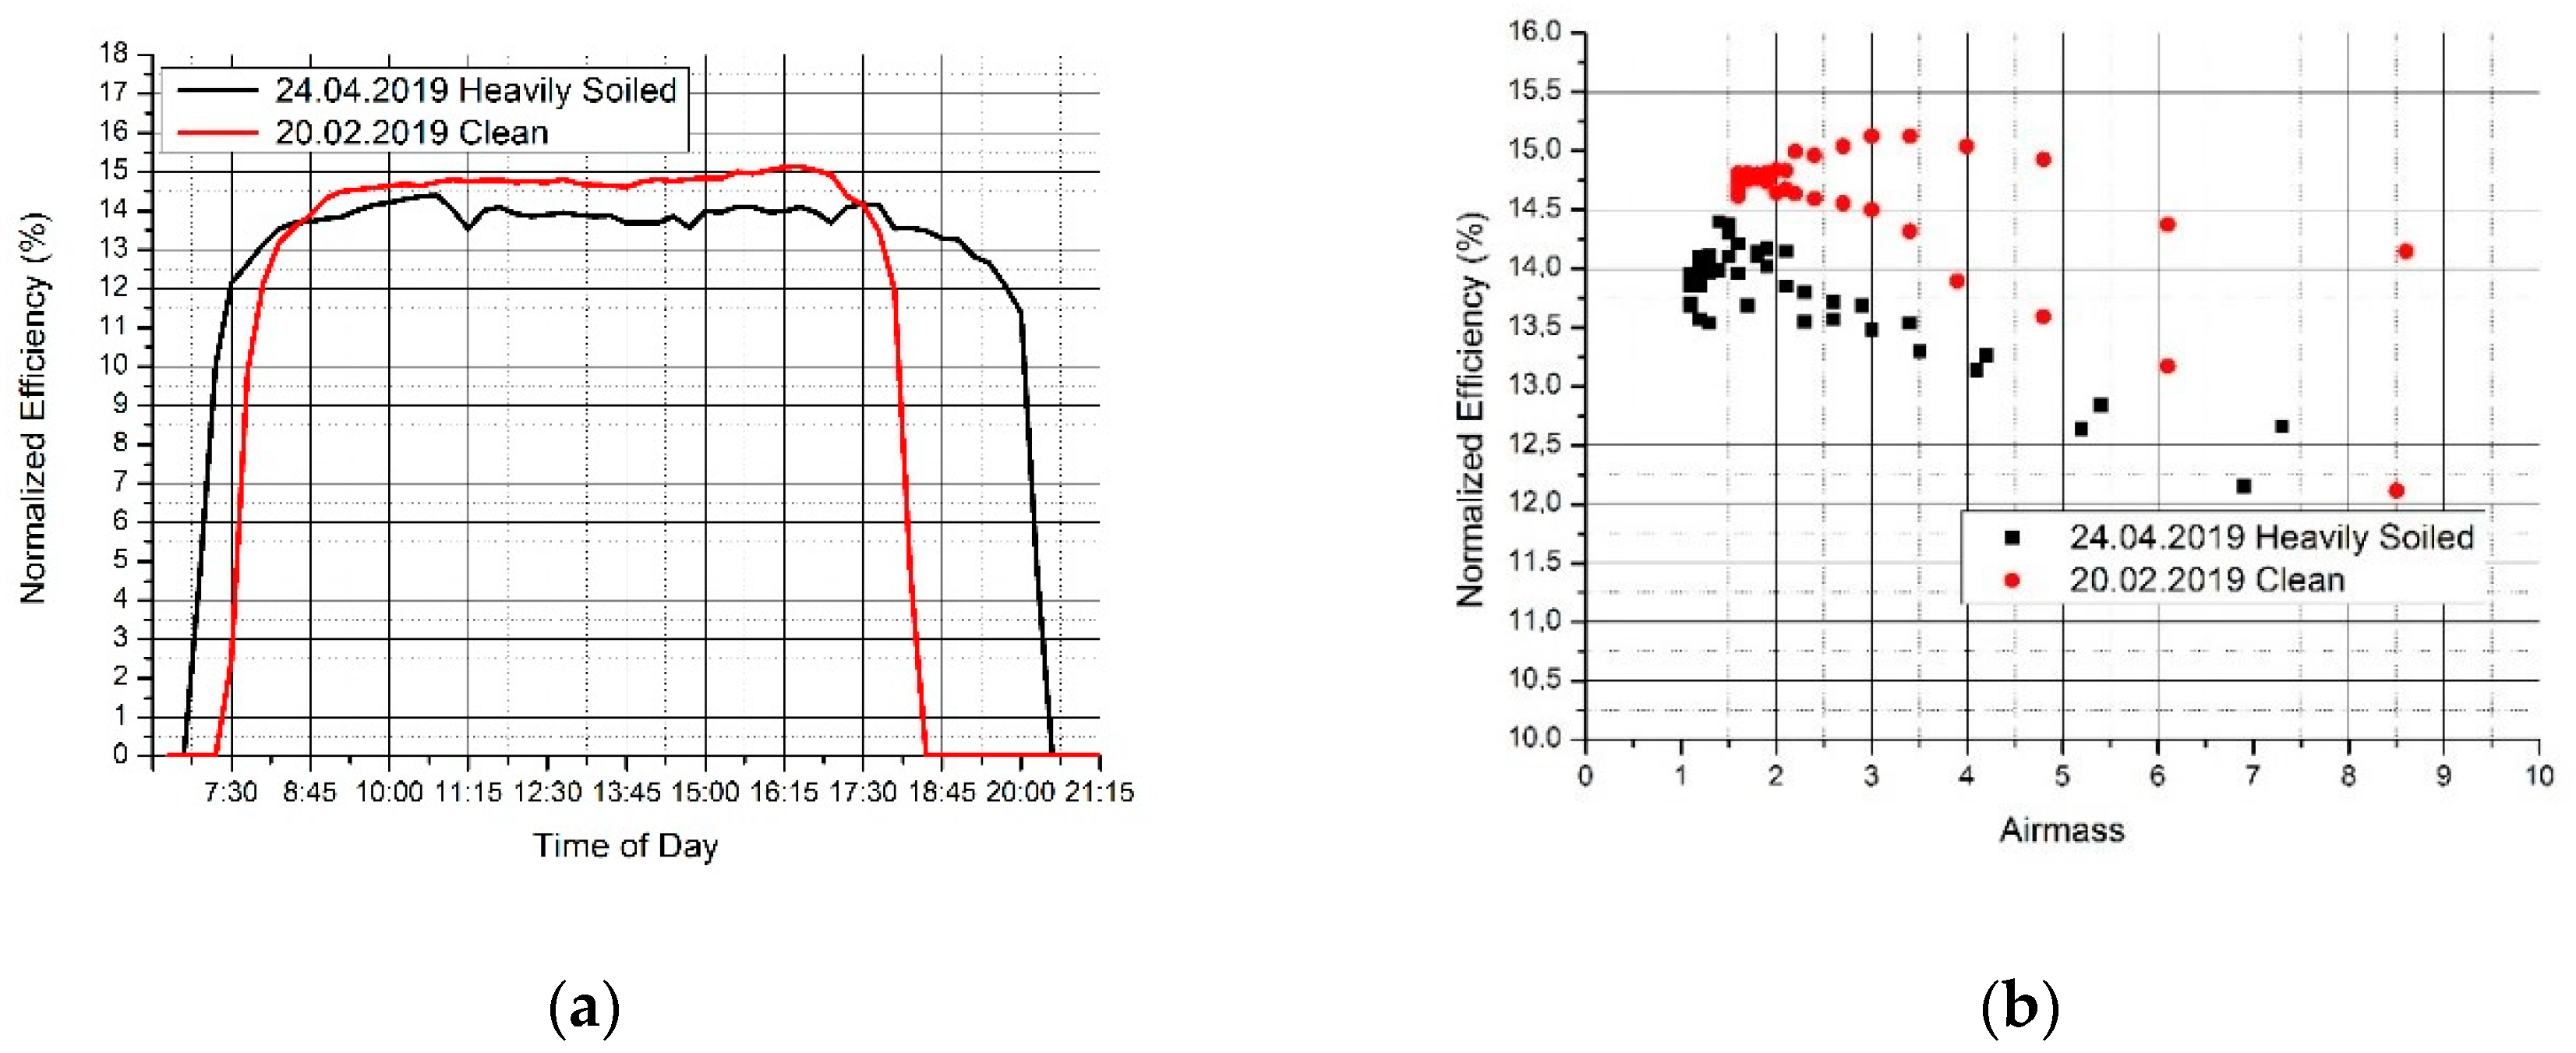
Figure 10.
Daily mm of precipitation (rainfall) in relation to the daily averaged normalized efficiency, for selected time periods during the years 2017 (a), 2018 ((b–d)) and 2019 (e,f).
Figure 10.
Daily mm of precipitation (rainfall) in relation to the daily averaged normalized efficiency, for selected time periods during the years 2017 (a), 2018 ((b–d)) and 2019 (e,f).

Figure 11.
Daily mm of rainfall related to daily averaged aerosol concentration.
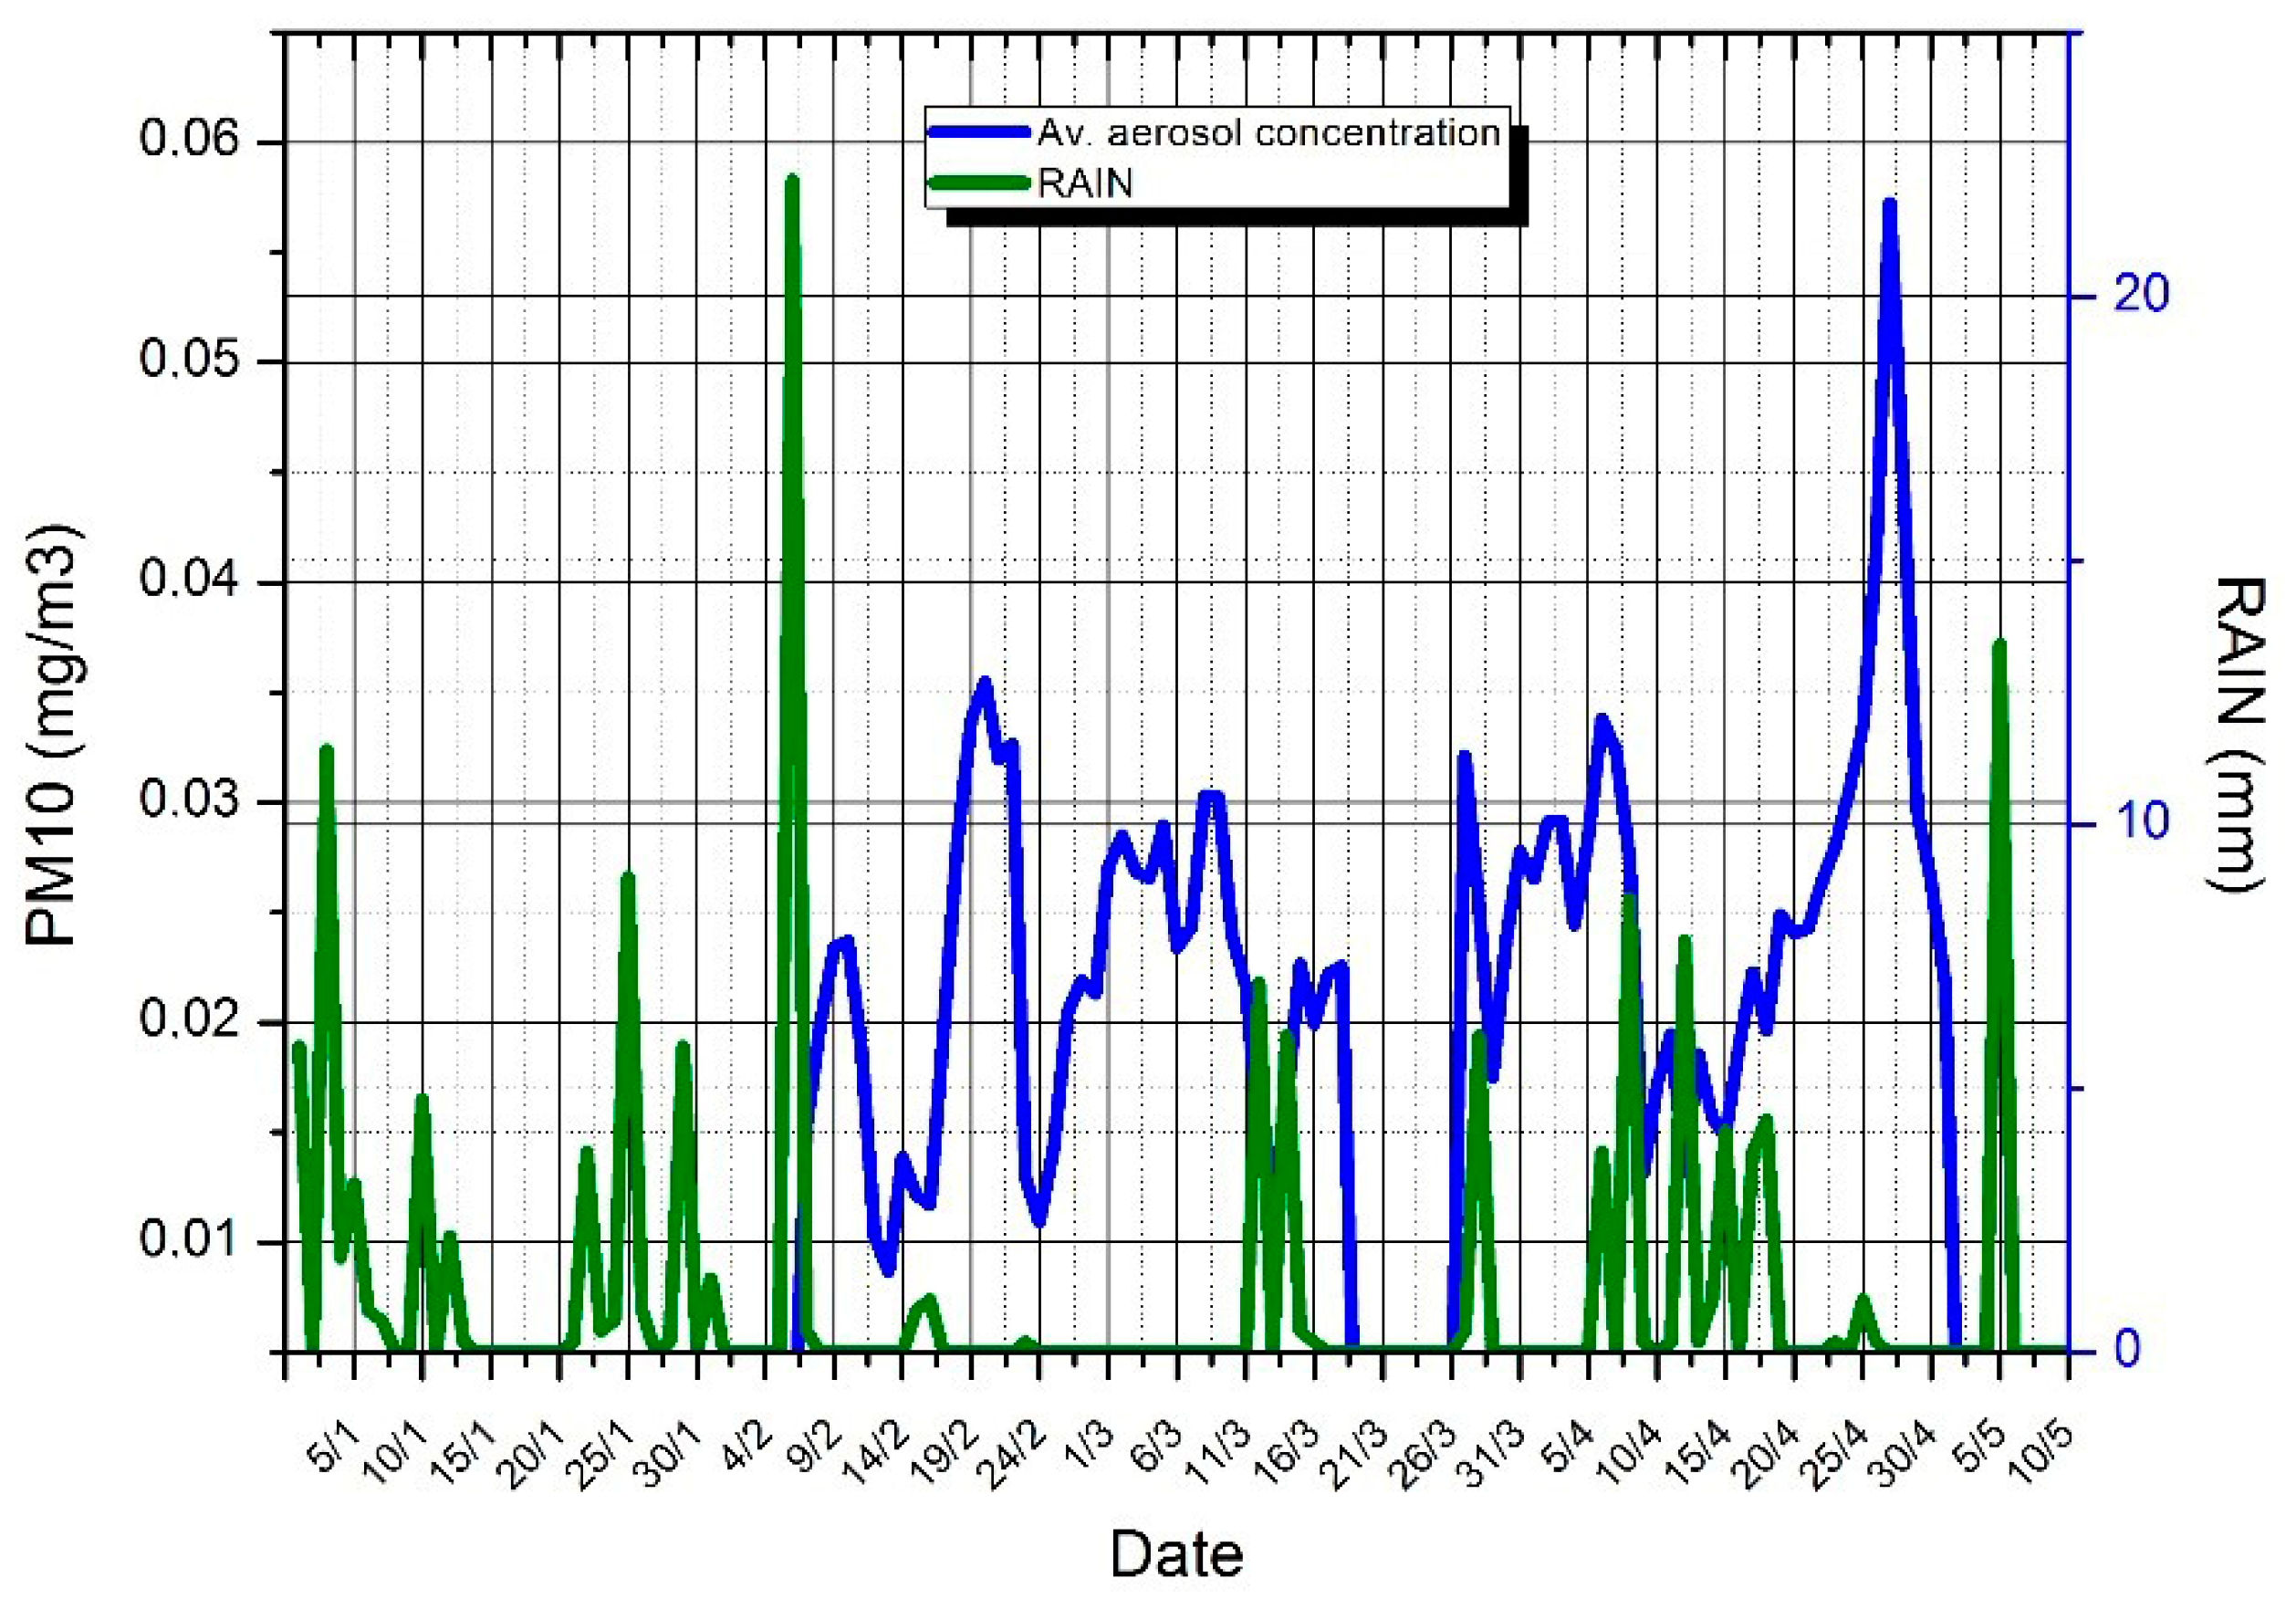
Figure 12.
Aerosol concentration in comparison with normalized efficiency. (a–c) 08.02.2019–18.03.2019. (d–f) 27.03.2019–02.05.2019.
Figure 12.
Aerosol concentration in comparison with normalized efficiency. (a–c) 08.02.2019–18.03.2019. (d–f) 27.03.2019–02.05.2019.
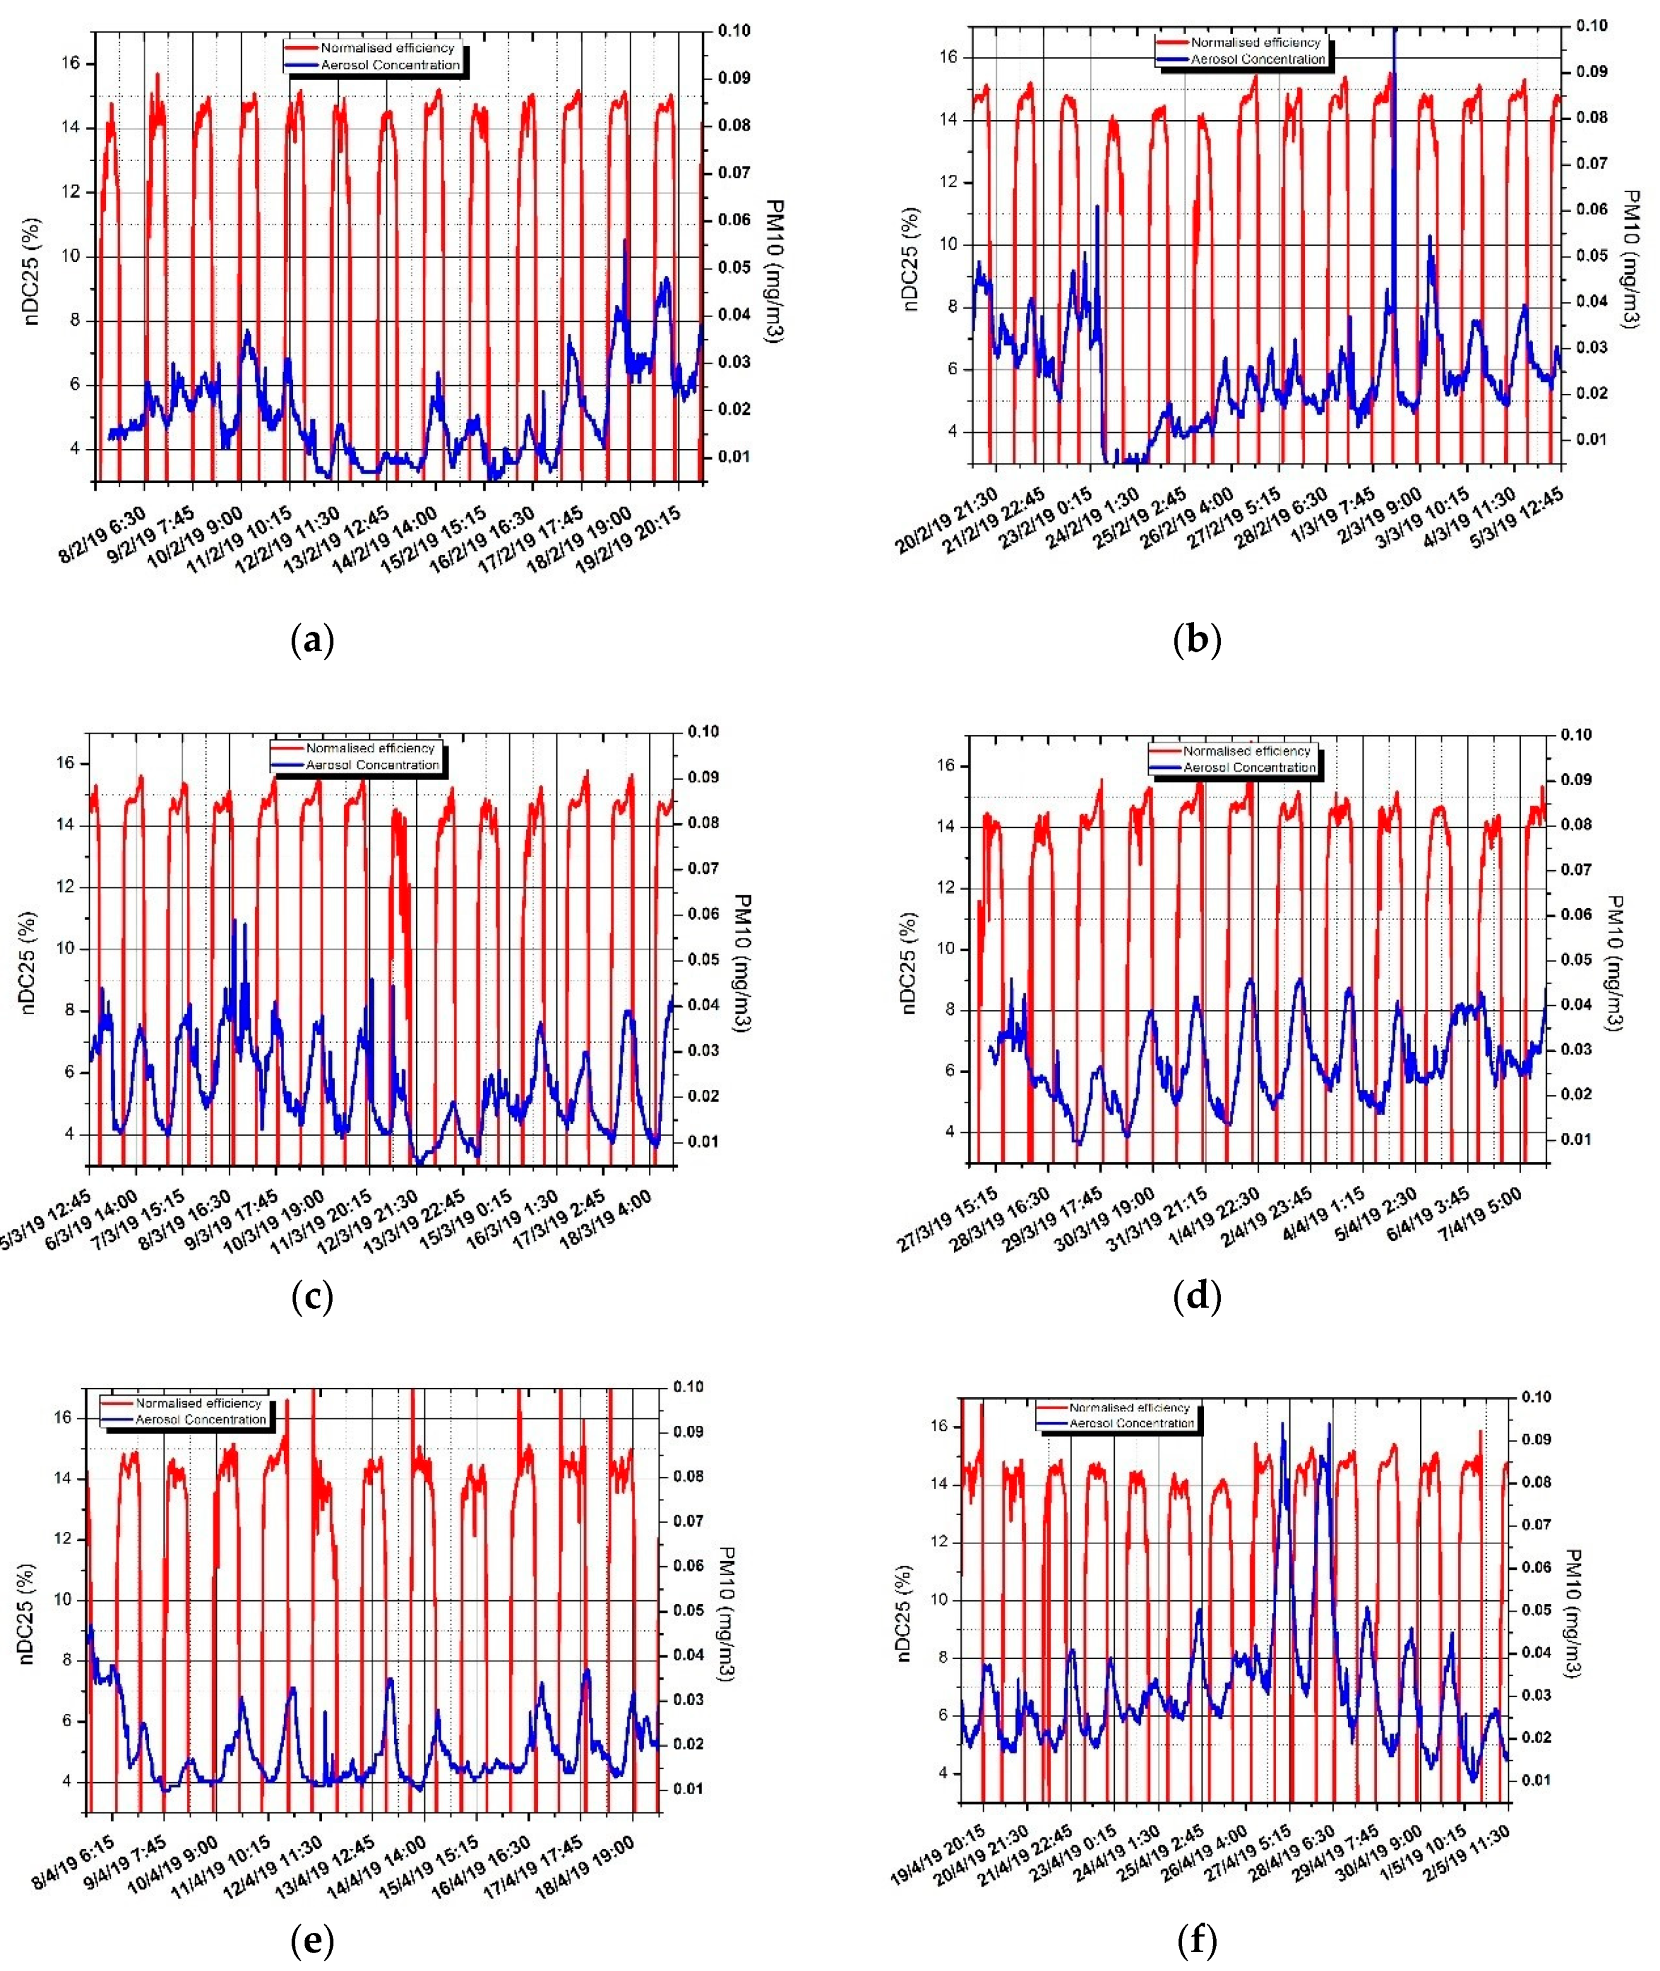
Figure 13.
Correlation between PV normalized efficiency, aerosol concentration, and clearness index for the period 03.12.2018–02.01.2019.
Figure 13.
Correlation between PV normalized efficiency, aerosol concentration, and clearness index for the period 03.12.2018–02.01.2019.
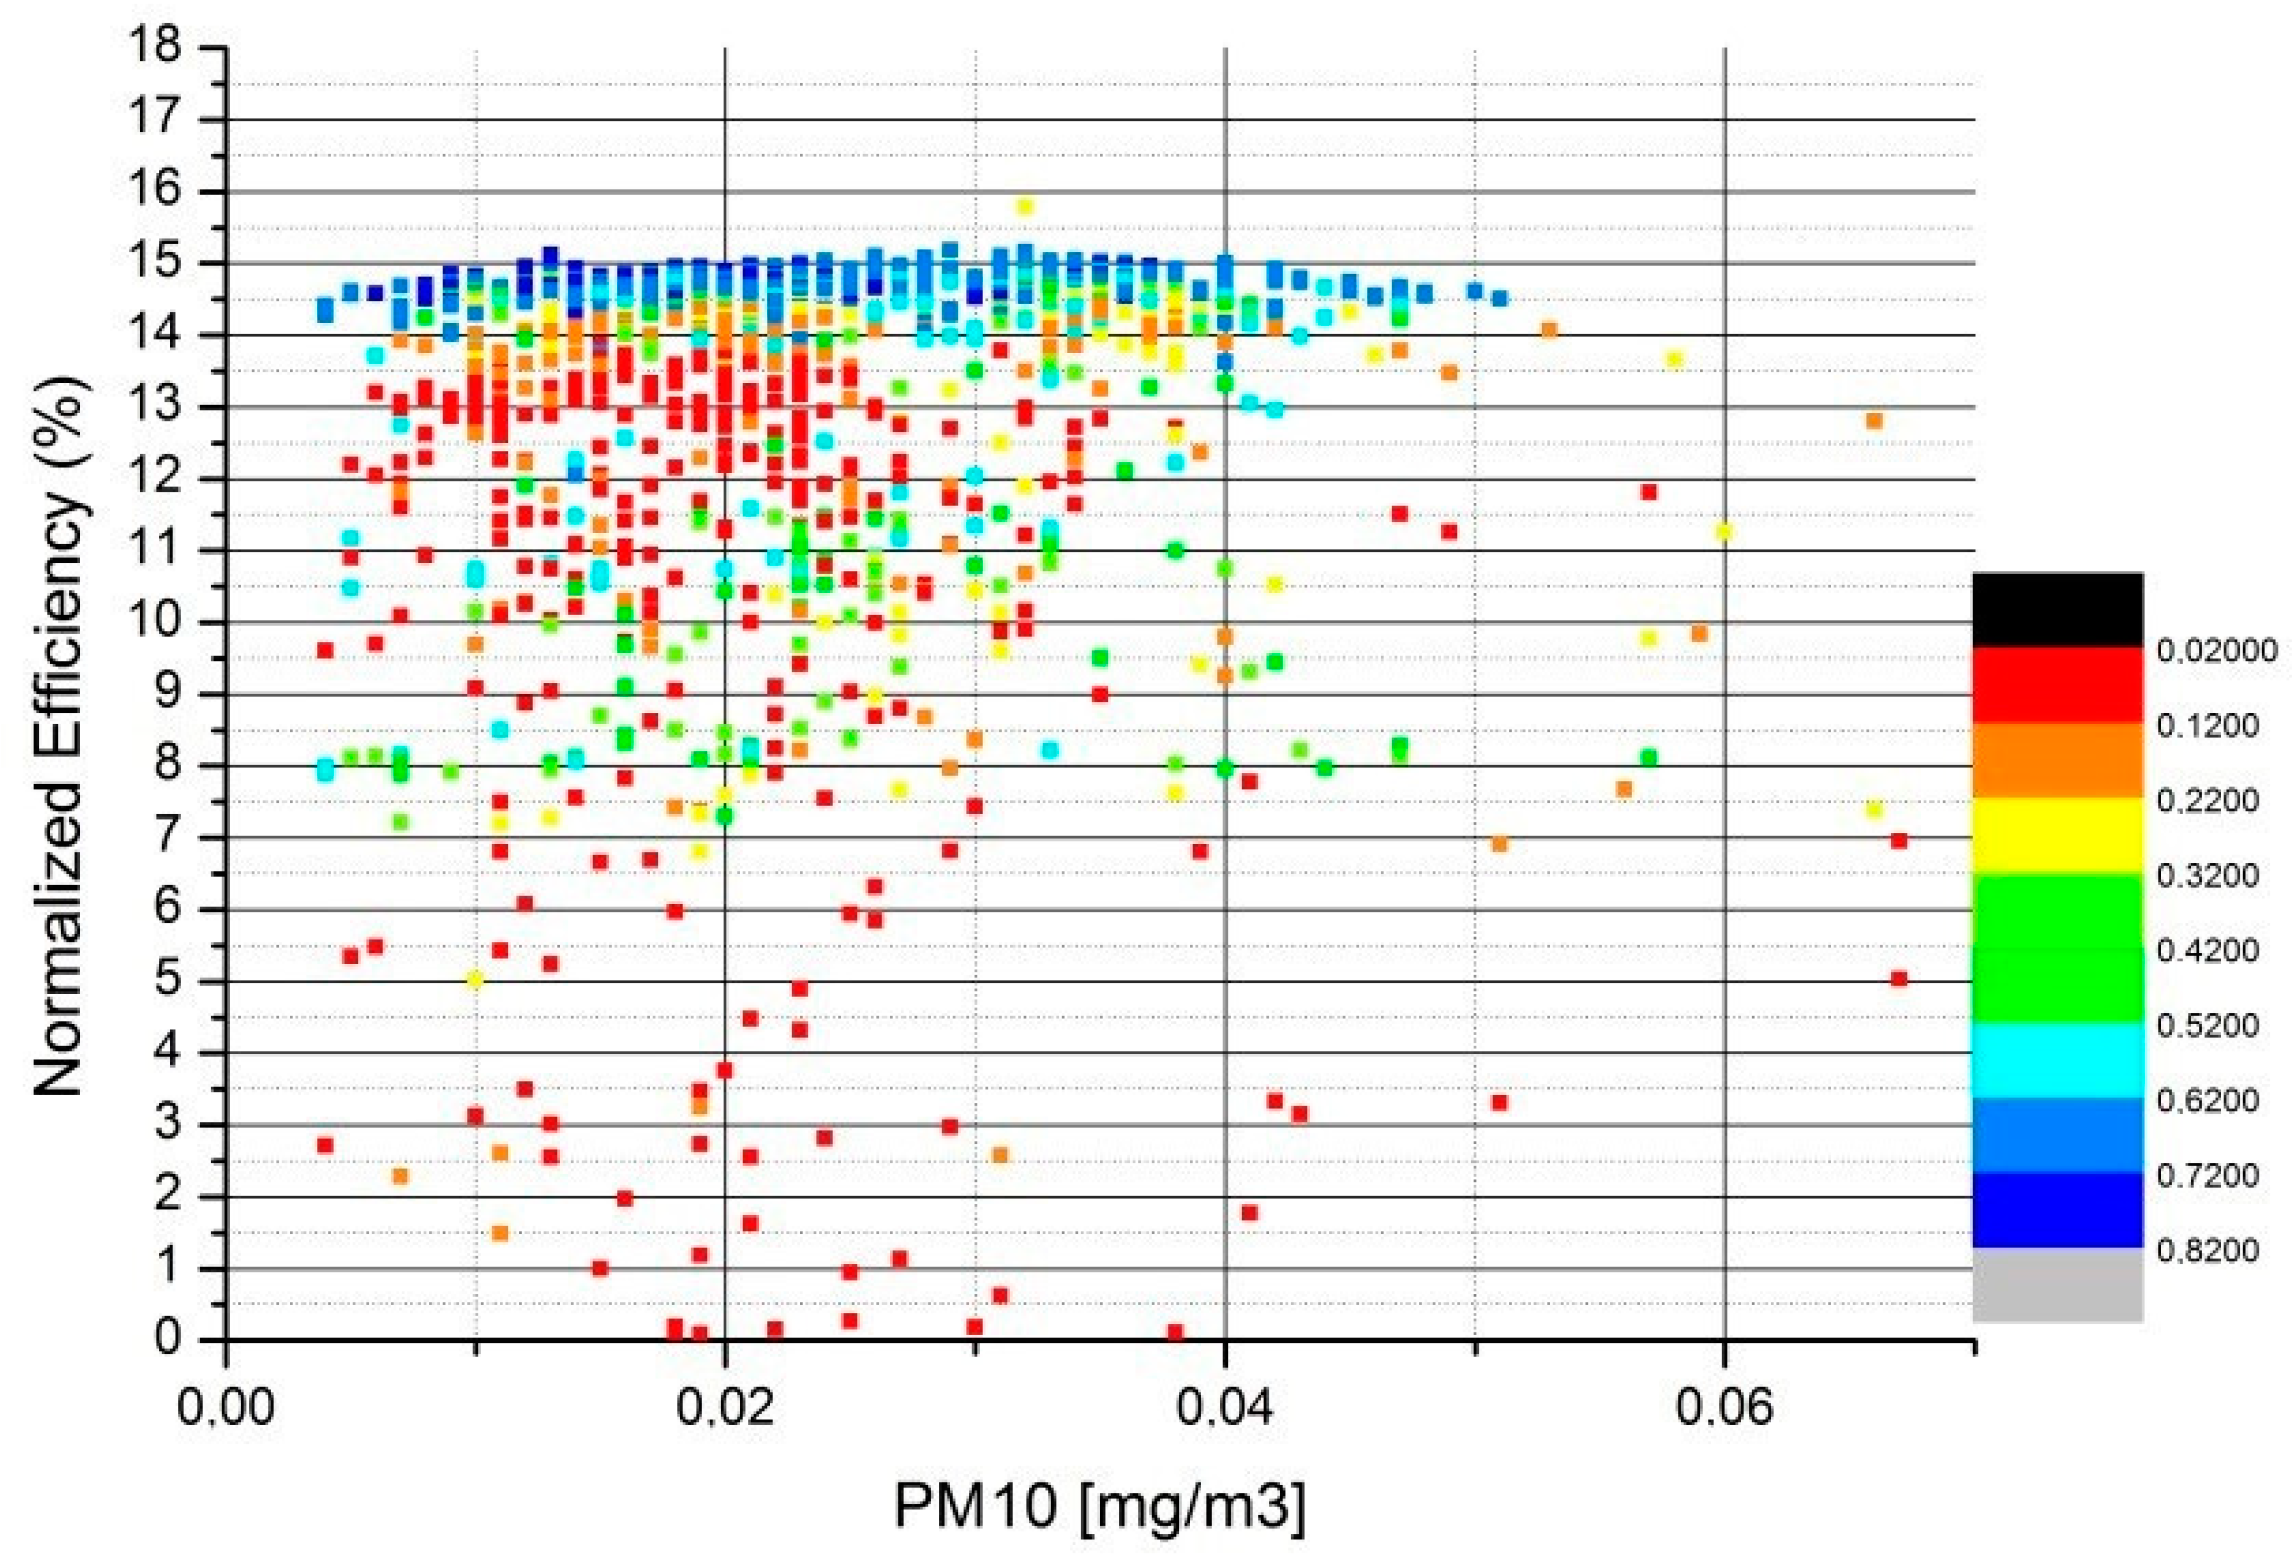
Figure 14.
Correlation between PV normalized efficiency, aerosol concentration, and clearness index from 07.02.2019–18.03.2019.
Figure 14.
Correlation between PV normalized efficiency, aerosol concentration, and clearness index from 07.02.2019–18.03.2019.
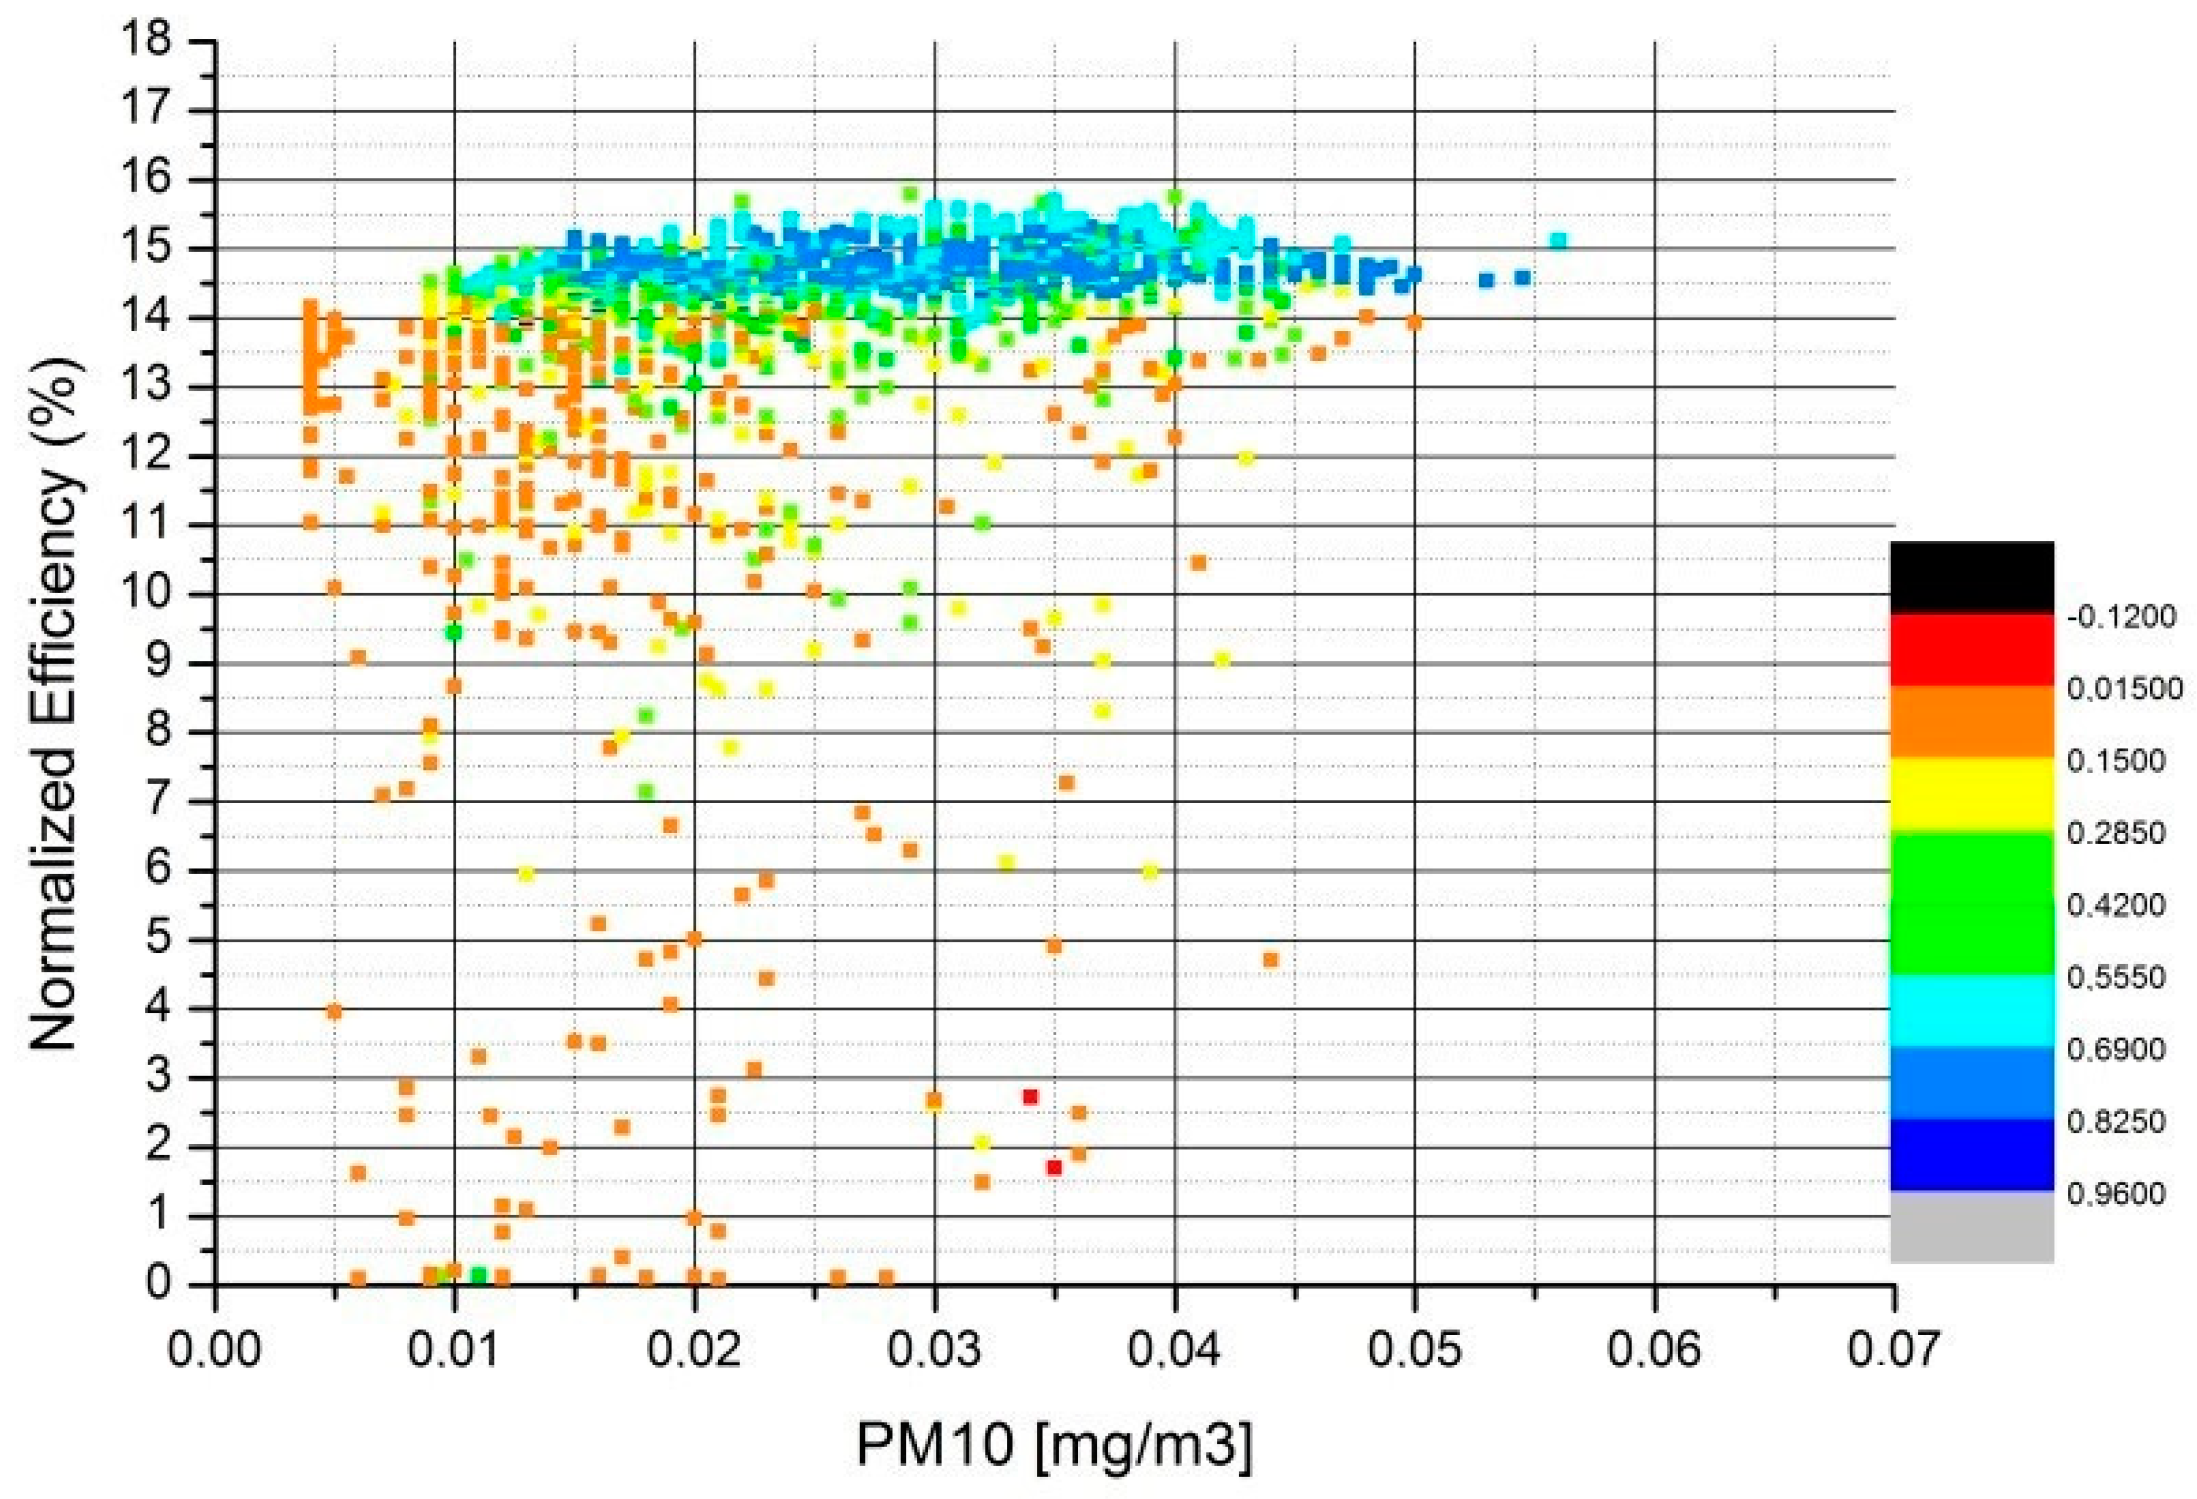
Figure 15.
Correlation between PV normalized efficiency, aerosol concentration, and clearness index from 27.03.2019–02.05.2019.
Figure 15.
Correlation between PV normalized efficiency, aerosol concentration, and clearness index from 27.03.2019–02.05.2019.
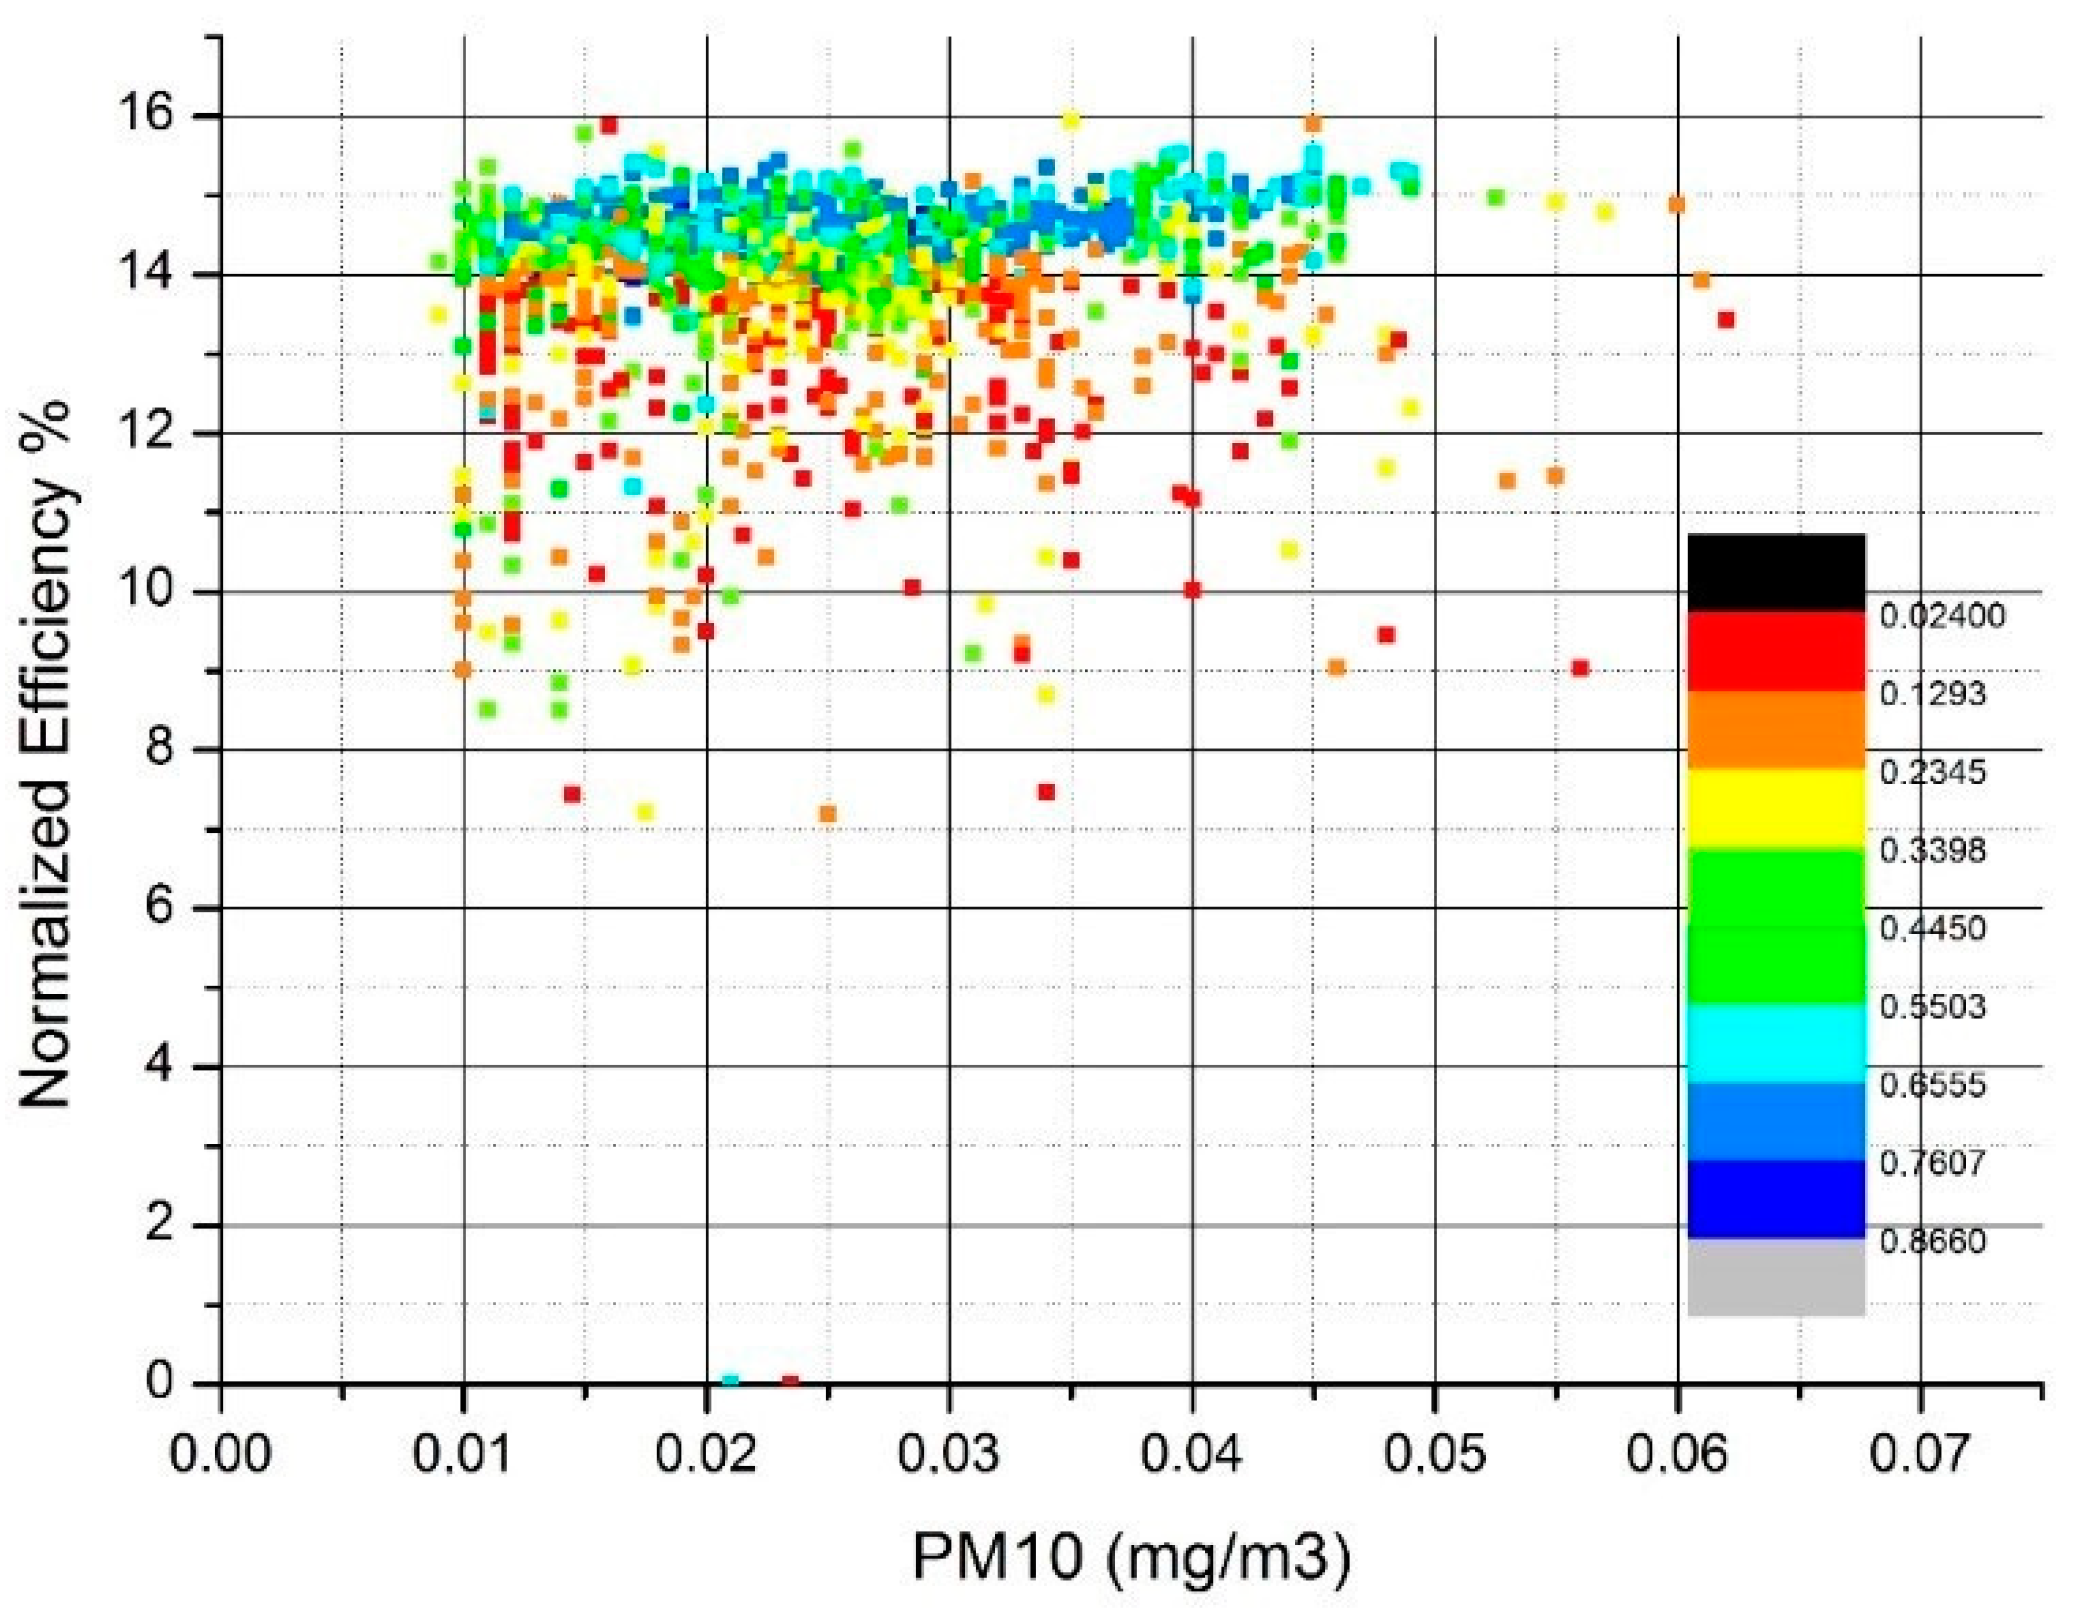
Table 1.
Performance metrics for five days with different level of soiling.
| PV Panel Surface | PR | Averaged Deviation from Reference Value 1 < AM < 3 (%) | Mean of Normalized Efficiency for the Range 1 < AM < 3 (%) |
|---|---|---|---|
| Clean, 20-02-2019 | 0.892 | −2.26 | 14.76 |
| Clean, 18-03-2019 | 0.869 | −1.45 | 14.65 |
| Lightly Soiled, 29-04-2019 | 0.866 | −3.2 | 14.83 |
| Medium Soiled, 23-08-2018 | 0.853 | −2.32 | 14.69 |
| Heavily soiled, 24-04-2019 | 0.856 | 2.25 | 13.92 |
© 2020 by the authors. Licensee MDPI, Basel, Switzerland. This article is an open access article distributed under the terms and conditions of the Creative Commons Attribution (CC BY) license (http://creativecommons.org/licenses/by/4.0/).
Share and Cite
MDPI and ACS Style
Roumpakias, E.; Stamatelos, T. Surface Dust and Aerosol Effects on the Performance of Grid-Connected Photovoltaic Systems. Sustainability 2020, 12, 569. https://doi.org/10.3390/su12020569
AMA Style
Roumpakias E, Stamatelos T. Surface Dust and Aerosol Effects on the Performance of Grid-Connected Photovoltaic Systems. Sustainability. 2020; 12(2):569. https://doi.org/10.3390/su12020569
Chicago/Turabian StyleRoumpakias, Elias, and Tassos Stamatelos. 2020. "Surface Dust and Aerosol Effects on the Performance of Grid-Connected Photovoltaic Systems" Sustainability 12, no. 2: 569. https://doi.org/10.3390/su12020569
Note that from the first issue of 2016, this journal uses article numbers instead of page numbers. See further details here.