Climate Change and Livelihood Vulnerability in Mixed Crop–Livestock Areas: The Case of Province Punjab, Pakistan


College of Economics and Management, Henan Agricultural University, No.15, Longzi Lake College Park, Zhengzhou Eastern New District, Zhengzhou 450046, China
*
Author to whom correspondence should be addressed.
Sustainability 2020, 12(2), 586; https://doi.org/10.3390/su12020586
Submission received: 11 December 2019
/
Revised: 29 December 2019
/
Accepted: 8 January 2020
/
Published: 13 January 2020
(This article belongs to the Section Sustainable Agriculture)
Abstract
:The mixed crop–livestock system is a primary source of livelihood in developing countries. Erratic climate changes are severely affecting the livelihoods of people who depend upon mixed crop–livestock production. By employing the livelihood vulnerability index (LVI), the Intergovernmental Panel on Climate Change LVI (LVIIPCC), and the livelihood effect index (LEI), this study evaluated livelihood vulnerability in southern Punjab, Pakistan. The study provides a range of indicators for national and local policy makers to improve resilience in the face of livelihood vulnerability. By incorporating more major components and subcomponents, this study identifies more specific challenges of livelihood vulnerability for future policy directions. It is interesting to find that credit and cash used for crop inputs are critical financial constraints for farmers. From the estimated indicators, this study also provides some specific policy recommendations for the four study districts of Punjab Province. These results are helpful in identifying and highlighting vulnerability determinants and indicators. Initiating and promoting better adaptive capacity and starting resilience projects for households are urgent actions required by donors and governments to reduce the livelihood vulnerability of mixed crop–livestock households in arid and semiarid areas.
JEL:
Q12; Q54; Q561. Introduction
Climate change has exerted an adverse impact on mixed crop–livestock production systems and has become a global challenge, increasing the vulnerability of people who are involved in these systems. The intensity of heat waves has increased since 1950 [1], and will become more devastating in the coming decades [2,3,4,5]. Estimates show that approximately 341 climate-related disasters worldwide were recorded each year from 2000 to 2015—an increase of 50% from the previous 15 years’ records—and badly affected people’s livelihoods, particularly in the agriculture sector [6]. Mostly, developing countries are under the threat of erratic climate changes, which result in natural disasters including floods, droughts, and heavy rainfalls, with negative impacts on their livelihoods, leading to environmental vulnerability for farmers. Given its production characteristics, the agriculture sector is the most vulnerable and sensitive to climate change [7,8,9]. This is even worse in developing countries, particularly poor and agrarian communities, where people’s livelihoods depend upon mixed crop–livestock production [10,11]. This is mainly due to the limited adaptation measures in production resources [8,12,13,14,15,16]. As a result, climate change poses more serious challenges to local economic, social, and ecological systems [17,18].
However, the mixed crop–livestock production system is one of the major sources of livelihood, increasing income and providing food security for the poor. For example, it provides 75% of milk, 60% of meat, and 41–86% of staple food crops in the world [10]. Both crops and animals are vulnerable to climate change in terms of cultivation, production, health, water availability, fodder production, productivity, pests, and diseases [3,19]. The adverse impact of climate change has never been overestimated in the mixed crop–livestock production system. The global yields of staple food crops will be reduced given an increase of 1 °C in temperature, such as wheat by 6%, maize by 7.4%, rice by 3.2%, and soybean by 3.1% [20]. Meanwhile, high temperature can cause numerous crop diseases, including pests, insects, weeds, and many others [21]. At the same time, most animal species will become uncomfortable when the temperature does not change between 10 and 30 °C; in fact, if the temperature increases by 1 °C, animals may reduce food intake by 3–5% [22] and this will cause parasites or pathogens to shift to multiple diseases and affect the animal population [23,24].
Pakistan is heavily dependent on agricultural production, and therefore highly sensitive to agricultural livelihoods. Agriculture in Pakistan provides 45% of employment and contributes 21% to gross domestic product (GDP) [25,26]. Meanwhile, the livestock sector contributes 56% of value added to agriculture and 11.9% to GDP [27,28], provides 3.1% in foreign exchange to total exports, and is a source of income for 35–40% of the population, providing food security for over 8 million rural families [29]. The country is highly vulnerable to climate change [30,31,32,33] and was ranked the 29th most vulnerable country in the world in 2009–2010 and 16th in 2010–2011 [34], and the 12th most highly exposed to climate variability [32,35]. The severe droughts of 1999–2012, consecutive floods from 2010 onwards, and pests and diseases increased the vulnerability for livelihoods in Pakistan [36,37,38]. As a result, one-quarter of the cultivation area in Pakistan is affected by waterlogging, salinity, water erosion, winds, and heat waves [39,40,41].
Previous studies in Pakistan also showed that a 1 °C increase in temperature reduced the yields of wheat by 5–7% in semiarid and 6–9% in sub-humid regions [42]. The future consequences seem terrible for the rice yield in Pakistan; if the temperature rises continuously, it could decline by 15% from 2012 to 2039, by 25% from 2040 to 2069, and by 36% from 2070 to 2099 [43]. This affects the agriculture sector adversely in terms of achieving and maintaining growth (0.85%) due to water shortages, making the livelihood of farmers more vulnerable and shrinking cultivated areas for the next crop season [29]. The adverse impact depends upon the capacity to adapt to these risks [44]. Pakistan is among the countries with less adaptive capacity due to limited resources and a high level of poverty [25,45,46]. In mixed crop–livestock production systems, it is difficult for farmers to undertake sustainability in the rearing of animals and planting of crops in erratic climate conditions without adaptive measures [47,48].
Studies on the vulnerability of the mixed crop–livestock system are rare in developing countries [19]. Climate change impact research is limited in Pakistan despite its being more vulnerable [49]. Nevertheless, most scholars have focused on individual crop yields affected by climate change [35,50,51,52], and risk adaptation and mitigation [25,53,54,55,56]. Few studies have measured the livelihood vulnerability of households in Pakistan [57,58], and none have considered the livelihood vulnerability of mixed crop–livestock production systems. To our knowledge, there is no other study except for a recent one by Panthi [59] in Nepal using the livelihood vulnerability index (LVI) and Intergovernmental Panel on Climate Change LVI (LVIIPCC), but it lacked relevant major components and subcomponents. For example, Panthi [59] did not include some key major components and did not discuss some important subcomponents, such as assets and capital in farming, land ownership, investment, knowledge and skills, finance and income, housing, and infrastructure [60,61,62]. Therefore, to fill this gap, we take into account more major components and subcomponents to measure, compare, interpret, and construct livelihood vulnerability for mixed crop–livestock households in semiarid regions with deeper insight into policy frontiers. Furthermore, in-depth investigation into these major components and subcomponents can identify the determinants of livelihood vulnerability at the district level for future planning and development with practical tools to understand relevant factors that contribute to improving resilience.
2. Literature Review
Vulnerability to climate variability is defined and used in various aspects such as food security and poverty in different communities as well as natural hazards and climate change in different ways [3,63,64,65]. These studies define vulnerability in the context in which biological, societal, and geophysical systems are at risk for or prone to climate vulnerability and survive under the adverse effects of climate change and variability. IPCC [66] proposed a pragmatic approach to measure the components and intensity of livelihood vulnerability at the community level, while Fussel [67] proposed three ways to understand vulnerability: (i) socioeconomic dynamics to respond to any shock, (ii) risk vulnerability that consider risk of exposure to particular hazards, and (iii) an integrated approach that combines the two. These approaches are the same as those of Turner et al. [68], who used three models: risk hazard, pressure and release, and expanded model of vulnerability. Therefore, to explore climate-related vulnerability, the frameworks of Fussel (2007) and Turner et al. [68] consider the synergies between biophysical and human systems (also see Appendix A).
Various assessment frameworks have been used to identify and measure vulnerability in recent decades. Preston et al. [69], after reviewing 45 vulnerability studies, stated that a lack of consensus on an appropriate framework leads to methodologies being chosen based on ease of use rather than the effectiveness of the approach. They found that the vulnerability assessment objective leads to the effectiveness of the framework used. Vulnerability studies agree that sensitivity to damage, exposure to risks, and adaptive capacity are prime factors in measuring vulnerability [61,66,70,71,72]. On the other hand, to measure sustainable livelihoods, an indicator-based approach has also been used for vulnerability assessment [71].
According to Ford and Smit [73] and Deressa et al. [74], vulnerability assessment is the first step in adapting to and reducing the risk of climate change with planning programs and policies [75,76,77]. Previous studies regarding vulnerability had “single outcome or single stress,” concentrating on the physical impact of disasters and their adverse effects [78]. Subsequently, researchers and scholars argued that the assessment of vulnerability must test the interaction and integration between humans and their economic and political environments and social and physical surroundings [5,79]. However, human activities based on ethnic characteristics, gender, and age are equally significant [80,81,82]. Finally, to estimate climate change impacts and assess vulnerability, one approach is to appropriately take into account measuring susceptibility, exposure, the resilience of households, and socioeconomic conditions [2,83]. However, there is no agreement on a vulnerability estimation approach, but most assessments show one or more forms of exposure to vulnerability, to risk, and to resilience [78,84]. Therefore, resilience and adaptation measures could not be made better and more effective in coping with natural disasters without identifying and assessing vulnerability to socioeconomic reality [79].
Vulnerability is dependent on variations in sensitivity, adaptive capacity, and exposure [64,85]. For instance, semiarid regions are most exposed to droughts, while coastal communities are most exposed to cyclones and rising sea level. Sensitivity is the extent to which a body is either adversely or beneficially, directly or indirectly, affected by climate change. Climate change exposure is location specific. For example, communities in semiarid areas may be most exposed to droughts, while coastal communities will have a higher exposure to sea level rise and cyclones [85]. As per the conceptual framework, vulnerability cannot be simply defined by either a static or singular indicator term, but it should be a combination of various factors to measure its level in a particular framework.
Hahn et al. [61] introduced an approach to assess livelihood vulnerability with two alternate measures: the LVI and the LVIIPCC. The index calculation was simplified by using primary data of households complemented with secondary data of climate variability such as rain and temperature. They categorized indices under exposure (climate variability, early warnings, and monetary loss due to climate events and natural disasters), sensitivity (health, water, food), and adaptive capacity (livelihood strategies, social networks, socio-demographic factors), used to construct indicators of vulnerability. Such an index-based approach established precedence over other frameworks because it is dependent on secondary data and better planned to provide a local perspective, with a context-based vision for local needs and adaptation response. Therefore, many scholars and researchers followed this approach using different contexts of natural hazards [47,57,58,59,72,86,87,88,89,90,91,92]. Studies that are based on primary or secondary data or both provide better vision and a platform to identify and determine the drivers of vulnerability by considering vulnerability as a socially constructed subject [93]. This study also uses household and climate data (temperature and precipitation, 2001–2010) to measure the livelihood vulnerability level through the livelihood vulnerability index (LVI), Intergovernmental Panel on Climate Change LVI (LVIIPCC) [61], and livelihood effect index (LEI) [94,95,96,97,98].
3. Method and Data
3.1. Methods
Measurements were performed under 3 types of sets: (i) calculation of livelihood vulnerability index (LVI) through balanced weight average, (ii) estimation of LVI based on the Intergovernmental Panel on Climate Change [3], and (iii) calculation of livelihood effect index (LEI).
Hahn et al. [61] and Shah et al. [72] developed a methodology to measure the level of vulnerability caused by climate change and variability and also suggested replication for future studies. Thus, we modified and added 6 more major components (housing, land and livestock, natural resources, finance and income, knowledge and skills, and infrastructure) to better understand the sensitivity and vulnerability of households. We took into account 13 major components (socio-demographic, livelihood strategy, health, social networks, food, water, natural disasters and climate variability, housing, land and livestock, knowledge and skills, natural resources, finance and income, and physical infrastructure) and 79 subcomponents (see Appendix B). The combinations of the 13 major components with various subcomponents have equivalent influence in overall calculations [99].
3.1.1. LVI Indicator
We assigned equal weights to all major components to measure LVI [61]. Then, the subcomponents were calculated on a different scale to standardize their comparability and the mathematical values by using the Human Development Index [100] as follows:
where is a subcomponent of district , and and are maximum and minimum values, reflecting high and low vulnerability respectively. This applies to each subcomponent of all 4 districts. For instance, the average distance to travel for access to a source of water subcomponent ranged from 0 to 4 km in 4 districts. The minimum (Smin = 0) and maximum (Smax = 4) values were used to transform this index Sd into a standardized index for the water component of the LVI (maximum and minimum values are actual data, which are not shown in Appendix C; the same for frequencies, average livestock diversity, crop diversity, etc.). For the variable that measures frequency, for example, percent of reported households with orphans, the maximum value was set as 100% and minimum as 0, whereas the subcomponent average livestock diversity index was set as the inverse of the crude indicator by assuming that household vulnerability decreases with increased number of livestock species. We created an index by taking the inverse and allocated greater vulnerability to households with fewer livestock species. We expressed the livestock diversity index by using the formula [1/(number of livestock species + 1)]. Following this logic, minimum and maximum values in Equation (1) were transformed to standardize other subcomponents.
Then, we created an index to estimate the vulnerability of each major component by averaging the standardized subcomponents:
where is each of the 13 major components for district , shows the subcomponents for making up each major component, and is the number of subcomponents under each major component. After calculating the vulnerability value of all major components from each district, they were averaged by using Equation (3) to calculate the LVI at the district level:
where represents the livelihood vulnerability index for district , which is equal to the average weight of all 13 major components, and is the weight of each major component, and is estimated from the sum of all subcomponents that contain each major component and contributes equally to the overall livelihood vulnerability index [99].
We defined the following: socio-demographic (SD), livelihood strategy (L), health (H), social networks (SN), food (F), water (W), natural disasters and climate variability (NDCV), housing (H), land (L), knowledge and skills (KS), natural resources (NR), finance and income (FI), and physical infrastructure (PI). Equation (3) can be specified in detail as:
where the LVI values range from 0 (least vulnerable) to 0.5 (most vulnerable). A comprehensive example for LVI estimation of major component health for Bhakkar (BHK) district is illustrated in Appendix D.
3.1.2. LVIIPCC Indicator
We used an alternative approach to calculate LVI based on the IPCC tools of adaptive capacity, sensitivity, and exposure [61,72]. Adaptive capacity is framed under socio-demographic, livelihood strategy, social network, knowledge and skills, finance and income, natural resources, and infrastructure. Natural disaster and climate variability are framed under exposure, and health, land and livestock, food, water, and housing are framed under sensitivity (Table 1). Exposure in this study includes a number of natural disasters events in the last 5 years. Climate variability is measured by the average number of hot months with an average temperature above 30 °C and standard deviation of monthly precipitation and maximum monthly temperature over the period 2001–2010. Equations (1)–(3) are used to estimate LVIIPCC. Then Equation (5) integrates the major components into LVIIPCC contributing factors:
where is contributing factors of adaptive capacity, sensitivity, and exposure for district , is major components for district , indexed by , is the weight of each major component, and is the number of major components in each contributing factor. Then, we estimated adaptive capacity, sensitivity, and exposure by combining the contributing factors using the following equation:
where is the for district defined by the IPCC vulnerability approach and , , and are the estimated contributing factors of exposure, adaptive capacity, and sensitivity for district , respectively. Then, we ranked from −1 (least vulnerable) to 1 (most vulnerable). Appendix E provides a comprehensive example of LVIIPCC estimation for BHK district.
3.1.3. LEI Indicator
The LEI was constructed to identify the livelihood vulnerability of households with different types of capital or assets (human, natural, financial, social, and physical) following the sustainable livelihood approach. Based on this capital, we grouped the 13 major components in to 5 types of livelihood capital for LEI estimation (see Appendix B). We used Equations (1)–(3) to calculate the weighted average of all major components that make up above livelihood capital. Then these weighted averages were used in Equation (7) to estimate the vulnerability value of each type of livelihood capital or asset:
where is the vulnerability index for 5 types of livelihood capital, equivalent to the weighted average of major components that make up livelihood capital, and is the weight of each major component, and is computed by the number of subcomponents in each major component. We scaled the LEI from 0 (least vulnerable) to 1 (most vulnerable).
3.2. Study Area
Punjab is the most populated province (both people and animals) in Pakistan [29]. The geographic position of Punjab is approximately 70,000° E and 30,000° N in the semiarid l zone [101]. The province plays an important role in the country’s economy due to fertile agricultural land with extensive irrigation networks. Punjab accounts for 56% of the agricultural land area, contributing 57% to overall agricultural GDP and approximately 74% to cereal production in the country [29,102]. Over 1970–2001, the annual mean minimum temperature of the province ranged from 16.3 to 18.2 °C and annual mean maximum temperature ranged from 29.3 to 31.2 °C. Rainfall in Punjab is linked with monsoon winds, and the province receives 50–75% of annual rainfall during the monsoon season [25].
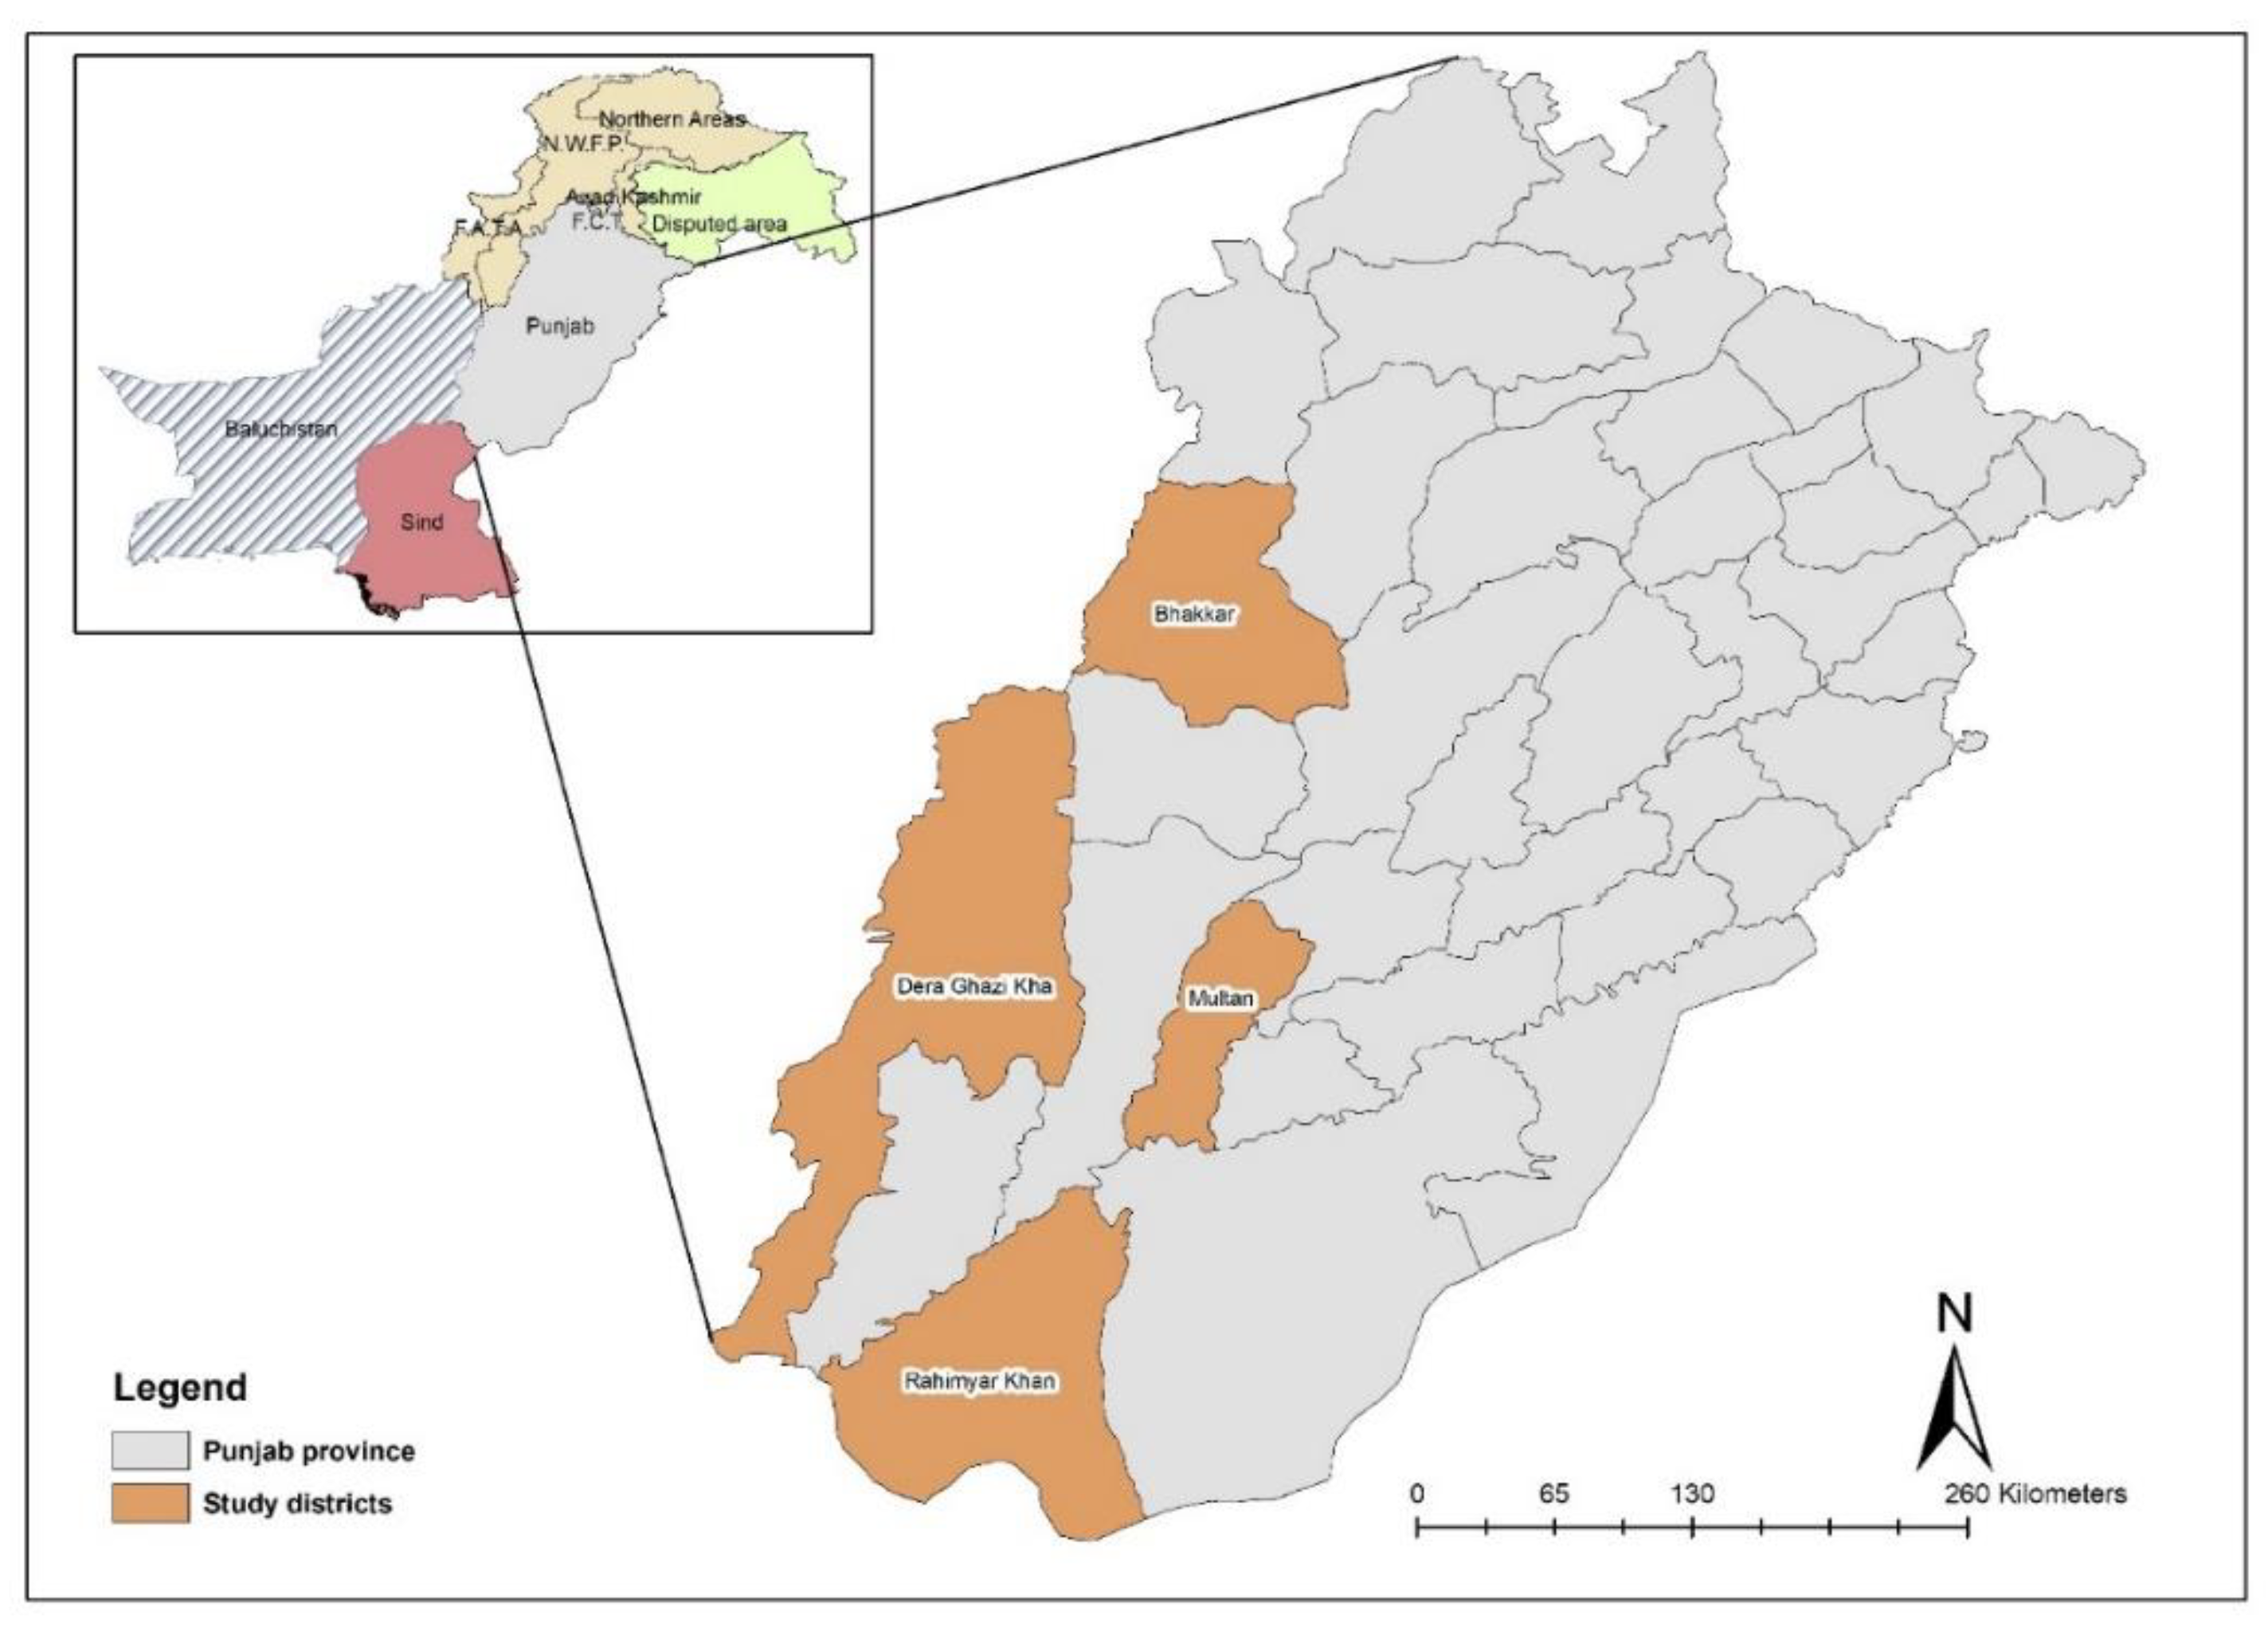
The main sources of local livelihoods are crop farming and animal raising, but they are underdeveloped due to traditional farming practices in remote areas, low labor quality, and lack of income-generating opportunities. Approximately 67.5% of the people of Pakistan reside in rural areas and are involved directly or indirectly in agriculture. Punjab is the most populated province, accounting for 56% of the total population. The province consists of northern and southern Punjab. The northern area has better developed infrastructure and agricultural techniques than southern Punjab, while the southern area is the poorest region due to large household sizes, higher dependency and lower literacy rate, unemployment, poor infrastructure, and lack of access to markets, especially in remote areas [103]. Approximately 36% of the rural population is poor, and most of the poorest are found in southern Punjab [104,105]. Previous studies stated that farmers in southern Punjab had observed changes in weather patterns and experienced extreme temperatures and delayed precipitation during summer monsoons [25,58,106]. Therefore, this study focuses on the 4 districts of southern Punjab, where the majority of households raise livestock combined with subsistence crop production in the mixed crop–livestock production area (see Figure 1).
Rahim Yar Khan (RYK) district covers an area of 11,880 km2, including plain and very fertile land distributed among 3 types of areas: riverine, canal irrigated, and the Cholistan Desert. The Indus River flows from the northwest side of the district and is flooded every year. The climate of the district is dry and hot with temperature reaching 49 °C and average annual rainfall of 165 mm [25]. The major crops grown in the district are wheat, cotton, rice, and sugarcane. Total livestock (buffaloes, cattle, sheep, and goats) total 4.8 million in the district [107].
Multan (MLT) district spreads over an area of 3720 km2, covering plain and very fertile land. This district is very close to the Chanab River and is mostly flooded due to heavy monsoon rains. Multan has an extreme climate with maximum temperature up to 49 °C and average annual rainfall of 127 mm [108]. Wheat, cotton, rice, and sugarcane are major crops in this district. Total livestock (buffaloes, cattle, sheep, and goats) number 3.9 million in this district [108].
Bhakkar (BHK) district covers an area of 8153 km2, including plains and desert. The western side of the district boundary touches the Indus River. Summer temperature has been recorded up to 50 °C. The main sources of livelihood are major crops such as moong, bajra, cotton, gram, sugarcane, and wheat, with total livestock (buffaloes, cattle, sheep, and goats) numbering 2.1 million in the district [109].
Dera Ghazi Khan (DGK) district includes an area of 11,922 km2, embracing plain and mountains. It is located in a strip between the Suleman Mountains and the Indus River and is washed out by floods and hill torrents every year. It has an almost uniform climate except in the hilly portions. The major crops grown in the district are wheat, cotton, rice, and sugarcane. Total livestock raised (buffaloes, cattle, sheep, and goats) number 1.8 million in this district [110].
3.3. Data Source
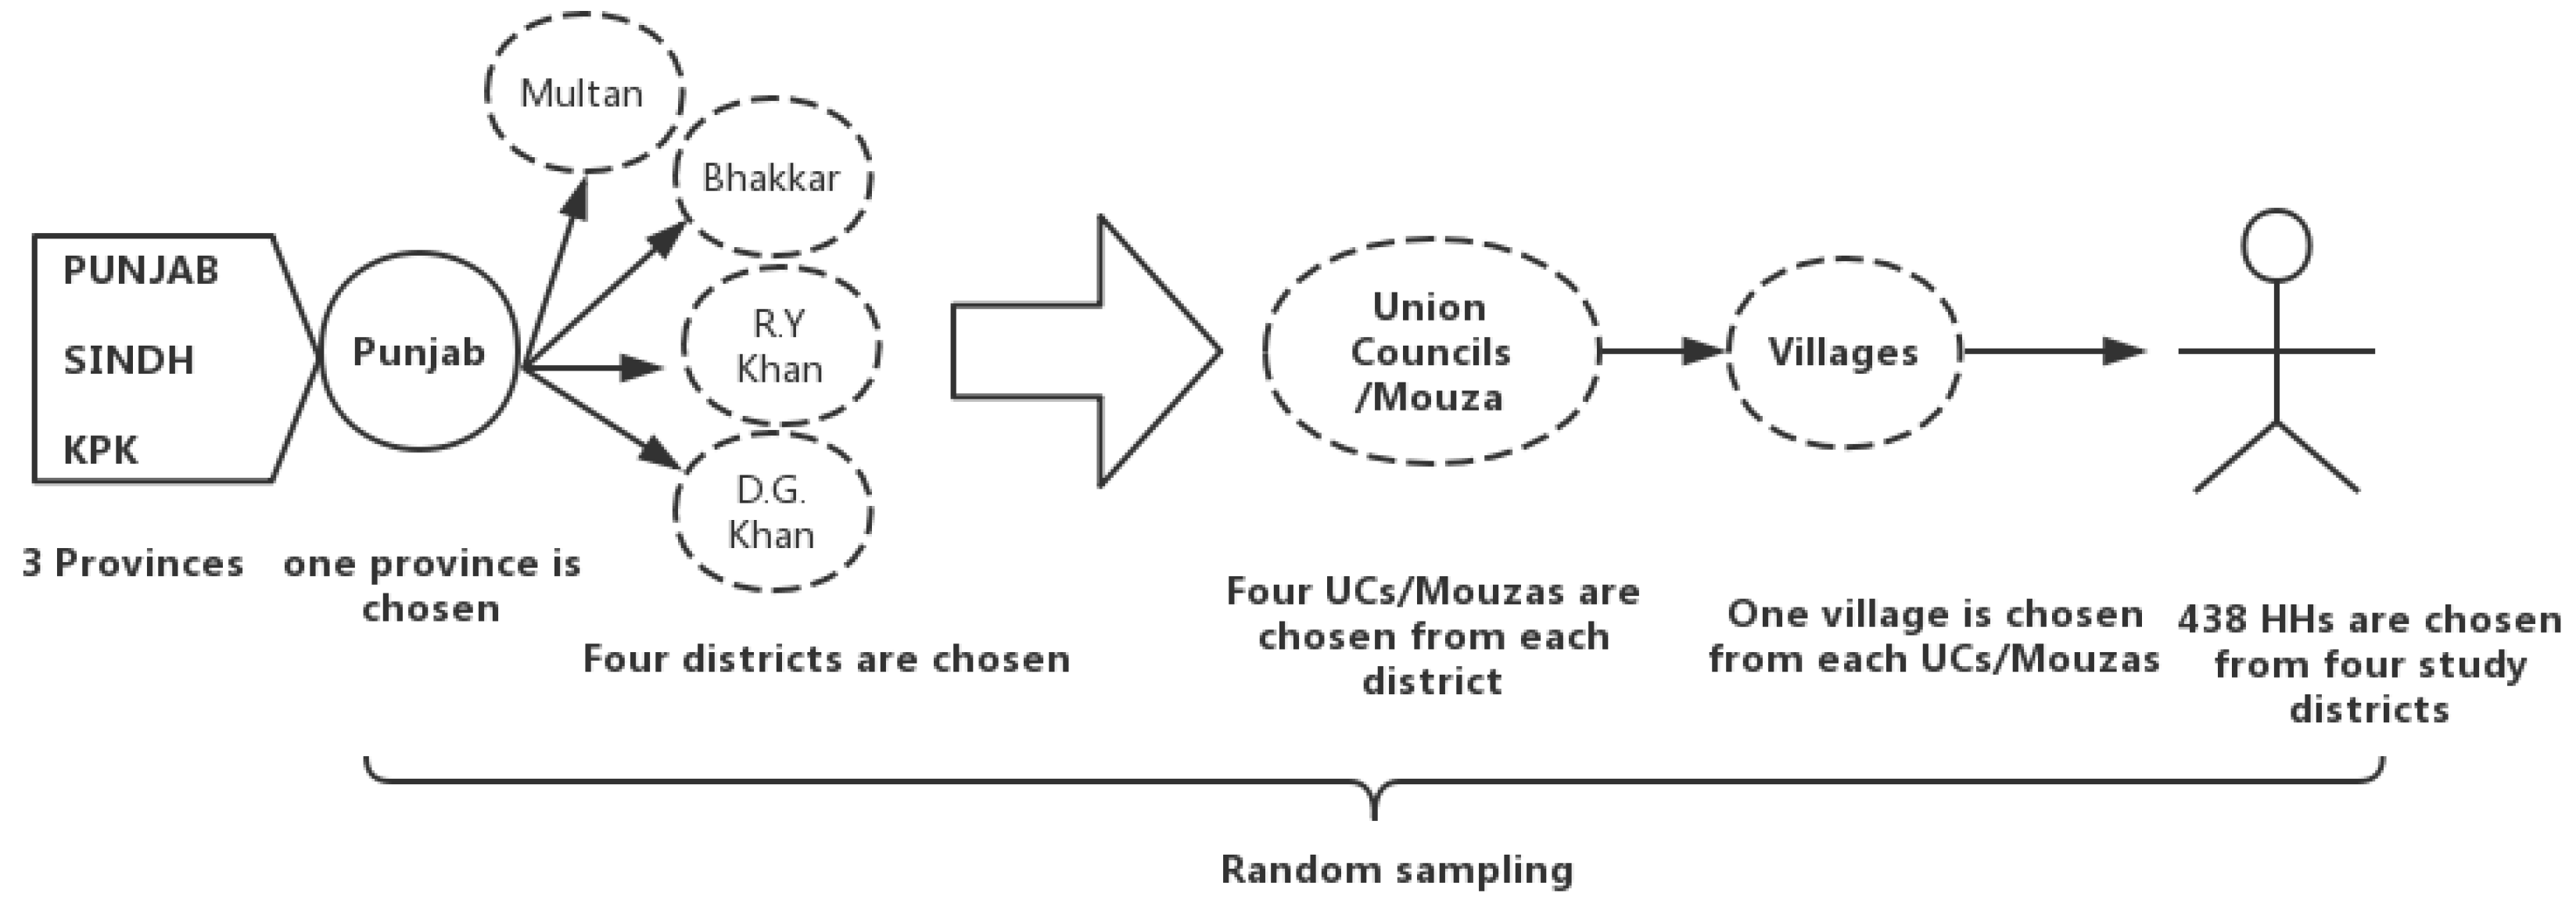
The data used in this study were taken from the Pakistan Rural Household Survey (PRHS-2012). The survey was conducted in rural areas of Pakistan, covering 3 provinces, Punjab, Sindh, and Khyber Pakhtunkhawa. Then, we selected Punjab and 4 districts, Bhakkar, Dera Ghazi Khan, Rahim Yar Khan, and Multan, by random sampling with a total of 438 households engaging in mixed crop–livestock farming (Table 2, Figure 2). We gathered detailed information about major components and subcomponents (see Appendix B). Furthermore, we added secondary data on climate change such as maximum daily temperature and precipitation over the period 2001–2010 from the Pakistan Metrological Department (PMD).
4. Results and Discussion
4.1. Results
According to the findings, BHK and MLT were the most vulnerable, followed by RYK and DGK according to all three livelihood vulnerability approaches. On the other hand, RYK and DGK were the most vulnerable in the most important and sensitive subcomponents of water and health components. The spider diagram of vulnerability in Figure 3 shows LVI values for all 13 major components, which are estimated from 79 subcomponents (see Appendix C for subcomponent results) and scaled from 0 (least vulnerable) to 0.900 (most vulnerable). Table 3 illustrates index values of all subcomponents and LVI results of major components. Overall, the LVI results indicate that BHK (0.378) and MLT (0.376) have more vulnerability than DGK (0.364) and RYK (0.363). BHK is more vulnerable in livelihood strategy (0.373), land and livestock (0.337), natural resources (0.551), and food (0.523); DGK is more vulnerable in housing (0.442), knowledge and skills (0.839), and infrastructure (0.576); MLT is more vulnerable in finance and income (0.612), water (0.516), and social networks (0.360); and RYK is more vulnerable in health (0.322), natural disasters and climate variability (0.463), and socio-demographic (0.244) (Table 3 and Figure 3).
Table 4 and Figure 4 show LVIIPCC indicator results of sensitivity, exposure, and adaptive capacity that enable mixed crop–livestock households to cope with climate change. The LVIIPCC scores range from −1 (least vulnerable) to 1 (most vulnerable). Overall, results indicate that BHK has the highest livelihood vulnerability index (0.028), followed by DGK (0.001), RYK (−0.021), and MLT (−0.013) districts. BHK also shows the highest level of sensitivity (0.369) and exposure (0.464) with less adaptive capacity (0.388), after DGK (0.378) and RYK (0.375).
4.2. Discussion
BHK and MLT districts are found to be the most vulnerable, followed by RYK and DGK, in all three livelihood vulnerability approaches. Furthermore, BHK households (HHs) tend to specialize in a singular livelihood (e.g., mixed crop–livestock production), usually the one that has the most income potential and/or relies on the available natural resources of the area. In fact, they are also more vulnerable to climate changes, which have a negative impact on their livelihood. However, BHK HHs are more sensitive and lack climate change adaptive measures (Table 3, Figure 3), due to lower education levels and inappropriate local government efforts and attention to this issue. The results also show that more than 89% of households in BHK district reported that they were not satisfied with current efforts by the local government to share knowledge of climate change adaptation and livelihood measures, and approximately 98% of households were not familiar with technical training programs regarding their livelihood vulnerability (Appendix C, M51).
Food safety increases households’ flexibility to external stress in the face of severe climate events [111], and this makes BHK HHs more vulnerable in the food component (0.523) (Table 3) compared with other districts. The reason is that BHK is more dependent on natural resources and more sensitive to climate change; 78% of HHs there are limited to mixed crop–livestock production as major source of livelihood, while only 22% are involved in off-farm employment (Appendix C, M91). Furthermore, fewer livelihood strategies and vulnerability in terms of human capital (0.501) (Table 5, Figure 5) lead to food insecurity in BHK. Following these results, policy makers, governments, and donors should take urgent steps toward economic transformation of BHK to decrease food insecurity in the future, with a focus on helping farmers transition from monoculture (crops and livestock) to economic diversification, such as growing more crops and raising more species of livestock, with more off-farm employment opportunities. This is because households in this district have less crop diversification (0.342) and fewer animal species (0.227) (Appendix C, M93, M94) than other districts.
In contrast, MLT HHs are more dependent on off-farm work as a major source of livelihood and are less active in mixed crop–livestock production. We found that the effect of the head of the household really matters here, because 19% of heads of households are women in MLT (Appendix C, M32), which is more than in the other three districts. Male heads of households bring authority and greater control over household resources, including family labor, whereas, women heads of households are linked with certain disadvantages, particularly in a country like Pakistan, due to cultural norms. It is not easy to for women without adult male support to manage farming activities alone, particularly when adult men work in non-farm sectors during peak agricultural seasons. Therefore, when men are not available to head households and work outside the community, gender issues could pose greater institutional difficulties and compound the constraints on women during farming activities. Our results also show that women are less involved in performing agricultural activities, especially in Multan district; therefore, MLT is found to be more vulnerable in terms of social network, which makes it more vulnerable in terms of climate change adaptation, social capital, natural capital, and finance and income due to women’s role as head of household (Table 5, Figure 5). In fact, 71% of household members work in communities far from their homes (Appendix C, M91). In this case, mostly male household heads travel for work and return home after several months, and the control of the household shifts to women. In fact, women do not have access to sources of communication media such as social networking, which results in vulnerability in social networks and livelihood [112]. Social networking is a good asset (e.g., innovations, dreams, good relations, and shared values with financial exchange), which makes a stronger information network for farmers to communicate, and in particular to deal with unpleasant and emergency events [113,114,115,116]. This finding suggests that in a country like Pakistan, where women are less active in farming activities, they should be supported by the community through female activism, such as farmers’ cooperatives sharing information, and exchanging help and goods and technical support, to help farmers better understand emerging and current issues and develop better strategies and planning [117]. Women do not have authority and do not participate in social network programs in rural Pakistan due to cultural norms. In a nutshell, as MLT is more vulnerable in social networks, water, and finance and income components, we can conclude that female headship is the main reason in this district, because men are considered to play the main role in all three components in rural Pakistan due to cultural norms. To reduce the vulnerability, women should be given priority with regard to participating in farm and non-farm activities. For this purpose, local governments must create opportunities for women to access well-paid work in villages, such as supporting women-owned cottage industries, by providing training and access to credit and markets. In addition, women should be formally integrated into the value chain and efforts must be made to reduce the wage gap between men and women.
A lack of basic facilities such as health care, shelter, and clean water are noticed in RYK and MLT, which need urgent attention by policy makers to reduce this vulnerability in a timely manner. The results show that health facilities for both animals and people are located at long distances in terms of access. Because of the long distance, most poor households are not aware of their health care due to financial constraints and start treatment on their own without doctors’ prescriptions when they are sick. Particularly, it is very difficult when women are pregnant and give birth on their way to the hospital before even checking in. This is an emerging issue that should be reviewed with regard to how to fix it and make sure basic health facilities are available in existing health units. Local governments should communicate with and mobilize farmers so that they do not use backward practices to treat diseases and strengthen the village health care system. For this purpose, governments should provide mobile health facilities in remote areas and announce their schedules.
The other factor is the absence of clean drinking water sources in all study areas, which makes most people vulnerable in terms of health. More important, households in RYK (16%) and DGK (5%) are drinking from natural sources (river, canals, ponds, and rain), which makes most of them vulnerable in terms of health (Appendix C, M6). On the other hand, water plants or hand pumps should be installed in MLT communities in order to reduce this vulnerability by reducing the need to travel to fetch water outside the community, so that in the absence of adult men in households, women can fetch water themselves. On the other hand, for canal water availability, the irrigation department should check about allocated times per acre to overcome the water theft issue through farmers’ cooperatives and make sure water is fully allocated to distributary canals to reduce the vulnerability. In a nutshell, the development of infrastructure can remove this vulnerability, particularly in remote areas, which have fewer facilities for health care and clean drinking water. This needs serious attention by policy makers and donor organizations to start clean water projects and make sure there is access to clean water, particularly in DGK and RYK.
Overall, the education and knowledge levels of heads of household are very low in all study districts (Appendix C, M5). Hence, a lack of education could lead to fewer income opportunities and livelihood diversification strategies, which leads to vulnerability. As farmers are adults and it is impossible for them to go to school, as children do, local governments should be involved in training farmers in formal and informal ways. It could be possible to disseminate information about livelihood diversification to improve income by arranging skits, plays, floating activities, theaters, and corner meetings at the household level to help support livelihood resources. In fact, as the farming experience of less educated farmers increases, they become more conservative and do not adopt new farming practices. These farmers should be aware of new farming technologies with updated knowledge and climate-relevant information, with the active involvement of public and private advisory services. However, better education can help farmers to improve their ability to deal with hardship and find possible solutions under environmental vulnerability [47,59,61,118]. Rural household livelihood options indicate that the role of education and productivity in diversifying livelihood income into off-farm and non-farm activities to cope with the diverse challenges and risks of climate change can improve their livelihood in a sustainable manner by adopting higher return and sustainable livelihood strategies [119,120]. BHK and DGK HHs have a narrow perspective on the knowledge of livelihood skills and diversification (Table 3, Figure 3), with less opportunity to improve their living conditions, such as by adopting new agricultural techniques. These results are consistent with [121,122,123,124]. It is essential to share knowledge and information with farmers to cope with climatic stressors, which could be helpful in protecting their livelihood from natural disasters [25,125]. This suggests that immediate action should provide farmers with livelihood means by arranging training and knowledge-sharing activities at the farm level to improve their adaptive capacity and reduce their vulnerability due to climate change. Governments should set pathways for modifying education policies, not only for school-age children but also for adults, as mentioned above. For instance, most farmers are illiterate and rely more on informal sources for agricultural advisory services than on public or private sources [126].
The tremendous impact of shocks and the mixed crop–livestock production system in erratic climatic change events have attracted attention from policy makers and academic researchers regarding how to sustain the livelihoods of these people. Agriculture is the most severely affected sector and the most vulnerable to such disasters and climate change [16,127,128,129], and Pakistan is listed among the countries that are extremely susceptible to climate change and natural disasters. Our results show BHK is the most vulnerable in terms of higher exposure (0.464) and sensitivity (0.369) due to climate change and natural disasters (Table 4, Figure 4, Appendix C, M9). These vulnerabilities and variations are consistent with previous studies concluding that southern Punjab is more vulnerable to climate change [58,106]. Erratic climatic change and natural disasters such as floods, droughts, and heavy rainfalls badly affect people’s livelihoods and increase their vulnerability. In particular, people in areas that are affected by erratic climate change and disasters need help so that that they can be rescued from falling into poverty traps, because they generally lack alternative income sources [128]. If they do not recover well, small farms in particular become more vulnerable [25,45,46], and further, they can be closed down. For example, Ahmad and Ma [130] empirically found that small farms were ignored during restoration of livelihoods by agricultural assistance (seeds and fertilizers) after super flood disasters in Pakistan in 2010, and as a result, they closed down their farms and changed their occupations in the very next season of farming. Therefore, it is very important to sustain those affected after they lose their shelter, crops, and livelihood sources to natural hazards [131,132], in order to reduce their livelihood vulnerability.
It is important to strengthen housing for low-income and poor households to improve their living conditions and build up their resilience to escape from poverty [13,59,133]. Therefore, it is suggested that governments should provide professional and technical assistance in term of housing construction, particularly in disaster-prone areas, and develop policies in cooperation with brick companies, particularly in DGK and RYK districts, as they are found to be more vulnerable to climate change in terms of maximum temperature and number of hot months (Appendix C, M7). On the other hand, governments and donors should introduce heat-resistant crop varieties and animal species, along with tree plantation and other relevant information. Agriculture and livestock insurance policies could also be initiated against heavy losses due to adverse climate events [81,134,135]. For farmers’ technical capacity building, governments should take the initiative regarding veterinary camps and periodic agricultural services to reduce the vulnerability of livestock and agriculture [88]. Livelihood diversification can improve income and is more effective in adapting to natural hazards and risks in the future [136,137,138,139]. Meanwhile, governments and donors should launch welfare projects to mobilize people to build welfare amenities, such as farmers with larger farms renting out their lands to landless farmers under low-payment contracts, particularly in MLT district, where 79% of households are landless (Appendix C, M111). In addition, providing high-output animal breeds to farmers could be a good initiative, because less educated farmers follow their neighbors and believe blindly when neighbors have practical experience of things.
Finance and income vulnerability occur due to less income diversification and a lack of education and knowledge. However, our results suggest that another factor contributing to financial constraints is crop inputs used on credit from dealers or money lenders. For example, farmers who use crop inputs on credit have a heavy markup imposed and are bound to sell their crops to input dealers or lenders at lower than market price. Consequently, sometimes if the crop is not good and the farmer cannot pay the loan on time, the loan goes for the next crop season or year with a heavy markup imposed. In MLT (32%) and RYK (20%), farmers have to pay previous crops’ input loans if they did not pay due to crop losses or low output, and have a markup imposed until they pay the loans (Appendix C, M131). Therefore, financial loan institutions can target these areas of vulnerability and provide loans with low markup to start small business and promote agricultural activities. Usually, agricultural loans are provided to agricultural landowners only, and livestock keepers are not considered for loan schemes. Thus, policy makers should develop loan policy schemes for livestock keepers so that they can diversify their livelihood and income by raising more species of animals to reduce their livelihood vulnerability.
Financial, human, natural, and physical capital have more impact on the livelihoods of mixed crop–livestock households, and these types of capital increase livelihood vulnerability [140]. Social capital shows less vulnerability in all districts despite comprising major socio-demographic and social network components (Table 5, Figure 5). The reason may be a qualitative estimation of LEI values, which indicates whether individual factors affect someone but without measuring the effect [57,92,98,141,142,143].
5. Conclusions and Implications
By employing the LVI, LVIIPCC, and LEI, this study evaluated livelihood vulnerability in southern Punjab, Pakistan, using major components and subcomponents. Therefore, this study provides a range of different indicators for national and local policy makers to more accurately target ways to improve resilience in the face of livelihood vulnerability due to climate change. In addition, this research framework can be used in other countries and sectors in arid and semiarid areas. Moreover, this work proposes additional components that help in the determination of livelihood vulnerability for mixed crop–livestock households, an element of fundamental importance in semiarid regions.
The LVI approach can provide a benchmark for policy makers to evaluate livelihood vulnerability from different aspects and develop policy measures at both the macro and micro level to help allocate resources for adaptation and mitigation in the most vulnerable regions. The LVI is a useful assessment tool for critical indicators by applying equal weight to all indicators and provides spatial comparisons across regions at the household level. In addition, focusing attention on and contributing further studies and applications of this methodology is fundamental at present, and this should be included in environmental protection plans and laws worldwide.
By incorporating more major components and subcomponents, this study identified more specific challenges of livelihood vulnerability for future policy directions. From the estimated indicators, these policy targets include clean water projects, farm advisory services, locating residences away from rivers (particularly in flood-prone areas), and crop production inputs. More importantly, this study also found that the credit and cash mostly used for crop inputs are critical financial constraints for farmers, which force them to sell their crops to input dealers or lenders at lower than market price. Therefore, financial constraints should be used to identify livelihood vulnerability more precisely.
Regarding the four study districts, this study provides the following specific policy recommendations. First, in BHK, the priority is to diversify livelihoods and transform the economy from monoculture of crops and livestock and to provide more off-farm employment opportunities. Second, MLT needs to promote agricultural activities, with better access to social networks through community practices and cooperatives to obtain more professional support, and to install water plants or boreholes in communities. Third, RYK needs to initiate clean water projects, particularly in natural water utilization areas (river, ponds, canals, and rain); provide better health care services and provide mobile health unit facilities for HHs; introduce heat-resistance crop varieties and animal species; and initiate better tree plantation to cope with climate variability. Fourth, DGK requires professional and technical assistance in the construction of climate-resilient houses.
This study has scope for future research in livelihood transition and trade-offs between crops and livestock. As the cultivated land area is shrinking annually due to climate change and water shortages, cereal crop production has been severely affected in countries like Pakistan. Therefore, the livestock sector may be expected to see faster growth than crops in the coming years. In addition, it would be interesting to conduct a review to compare the methods, measurements, and results of previous studies at the country or regional level.
Author Contributions
Conceptualization, Data curation, Formal analysis, Methodology, and Draft, M.I.A.; Writing review, Validation, Editing, Supervision, H.M. All authors have read and agreed to the published version of the manuscript.
Funding
This study was supported by State Social Science Funds of China (No: 14BGL093), International Development Research Center (No: 107093-001), the National Natural Science Foundation of China (No: 71403082).
Conflicts of Interest
The authors declare no conflict of interest.
Appendix A

Table A1.
Framework for Identifying Key Vulnerabilities.
| Authors, Year | Vulnerability Definitions |
|---|---|
| IPCC [144], 2012a | Vulnerability refers to characteristics of human or social-ecological systems exposed to hazardous climatic (droughts, floods, etc.) or non-climatic (increasing temperature, sea level rise) events and trends. |
| IPCC [144], 2012a | Vulnerability is dynamic and context specific, determined by human behavior and societal organization, and influences the susceptibility of people (e.g., by marginalization) and their ability to cope with and adapt to hazards. |
| IPCC [145], 2012c; Cardona et al. [146], 2012 | Consideration of multiple dimensions of social, economic, environmental, institutional, cultural, and different causal factors that lead to vulnerability, further enabling people to improve strategies to reduce risks to climate change. |
| Schneider et al. [147], 2007; Lavell et al. [148], 2012 | Vulnerability embodies a normative component because different societies might rank the various vulnerability and risk factors and actual or potential types of loss and damage differently. |
| UNISDR [149], 2011, 2013; Birkmann et al. [150], 2011a | Vulnerability merits particular attention when the survival of societies, communities, or ecosystems is threatened. |
| FAO [3], 2009; IPCC [64], 2007b | Vulnerability is dependent on variations of sensitivity, adaptive capacity, and exposure. Exposure is distinct from vulnerability but is an important precondition for considering a specific type of vulnerability. |
| Leichenko and O’Brien [144], 2008; O’Brien et al. [151], 2008; IPCC [152], 2012a; Kienberger [153], 2012 | Defining key vulnerabilities in the context of particular societal groups or ecosystem services also takes into account the conditions that make these population groups or ecosystems highly vulnerable, such as processes of social marginalization or the degradation of ecosystems. |
| IPCC [144], 2012a; Birkmann et al. [154], 2013a; Warner et al. [155], 2012 | Societies, communities, and social-ecological systems have a limited ability to cope with the adverse consequences of climate-related hazards and to build adaptive capacities to reduce or limit their effects. Coping and adaptive capacities are part of the formula that determines vulnerability. Severe limits of coping and adaptation provide criteria for defining vulnerability, as they are core factors that increase vulnerability to climatic hazards. |
| Renaud et al. [156], 2010 | Vulnerabilities are considered key when they are persistent and difficult to alter when susceptibility is high and coping and adaptive capacities are very low. For example, irreversible degradation of ecosystems (e.g., warm water coral reefs), chronic poverty and marginalization, and insecure land tenure arrangements are drivers of vulnerability in combination with climatic hazards. |
| Menkhaus [157], 2010; Rinaldi et al. [158], 2001; Wang et al. [159], 2012; Atzl and Keller [160], 2013; Copeland [161], 2005; Reed et al. [162], 2010 | Conditions that make societies highly susceptible to cumulative stressors in complex and multiple-interacting systems also lead to vulnerabilities; for example, conditions of social-ecological systems that are highly susceptible to the effects of additional climatic hazards. Also, the critical dependence of societies on highly interdependent infrastructures (e.g., energy/power supply, transport, and health care) leads to key vulnerabilities regarding multiple interacting systems where capacity to cope with or adapt to their failure is low. |
| Fussel [67], 2007 | There are three ways to understand vulnerability: (i) socioeconomic dynamics to respond any shock, (ii) risk vulnerability that consider risk experience of exposure to particular hazards, and (iii) an integrated approach that combines the two. |
| Turner et al. [68], 2003 | The three models of vulnerability are grouped into risk hazard, pressure and release, and expanded model considering the synergies between biophysical and human systems. |
| Ford and Smit [73], 2004; Deressa et al. [74], 2011 | Vulnerability assessment is the first step in adapting to and reducing the risk of climate change by planning programs and policies. |
Appendix B
Table A2.
Definition and Explanation of Major Components and Subcomponents of the Livelihood Vulnerability Index (LVI).
Table A2.
Definition and Explanation of Major Components and Subcomponents of the Livelihood Vulnerability Index (LVI).
| Vulnerability Measurements | Status in LVI | Unit | Functional Relationship |
|---|---|---|---|
| 1. Social capital | |||
| 1.1 Socio-demographic | Maintained | ||
| Dependency ratio (ratio of population under age 15 to above 65, between 16 and 64 years) | Maintained | Ratio | Higher dependency reflects more vulnerability and less adaptive capacity |
| Percentage of female-headed HHs if male head is away from home >6 months in a year (female = 1, 0 otherwise) | Maintained | Percent | Women typically have less adaptive capacity knowledge |
| Household family size | Maintained | Number | Large family size reflects more vulnerability |
| Percentage of HHs with orphans (children <18 years) (yes = 1, 0 otherwise) | Modified | Percent | More orphans indicate higher dependency and more vulnerability |
| Percentage of HHs that received visitors/guests in last 7 days (yes = 1, 0 otherwise) | New | Percent | More visits increase spending and show more vulnerability |
| Age of HH head (years) | Maintained | 1/year | Older age means vulnerability and less adaptive capacity, particularly when household is over the age of 60; the higher the age, the higher the vulnerability |
| Agricultural experience (years) | Maintained | Years | More experience increases coping strategies and reduces vulnerability |
| Percentage of HH heads who did not attend school (0 years of education) (yes = 1, 0 otherwise) | New | Percent | Education helps people be more aware about adjusting to environmental hazards |
| HH head education (years completed) | Maintained | Years | More education of HH head means diverse decisions and more adaptive capacity |
| Percentage of HHs with family decision index (literate man >50 years dominant in decision making) (yes = 1, 0 otherwise) | New | Percent | Men with a high level of literacy who are older dominate in decision making |
| 1.2 Social networks | Maintained | ||
| Percentage of HHs that received cash aid in the past 12 months (private, government, NGOs, friends) (yes = 1, 0 otherwise) | Modified | Percent | Aid improves recovery and reduces vulnerability, which leads to better adaptive capacity |
| Percentage of HHs that had contact with local government office/officials for help in the past 12 months (yes = 1, 0 otherwise) | Modified | Percent | More contact with local officials for help will highlight issues of particular areas; this increases sharing knowledge of coping strategies and strengthens adaptive capacity, with less vulnerability |
| Percentage of HHs that borrowed or lent money (yes = 1, 0 otherwise) | Maintained | Percent | High borrowing indicates financial stress and less adaptive capacity |
| Percentage of HHs that contacted community leader for help in the past 12 months (yes = 1, 0 otherwise) | New | Percent | More contact with community leaders leads to influencing individuals to deal with different events |
| Percentage of HHs not members of any organizations (yes = 1, 0 otherwise) | New | Percent | Information sharing and group insurance indicate less vulnerability and increased adaptive capacity |
| Percentage of HHs that have no TV/radio/telephone at home (yes = 1, 0 otherwise) | Modified | Percent | Access to communication media means more awareness of natural hazards and preparation |
| Percentage of HHs that have easy access to community cooperative leader, political and government officials (yes = 1, 0 otherwise) | New | Percent | Physical support and information sharing and experience increase adaptive capacity and reduce vulnerability |
| 2. Human capital | |||
| 2.1 Health | Modified | ||
| Percentage of HHs with members who have chronic diseases (yes = 1, 0 otherwise) | Maintained | Percent | Diseases make families more sensitive and vulnerable |
| Percentage of HH with members who missed work or school due to illness (yes = 1, 0 otherwise) | Maintained | Percent | Absence of and less participation in business hours automatically increase both vulnerability and sensitivity |
| Access to health facility (kilometers) | New | km | Longer distance means more vulnerability |
| Annual average expenses for health care (Rs) | New | Rupees | Higher cost means more vulnerability and sensitivity |
| Access to veterinary facility (kilometers) | New | km | Shorter distance means less vulnerability |
| 2.2 Food | Maintained | ||
| Percentage of HHs that do not save grain crops (yes = 1, 0 otherwise) | New | Percent | Higher level indicates higher sensitivity to disasters |
| Percentage of HHs that save crop seeds for next season (yes = 1, 0 otherwise) | New | Percent | Lower level means higher sensitivity to disasters |
| Percentage of HHs that use agriculture production for sale of products only (yes = 1, 0 otherwise) | New | Percent | Commercial sale of agricultural products as income contributes to less vulnerability and increases adaptive capacity |
| Percentage of HHs that use domestic animal products as food (milk, butter, meat, eggs, etc.) (yes = 1, 0 otherwise) | New | Percent | Using domestic animal products indicates less vulnerability and sensitivity |
| Percentage of HHs who struggled and had food shortage in last 30 days (yes = 1, 0 otherwise) | New | Percent | Food shortage increases vulnerability and sensitivity |
| 2.3 Knowledge and skills | Modified | ||
| Percentage of HHs not satisfied with local government efforts in sharing knowledge of climate change (yes = 1, 0 otherwise) | New | Percent | Less local government effort to share knowledge increases vulnerability and reduces adaptability to natural hazards |
| Percentage of HH members who have not taken any kind of vocational training (yes = 1, 0 otherwise) | New | Percent | Training makes people better at coping with adaptive strategies |
| HH head illiterate (yes = 1, 0 otherwise) | Maintained | Percent | Lacking both reading and writing reduces adaptive capacity |
| 3. Natural capital | Modified | ||
| 3.1 Water | Modified | ||
| HHs utilizing hand pumps for drinking water (yes = 1, 0 otherwise) | New | Percent | Less access to good quality water increases sensitivity |
| Average distance to water source (km) | New | km | Shorter time reduces vulnerability and sensitivity |
| Percentage of HHs that store water (yes = 1, 0 otherwise) | New | Percent | Less access to fresh drinking water means higher sensitivity |
| Percentage of HHs that have no access to canal water for irrigation (yes = 1, 0 otherwise) | New | Percent | Less access to diverse irrigation sources means higher sensitivity |
| Percentage of HHs utilizing water from natural resources (river, canal, wells, ponds, rain) (yes = 1, 0 otherwise) | Maintained | Percent | Less access to fresh drinking water increases vulnerability to illness and sensitivity |
| Percentage of HHs receiving water through public water system (water supply) (yes = 1, 0 otherwise) | Maintained | Percent | Consistent water supply reduces vulnerability and sensitivity |
| 3.2 Natural disasters and climate variability | Modified | ||
| Average number of floods/droughts/windstorms in the past 5 years (number) | New | Count | More events reflect more exposure and vulnerability |
| Percentage of HHs that reported crop damage due to floods/droughts/windstorms in the past 5 years (yes = 1, 0 otherwise) | New | Percent | More damage to crops leads to more exposure and vulnerability |
| Percentage of HHs that reported livestock losses due to droughts/floods and extreme climate in the past 5 years (yes = 1, 0 otherwise) | New | Percent | More livestock losses indicate more exposure and vulnerability |
| Mean standard deviation of monthly average maximum daily temperature (2001–2010) | °C | Increased temperature enhances the risk to livestock and crop yields with higher exposure and vulnerability | |
| Mean standard deviation of monthly average precipitation (2001–2010) | mm | Increased variability of precipitation increases the risk to livestock and crop yields with higher exposure and vulnerability | |
| Number of hot months with average monthly temperature above 30 °C (2001–2010) | Count | More hot (dry) months will increase the risk of water shortage/droughts, leading to increased vulnerability and exposure | |
| 3.3 Natural resources | Modified | ||
| Percentage of HHs using agricultural residuals as energy for cooking purposes (yes = 1, 0 otherwise) | New | Percent | Higher dependency on agricultural residuals increases vulnerability to natural resources |
| Percentage of HHs using traditional cooking stoves (yes = 1, 0 otherwise) | New | Percent | More use of traditional stoves indicates more vulnerability and dependency on natural resources |
| Percentage of HHs using dunk cakes for fire purposes (yes = 1, 0 otherwise) | New | Percent | More use of dunk cakes indicates more dependency on animals |
| Percentage of HHs using LPG cylinders for cooking (yes = 1, 0 otherwise) | New | Percent | More LPG use means reduced vulnerability and increased adaptive capacity |
| 4. Physical capital | Modified | ||
| 4.1 Livelihood strategy | Modified | ||
| HHs with members working in community (yes = 1, 0 otherwise) | Percent | Income diversification means more adaptability and less vulnerability | |
| HH members who migrate for earnings (yes = 1, 0 otherwise) | New | Percent | Income diversification means more adaptability and less vulnerability |
| Kinds of animals raised (number of animal species) | New | # kinds of animals | Diversity of animal species and kinds reduces major losses |
| Average crop diversity index (number of crops grown) | Maintained | # crops | Less crop variety means less adaptability and more vulnerability |
| HHs with agriculture as main source of income (yes = 1, 0 otherwise) | Maintained | Percent | Limited income sources reduce adaptive capacity and enhance vulnerability |
| Average livestock sold for cash in last 12 months | New | # animals | More livestock means higher adaptive capacity |
| Children participating (number) | New | Percent | Participation of children in farming activities/livelihood strategies reduces family labor constraints and increases adaptive capacity |
| HHs purchasing fodder and nutrients (yes = 1, 0 otherwise) | New | Percent | Purchasing fodder and other nutrients increases and strengthens adaptive capacity |
| HHs using artificial insemination to breed animals (yes = 1, 0 otherwise) | New | Percent | Improved breeds strengthen adaptive capacity |
| 4.2 Housing | New | ||
| Percentage of HHs with non-solid/thatch houses (yes = 1, 0 otherwise) | New | Percent | Non-solid house increases sensitivity particularly due to heavy rains and floods |
| Percentage of HHs using concrete material in the base of walls and roof (yes = 1, 0 otherwise) | New | Percent | Using solid material in houses means more resistance to natural disasters and increased adaptive capacity |
| Percentage of HHs reporting houses affected by climate-related disasters (yes = 1, 0 otherwise) | New | Percent | More disasters indicate higher sensitivity and vulnerability |
| Percentage of HHs without paved streets (yes = 1, 0 otherwise) | New | Percent | Paved streets reduce vulnerability in bad weather conditions |
| Percentage of HHs without latrine in house (yes = 1, 0 otherwise) | New | Percent | Latrines in houses indicates less sensitivity and vulnerability |
| 4.3 Land and livestock | New | ||
| Percentage of landless HHs (yes = 1, 0 otherwise) | New | Percent | Land ownership reduces vulnerability and sensitivity |
| Percentage of HHs keeping livestock (yes = 1, 0 otherwise) | New | Percent | Fewer livestock indicates less sensitivity |
| Percentage of HHs with small parcel of land (0.5–2 acre) (yes = 1, 0 otherwise) | New | Percent | Less land holding increases vulnerability and sensitivity |
| Percentage of rented-in farmers (yes = 1, 0 otherwise) | New | Percent | Rented-in land reduces adaptive capacity due to land ownership |
| Percentage of shared-in farmers (yes = 1, 0 otherwise) | New | Percent | Crop sharing increases sensitivity and vulnerability due to less share in output |
| Percentage of HHs reporting land degradation and salinity due to extreme climate (yes = 1, 0 otherwise) | New | Percent | Land degradation and salinity increase sensitivity and vulnerability due to low output |
| Percentage of HHs reporting no dispute on their land and can easily sell or rent (yes = 1, 0 otherwise) | New | Percent | Land sale/rent-out reduce vulnerability and sensitivity |
| 4.4 Infrastructure | New | ||
| Average time to reach nearest vehicle station (minutes) | New | Minutes | Shorter time means reduced vulnerability and increased adaptive capacity |
| Average distance to access production means (km) | New | km | Longer distance means increased vulnerability and reduced adaptive capacity |
| Average distance to access nearest commercial market (km) | New | km | Easy access to commercial market within short distance means less vulnerability and increased information sources with higher adaptive capacity |
| Percentage of households reporting village roads are not paved (yes = 1, 0 otherwise) | New | Percent | Paved infrastructure means reduced vulnerability in rainy weather and increased adaptive capacity |
| 5. Financial capital | Modified | ||
| 5.1 Finance and income | New | ||
| Percentage of HHs that have to pay debt (yes = 1, 0 otherwise) | New | Percent | More debt increases financial stress and vulnerability and reduces adaptive capacity |
| Percentage of HHs with annual net income lower than Rs 200,000 (yes = 1, 0 otherwise) | New | Percent | Higher income reduces vulnerability and increases adaptive capacity |
| Percentage of HHs that have savings to cope with natural disasters (yes = 1, 0 otherwise) | New | Percent | More savings increases capacity to deal with natural hazards and stressors in future |
| Percentage of HHs with no access to any financial institution (yes = 1, 0 otherwise) | New | Percent | These institutions strengthen adaptive capacity during unpleasant events |
| Percentage of HHs with current annual income less than last year (yes = 1, 0 otherwise) | New | Percent | Less income increases vulnerability and reduces adaptive capacity with no savings to deal with unpleasant events in future |
| Percentage of HHs with annual income getting worse for last 5 years (yes = 1, 0 otherwise) | New | Percent | Continued decreasing income trends for a long period of time result in no savings to cope with natural hazards in future with less adaptive capacity, enhancing vulnerability |
Notes: HHs= Households, LVI= livelihood Vulnerability Index, NGO= Non-government organizations, LPG= liquefied petroleum gas.
Appendix C
Table A3.
LVI Values of Subcomponents, Major Components, and Overall LVI.
| Major Components and Subcomponents | BHK | DGK | RYK | MLT |
|---|---|---|---|---|
| Health (M1): | 0.186 | 0.137 | 0.322 | 0.173 |
| Percentage of HHs with at least one chronically ill member (M11) | 0.026 | 0.037 | 0.177 | 0.045 |
| Percentage of HHs with a family member who missed work or school due to illness in past 1 month (M12) | 0.116 | 0.055 | 0.158 | 0.027 |
| Average distance to nearby health facility (M13) | 0.166 | 0.333 | 0.416 | 0.416 |
| Average annual expenses at health facility (M14) | 0.215 | 0.144 | 0.186 | 0.075 |
| Distance to nearby veterinary facility from home (M15) | 0.409 | 0.116 | 0.674 | 0.302 |
| Social networks (M2): | 0.302 | 0.269 | 0.238 | 0.360 |
| Percentage of HHs that received money from private entity, government, NGO, friends, or relatives in the past 12 months (M21) | 0.223 | 0.009 | 0.018 | 0.207 |
| Percentage of HHs that went to local government office/officials for any help in the past 12 months (M22) | 0.098 | 0.201 | 0.130 | 0.333 |
| Percentage of HHs that lent or borrowed money from relatives or friends in the past 12 months (M23) | 0.017 | 0.201 | 0.084 | 0.090 |
| Percentage of HHs that contacted community leader for help in the past 12 months (M24) | 0.026 | 0.000 | 0.018 | 0.009 |
| Percentage of HHs that have not been members of any organization (M25) | 0.955 | 0.620 | 0.747 | 0.901 |
| Percentage of HHs that have no access to TV/radio/telephone at home (M26) | 0.598 | 0.814 | 0.542 | 0.686 |
| Percentage of HHs that have access to community cooperative leader, political and government officials (M27) | 0.196 | 0.037 | 0.130 | 0.299 |
| Socio-demographic(M3): | 0.218 | 0.220 | 0.244 | 0.194 |
| Dependency ratio (M31) | 0.051 | 0.078 | 0.057 | 0.082 |
| Percentage of female-headed HHs (M32) | 0.026 | 0.064 | 0.018 | 0.189 |
| Average family members in HHs (M33) | 0.153 | 0.105 | 0.161 | 0.117 |
| Percentage of HHs with orphans (M34) | 0.160 | 0.000 | 0.355 | 0.108 |
| Percentage of HHs with guest visit in last 7 days (M35) | 0.107 | 0.148 | 0.158 | 0.036 |
| Average age of household head (M36) | 0.289 | 0.355 | 0.244 | 0.333 |
| Agricultural experience (M37) | 0.719 | 0.705 | 0.776 | 0.412 |
| Percentage of HH heads who did not attend school (M38) | 0.508 | 0.620 | 0.500 | 0.500 |
| Education of HH heads (M39) | 0.128 | 0.112 | 0.121 | 0.133 |
| Percentage of HHs with family decision index (M310) | 0.035 | 0.018 | 0.046 | 0.036 |
| Food(M4): | 0.523 | 0.285 | 0.312 | 0.164 |
| Percentage of HHs that do not save food crops (M41) | 0.375 | 0.101 | 0.084 | 0.126 |
| Percentage of HHs that save crop seeds for next season (M42) | 0.526 | 0.296 | 0.355 | 0.027 |
| Percentage of HHs that use agriculture production for sale of product only (M43) | 0.714 | 0.407 | 0.448 | 0.207 |
| Percentage of HHs that use animal products as food (milk, butter, meat, eggs, etc.) (M44) | 0.830 | 0.407 | 0.523 | 0.342 |
| Percentage of HHs that struggled and had food shortage in last 30 days (M45) | 0.170 | 0.213 | 0.150 | 0.117 |
| Knowledge and skills(M5): | 0.793 | 0.839 | 0.770 | 0.811 |
| Percentage of HHs not satisfied with local government efforts to share knowledge of climate change (M51) | 0.892 | 0.907 | 0.841 | 0.954 |
| Percentage of HH members who have not taken any kind of vocational training (M52) | 0.980 | 0.990 | 0.970 | 0.980 |
| Percentage of HH heads who are illiterate (M53) | 0.508 | 0.620 | 0.500 | 0.500 |
| Water(M6): | 0.368 | 0.477 | 0.334 | 0.516 |
| Percentage of HHs that utilize hand pumps for drinking water (M61) | 0.486 | 0.740 | 0.401 | 0.800 |
| Average distance to water source (M62) | 0.063 | 0.308 | 0.203 | 0.568 |
| Percentage of HHs that store water (M63) | 0.738 | 0.731 | 0.420 | 0.736 |
| Percentage of HHs that have no access to canal water for irrigation (M64) | 0.919 | 0.953 | 0.616 | 0.991 |
| Percentage of HHs that utilize water from natural resources (river, canal, wells, ponds, rain) (M65) | 0.000 | 0.046 | 0.167 | 0.000 |
| Percentage of HHs that receive water through public water system (water supply) (M66) | 0.000 | 0.082 | 0.195 | 0.000 |
| Natural disasters and climate variability (M7): | 0.391 | 0.404 | 0.463 | 0.431 |
| Average number of floods/droughts/windstorms in the past 5 years (M71) | 0.727 | 0.545 | 0.363 | 0.636 |
| Percentage of HHs that reported crop damage due to floods/droughts/windstorms in the past 5 years (M72) | 0.330 | 0.261 | 0.259 | 0.072 |
| Percentage of HHs that reported livestock affected by droughts/floods and extreme climate in the past 5 years (M73) | 0.303 | 0.140 | 0.009 | 0.090 |
| Mean standard deviation of monthly average maximum daily temperature (2001–2010) (M74) | 0.412 | 0.606 | 0.773 | 0.798 |
| Mean standard deviation of monthly average precipitation (2001–2010) (M75) | 0.105 | 0.436 | 0.598 | 0.207 |
| Number of hot months with average monthly temperature above 30 °C (2001–2010) (M76) | 0.467 | 0.433 | 0.777 | 0.783 |
| Natural resources (M8): | 0.551 | 0.343 | 0.518 | 0.497 |
| Percentage of HHs using agricultural residuals as energy for cooking purposes (M81) | 0.946 | 0.870 | 0.878 | 0.972 |
| Percentage of HHs using traditional cooking stoves (M82) | 0.919 | 0.455 | 0.841 | 0.882 |
| Percentage of HHs using dunk cakes for fire purposes (M83) | 0.321 | 0.046 | 0.355 | 0.126 |
| Percentage of HHs using LPG cylinders for cooking (M84) | 0.017 | 0.000 | 0.000 | 0.009 |
| Livelihood strategy (M9): | 0.373 | 0.317 | 0.339 | 0.357 |
| Percentage of HH members working in different communities for earnings (M91) | 0.223 | 0.453 | 0.444 | 0.710 |
| Percentage of HHs with at least 1 member who has migrated in the last year (M92) | 0.053 | 0.018 | 0.000 | 0.180 |
| Average kind of animals raised (M93) | 0.227 | 0.353 | 0.363 | 0.443 |
| Average crop diversity index (M94) | 0.342 | 0.763 | 0.342 | 0.394 |
| Percentage of HHs earning income with sale of livestock products (M95) | 0.205 | 0.167 | 0.383 | 0.297 |
| Percentage of HHs reporting agriculture as main source of income (M96) | 0.741 | 0.416 | 0.425 | 0.227 |
| Average livestock sold in last 12 months (M97) | 0.937 | 0.562 | 0.916 | 0.895 |
| Percentage of HHs with children participating in taking care of livestock and agriculture activities (M98) | 0.491 | 0.314 | 0.551 | 0.279 |
| Percentage of HHs purchasing fodder and other feeds or nutrients for animals (M99) | 0.161 | 0.250 | 0.205 | 0.081 |
| Percentage of HHs using genetic improvement of animals through artificial insemination (M910) | 0.642 | 0.185 | 0.074 | 0.414 |
| Percentage of HHs dependent on fishing/forestry as major source of income (M911) | 0.080 | 0.009 | 0.028 | 0.009 |
| Housing (M10): | 0.387 | 0.442 | 0.342 | 0.433 |
| Percentage of HHs with non-solid/thatch houses (M101) | 0.544 | 0.620 | 0.317 | 0.648 |
| Percentage of HHs using concrete material in the base of walls and roof (M102) | 0.026 | 0.009 | 0.018 | 0.027 |
| Percentage of HHs reporting houses affected by climate-related disasters (M103) | 0.160 | 0.037 | 0.317 | 0.027 |
| Percentage of HHs without paved street (M104) | 0.792 | 0.944 | 0.887 | 0.845 |
| Percentage of HHs that do not have latrine in house (M105) | 0.414 | 0.601 | 0.168 | 0.618 |
| Land and livestock (M11): | 0.337 | 0.301 | 0.300 | 0.292 |
| Percentage of landless HHs (M111) | 0.250 | 0.601 | 0.560 | 0.792 |
| Percentage of HHs keeping livestock (M112) | 0.973 | 0.842 | 0.869 | 0.792 |
| Percentage of HHs with small land holding (0.5–2 acre) (M113) | 0.089 | 0.138 | 0.056 | 0.117 |
| Percentage of rented-in farmers (M114) | 0.101 | 0.111 | 0.074 | 0.063 |
| Percentage of shared-in farmers (M115) | 0.223 | 0.046 | 0.074 | 0.009 |
| Percentage of HHs reporting land degradation and salinity due to extreme climate (M116) | 0.633 | 0.296 | 0.280 | 0.198 |
| Percentage of HHs reporting no dispute on their land and can easily sell or rent (M11) | 0.633 | 0.296 | 0.280 | 0.198 |
| Infrastructure (M12): | 0.509 | 0.576 | 0.424 | 0.392 |
| Average time to reach nearest vehicle station (M121) | 0.183 | 0.400 | 0.183 | 0.136 |
| Average distance to access production means (M122) | 0.769 | 0.690 | 0.421 | 0.513 |
| Average distance to access nearest commercial market (M123) | 0.335 | 0.717 | 0.342 | 0.421 |
| Percentage of households reporting village roads are not paved (M124) | 0.750 | 0.500 | 0.750 | 0.500 |
| Finance and income (M13): | 0.409 | 0.540 | 0.491 | 0.612 |
| Percentage of HHs that have to pay debt or loans (M131) | 0.151 | 0.203 | 0.158 | 0.315 |
| Percentage of HHs with annual net income lower than Rs.200,000 (M132) | 0.598 | 0.740 | 0.383 | 0.810 |
| Percentage of HHs that have savings to cope with natural disasters (M133) | 0.044 | 0.083 | 0.055 | 0.09 |
| Percentage of HHs that have no access to any financial institution (M134) | 0.339 | 0.638 | 0.766 | 0.855 |
| Percentage of HHs with current annual income less than last year (M135) | 0.642 | 0.824 | 0.841 | 0.783 |
| Percentage of HHs with annual income getting worse for last 5 years (M136) | 0.678 | 0.750 | 0.747 | 0.819 |
| Overall LVI | 0.378 | 0.364 | 0.363 | 0.376 |
Appendix D
Table A4.
Example Calculation of Major Component (Health-M1) and LVI for BHK District.
| Subcomponents | Actual Values | Min/Max | Index Values |
|---|---|---|---|
| Percentage of HHs that have members with chronic diseases (M11) | 2.68 | 0/100 | 0.026 |
| Percentage of HHs with members who missed work or school due to illness (M12) | 11.61 | 0/100 | 0.116 |
| Average distance to nearby health facility (M13) | 5 | 3/15 | 0.166 |
| Average annual health expenses (M14) | 15,828 | 400/70,000 | 0.215 |
| Average distance to nearby veterinary facility (M15) | 12.3 | 3.5/25 | 0.409 |
| Notes: Calculating steps for indices of subcomponents and major components as follows: | |||
| Step 1: Repeat for all subcomponent indicators (refer to Appendix C): | |||
| Step 2: Repeat step 1 for subcomponents of other major components (refer to Table 3) and then use Equation (2) to calculate indicators for all major components (refer to Table 3); for example, health (M1): | |||
| Step 3: Repeat for all other major components in step 2 for LVI (refer to Table 3); for example, BHK district: | |||
Notes: M= Major component.
Appendix E
Table A5.
Example Calculation of Contributing Factors of Major Component LVIIPCC for BHK District.
| Contributing Factors | Index Values | No. of Subcomponents |
|---|---|---|
| Adaptive capacity: | – | – |
| Social networks (M2) | 0.302 | 7 |
| Socio-demographic (M3) | 0.218 | 10 |
| Knowledge and skills (M5) | 0.793 | 3 |
| Natural resources (M8) | 0.551 | 4 |
| Livelihood strategy (M9) | 0.373 | 11 |
| Infrastructure (M12) | 0.509 | 4 |
| Finance and income (M13) | 0.409 | 6 |
| Sensitivity: | – | – |
| Health (M1) | 0.186 | 5 |
| Food (M4) | 0.523 | 5 |
| Water (M6) | 0.368 | 6 |
| Housing (M10) | 0.387 | 5 |
| Land and livestock (M11) | 0.377 | 7 |
| Exposure: | – | – |
| Natural disasters and calamity variability (M7) | 0.464 | 6 |
| Notes: Calculating steps of contributing factors of adaptive capacity, sensitivity, and exposure and LVIIPCC are as follows: | ||
| Step 1: Calculate index of subcomponent indicators and major components as in step 1 in Appendix D and take the inverse of the adaptive capacity subcomponent indicators. | ||
| Step 2: Repeat calculation of all contributing factors (refer to Table 4); for example, adaptive capacity (ac): | ||
| Similarly, | ||
| Step 3: Repeat Equation (6) to calculate LVIIPCC for all districts (refer to Table 4); for example, BHK district: | ||
References
- Field, C.; Barros, V.; Stocker, T.; Dahe, Q.; Dokken, D.; Ebi, K.; Mastrandrea, M.; Mach, K.; Plattner, G.; Allen, S. Managing the Risks of Extreme Events and Disasters to Advance Climate Change Adaptation. Special Report of the Intergovernmental Panel on Climate Change; Cambridge University Press: New York, NY, USA; Geneva, Switzerland, 2012. [Google Scholar]
- Birkmann, J.; Wisner, B. Measuring the Unmeasurable: The Challenge of Vulnerability; Institute for Environment and Human Security (UNU-EHS): Bonn, Germany, 2006; Volume 5, ISBN 3981058267. [Google Scholar]
- IPCC. Climate Change 2007: Impacts, Adaptation and Vulnerability. Contribution of Working Group II to the Fourth Assessment Report; Intergovernmental Panel on Climate Change (IPCC): Cambridge, UK, 2007. [Google Scholar]
- Stern, N. What is the economics of climate change? World Econ. Henley Thames 2006, 7, 2. [Google Scholar]
- IPCC. Climate Change 2014: Synthesis Report. In Contribution of Working Groups I, II and III to the Fifth Assessment Report of the Intergovernmental Panel on Climate Change; Core Writing Team, Pachauri, R.K., Meyer, L.A., Eds.; IPCC: Geneva, Switzerland, 2014. [Google Scholar]
- Centre for Research on The Epidemiology of Disaster (CRED). The Human Cost of Natural Disaster 2015: A Global Perspective; CRED: Brussels, Belgium, 2015. [Google Scholar]
- Erda, L.; Xu, Y.; Wu, S.; Hui, J.; Shiming, M. China’s National Assessment Report on Climate Change (II): Climate change impacts and adaptation. Adv. Clim. Chang. Res. 2007, 3, 6–11. [Google Scholar]
- Kurukulasuriya, P.; Rosenthal, P. Climate Change and Agriculture: A Review of Impacts and Adaptations; Paper No.91 in Climate Change Series; The World Bank: Washington, DC, USA, 2003; p. 106. [Google Scholar]
- Yu, W.; Yang, Y.C.; Savitsky, A.; Alford, D.; Brown, C. The Indus Basin of Pakistan: The Impacts of Climate Risks on Water and Agriculture; The World Bank: Washington, DC, USA, 2013; ISBN 978-0-8213-9874-6. [Google Scholar]
- Herrero, M.; Thornton, P.K.; Notenbaert, A.M.; Wood, S.; Msangi, S.; Freeman, H.A.; Bossio, D.; Dixon, J.; Peters, M.; Van de Steeg, J.; et al. Smart Investments in Sustainable Food Production: Revisiting Mixed Crop-Livestock Systems. Science 2010, 327, 822–825. [Google Scholar] [CrossRef] [PubMed] [Green Version]
- Thornton, P.K.; Herrero, M. Climate Change adaptation in mixed crop-livestock system in developing countries. Glob. Food Sec. 2014, 3, 99–107. [Google Scholar] [CrossRef] [Green Version]
- IPCC. Climate Change 2007: Impacts, Adaptation and Vulnerability-Working Group II Contribution to the Intergovernmental Panel on Climate Change: Summary for Policymakers; IPCC Secretariat: Geneva, Switzerland, 2014. [Google Scholar]
- Skoufias, E.; Rabassa, M.; Olivieri, S.; Brahmbhatt, M. The poverty impacts of climate change. Poverty Reduct. Econ. Manag. Netw. 2011, 51, 5. [Google Scholar]
- Maskrey, A.; Buescher, G.; Peduzzi, P.; Schaerpf, C. Disaster Risk Reduction: 2007 Global Review. In Proceedings of the Consultation Edition, Prepared for the Global Platform for Disaster Risk Reduction First Session, Geneva, Switzerland, 5–7 June 2007. [Google Scholar]
- Atchoarena, D.; Gasperini, L. Education for Rural Development towards New Policy Responses; FAO/UNESCO: Rome, Italy, 2003. [Google Scholar]
- Chapagain, T.; Raizada, M. Agronomic challenges and opportunities for smallholder terrace agriculture in developing countries. Front. Plant Sci. 2017, 8, 331. [Google Scholar] [CrossRef] [Green Version]
- Zhuang, J. The Economics of Climate Change in Southeast Asia: A Regional Review; Asian Development Bank: Manila, Philippine, 2009. [Google Scholar]
- Mirza, M.M.Q. Climate change, flooding in South Asia and implications. Reg. Environ. Chang. 2011, 11, 95–107. [Google Scholar] [CrossRef]
- Thornton, P.K.; Van de Steeg, J.; Notenbaert, A.; Herrero, M. The impacts of climate change on livestock and livestock systems in developing countries: A review of what we know and what we need to know. Agric. Syst. 2009, 101, 113–127. [Google Scholar] [CrossRef]
- Zhao, C.; Liu, B.; Piao, S.; Wang, X.; Lobell, D.B.; Huang, Y.; Huang, M.; Yao, Y.; Bassu, S.; Ciais, P.; et al. Temperature increase reduces global yields of major crops in four independent estimates. Proc. Natl. Acad. Sci. USA 2017, 114, 9326–9331. [Google Scholar] [CrossRef] [Green Version]
- Cotter, M.; DelaPena-Lavander, R.; Sauerborn, J. Understanding the present distribution of the parasitic weed Striga hermonthica and predicting its potential future geographic distribution in the light of climate change. Jul.-Kühn-Archiv 2012, 13, 630–634. [Google Scholar]
- NRC. Effect of Environment on Nutrient Requirements of Domestic Animals. In Subcommittee on Environmenta Stress; National Academy Press: Washington, DC, USA, 1981. [Google Scholar]
- Mills, J.N.; Gage, K.L.; Khan, A.S. Potential influence of climate change on vector borne and zoonotic diseases: Are view and proposed research plan. Environ. Health Perspect. 2010, 118, 1507–1514. [Google Scholar] [CrossRef] [PubMed] [Green Version]
- Gregory, P.J.; Johnson, S.N.; Newton, A.C.; Ingram, J.S.I. Integrating pests and pathogens into the climate change/food security debate. J. Exp. Bot. 2009, 60, 2827–2838. [Google Scholar] [CrossRef] [PubMed]
- Abid, M.; Scheffran, J.; Schneider, U.A.; Ashfaq, M. Farmers’ perceptions of and adaptation strategies to climate change and their determinants: The case of Punjab province, Pakistan. Earth Syst. Dyn. 2015, 6, 225–243. [Google Scholar] [CrossRef] [Green Version]
- Farooq, O.; Wasti, S.E. Agriculture—Pakistan Economic Survey 2014–2015; Ministry of Finance: Islamabad, Pakistan, 2015; pp. 23–44. [Google Scholar]
- Rehman, A.; Jingdong, L.; Chandio, A.A.; Hussain, I. Livestock Production and Population Census in Pakistan: Determining Their Relationship with Agricultural GDP Using Econometric Analysis. Inf. Process. Agric. 2017, 4, 168–177. [Google Scholar] [CrossRef]
- GOP. Economic Survey of Pakistan, Federal Bureau of Statics, Statics Division; Ministry of Economics Affairs and Statistics: Islamabad, Pakistan, 2012. [Google Scholar]
- Pakistan Bureau of Statistics. Agricultural statistics of Pakistan; Government of Pakistan, Statistics Division: Islamabad, Pakistan, 2018.
- Schilling, J.; Vivekananda, J.; Khan, M.A.; Pandey, N. Vulnerability to Environmental Risks and Effects on Community Resilience in Mid-West Nepal and South-East Pakistan. Environ. Nat. Resour. Res. 2013, 3, 27–45. [Google Scholar] [CrossRef]
- IUCN. Climate Change. In Vulnerabilities in Agriculture in Pakistan; IUCN: Gland, Switzerland, 2009. [Google Scholar]
- Kreft, S.; Eckstein, D. Global Climate Risk Index 2014: Who Suffers Most from Extreme Weather Events? Weather-Related Loss Events in 2012 and 1993 to 2012; Germanwatch eV: Bonn, Germany, 2014. [Google Scholar]
- LP. Leads Pakistan: LEAD Climate Change Action Program, Internal Document; LEAD Pakistan: Islamabad, Pakistan, 2010. [Google Scholar]
- Khan, J.A.; Fee, L. Cities and Climate Change Initiative-Abridged Report: Islamabad Pakistan, Climate Change Vulnerability Assessment; United Nations Human Settlements Programme (UN-Habitat): Islamabad, Pakistan, 2014. [Google Scholar]
- Nomman, M.A.; Schmitz, M. Economic assessment of the impact of climate change on the agriculture of Pakistan. Bus. Econ. Horizons 2011, 4, 1–12. [Google Scholar] [CrossRef]
- Smit, B.; Skinner, M. Adaptation options in agriculture to climate change: A topology, Mitigation and Adaptation Strategies for Global. Mitig. Adapt. Strateg. Glob. Chang. 2002, 7, 85–114. [Google Scholar] [CrossRef]
- Asif, M. Climatic Change. Irrigation Water Crisis and Food Security in Pakistan; Uppsala University: Uppsala, Swiyzerland, 2013. [Google Scholar]
- Asian Development Bank. Addressing Climate Change and Migration in Asia and the Pacific; Asian Development Bank: Manila, Philippines, 2012. [Google Scholar]
- Qin, D.; Plattner, G.K.; Tignor, M.; Allen, S.K.; Boschung, J.; Nauels, A. Climate Change 2013: The Physical Science Basis. In Contribution of Working Group I to the Fifth Assessment Report of the Intergovernmental Panel on Climate Change; Stocker, T., Ed.; Cambridge University Press: Cambridge, UK, 2014. [Google Scholar]
- Saeed, F.; Salik, K.M.; Ishfaq, S. Climate Change and Heat Waves: Rural to Urban Migration in Pakistan. A Silent Looming Crisis; Environment and Climate Change Unit, Sustainable Development Policy Institute: Islamabad, Pakistan, 2015. [Google Scholar]
- Irfan, M. Poverty and natural resource management in Pakistan. Pak. Dev. Rev. 2007, 4, 691–708. [Google Scholar] [CrossRef] [Green Version]
- Sultana, H.; Ali, N. Vulnerability of wheat production in different climatic zones of Pakistan under climate change scenarios using CSM-CERES-Wheat Model. In Proceedings of the Second International Young Scientists’ Global Change Conference, Beijing, China, 7–12 November 2006. [Google Scholar]
- Ahmad, M.; Iqbal, M.; Khan, M. Climate Change, Agriculture and Food Security in Pakistan: Adaptation Options and Strategies; Pakistan Institute of Development Economics: Islamabad, Pakistan, 2013. [Google Scholar]
- O’Brien, G.; O’Keefe, P.; Joanne Rose, B.W. Climate Change and Disaster Management. Disasters 2006, 30, 64–80. [Google Scholar] [CrossRef]
- Adger, W.N.; Arnell, N.W.; Tompkins, E.L. Successful adaptation to climate change across scales. Glob. Environ. Chang. 2005, 15, 77–86. [Google Scholar] [CrossRef]
- Wandel, J.; Smit, B. Agricultural Risk Management in Light of Climate Variability and Change. In Agricultural and Environmental Sustainability in the New Countryside; Hignell Printing Limited: Winnipeg, MA, Canada, 2000. [Google Scholar]
- Etwire, P.M.; Al-Hassan, R.M.; Kuwornu, J.K.M. Application of Livelihood Vulnerability Index in Assessing Vulnerability to Climate Change and Variability in Northern Ghana. J. Environ. Earth Sci. 2013, 3, 157–170. [Google Scholar]
- Nakuja, T.; Sarpong, D.B.; Kuwornu, J.K.M.; Asante, F.A. Water storage for dry season vegetable farming as an adaptation to climate change in the Upper East region of Ghana. Afr. J. Agric. Res. 2012, 7, 298–306. [Google Scholar]
- TFCC Planning Commission, Government of Pakistan. Available online: http://pc.gov.pk/usefull_links/Taskforces/TFCC_Final_Report.pdf (accessed on 10 August 2014).
- Hussain, M.A.; Mudassar, M. Economic assessment of the impact of climate change on the agriculture of Pakistan. Agric. Syst. 2007, 94, 494–501. [Google Scholar] [CrossRef]
- Hanif, U.; Syed, S.H.; Ahmad, R.; Malik, K.A.; Nasir, M. Economic Impact of Climate Change on the Agricultural Sector of Punjab, Pakistan. Pakistan Dev. Rev. 2010, 49, 771–798. [Google Scholar] [CrossRef] [Green Version]
- Ashfaq, M.; Zulfiqar, F.; Sarwar, I.; Quddus, M.A.; Baig, I.A. Impact of climate change on wheat productivity in mixed cropping system of Punjab. Soil Environ. 2011, 30, 110–114. [Google Scholar]
- Abid, M.; Schilling, J.; Scheffran, J.; Zuliqar, F. Climate change vulnerability, adaptation and risk perceptions at farm level in Punjab, Pakistan. Sci. Total Environ. 2016, 547, 447–460. [Google Scholar] [CrossRef]
- Joshi, S.; Jasra, W.A.; Ismail, M.; Shrestha, R.M.; Yi, S.L.; Wu, N. Herders’ perceptions of and responses to climate change in Northern Pakistan. Environ. Manag. 2013, 52, 639–648. [Google Scholar] [CrossRef]
- Ali, A.; Erenstein, O. Assessing farmer use of climate change adaptation practices and impacts on food security and poverty in Pakistan. Clim. Risk Manag. 2017, 16, 183–194. [Google Scholar] [CrossRef]
- Majeed, K.; Jahangir, S.; Zahdi, Z. Ocean & Coastal Management Climate change vulnerability and adaptation options for the coastal communities of Pakistan. Ocean Coast. Manag. 2015, 112, 61–73. [Google Scholar]
- Sattar, R.S.; Wang, S.; Tahir, N.; Caldwell, C.D. Assessment of smallholder farmer’s vulnerability due to climate change in arid areas of Pakistan. Appl. Ecol. Environ. Res. 2017, 15, 291–312. [Google Scholar] [CrossRef]
- Qaisrani, A.; Awais, M.; Ghamz, U.; Siyal, E.A.; Majeed, K. What Defines Livelihood Vulnerability in Rural Semi-Arid Areas? Evidence from Pakistan. Earth Syst. Environ. 2018, 2, 455–475. [Google Scholar] [CrossRef] [Green Version]
- Panthi, J.; Aryal, S.; Dahal, P.; Bhandari, P.; Krakauer, N.Y.; Pandey, V.P. Livelihood vulnerability approach to assessing climate change impacts on mixed agro-livestock smallholders around the Gandaki River Basin in Nepal. Reg. Environ. Chang. 2015, 16, 1121–1132. [Google Scholar] [CrossRef]
- Dechassa, C.; Simane, B.; Alamirew, B.; Azadi, H. Agro-ecological based small-holder farmer’s livelihoods vulnerability to climate variability and change in Didesa sub Basin of Blue Nile River, Ethiopia. Acad. J. Agric. Res. 2016, 4, 230–240. [Google Scholar]
- Hahn, M.B.; Riederer, A.M.; Foster, S.O. The Livelihood Vulnerability Index: A pragmatic approach to assessing risks from climate variability and change—A case study in Mozambique. Glob. Environ. Chang. 2009, 19, 74–88. [Google Scholar] [CrossRef]
- Heltberg, R.; Siegel, P.B.; Jorgensen, S.L. Addressing human vulnerability to climate change: Toward a ‘no-regrets’ approach. Glob. Environ. Chang. 2009, 19, 89–99. [Google Scholar] [CrossRef]
- Bryan, E.; Deressa, T.T.; Gbetibouo, G.A.; Ringler, C. Adaptation to climate change in Ethiopia and South Africa: Options and constraints. Environ. Sci. Policy 2009, 12, 413–426. [Google Scholar] [CrossRef]
- FAO. Food Security and Agricultural Mitigation in Developing Countries: Options for Capturing Synergies; Food and Agriculture Organization of the United Nations: Rome, Italy, 2009. [Google Scholar]
- FAO. Global Forest Resources Assessment 2005—Progress towards Sustainable Forest Management (FAO Forestry Paper No. 147); Food and Agriculture Organization of the United Nations: Rome, Italy, 2006. [Google Scholar]
- IPCC. Climate Change 2001: Impacts, Adaptation, and Vulnerability. Contribution of Working Group II to the Third Assessment Report; Cambridge University Press: Cambridge, UK, 2001. [Google Scholar]
- Fussel, H.M. Vulnerability: A generally applicable conceptual framework for CC research. Glob. Environ. Chang. 2007, 17, 155–167. [Google Scholar] [CrossRef]
- Turner, B.L.I.; Kasperson, R.E.; Matson, P.A.; Mccarthy, J.J.; Corell, R.W.; Christensen, L.; Eckley, N.; Kasperson, J.X.; Luers, A.; Martello, M.L.; et al. A framework for vulnerability analysis in sustainability science. Proc. Natl. Acad. Sci. USA 2003, 100, 8074–8079. [Google Scholar] [CrossRef] [Green Version]
- Preston, B.L.; Emma, Y.; Westaway, R.M. Putting vulnerability to climate change on the map: A review of approaches, benefits, and risks. Sustain. Sci. 2011, 6, 177–202. [Google Scholar] [CrossRef]
- Cutter, S.L. The vulnerability of science and the science of vulnerability. Ann. Assoc. Am. Geogr. 2003, 93, 1–12. [Google Scholar] [CrossRef]
- Adger, W.N.; Huq, S.; Brown, K.; Conwoy, D.; Hulme, M. Adaptation to climate change in the developing world. Prog. Dev. Stud. 2003, 3, 179–195. [Google Scholar] [CrossRef]
- Shah, K.U.; Dulal, H.B.; Johnson, C.; Baptiste, A. Understanding livelihood vulnerability to climate change: Applying the livelihood vulnerability index in Trinidad and Tobago. Geoforum 2013, 47, 125–137. [Google Scholar] [CrossRef]
- Ford, J.D.; Smit, B. A framework for assessing the vulnerability of communities in the Canadian Arctic to risks associated with climate change. Arctic 2004, 57, 389–400. [Google Scholar] [CrossRef]
- Deressa, T.T.; Hassan, R.M.; Ringler, C. Perception of and adaptation to climate change by farmers in the Nile basin of Ethiopia. IFPRI 2011, 149, 23–31. [Google Scholar] [CrossRef] [Green Version]
- Füssel, H.M.; Klein, R.J.T. Climate change vulnerability assessments: An evolution of conceptual thinking. Clim. Chang. 2006, 75, 301–329. [Google Scholar] [CrossRef]
- Huong, N.T.L.; Yao, S.B.; Fahad, S. Farmers’ perception, awareness and adaptation to climate change: Evidence from Northwest Vietnam. Int. J. Clim. Chang. Strateg. Manag. 2017, 9, 555–576. [Google Scholar] [CrossRef]
- Huong, N.T.L.; Bo, Y.S.; Fahad, S. Economic impact of climate change on agriculture using Ricardian approach: A case of northwest Vietnam. J. Saudi Soc. Agric. Sci. 2018, 18, 449–457. [Google Scholar] [CrossRef]
- Eakin, H.; Luers, A.L. Assessing the Vulnerability of Social-Environmental Systems. Annu. Rev. Environ. Resour. 2006, 31, 365–394. [Google Scholar] [CrossRef] [Green Version]
- UNISDR. Living With Risk: A Global Review of Disaster; 2004 Version; United Nations Office for Disaster Risk Reduction (UNISDR): Geneva, Switzerland, 2004; Volume 1. [Google Scholar]
- Juntunen, L. Addressing social vulnerability to hazards. Disaster Saf. Rev. 2005, 4, 3–10. [Google Scholar]
- Fahad, S.; Jing, W. Evaluation of Pakistani farmers’ willingness to pay for crop insurance using contingent valuation method: The case of Khyber Pakhtunkhwa province. Land Use Policy 2018, 72, 570–577. [Google Scholar] [CrossRef]
- Fahad, S.; Wang, J.; Hu, G.; Wang, H.; Yang, X.; Ahmad, A.; Thi, N.; Huong, L.; Bilal, A. Empirical analysis of factors influencing farmers crop insurance decisions in Pakistan: Evidence from Khyber Pakhtunkhwa province. Land Use Policy 2018, 75, 459–467. [Google Scholar] [CrossRef]
- Birkmann, J. Measuring Vulnerability to Promote Disaster-Resilient Societies: Conceptual Frameworks and Definitions. In Measuring Vulnerability to Natural Hazards: Towards Disaster Resilient Societies; Birkmann, J., Ed.; United Nations University Press: New York, NY, USA, 2006. [Google Scholar]
- Cutter, S.L.; Shirley, W.L.; Boruff, B.J. Social Vulnerability to Environmental Hazards. Soc. Sci. Q. 2003, 84, 242–261. [Google Scholar] [CrossRef]
- IPCC. Climate change 2007: Synthesis Report. In Contribution of Working Groups I. II and III to the fourth Assessment Report of the Intergovernmental Panel on Climate Change; IPCC: Geneva, Switzerland, 2007; p. 104. [Google Scholar]
- Pandey, R.; Jha, S.K. Climate vulnerability index—Measure of climate change vulnerability to communities: A case of rural Lower Himalaya, India. Mitig. Adapt. Strateg. Glob. Chang. 2012, 17, 487–506. [Google Scholar] [CrossRef]
- Adu, D.T.; Kuwornu, J.K.M.; Anim-Somuah, H.; Sasaki, N. Application of livelihood vulnerability index in assessing smallholder maize farming households’ vulnerability to climate change in Brong-Ahafo region of Ghana. Kasetsart J. Soc. Sci. 2018, 39, 22–32. [Google Scholar] [CrossRef]
- Aryal, S.; Cockfield, G.; Maraseni, T.N. Vulnerability of Himalayan transhumant communities to climate change. Clim. Chang. 2014, 125, 193–208. [Google Scholar] [CrossRef]
- Can, N.D.; Tu, V.H.; Hoanh, C.T. Application of livelihood vulnerability index to assess risks from flood vulnerability and climate variability—A case study in the Mekong delta of Vietnam. J. Environ. Sci. Eng. 2013, 2, 476–486. [Google Scholar]
- Madhuri, M.; Tewari, H.R.; Bhowmick, P.K. Livelihood vulnerability index analysis: An approach to study vulnerability in the context of Bihar. J. Disaster Risk Stud. 2014, 6, 1. [Google Scholar]
- Tjoe, Y. Measuring the livelihood vulnerability index of a dry region in Indonesia: A case study of three subsistence communities in West Timor. World J. Sci. Technol. Sustain. Dev. 2016, 13, 250–274. [Google Scholar] [CrossRef] [Green Version]
- Huong, N.T.L.; Yao, S.; Fahad, S. Assessing household livelihood vulnerability to climate change: The case of Northwest Vietnam. Hum. Ecol. Risk Assess. 2019, 25, 1157–1175. [Google Scholar] [CrossRef]
- Hinkel, J. Indicators of vulnerability and adaptive capacity: Towards a clarification of the science–policy interface. Glob. Environ. Chang. 2011, 21, 198–208. [Google Scholar] [CrossRef]
- Chambers, R.; Cornway, R.G. Sustainable Rural Livelihoods: Practical Concepts for the 21st Century; IDS Discussion Paper 296; Institute of Development Study: Brighton, UK, 1992; p. 33. [Google Scholar]
- DFID. Sustainable Livelihoods Guidance Sheets; Section 2; Department for International Development: London, UK, 1999; p. 26. [Google Scholar]
- Khajuria, A.; Ravindranath, N.H. Climate change vulnerability assessment: Approaches DPSIR framework and vulnerability index. J. Earth Sci. Clim. Chang. 2012, 3, 109. [Google Scholar] [CrossRef]
- Tripathi, A.; Vasan, A. Climate Change Vulnerability Assessment Framework for Sustainable River Basin Management; United Nations Development Programme in Belarus: Minsk, Belarus, 2014. [Google Scholar]
- Urothody, A.A.; Larsen, H.O. Measuring climate change vulnerability: A comparison of two indexes. Banko Janakari 2010, 20, 9–16. [Google Scholar] [CrossRef]
- Sullivan, C.A.; Meigh, J.R.; Fediw, T.S. Derivation and Testing of the Water Poverty Index Phase 1; Department for International Development (DFID): London, UK, 2002; Volume 1. [Google Scholar]
- UNDP. United Nations Development Programmes; UNDP: New York, NY, USA, 2007. [Google Scholar]
- Ahmed, H.; Khan, M.R.; Panadero-Fontan, R.; Lopez-Sández, C.; Iqbal, M.F.; Naqvi, S.M.S.; Qayyum, M. Geographical Distribution of Hypodermosis (Hypoderma sp.) in Northern Punjab, Pakistan. J. Fac. Vet. Med. Kafkas Univ. 2012, 18, A215–A219. [Google Scholar]
- Badar, H.; Ghafoor, A.; Adil, S.A. Factors affecting agricultural production of Punjab (Pakistan). Pakistan J. Agric. Sci. 2007, 44, 506–510. [Google Scholar]
- Chaudhry, I.S. Poverty Alleviation in Southern Punjab (Pakistan): An Empirical Evidence from the Project Area of Asian Development Bank. Int. Res. J. Financ. Econ. 2009, 23, 24–32. [Google Scholar]
- FBS. Poverty in the 1990s’ PIHS; Government of Pakistan: Islamabad, Pakistan, 2002.
- IFAD. Rural Poverty Report—2001: The Challenge of Ending Rural Poverty; Oxford University Press: Oxford, UK, 2001. [Google Scholar]
- Salik, K.M.; Qaisrani, A.; Umar, M.A.; Ali, S.M. Migration Futures in Asia and Africa: Economic Opportunities and Distributional Effects—The Case of Pakistan; Sustainable Development Policy Institute: Islamabad, Pakistan, 2017. [Google Scholar]
- DOI. Pre-Investment Study District Rahim Yar Khan. Directorate of Industries (DOI); Government of Punjab: Lahore, Pakistan, 2012. Available online: https://doi.punjab.gov.pk/system/files/RY%20Khan.pdf (accessed on 5 August 2019).
- DOI. Pre-Investment Study District Multan. Directorate of Industries (DOI); Government of Punjab: Lahore, Pakistan, 2012. Available online: https://doi.punjab.gov.pk/system/files/Multan.pdf (accessed on 5 August 2019).
- DOI. Pre-Investment Study District Bhakkar. Directorate of Industries (DOI); Government of Punjab: Lahore, Pakistan, 2012. Available online: https://doi.punjab.gov.pk/system/files/Bhakkar_6.pdf (accessed on 5 August 2019).
- DOI. Pre-Investment Study District D.G Khan. Directorate of Industries (DOI); Government of Punjab: Lahore, Pakistan, 2012. Available online: https://doi.punjab.gov.pk/system/files/DG%20Khan_0.pdf (accessed on 5 August 2019).
- World Bank. Economic of Adaptation to Climate Change: Social Synthesis Report; World Bank: Washington, DC, USA, 2010; Available online: www.ghanadistricts.com (accessed on 5 August 2019).
- Thomas, D.; Osbahr, H.; Twyman, C.; Adger, N.; Hewitson, B. Adaptive: Adaptations to Climate Change Amongst Natural Resource-Dependant Societies in the Developing World: Across the Southern African Climate Gradient; Tyndall Centre for Climate Change Research Technical Report No. 35; University of Oxford: Oxford, UK, 2005. [Google Scholar]
- Armah, F.A.; Yawson, D.O.; Yengoh, G.T.; Odoi, J.O.; Afrifa, E.K.A. Impact of floods on livelihoods and vulnerability of natural resource dependent communities in Northern Ghana. Water 2010, 2, 120–139. [Google Scholar] [CrossRef] [Green Version]
- Castle, E.N. Social capital: An interdisciplinary concept. Rural Sociol. 2002, 67, 331–349. [Google Scholar] [CrossRef]
- Pelling, M.; High, C. Understanding adaptation: What can social capital offer assessments of adaptive capacity? Glob. Environ. Chang. 2005, 15, 308–319. [Google Scholar] [CrossRef]
- Eakin, H.; Bojorquez-Tapia, L.A. Insights into the Composition of Household Vulnerability from Multicriteria Decision Analysis. Glob. Environ. Chang. 2008, 18, 112–127. [Google Scholar] [CrossRef]
- Connolly-Boutin, L.; Smit, B. Climate change, food security, and livelihoods in Sub-Saharan Africa. Reg. Environ. Chang. 2015, 16, 385–399. [Google Scholar] [CrossRef] [Green Version]
- Van der Berg, S. Education, Poverty and Inequality in South Africa. In Paper to the Conference of the Centre for the Study of African Economies, on Economic Growth and Poverty in Africa; University of Stellenbosch: Oxford, UK, 2002; pp. 1–26. [Google Scholar]
- Gebru, G.W.; Beyene, F. Rural Household Livelihood Strategies in Drought-rone Areas: A Case of Gulomekeda District, Eastern Zone of Tigray National Regional State, Ethiopia. J. Stored Prod. Postharvest Res. 2012, 3, 87–97. [Google Scholar]
- Aasoglenang, A.T.; Bonye, S.Z. Rural Livelihoods Diversity: Coping Strategies in Wa West District in Northern Ghana. Eur. Sci. J. 2013, 9, 139–155. [Google Scholar]
- Elahi, E.; Zhang, L.; Abid, M.; Altangerel, O.; Bakhsh, K.; Uyanga, B.; Ahmed, U.I.; Xinru, H. Impact of Balance Use of Fertilizers on Wheat Efficiency in Cotton Wheat Cropping System of Pakistan. Int. J. Agric. Innov. Res. 2015, 3, 1369–1373. [Google Scholar]
- Kalinda, T. Multiple Shocks and Risk Management Strategies among Rural Households in Zambia’s Mazabuka District. J. Sustain. Dev. 2014, 7, 52. [Google Scholar] [CrossRef]
- Norris, P.E.; Batie, S.S. Virginia farmers, soil conservation decisions: An application of Tobit analysis. South. J. Agric. Econ. 1987, 19, 79–90. [Google Scholar] [CrossRef] [Green Version]
- Hsueh, S.L.; Su, F.L. Discussion of Environmental Education Based on the Social and Cultural Characteristics of the Community—An MCDM Approach. Appl. Ecol. Environ. Res. 2017, 15, 183–196. [Google Scholar] [CrossRef]
- Elahi, E.; Abid, M.; Zhang, L.; Ghulam, J.; Sahito, M. Agricultural advisory and fi nancial services; farm level access, outreach and impact in a mixed cropping district of Punjab, Pakistan. Land Use Policy 2018, 71, 249–260. [Google Scholar] [CrossRef]
- Chang-Richards, A.Y.; Seville, E.; Wilkinson, S.; Walker, B. Building Natural Disaster Response Capacity: Sound Workforce Strategies for Recovery and Reconstruction; Asia Pacific Economic Cooperation Secretariat (APEC): Singapore, 2013. [Google Scholar]
- Food and Agriculture Organizations of the United Nations (FAO). The Impact of Disasters on Agriculture and Food Security; FAO: Rome, Italy, 2015. [Google Scholar]
- FAO. Food and Agriculture Organizations of the United Nations, Fiji: Tropical Cyclone Winston Situation Report—16 March 2016; Central Emergency Response Fund and FAO: Brussels, Belgium, 2016. [Google Scholar]
- Ahmad, M.I.; Ma, H. An investigation of the targeting and allocation of post-flood disaster aid for rehabilitation in Punjab, Pakistan. Int. J. Disaster Risk Reduct. 2020, 44, 101402. [Google Scholar] [CrossRef]
- Potter, S.H.; Becker, J.S.; Johnston, D.M.; Rossiter, K.P. An overview of the impacts of the 2010–2011 Canterbury earthquakes. Int. J. Disaster Risk Reduct. 2015, 14, 6–14. [Google Scholar] [CrossRef] [Green Version]
- Weldegebriel, Z.B.; Amphune, B.E. Livelihood resilience in the face of recurring floods: An empirical evidence from Northwest Ethiopia. Geo Environ. Disasters 2017, 4, 10. [Google Scholar] [CrossRef] [Green Version]
- Tran, T.A.; Tran, P.; Tuan, T.; Hawley, K. Review of Housing Vulnerability. Implications for Climate Resilient Houses. Discussion Paper Series Sheltering from a Gathering Storm; Institute for Social and Environmental Transition—International (ISET International): Boulder, CO, USA, 2012; p. 10. [Google Scholar]
- Dhakal, C.K.; Regmi, P.P.; Dhakal, I.P.; Khanal, B.; Bhatta, U.K. Livelihood vulnerability to climate change based on agro ecological regions of Nepal. Glob. J. Sci. Res. 2013, 13, 47–53. [Google Scholar]
- Hallegatte, S. Strategies to adapt to an uncertain climate change. Glob. Environ. Chang. 2009, 19, 240–247. [Google Scholar] [CrossRef]
- Adger, W.N. Social Capital, Collective Action, and Adaptation to Climate Change. In Der Klimawandel; VS Verlag fur Sozialwis-Senschaften: Springer, 2010; pp. 327–345. [Google Scholar]
- Syngenta. Agricultural Extension, Improving the Livelihood of Smallholder Farmers. 2014. Available online: www.syngentafoundation.org/index.cfm?pageID=594 (accessed on 5 May 2019).
- Swanson, B.; Claar, J. The History and Development of Agricultural Extension. In Agricultural Extension: A Reference Manual; Swanson, B.E., Ed.; Food and Agricultural Organization of the United Nations: Rome, Italy, 1984. [Google Scholar]
- Ghimire, Y.N.; Shivakoti, G.P.; Perret, S.R. Household-level vulnerability to drought in hill agriculture of Nepal: Implications for adaptation planning. Int. J. Sustain. Dev. World Ecol. 2010, 17, 225–230. [Google Scholar] [CrossRef]
- Cobbinah, P.B.; Black, R.; Thwaites, R. Dynamics of Poverty in Developing Countries: Review of Poverty Reduction Approaches. J. Sustain. Dev. 2013, 6, 25. [Google Scholar] [CrossRef] [Green Version]
- Bebbington, A. Capitals and capabilities: A framework for analyzing peasant viability, rural livelihoods and poverty. World Dev. 1999, 27, 2021–2044. [Google Scholar] [CrossRef]
- Dorward, A.; Anderson, S.; Bernal, Y.N.; Vera, E.S.; Rushton, J.; Pattison, J.; Paz, R. Hanging in, stepping up and stepping out: Livelihood aspirations and strategies of the poor. Dev. Pract. 2009, 19, 240–247. [Google Scholar] [CrossRef] [Green Version]
- Uy, N.; Takeuchi, Y.; Shaw, R. Local adaptation for livelihood resilience in Albay, Philippines. Environ. Hazards 2011, 10, 139–153. [Google Scholar] [CrossRef]
- IPCC. Managing the Risks of Extreme Events and Disasters to Advance Climate Change Adaptation; A Special Report of Working Groups I and II of the Intergovernmental Panel on Climate Change; Field, C.B., Barros, V., Stocker, T.F., Qin, D., Dokken, D.J., Ebi, K.L., Eds.; IPCC: Cambridge, UK, 2012. [Google Scholar]
- IPCC. Summary for Policymakers. In Managing the Risks of Extreme Events and Disasters to Advance Climate Change Adaptation; A Special Report of Working Groups I and II of the Intergovernmental Panel on Climate Change; Field, C.B., Barros, V., Stocker, T.F., Eds.; Cambridge University Press: Cambridge, UK; New York, NY, USA, 2012. [Google Scholar]
- Cardona, O.D.; van Aalst, M.K.; Birkmann, M.J.; Fordham, G.; McGregor, R.; Perez, R.S.; Pulwarty, E.L.F.; Schipper, S.; Sinh, B.T. Determinants of Risk: Exposure and vulnerability. In Managing the Risks of Extreme Events and Disasters to Advance Climate Change Adaptation; A Special Report of Working Groups I and II of the Intergovernmental Panel on Climate Change; Field, C.B., Ba, V., Eds.; Cambridge University Press: Cambridge, UK; New York, NY, USA, 2012. [Google Scholar]
- Schneider, S.H.; Semenov, S.; Patwardhan, A.; Burton, I.; Magadza, C.H.D.; Oppenheimer, M.; Pittock, A.B.; Rahman, A.; Smith, J.B.; Suarez, A.; et al. Assessing Key Vulnerabilities and the Risk from Climate Change. In Climate Change 2007: Impacts, Adaptation and Vulnerability. Contribution of Working Group II to the Fourth Assessment Report of the Intergovernmental Panel on Climate Change; Parry, M.L., Ed.; Cambridge University Press: Cambridge, UK; New York, NY, USA, 2007. [Google Scholar]
- Lavell, A.M.; Oppenheimer, C.; Diop, J.; Hess, R.; Lempert, J.; Li, R.; Muir-Wood, M.S. Climate Change: New Dimensions in Disaster Risk, Exposure, Vulnerability, and Resilience. In Managing the Risks of Extreme Events and Disasters to Advance Climate Change Adaptation. A Special Report of Working Groups I and II of the Intergovernmental Pan; Cambridge University Press: Cambridge, UK; New York, NY, USA, 2012. [Google Scholar]
- UNISDR. Global Assessment Report on Disaster Risk Reduction; United Nations Office for Disaster Reduction (UNISDR): Geneva, Switzerland, 2011; p. 178. [Google Scholar]
- UNISDR. Global Assessment Report on Disaster Risk Reduction 2013; United Nations Office for Disaster Reduction (UNISDR): Geneva, Switzerland, 2013; p. 288. [Google Scholar]
- Birkmann, J.; Seng, D.C.; Suarez, D. Adaptive Disaster Risk Reduction Enhancing Methods and Tools of Disaster Risk Reduction in the Light of Climate Change; German Committee for Disaster Reduction, Ed.; DKKV Publication Series 43; German Committee for Disaster Reduction (DKKV): Bonn, Germany, 2011. [Google Scholar]
- Leichenko, R.M.; O’Brien, K.L. Environmental Change and Globalization: Double Exposures; Oxford University Press: New York, NY, USA, 2008; p. 192. [Google Scholar]
- O’Brien, K.L.; Sygna, R.; Leichenko, W.N.A.; Barnett, J.; Mitchell, T.; Schipper, L.; Tanner, T.; Vogel, C.; Mortreux, C. Disaster Risk Reduction, Climate Change Adaptation and Human Security. Report prepared for the Royal Norwegian Ministry of Foreign Affairs by the Global Environmental Change and Human Security (GECHS) Project, GECHS Report 2008:3; University of Oslo: Oslo, Norway, 2008. [Google Scholar]
- Kienberger, S. Spatial modelling of social and economic vulnerability to floods at the district level in Búzi, Mozambique. Nat. Hazards 2012, 64, 2001–2019. [Google Scholar] [CrossRef]
- Birkmann, J.O.; Cardona, M.; Carreño, A.; Barbat, M.; Pelling, S.; Schneiderbauer, S.; Kienberger, M.; Keiler, D.; Alexander, D.; Zeil, P. Framing vulnerability, risk and societal responses: The MOVE framework. Nat. Hazards 2013, 67, 193–211. [Google Scholar] [CrossRef]
- Warner, K.; van der Geest, K.; Kreft, S.; Huq, S.; Harmeling, S.; Kusters, K.; de Sherbinin, A. Evidence from the Frontlines of Cimate Change: Loss and Damage to Communities Despite Coping and Adaptation. Loss and Damage in Vulnerable Countries Initiative, UNU Policy Report 9; United Nations University Institute for Environment and Human Security (UNU-EHS): Bonn, Germany, 2012. [Google Scholar]
- Renaud, F.; Birkmann, J.; Damm, M.; Gallopín, G. Understanding multiple thresholds of coupled social-ecological systems exposed to natural hazards as external shocks. Nat. Hazards 2010, 55, 749–763. [Google Scholar] [CrossRef]
- Menkhaus, K. Stabilisation and humanitarian access in a collapsed state: The Somali case. Disasters 2010, 34, 320–341. [Google Scholar] [CrossRef] [PubMed]
- Rinaldi, S.M.; Peerenboom, J.P.; Kelly, T. Identifying, understanding, and analyzing critical infrastructure interdependencies. IEEE Control Syst. Mag. 2011, 21, 11–25. [Google Scholar]
- Wang, S.; Hong, L.; Chen, X. Vulnerability analysis of interdependent infrastructure systems: A methodological framework. Phys. A Stat. Mech. Its Appl. 2012, 391, 3323–3335. [Google Scholar] [CrossRef]
- Atzl, A.; Keller, S.; Atzl, A.; Keller, S. A systemic Approach for the Analysis of Infrastructurespecific Social Vulnerability. In From Social Vulnerability to Resilience: Measuring Progress towards Disaster Risk Reduction; Cutter, S.L., Corendea, C., Eds.; SOURCE No. 17; United Nations University Institute for Environment and Human Security: Bonn, Germany, 2013; pp. 27–43. [Google Scholar]
- Copeland, C. Hurricane-Damaged Drinking Water and Wastewater Facilities: Impacts, Needs, and Response. CRS Report for Congress, RS22285; Congressional Research Service (CRS): Washington, DC, USA, 2005; p. 6. [Google Scholar]
- Reed, D.A.; Powell, M.D.; Westerman, J.M. Energy infrastructure damage analysis for hurricane Rita. Nat. Hazards Rev. 2010, 11, 102–109. [Google Scholar] [CrossRef]
Figure 1.
Map of Pakistan with study districts and province.

Figure 2.
Selection of sample households.

Figure 3.
Vulnerability spider diagram of major components of LVI for BHK, DGK, RYK, and MLT districts.
Figure 3.
Vulnerability spider diagram of major components of LVI for BHK, DGK, RYK, and MLT districts.
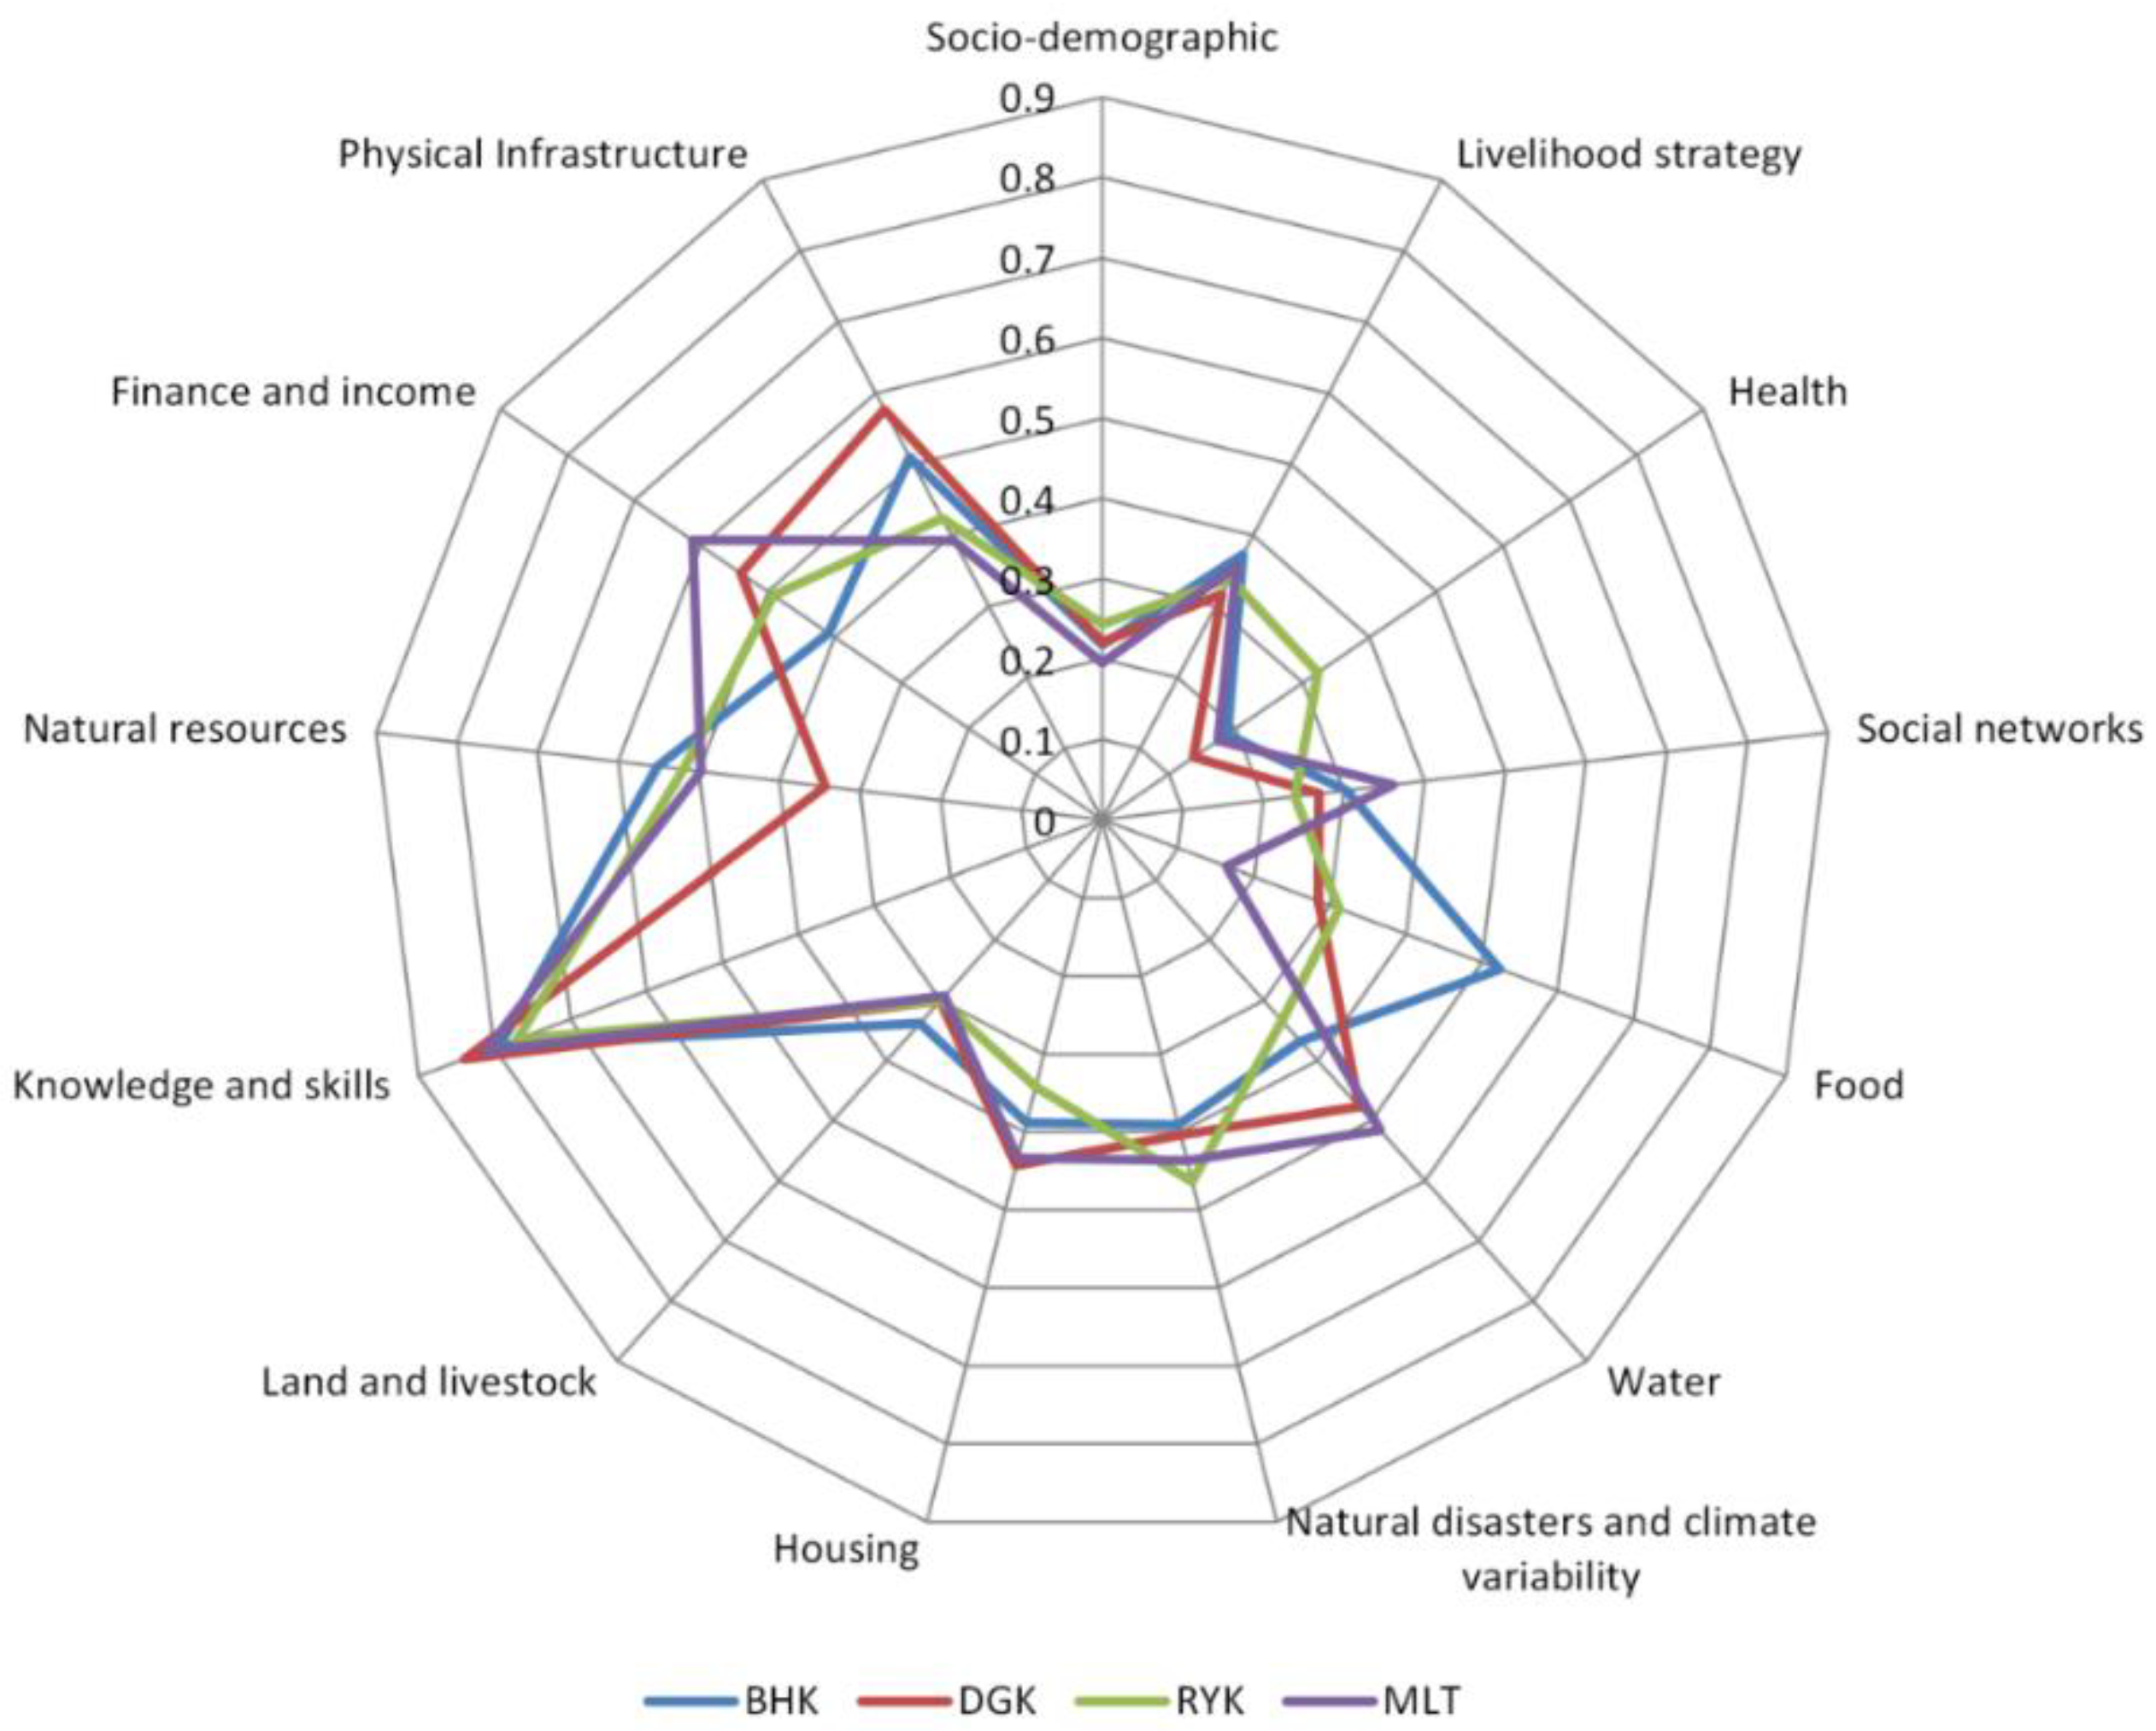
Figure 4.
Vulnerability triangle diagram of contributing factors of LVIIPPC across districts.

Figure 5.
Vulnerability diagram of five types of capital for BHK, DGK, RYK, and MLT districts.
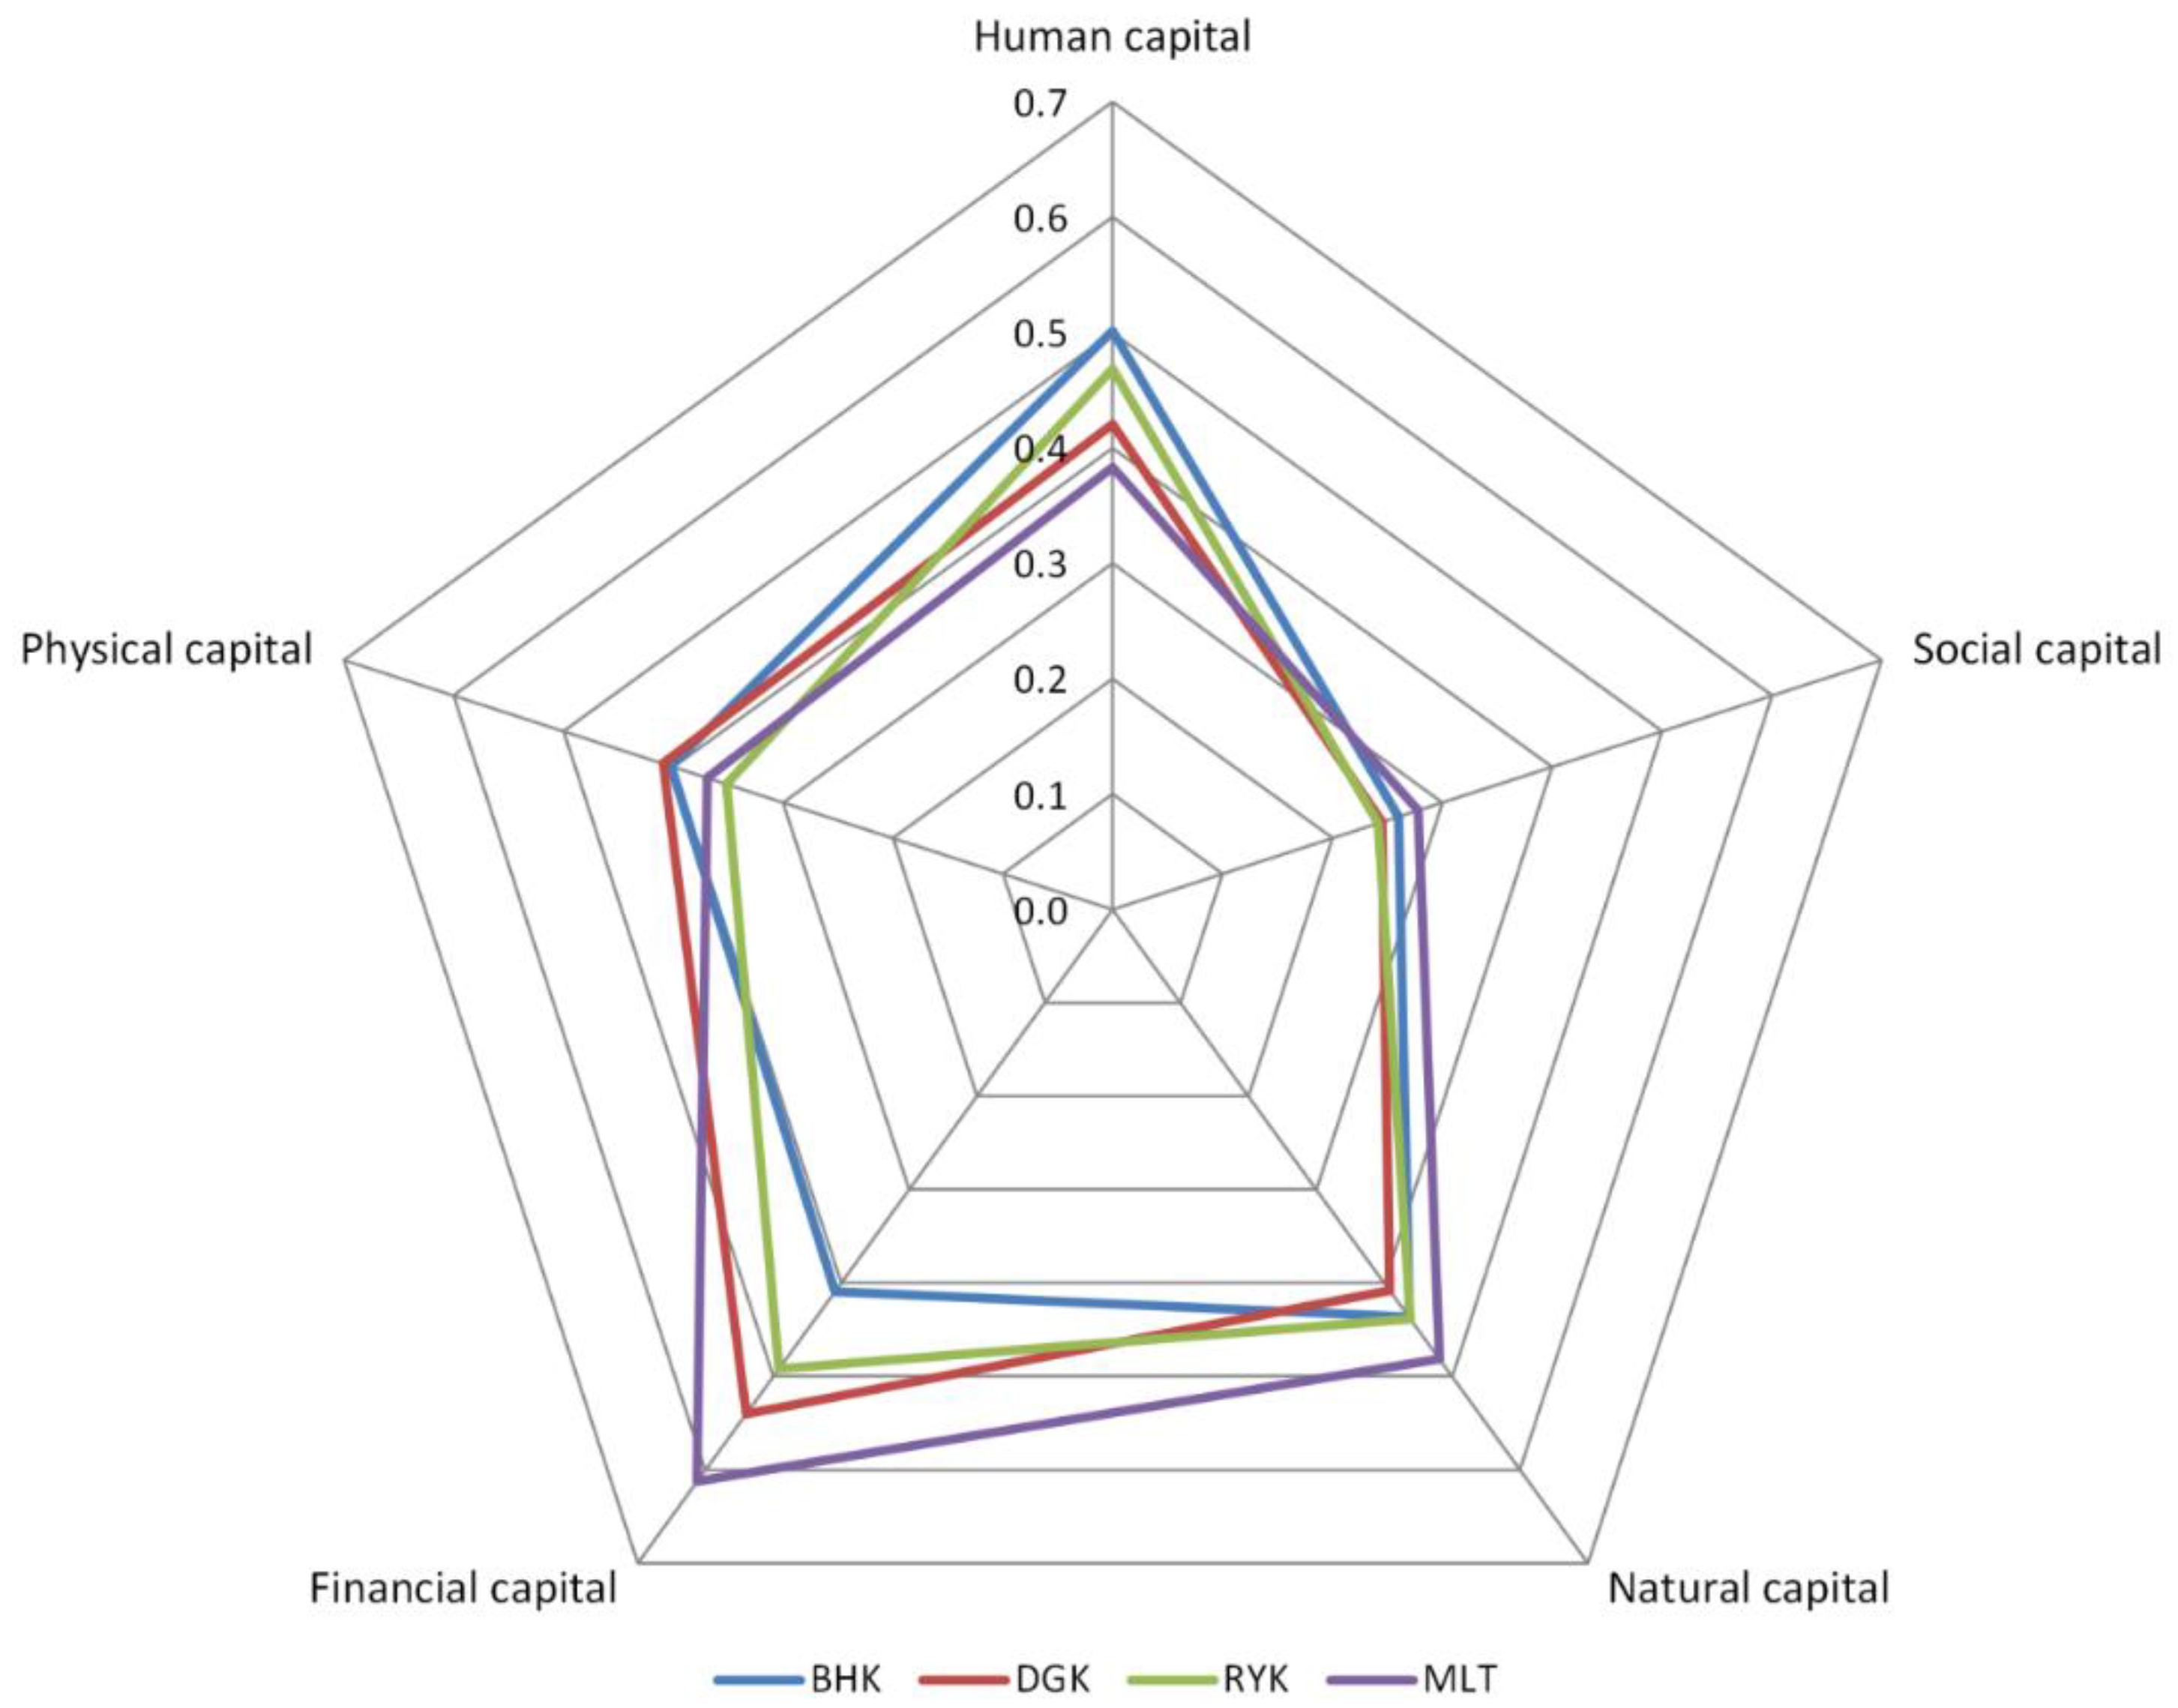
Table 1.
Contributing factors to major vulnerability components for Intergovernmental Panel on Climate Change livelihood vulnerability index (LVIIPCC) estimation.
Table 1.
Contributing factors to major vulnerability components for Intergovernmental Panel on Climate Change livelihood vulnerability index (LVIIPCC) estimation.
| Contributing Factor | Major Components |
|---|---|
| Adaptive capacity | Socio-demographic, livelihood strategy, social network, knowledge and skills, finance and income, infrastructure, and natural resources |
| Sensitivity | Health, food, water, housing, and land |
| Exposure | Natural disasters and climate variability |
Table 2.
Study area and sample size from each district.
| District | Union Council | Sample Size |
|---|---|---|
| Bhakkar | Notak, Chak 061ML, Khansar, and Baranga | 112 |
| Dera Ghazi Khan | Choti Zareen, Tuman Leghari, Sakhi Sarwar, Gadai, and Morjhangi | 108 |
| Rahim Yar Khan | Chak 46 ABS, Dashti, Jetha Bhutta, and Latki | 107 |
| Multan | Lal Wah, Ghazi Pur, Ghazi Pur Pir Wala, Botte Wala, and Mianpur Bailey Wala | 111 |
| Total | 18 | 438 |
Table 3.
LVI values of major components and overall LVI. BHK, Bhakkar; DGK, Dera Ghazi Khan; RYK, Rahim Yar Khan; MLT, Multan.
Table 3.
LVI values of major components and overall LVI. BHK, Bhakkar; DGK, Dera Ghazi Khan; RYK, Rahim Yar Khan; MLT, Multan.
| Major Components | BHK | DGK | RYK | MLT |
|---|---|---|---|---|
| Health (M1) | 0.186 | 0.137 | 0.322 | 0.173 |
| Social networks (M2) | 0.302 | 0.269 | 0.238 | 0.360 |
| Socio-demographic (M3) | 0.218 | 0.220 | 0.244 | 0.194 |
| Food (M4) | 0.523 | 0.285 | 0.312 | 0.164 |
| Knowledge and skills (M5) | 0.793 | 0.839 | 0.770 | 0.811 |
| Water (M6) | 0.368 | 0.477 | 0.334 | 0.516 |
| Natural disasters and climate variability (M7) | 0.391 | 0.404 | 0.463 | 0.431 |
| Natural resources (M8) | 0.551 | 0.343 | 0.518 | 0.497 |
| Livelihood strategy (M9) | 0.373 | 0.317 | 0.339 | 0.357 |
| Housing (M10) | 0.387 | 0.442 | 0.342 | 0.433 |
| Land and livestock (M11) | 0.337 | 0.301 | 0.300 | 0.292 |
| Infrastructure (M12) | 0.509 | 0.576 | 0.424 | 0.392 |
| Finance and income (M13) | 0.409 | 0.540 | 0.491 | 0.612 |
| Overall LVI | 0.378 | 0.364 | 0.363 | 0.376 |
Table 4.
Results of LVIIPCC contributing factors.
| Contributing Factors | BHK | DGK | RYK | MLT |
|---|---|---|---|---|
| Adaptive capacity | 0.388 | 0.378 | 0.375 | 0.402 |
| Sensitivity | 0.369 | 0.331 | 0.321 | 0.321 |
| Exposure | 0.464 | 0.382 | 0.310 | 0.361 |
| LVIIPCC | 0.028 | 0.001 | –0.021 | –0.013 |
Table 5.
LEI results of major components in different indices.
| Capital Indicator | BHK | DGK | RYK | MLT |
|---|---|---|---|---|
| Human capital | 0.501 | 0.421 | 0.468 | 0.383 |
| Social capital | 0.260 | 0.245 | 0.242 | 0.278 |
| Natural capital | 0.437 | 0.408 | 0.439 | 0.482 |
| Finance capital | 0.409 | 0.540 | 0.492 | 0.613 |
| Physical capital | 0.402 | 0.409 | 0.352 | 0.369 |
| Overall LEI | 0.412 | 0.396 | 0.392 | 0.403 |
© 2020 by the authors. Licensee MDPI, Basel, Switzerland. This article is an open access article distributed under the terms and conditions of the Creative Commons Attribution (CC BY) license (http://creativecommons.org/licenses/by/4.0/).
Share and Cite
MDPI and ACS Style
Ahmad, M.I.; Ma, H. Climate Change and Livelihood Vulnerability in Mixed Crop–Livestock Areas: The Case of Province Punjab, Pakistan. Sustainability 2020, 12, 586. https://doi.org/10.3390/su12020586
AMA Style
Ahmad MI, Ma H. Climate Change and Livelihood Vulnerability in Mixed Crop–Livestock Areas: The Case of Province Punjab, Pakistan. Sustainability. 2020; 12(2):586. https://doi.org/10.3390/su12020586
Chicago/Turabian StyleAhmad, Muhammad Irshad, and Hengyun Ma. 2020. "Climate Change and Livelihood Vulnerability in Mixed Crop–Livestock Areas: The Case of Province Punjab, Pakistan" Sustainability 12, no. 2: 586. https://doi.org/10.3390/su12020586
Note that from the first issue of 2016, this journal uses article numbers instead of page numbers. See further details here.