Trade Imports Increasingly Contribute to Plant Nutrient Inputs: Case of the Finnish Food System 1996–2014


1
Department of Agricultural Sciences, University of Helsinki, P.O. Box 27, 00014 Helsinki, Finland
2
Ruralia Institute, University of Helsinki, Lönnrotinkatu 7, 50100 Mikkeli, Finland
*
Author to whom correspondence should be addressed.
Sustainability 2020, 12(2), 702; https://doi.org/10.3390/su12020702
Submission received: 29 November 2019
/
Revised: 8 January 2020
/
Accepted: 15 January 2020
/
Published: 18 January 2020
Abstract
:In Finland, while total agricultural production has remained relatively constant, nutrient input from industrial mineral fertilizers has declined over the past 20 years, which has been the target of environmental policies due to eutrophication risks. From 1996 to 2014, the use of nitrogen (N) declined by 18%, phosphorus (P) by 49%, and potassium (K) by 49%. However, at the same time, the international agricultural products trade has increased dramatically by mass (58%), and Finland has increased imports of food and feed products, such as, protein feeds, vegetables, and fruits. We analyzed the nutrient contents of foreign trade from 1996 to 2014 by using a substance flow analysis. We discovered that, when comparing nutrients contained in trade to the use of fertilizers, the trade of food and feed accounts for more than one-third (40%) of the fertilizer input to the Finnish food system. In 2014, 53 Gg of N, 8 Gg of P, and 15 Gg of K were imported due to trade, equating to 35%, 70%, and 45%, respectively, compared to the use of fertilizers in the food system. Declines in fertilizer inputs to crop production are partially offset by flows of plant nutrients from feed imports. In formulating agri-environmental policies targeting nutrient loading, more attention should be paid to national imports–export balances and, especially, to the spatial distribution of flows in feed trade.
Keywords:
substance flow analysis; Baltic Sea; trade; eutrophication; agriculture; animal productionHighlights:
- Trade is a significant material flow that transports nutrients between countries within the food and feed products.
- The net flow of nitrogen, phosphorus, and potassium has grown to Finland from 35%, 30%, and 30% over 1996–2014.
- In the period, the cumulative net balance of nutrients contained in trade (419 Gg nitrogen) is of the same magnitude as the reductions in nitrogen fertilizer use (449 Gg nitrogen).
- The trade balance of plant nutrients in animal feeds needs to be included in the assessment of nutrient loading potentials.
1. Introduction
Nitrogen (N), phosphorus (P), and potassium (K) are macronutrients that are basic elements, often limiting the growth of primary production in ecosystems. Baseline natural nutrient cycles provide key ecosystem inputs. However, for agricultural production purposes, these inputs have been significantly increased by human-induced action. As an example of scale, it is estimated that the human modification of the N cycle globally is almost half, 210 Tg (teragrams) N year−1, of the total 413 Tg of reactive N in the geophysical N cycle [1]. It is suggested that the human economy oversteps the boundary of the sustainable use of N nearly two-fold and that the planet has entered a new geological era, the Anthropocene, where human activity is a major driving force in geophysical cycles of inputs that are crucial to ecosystems [2,3,4,5]. The two greatest pathways by magnitude to convert N to its reactive form are N fixed industrially and N fixed by leguminous crops, which are primarily used in agriculture for their fertilizing effect. The local and global growth of agricultural nutrient inputs drive considerable changes in freshwater ecosystems [6]. It has been stated that over the coming decades there will not be a shortage of plant nutrients [7,8]; even phosphorus is estimated to suffice in 200 to 1000 years [9]. Instead, leakages of nutrients in the forms of loading to waterways and, in the case of N, emissions to the air, will remain the main concerns [6].
Excessive nutrient leakage leads to eutrophication, which can be characterized as a local or regional environmental degradation where a waterbody is enriched by dissolved nutrients. These can modify the local ecosystem and ultimately lead to the depletion of dissolved oxygen by the excess growth of aquatic plant life [10]. Eutrophication is a global environmental issue with local and regional impacts. Already in 2013, there were 762 globally reported cases of eutrophication, hypoxia, or algae blooms [11,12]. Excess nutrients are regional and local issues, and it is essential to analyze and address these issues with regional and local contexts. In the Baltic Sea, the losses from production systems to the watershed has caused an ecosystem change. In this watershed, human actions have been the leading causes of environmental degradation for the last 50 years; for example, the oxygen-deficient area has expanded from 5000 km2 to 60,000 km2, despite continuous efforts to minimize further nutrient loads in the last two decades [13,14,15].
The current level of nutrient leakage is over the boundary of the sustainable use of nutrients in Finland and the Baltic Sea region. The eutrophication of the Baltic Sea was noted in the early 1980s, which was, in part, because of anthropogenic nutrient loading [16]. In 1988, actions to reduce nutrient loading in the order of magnitude 50% reduction were decided by Helsinki Commission (HELCOM) Ministerial Declaration. In 2007–2011 eutrophication assessment, the open Baltic Sea was in an unacceptable eutrophication status and also the Bothnia Bay was classified to be affected by eutrophication [15]. In order to reduce nutrient loading, several policies, such as the Finnish Agri-Environmental Programs (FAEP) in 1995, the Nitrates Directive (91/676/EEC), the Water Framework Directive (2000/60/EC) and the EU Fertilizing Products Regulation (2019/1009) for agriculture, were introduced. For example, since the 1970s, the maximum allowed P use had been reduced from 60 to 30 kg ha−1 today [17]. The national sewage treatment discharge legislation “Vesioikeuden jätevesienlaskulupa” (SDK 264/1961) and later SDK 587/2011, which is more stringent than EU Water Framework Directive 2000/60/EC, was a key restriction to industry and water treatment facilities. Despite these successful policies, the actual total nutrient load has not yet reached the targets [18,19].
Agricultural nutrient losses remain a significant nutrient input to the Baltic Sea. In 2000−2010, the estimated load in the Baltic Sea for Finland averaged 77 Gg N year−1 and 3 Gg P year−1, respectively, of which 5% of N and P was from waterborne point source discharge [19]. For agricultural nutrient losses embedded in the total load, there is considerable uncertainty, because the direct measurement of nutrient losses is impractical, as the losses are non-point sources and many unknowns persist. However, current trade statistics offer a way of measuring input flows over the border of countries, which allows detailed analysis of the movement of nutrient inputs and outputs by trade over time.
Finland is one of the most Northern countries (between 60° N and 70° N latitudes), where agricultural production can provide its citizens most of the agricultural products used in consumption. An overview of Finnish agriculture and forestry can be found, for example [20,21,22]. Despite the relatively high level of self-sufficiency of agricultural products in Finland, there has been a growing trend of importing food and feed products, and a trade gap exists between imports and exports. The first assessment was based on data from 1995–1999 by Antikainen et al. 2005 [21], but since 1995 Finland joined the EU, which led to increasing agricultural trade. For example, in 2007–2011, Finland imported 188,000 tons of soybeans and 245,000 tons of rapeseed [23], and in total about 30% of all food was imported, and exports remained lower than imports [24]. Since over 70% of agriculture trade, measured by nitrogen, is feed for animals, it is possible to pinpoint the eutrophication risk areas by agriculture with the help of additional data on the distribution of feed use throughout the country. However, manure nutrients themselves are not a problem if there is enough agricultural land to utilize manure for fertilization. Furthermore, a time series analysis can offer insight on both historical and current situation, and possible future trends for policy considerations.
The present paper aims to assess the contribution of the trade of food and feed products as nutrient inputs to the Finnish food system from 1996 to 2014. Our goals are (i) to analyze trends and assess the importance of trade of food products as a carrier for nutrient inputs; (ii) to quantify the import and export and net flows of nitrogen, phosphorus, and potassium by sub-groups; (iii) to illustrate the spatial distribution of nutrients from imported feeds in animal manure. Understanding the contribution of the imported nutrients helps us to understand total nutrient inputs to the Finnish food production system and to focus actions on areas where possibilities of reducing non-point source nutrients remain.
2. Materials and Methods
2.1. System Description
A system is a group of interacting units that form a unified entity, which is limited by defined system borders. In this study, the system borders were the geographical borders of Finland, and within Finland, the food system. Here, the food system was defined as a system that includes domestic agricultural production and the trade of food and feed (Figure 1). It was assumed that all the nutrients reported as fertilizer use were used to fertilize the agricultural land. The domestic production of industrial mineral fertilizers, such as 877 Gg P-rock, was mined for utilization in 2013 [25], which are mostly exported, were not included in the system as these bypass the Finnish agri-food system.
A distinction was made between primary nutrients and secondary nutrients, which reflect the long-term and short-term cycling times [26,27]. Primary nutrients are virgin minerals due their geological cycle of millions of years. Secondary nutrients are organic materials in the food system. However, here, imported secondary nutrients were considered as primary nutrient inputs because they increase the total input nutrients available inside the system boundaries of the Finnish agri-system. This distinction is important. Secondary nutrients, such as manure, that are produced within the Finnish agricultural system are circulated primary nutrients embedded in the organic materials within the system. However, with trade, new nutrients are introduced to the system, and, respectively, exported products exit the system. Intentional biological nitrogen fixation was omitted because it is estimated to be less than 4% of total nutrients, approximately 5.0 kg N ha−1 y−1 [28].
2.2. Data and Calculation Methods
The flows were divided into different categories using the United Nations Comtrade Standard International Trade Classification (SITC5) (divisions 00-09, 11, 22 and 291), which were selected to include food, feed, and pet food divisions to the Finnish food system (FFS). SITC statistical classification describes trade by different level categories from largest to smallest: division, groups, subgroups, and basic headings, respectively. Animal products that are not food products were not included, such as furs and animal skins. Basic headings that could not be parametrized due to heterogeneity were not included (3% of total mass flow). Additionally, classes with a minimal quantity were not included. The excluded classes were also initially calculated to be low in volume and in nutrient content, which, in the end, resulted in 326 basic headings being included. By including more basic headings than in previous assessments [20,21], increased accuracy was targeted. The chosen unit was Gg of nutrients for nitrogen (N), phosphorus (P), and potassium (K). The P205 was converted to elemental phosphorus by dividing by 2.2915. The K2O was converted to elemental potassium by dividing by 1.2046. The elemental substance flow analysis is the standard method and it enabled comparisons to previous studies [20,21,29].
The principal method was substance flow analysis (SFA) [30,31,32]. In SFA, a defined common unit of substance is used to analyze mass flows utilizing the mass balance principle. In this study, the N, P, and K units were used to form a time series of the flows of nutrients in food and feed and to analyze trends over the past two decades. The baseline year was 1996 for the nutrient use level for cumulative comparisons. The net balance of import and export flows in traded food and feed is compared to the use of N, P, and K as fertilizer inputs in Finnish agriculture [33,34].
Quantifying trade nutrients is a four-step process (Figure 2). (1) The export and import data used in the study were derived from the Finnish foreign trade statistics, 1996–2014 [35]. As the classification has changed over time, the data were modified to fit the SITC statistical classification of current statistical classes (SITC rev. 4) per the guides by the Finnish foreign trade statistics and United Nations conversion and correspondence tables. Then, data were consolidated from a monthly to yearly format. (2) Parameter tables that include the nutrient content factors were formed from databases and literature [36,37,38,39]. (3) An uncertainty analysis was done for the individual SITC classes and the lower and upper bounds of nutrient content were formed [40,41]. (4) Confidence intervals for quantified nutrients were formed for the time series. The net balance describes the potential deficit or surplus of the Finnish food system from the trade of food and feed for N, P, and K without fertilizers. The net balance from food and feed trade for each nutrient was calculated as (Equation (1)). Balances were classified hierarchically in division, group, subgroups, and basic heading levels according to SITC5 classification.
The net balance of food and feed trade for each nutrient was calculated, as shown in Equation (1):
Net balance of nutrients 95% conf. = import flow − export flow ± uncertainty
Lastly, to illustrate the spatial distribution of imported feeds, the nutrient content distribution of manure was calculated. National averages of farm animal excretion rates [42] were multiplied by areal animal densities for each animal species [43] to calculate estimates by the municipality, of which there were 320 in 2014. These total excreta values were then transformed to the availability of nutrients per hectare of agricultural area by municipality [34]. The ex-housing manure N and P output contents, where losses were not factored in, were directly compared to the feed input N contents. The division of feed N to utilized N, N2O, and NH3 losses, erosion risk, and leaching were beyond the scope of this study.
2.3. Uncertainty Analysis
The SFA method is vulnerable to multiplying the errors of multiple input values. Therefore, uncertainties were assessed. Nutrient flows in trade were calculated from table values of the composition of the food and feed products. Such table values represent an unknown range of varying values with an assumed normal distribution. The variability stems from the fact that within food basic headings, dry matter content and nutrient contents typically vary from one traded lot to another. There were also other sources of uncertainty. The uncertainty for each basic heading was assessed based on the quality of each input data source. The data quality levels were formed as described by Hedbrant (2001) [40]. Each source value has uncertainties based on the source quality of the data, which were obtained by an individual assessment of values. As uncertainty was not known, but a typical range can be defined, the data quality was assessed based on levels (Table 1). Levels 1–4 are given to each value of each the SITC heading level depending on the quality of the source data. For each class from these assessed uncertainties, multiplication was done by Taylor series expansion for a calculation of the variance of multiplied variables [40]. In this approach, all trade nutrient values have source value-based uncertainty that can be estimated, and the assessor bias is controlled by using clear levels.
2.4. Data Exploration and Statistical Analysis
Firstly, comprehensive visual data explorations of the individual division and heading level were performed and the data were validated against errors. Secondly, trends for total N, P, and K and division were tested with the Mann-Kendall non-parametric test of monotone trends, which, earlier, has been used to calculate potential trends of nutrient loads in seasonal time series, such as, riverine flows [44], air [45], and water quality [46]. Thirdly, slopes of statistically significant trends were estimated by the Theil-Sen method for linear trends [44,46]. The Theil-Sen method was chosen because of its robustness, as trade flows are volatile between years and often have periodic fluctuations by year. Further details about the Theil-Sen method are given by Larsen and Svendsen [47]. The analyses were performed in R 3.4.3, whilst the Mann-Kendall tests and Theil-Sen trends were conducted with trend package 0.2 and confidence intervals calculated as described in MAKESENSE 1.0 [48] in R. The visualizations were produced with the ggplot2 package and the map was generated in Python 3.7.0 utilizing OpenStreetMap and coordinates [49]. The correlation of the price of cereals and net nitrogen trade was calculated based on indexed values with a base year of 1996 and price data based on producer prices [34].
3. Results
3.1. Trade Quantities and Trend Analysis
The trade of food and feed grew 58%, by mass, in the last two decades, and the net inflow of mass rose to 1100 Gg. Net flows of N, P, and K to the Finnish food and agriculture system were positive throughout the period (Figure 3). Linear Theil-Sen’s slope estimates for the N, P, and K were positive for the import, exports, and net flows (in detail in Section 3.2, Table 2). Additionally, the significance of the Mann-Kendall test showed a probable trend with N, P, and K export and import flows but not with the net flows (α < 0.01). The mean annual net trade balances over the two decades were 22.15 ± 4.22 Gg N−1, 2.14 ± 1.11 Gg P−1, and 7.97 ± 1.19 Gg K−1. There was considerable volatility in the net nutrient balance. The growth of imports was more stable than the growth of export, and export volatility may explain the changes of surpluses between years and why net flows are not significant trends in this period, despite the Theil-Sens’s test showing a steeper slope for imports than exports (See Table 2, A) for Q slopes).
Despite the lack of trend for net flows, positive nutrient balances have led to cumulative surpluses by trade. The virtual net stock buildup was 419 Gg N, 44 Gg P, and 151 Gg K. In comparison, these amounts equal to 2.8, 3.8, and 4.6 times the consumption of N, P, and K in mineral fertilizers in 2014. The primary inputs for N, which is the sum of the use of industrial fertilizer nutrient inputs, and the net trade of N have reduced 13% in the period. The cumulative surplus N in trade (419 Gg N) is of the same magnitude as the cumulative reduction in fertilizer use (450 Gg N) during the period (Figure 4). For P, the reduction (49%) in fertilizer use has been higher (259 Gg P) than the cumulative trade surplus (44 Gg). For K, the reduction in fertilizer use (324 Gg K) is also more significant (49%) than the cumulative K surplus in trade (151 Gg). In 2014, 53 Gg of N, 8 Gg of P, and 15 Gg of K were imported due to trade, equating to 35%, 70%, and 45%, respectively, compared to the use of fertilizers in the food system. The relative contribution of trade nutrient imports has increased over time, as, earlier, the contribution was in N 19%, P 21%, and K 16% in 1996. The contribution has increased because of lower amounts of fertilizer use and higher amounts of imported nutrients, which are mostly animal feed. However, the export volumes have also grown.
3.2. Analysis of Sub-Group and Heading Level Flows
The detailed sub-flow output shows high volumes of feeds, oil-seeds, and cereals (Table 2).
The N contained in the feeds shows a strong trend of increasing volume, and there is an imbalance of imports and exports. Net imported feeds and oils-seeds were double the net exported cereals measured by N. However, in basic heading level analysis (data not shown), soybean meal and rapeseed meal seemed to have grown faster than oil-seeds have declined. A heading level analysis of N content shows the common feed items, which have high import volumes (Figure 5). Soybean and rapeseed meals and whole seeds are also one of the most significant imports. In direct human consumption, only a few items are among the highest volume headings, such as seafood, cheese, coffee and macaroni.
Cereals are one of the main exports, in mass and measured by N (63%). Export volatility might be explained by the high level of cereals, which are susceptible to changes in global prices. The indexed price of barley, which was one of the main exports, had a positive (0.79) correlation with the net nitrogen balance of trade with a time lag of one year. A possible explanation is that the low price of barley, after a time delay, may lead to high levels of cereal exports, which reduce the net imports of N by increasing exports. Due to low nutrient contents in fresh weight, the net imported mass of vegetables and fruits was relatively high in 2014. For example, the total imported mass of 633 Gg only contained 1.34 N Gg, 0.2 P Gg, and 1.5 K Gg.
3.3. Spatial Distribution of Nutrients
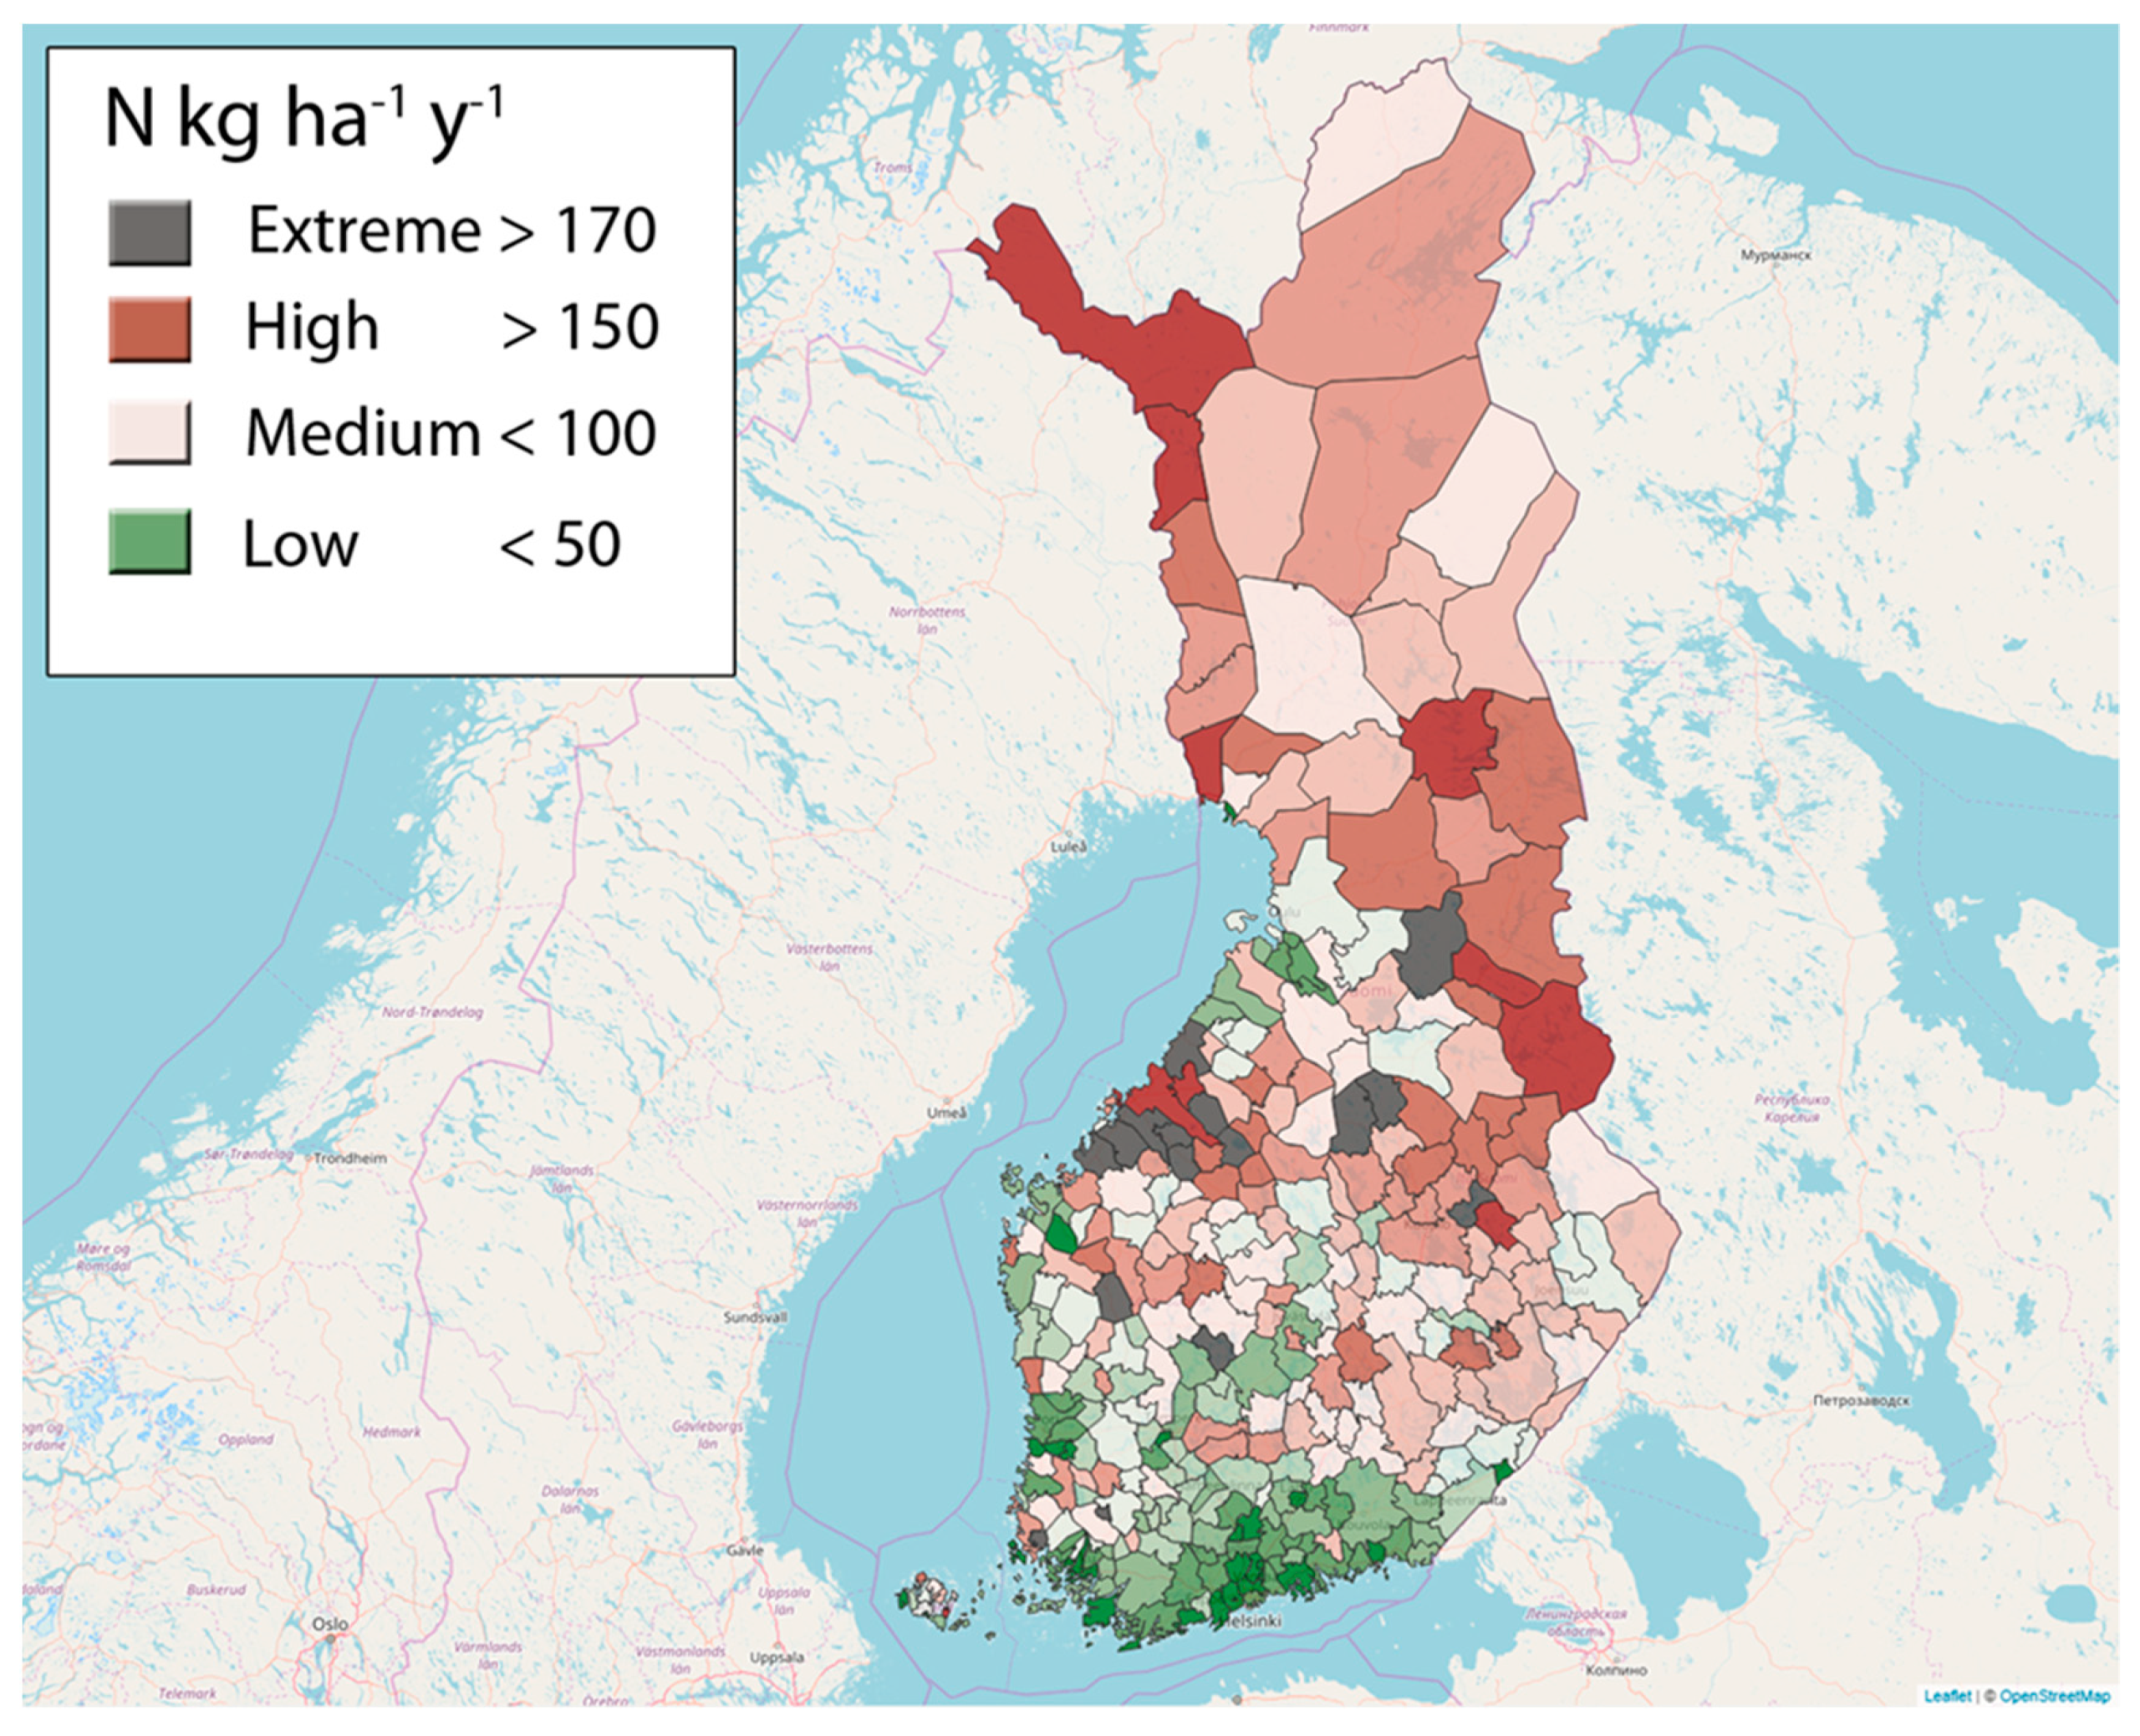
In terms of nitrogen content, of the imported nutrients, approximately 70% are animal feeds and 16% are meat, dairy, or fish products. Goods consumed directly by consumers are less than 10% of the imported nutrients, judged by the type of materials. The animal husbandry embedded nutrients in the manure were 94.4 Gg N y−1, 19.0 Gg P y−1, and 102.1 Gg K y−1 in 2014. Imported feeds contributed to 35.9% for N and 14.7% for P of manure content in manure. The animal husbandry is not spatially uniformly distributed in Finland. The highest amounts of manure N are concentrated in the Ostrobothnia region (Figure 6). Therefore, it is likely that, still, the nutrients enrich these intensive animal production regions. However, as the bulk of the cereals for feed is produced in the South, Finland’s production may also concentrate nutrients in these animal intensive areas. Therefore, the nutrient inputs at the municipal level are likely to reflect the distribution of import flows from trade and, more specifically, follow the use of manure. The nutrients are distributed according to the numbers and diets of the animals in the above-mentioned areas. However, it has to be noted that above 66° northern latitude the utilized agricultural area is less than 5% of land area in most municipalities and the animal numbers are lower, so the total nutrient quantity in manure is not high [50]. For P, a respective map can be found in Appendix A.
4. Discussion
Many policies target limiting nutrient inputs, such as fertilizers to the food system, to reduce the environmental impacts of agriculture. This study suggests that imported agricultural feed and food can create a significant input that might need more attention for environmental management. High total inputs may lead to eutrophication in sensitive areas. There is already considerable monitoring of nutrient concentrations in the Baltic Sea, and the condition has improved, but not enough to reach good levels [19]. By this methodology, it would be possible analyze changes in globally-traded nutrients, calculate contribution of traded nutrient inputs, and pinpoint other agricultural hotspots around the Baltic Sea and elsewhere in the world.
The nutrient contents of the trade flows have been estimated before. Using data between 1995 and 1999 Antikainen et al. (2005) estimated the net nutrient trade balances to be 14.5 Gg N y−1 and 0.6 Gg P y−1 [20]. In this study, in 1996–1999, when the same trade categories are compared, the estimated net balance is the same, but if all categories are included, the import N and P flow are approximately 25% higher. In this study (2000–2004), net balances were to 21.2 Gg N y−1, 2.3 Gg P y−1, and 7.7 Gg K y−1. From 2005 to 2009, the surpluses increased to 24.3 Gg N y−1, 2.4 Gg P y−1, and 8.9 Gg K y−1. In 2010–2014, the surpluses were 22.3 Gg N y−1, 2.3 Gg P y−1, and 8.0 Gg K y−1. Therefore, the net imports of nutrients have increased considerably since 1995.
When the same import categories are compared, for the year 2005, Van Dijk et al. 2016 [29] got larger values (7.7 Gg y−1) for P imports (13% higher), which is within the 95% confidence interval of the value obtained in this study (6.8 ± 0.89 Gg P y−1). An additional category that van Dijk et al. included was feed additives (especially CaHPO4, CaH4P2O8, and CaMgO4P+), which were 2.4 Gg P y−1 imported in 2005. This study had data from 2002 to 2014 for feed additives, but, since the lack of complete time series, we did not include feed additives to the time series. However, the feed additive use has been reduced from 2.6 to 0.4 Gg P y−1 in the period of 2002–2014. Therefore, this study is more conservative for P than van Dijk et al. However, compared to Antikainen et al., since the addition of trade categories, this study shows higher values for N and P trade flows, so the trade values seem to be in between the two different studies.
The imported food products cause a nutrient trade surplus of a similar magnitude to that achieved by the N fertilizer input use restriction policies used to lower the N input use to agricultural land. Therefore, nutrient trade surplus may explain why the measured flow and the normalized N flow in rivers has not declined correspondingly [19] despite considerably lower N industrial fertilizer use. The total input or the net anthropogenic nitrogen inputs (NANI) and net anthropogenic phosphorus inputs (NAPI), which include feed imports, have shown a strong relationship between N and P inputs and riverine total N and P fluxes before [51]. The total input of new nutrients to the system has been reduced to less than what the reduction in fertilizer inputs would initially suggest. Primary inputs have only declined from 1996 to 2014 by 13% if net imported N is taken into account. If exports are not subtracted, systemic inputs only reduced by 6%.
Mineral P fertilizer use has declined much faster than the growth of imports in trade, so the total P inputs have sharply declined. Partly also because of the introduction of the phytase enzyme, which reduces the phosphorus needed in animal diets [52]. However, the share of net P trade is 19% of total primary P use in 2014. K fertilization has also declined, which is perhaps due to the fact that many formulations of fertilizers include potassium nitrate (KNO3), and therefore the K fertilization was partly linked to the amount of N used. This relationship has weakened as a new formulation of fertilizers, with a higher share of ammonia nitrate (NH4NO3), has become more common because of the cost of potassium and the fact that it is a more efficient carrier of N than KNO3. This may be why potassium fertilization has declined.
The contribution of manure to eutrophication has been established in other studies [53,54]. In this study, directly assessing the contribution of positive nutrient balances in general or dividing to various input flows at the system level to eutrophication was not an aim. However, by partitioning the feed inputs, we were able to assess the contribution of imported feed nutrients and suggest the spatial distribution based on animal densities. We showed that imported feeds have a significant part of the nutrients in the manure inputs. This we expect to be true for countries of input-intensive animal farming in general, not only in the Finnish case. The values in this study are in a similar range to that previously proposed for N [55] and P [17]. However, when using municipality levels instead of counties, a more considerable heterogeneity exists. A municipality level assessment is done previously for P [50], where a similar heterogeneity was observed. Also, the high manure input areas in the P distribution map (Appendix A) correspond well with the average soil stocks measured by the soil tests of Ylivainio et al. [50], which further indicates, at the very least, a prior role of manure P in soil P stocks. Hong et al. 2017 [51] reported, in a NUTS2 level analysis, similar values for N and P embedded in trade and trends between 2000 and 2010.
The total P in manure found in this study is approximately 2 Gt higher than that reported by Ylivainio et al. [50], who used the species specific excretion rates of Grönroos et al. [50]. The difference in results from the updated excretion rates [42] used in this study: these are, overall, slightly higher than the excretion rates used previously by Grönroos et al. [50]. Additionally, for nitrogen, the updated excretion rates are higher. The most significant differences between the old and the new ex housing N excretion rates are in cattle and poultry, which are 11% higher for dairy cows and 28% higher for broilers. The new values are closer to the values used in Denmark and Sweden [56]. The increase in excretion rates may be due to changes in the animals’ diets, but the diet comparison is outside the scope of this study.
During this study period, the human population has grown approximately 6% and the nutrients contained in manure may have increased because of the demands of goods by humans. However, we see that the increase may be because of multiple reasons, which could be a combination of the following: (1) the increase of average animal numbers per farm and increased production per animal unit [57]. (2) The increased quality and nutrient content of feeds, which may be due to imported feeds, such as rapeseed and soy, which have led to a reduction of roughage usage as a primary cattle feed (54% dry matter intake) [22]. These structural and operative changes may have led to an increased production intensity and larger animal units, which could lead to higher nutrient contents in fewer locations.
In Finland, manures are usually not processed, so it is reasonable to assume that the manure is incorporated into fields within 25 km from the farms because of transport costs. Therefore, the areas shown are only potential areas of higher manure enrichment. We determined the contribution of trade nutrients embedded in manure flows. A direct link between eutrophication potential and trade imported feeds would require further study on the assimilation of nutrients by animals, losses from feed conversion, losses from ammonia at manure storage, combined with feeding rates and spatially explicit mapping of manure spreading. There are several other factors affecting eutrophication risk from manure as well as mineral fertilizers not included in this study, such as soil type and quality, the risk of erosion, and agricultural practices that vary between farms and regions.
5. Conclusions
The analysis of food and agricultural trade in Finland shows the growing net imports of nutrients (N, P, and K) from 1996 to 2014. Before, fertilizers constituted a higher a proportion of the total agricultural N inputs than they do now. Therefore, agricultural food and feed imports have partly displaced the food system’s primary fertilizer inputs. Agricultural and environmental policies have aimed to lower eutrophication and other ecosystem impacts by reducing fertilization limits. Despite the reduction of fertilizer use, only moderate reductions in nutrient inputs have been achieved. For example, the net input of nitrogen has only declined by 13%. Significant new sources of nutrients are imported via trade. The feed imports end up feeding farm animals and hence contribute to the flow of manure nutrients into agricultural land. This is already creating an eutrophication risk in areas of high animal density, where nutrient balances per ha of agricultural land are positive. The problem of high animal density areas having nutrient surpluses remains. In future, if the target is to lower potential nutrient loss impacts from agriculture, more attention should be paid to imported feeds, the positive trade balance of plant nutrients, and the spatial distribution of the nutrient flows. Higher nutrient and animal feed self-sufficiency could also be solutions. As in Finland, the bulk of animal production is concentrated in municipalities in the Ostrobothnia region and the Southwest, near the Baltic Sea. One potential solution is the manure processing into fertilizer products that are to be exported, but there are only few permitted, economical, and feasible methods available. Animal by-product legislation 1069/2009/EC prevents further refinement of manure, for example, feeding insect larvae on manure or other use of biotechnology, which could potentially upcycle manure to higher-value products. The methodology we used is available for detecting potentials and introducing policy tools for reducing agricultural nutrient excess. An even more accurate method could be to use the specific coordinates of the farms. In order to link the manure nutrient inputs to eutrophication, more detailed budgeting could provide further proof.
Supplementary Materials
The following are available online at https://www.mdpi.com/2071-1050/12/2/702/s1. Data Table S1 excel table containing the trade, arable land and population data used in this study. Data Table S2 excel table containing consolidated trade data quantities, provided as an example of the whole dataset and the included headings from SITC5 classification for 2014.
Author Contributions
Initial idea: T.P.; Conceptualization: T.P.; Formal analysis: T.P.; Project administration, T.P.; Methodology: T.P.; Supervision, J.H.; Writing—Original draft: T.P. and J.H. All authors have read and agreed to the published version of the manuscript.
Funding
This research was funded by University of Helsinki Research Foundation in the Doctoral programme in the sustainable use of renewable natural resources (AGFOREE) through a personal grant.
Acknowledgments
I am thankful to comments and revision of the manuscript to my supervisor and co-author professor Juha Helenius, and for two anonymous reviewers for their thoughtful comments, which improved the manuscript considerably. I am also thankful for my colleagues at the Department of Agricultural Sciences, and for the help with python script Tomi Mickelsson.
Conflicts of Interest
The authors declare no conflict of interest. The funders had no role in the design of the study; in the collection, analyses, or interpretation of data; in the writing of the manuscript, or in the decision to publish the results.
Appendix A
Containing Figure A1 describing phosphorus spatial distribution by manure.
Figure A1.
Manure P divided by agricultural land area of municipalities in Finland in 2014 (P kg-1 arable ha-1 y-1). The picture is based on farm animal numbers including horses and fur animals in each county (Official Statistics of Finland (OSF), 2018), multiplied by corresponding phosphorus excretion rates (Luostarinen et al., 2017). Approximately 14.7% of manure P content is estimated to originate from imported feeds.

References
- Fowler, D.; Coyle, M.; Skiba, U.; Sutton, M.A.; Cape, J.N.; Reis, S.; Sheppard, L.J.; Jenkins, A.; Grizzetti, B.; Galloway, J.N.; et al. The Global Nitrogen Cycle in the Twenty-First Century The Global Nitrogen Cycle in the Twenty- First Century. Philos. Trans. R. Soc. B Biol. Sci. 2013, 368, 1621. [Google Scholar] [CrossRef]
- MEA. Ecosystems and Human Well-Being: Synthesis/Millennium Ecosystem Assessment; Island Press: Washington, DC, USA, 2005. [Google Scholar]
- Rockström, J.; Steffen, W.; Noone, K.; Persson, A.; Chapin, F.S.; Lambin, E.F.; Lenton, T.M.; Scheffer, M.; Folke, C.; Schellnhuber, H.J.; et al. A Safe Operating Space for Humanity. Nature 2009, 461, 472–475. [Google Scholar] [CrossRef] [PubMed]
- Steffen, W.; Persson, Å.; Deutsch, L.; Zalasiewicz, J.; Williams, M.; Richardson, K.; Crumley, C.; Crutzen, P.; Folke, C.; Gordon, L.; et al. The Anthropocene: From Global Change to Planetary Stewardship. Ambio 2011. [Google Scholar] [CrossRef] [PubMed] [Green Version]
- Steffen, W.; Richardson, K.; Rockström, J.; Cornell, S.; Fetzer, I.; Bennett, E.; Biggs, R.; Carpenter, S. Planetary Boundaries: Guiding Human Development on a Changing Planet. Science 2015, 348, 1217. [Google Scholar] [CrossRef] [Green Version]
- Kahiluoto, H.; Kuisma, M.; Kuokkanen, A.; Mikkilä, M.; Linnanen, L. Taking Planetary Nutrient Boundaries Seriously: Can We Feed the People? Glob. Food Secur. 2014, 3, 16–21. [Google Scholar] [CrossRef] [Green Version]
- Cordell, D.; Drangert, J.O.; White, S. The Story of Phosphorus: Global Food Security and Food for Thought. Glob. Environ. Chang. 2009, 19, 292–305. [Google Scholar] [CrossRef]
- Mew, M.C. Phosphate Rock Costs, Prices and Resources Interaction. Sci. Total Environ. 2016, 542, 1008–1012. [Google Scholar] [CrossRef]
- Chowdhury, R.B.; Moore, G.A.; Weatherley, A.J.; Arora, M. Key Sustainability Challenges for the Global Phosphorus Resource, Their Implications for Global Food Security, and Options for Mitigation. J. Clean. Prod. 2017, 140, 945–963. [Google Scholar] [CrossRef]
- Ryther, J.H.; Dunstan, W.M. Nitrogen, Phosphorus, and Eutrophication in the Coastal Marine Environment. Science 1971, 171, 1008–1013. [Google Scholar] [CrossRef] [Green Version]
- Selman, M.; Greenhalgh, S.; Diaz, R.; Sugg, Z. Eutrophication and Hypoxia in Coastal Areas: A Global Assessment of the State of Knowledge. World Resour. Insitute Policy Note 2008, 284, 1–6. [Google Scholar]
- Selman, M. Interactive Map of Eutrophication & Hypoxia; World Resources Insititute: Washington, DC, USA, 2013. [Google Scholar]
- Conley, D.J.; Humborg, C.; Rahm, L.; Savchuk, O.P.; Wulff, F. Hypoxia in the Baltic Sea and Basin-Scale Changes in Phosphorus Biogeochemistry. Environ. Sci. Technol. 2002, 36, 5315–5320. [Google Scholar] [CrossRef] [PubMed]
- Carstensen, J.; Andersen, J.H.; Gustafsson, B.G.; Conley, D.J. Deoxygenation of the Baltic Sea during the Last Century. Proc. Natl. Acad. Sci. USA 2014, 111, 5628–5633. [Google Scholar] [CrossRef] [PubMed] [Green Version]
- Fleming-Lehtinen, V.; Andersen, J.H.; Carstensen, J.; Łysiak-Pastuszak, E.; Murray, C.; Pyhälä, M.; Laamanen, M. Recent Developments in Assessment Methodology Reveal That the Baltic Sea Eutrophication Problem Is Expanding. Ecol. Indic. 2015, 48, 380–388. [Google Scholar] [CrossRef] [Green Version]
- HELCOM. First Baltic Sea Pollution Load Compilation; Helsinki Commission: Helsinki, Finland, 1987.
- Uusitalo, R.; Turtola, E.; Grönroos, J.; Kivistö, J.; Mäntylahti, V.; Turtola, A.; Lemola, R.; Salo, T. Finnish Trends in Phosphorus Balances and Soil Test Phosphorus. Agric. Food Sci. 2007, 16, 301–316. [Google Scholar] [CrossRef] [Green Version]
- HELCOM. HELCOM Core Indicators. Final Report of the HELCOM CORESET Project. Balt. Sea Environ. Proc. No. 136 2013, 136, 71. [Google Scholar]
- HELCOM. Updated Fifth Baltic Sea Pollution Load Compilation (PLC-5.5). Baltic Sea Environment Proceedings No. 145. Balt. Sea Environ. Proc. 2015, 145. [Google Scholar]
- Antikainen, R.; Haapanen, R.; Lemola, R.; Nousiainen, J.I.; Rekolainen, S. Nitrogen and Phosphorus Flows in the Finnish Agricultural and Forest Sectors, 1910–2000. Water. Air. Soil Pollut. 2008, 194, 163–177. [Google Scholar] [CrossRef]
- Antikainen, R.; Lemola, R.; Nousiainen, J.I.; Sokka, L.; Esala, M.; Huhtanen, P.; Rekolainen, S. Stocks and Flows of Nitrogen and Phosphorus in the Finnish Food Production and Consumption System. Agric. Ecosyst. Environ. 2005, 107, 287–305. [Google Scholar] [CrossRef]
- Lehikoinen, E.; Parviainen, T.; Helenius, J.; Jalava, M.; Salonen, A.O.; Kummu, M. Cattle Production for Exports in Water-Abundant Areas: The Case of Finland. Sustainability 2019, 11, 1075. [Google Scholar] [CrossRef] [Green Version]
- Sandström, V.; Lehikoinen, E.; Peltonen-Sainio, P. Replacing Imports of Crop Based Commodities by Domestic Production in Finland: Potential to Reduce Virtual Water Imports. Front. Sustain. Food Syst. 2018, 2, 67. [Google Scholar] [CrossRef] [Green Version]
- Knuuttila, M.; Vatanen, E. Elintarvikemarkkinoiden Tuontiriippuvuus; Luonnonvara- ja biotalouden tutkimus; Natural Resources Institute Finland: Helsinki, Finland, 2015. [Google Scholar]
- Keyworth, N.B.G.S. European Mineral Statistics 2009–13. A Product of the World Mineral Statistics Database; Keyworth, N., Ed.; British Geological Survey: Nottingham, UK, 2015. [Google Scholar]
- Granstedt, A.; Schneider, T.; Seuri, P.; Thomsson, O. Ecological Recycling Agriculture to Reduce Nutrient Pollution to the Baltic Sea. Biol. Agric. Hortic. 2008, 26, 279–307. [Google Scholar] [CrossRef]
- Withers, P.J.A.; van Dijk, K.C.; Neset, T.-S.S.; Nesme, T.; Oenema, O.; Rubæk, G.H.; Schoumans, O.F.; Smit, B.; Pellerin, S. Stewardship to Tackle Global Phosphorus Inefficiency: The Case of Europe. Ambio 2015, 44, 193–206. [Google Scholar] [CrossRef] [PubMed] [Green Version]
- Känkänen, H.; Suokangas, A.; Tiilikkala, K.; Nykänen, A. Biologinen Typensidonta Fossiilisen Energian Säästäjänä; MTT: Jokioinen, Finland, 2013. [Google Scholar]
- van Dijk, K.C.; Lesschen, J.P.; Oenema, O. Phosphorus Flows and Balances of the European Union Member States. Sci. Total Environ. 2016, 542, 1078–1093. [Google Scholar] [CrossRef] [PubMed]
- Voet, E. Substance Flow Analysis Metholodology. In A Handbook of Industrial Ecology; Edward Elgar Publishing: Cheltenham, UK, 2002. [Google Scholar]
- Brunner, P.H.; Ma, H.W. Substance Flow Analysis an Indispensable Tool for Goal-Oriented Waste Management. J. Ind. Ecol. 2009, 13, 11–14. [Google Scholar] [CrossRef]
- Brunner, P.H.; Rechberger, H. Book Reviews: Practical Handbook of Material Flow Analysis. Int. J. Life Cycle Assess. 2004, 9, 337–338. [Google Scholar] [CrossRef]
- Marttinen, S.; Venelampi, O.; Iho, A.; Koikkalainen, K.; Lehtonen, E.; Luostarinen, S.; Rasa, K.; Sarvi, M.; Tampio, E.; Turtola, E.; et al. Kohti Ravinteiden Kierrätyksen Läpimurtoa—Nykytila Ja Suositukset Ohjauskeinojen Kehittämiseksi Suomessa; Natural Resources Institute Finland: Helsinki, Finland, 2017. [Google Scholar]
- Official Statistics of Finland (OSF). Utilised Agricultural Area. Available online: https://stat.luke.fi/en/utilised-agricultural-area (accessed on 1 September 2018).
- Customs, F. International Trade Statistics. Available online: http://uljas.tulli.fi/uljas/ (accessed on 1 March 2016).
- USDA. National Nutrient Database for Standard Reference; Release 24; United States Department of Agriculture Agricultural Research Service: Washington, DC, USA, 2008.
- Agroscope. Swiss Feed Database. Available online: http://www.feedbase.ch (accessed on 8 April 2018).
- Natural Resources Institute Finland (Luke). Feed Tables. Available online: https://portal.mtt.fi/portal/page/portal/Rehutaulukot/feed_tables_english (accessed on 10 April 2018).
- THL, N.; Institute for Health and Welfare. Finelli. Available online: https://fineli.fi/ (accessed on 15 May 2018).
- Hedbrant, J.; Sörme, L. Data Vagueness and Uncertainties in Urban Heavy-Metal Data Collection. Water Air Soil Pollut. Focus 2001, 1, 43–53. [Google Scholar] [CrossRef]
- Cooper, J.; Carliell-Marquet, C. A Substance Flow Analysis of Phosphorus in the UK Food Production and Consumption System. Resour. Conserv. Recycl. 2013, 74, 82–100. [Google Scholar] [CrossRef]
- Luostarinen, S.; Grönroos, J.; Hellstedt, M.; Nousiainen, J.; Munther, J. Finnish Normative Manure System: System Documentation and First Results; Natural Resources Institute Finland: Helsinki, Finland, 2017. [Google Scholar]
- Official Statistics of Finland (OSF). Number of Livestock. Available online: https://stat.luke.fi/en/number-of-livestock (accessed on 11 May 2018).
- Helsel, D.R.; Hirsch, R.M. Statistical Methods in Water Resources; US Geological Survey: Reston, VA, USA, 2002; Book 4; 522p. [CrossRef]
- Güçlü, Y.S. Multiple Şen-Innovative Trend Analyses and Partial Mann-Kendall Test. J. Hydrol. 2018, 566, 685–704. [Google Scholar] [CrossRef]
- HELCOM; Svendsen, L.M.; Bartnicki, J.; Boutrup, S.; Gus-Tafsson, B.; Jarosinski, W.; Knuuttila, S.; Kotilainen, P.; Larsen, S.E.; Pyhälä, M.; et al. Updated Fift Baltic Sea Pollution Load Compilation (PLC-5.5). Balt. Sea Environ. Proc. 2015, 145, 143. [Google Scholar]
- Larsen, S.E.; Svendsen, L.M. Statistical Aspects in Relation to Baltic Sea Pollution Load Compilation; Aarhus University, DCE—Danish Centre for Environment and Energy: Arhus, Denmark, 2013. [Google Scholar]
- Salmi, T.; Maatta, A.; Anttila, P.; Ruoho-Airola, T.; Amnell, T. Detecting Trends of Annual Values of Atmospheric Pollutants by the Mann–Kendall Test and Sen’s Slope Estimates. Publ. Air Qual. 2002. [Google Scholar]
- NLS, N.L.S. of F. Municipal Division Dataset. Available online: https://kartta.paikkatietoikkuna.fi/ (accessed on 1 February 2016).
- Ylivainio, K.; Sarvi, M.; Lemola, R.; Uusitalo, R.; Turtola, E. Regional P Stocks in Soil and in Animal Manure as Compared to P Requirement of Plants in Finland; MTT: Jokioinen, Helsinki, Finland, 2014. [Google Scholar]
- Hong, B.; Swaney, D.P.; McCrackin, M.; Svanbäck, A.; Humborg, C.; Gustafsson, B.; Yershova, A.; Pakhomau, A. Advances in NANI and NAPI Accounting for the Baltic Drainage Basin: Spatial and Temporal Trends and Relationships to Watershed TN and TP Fluxes. Biogeochemistry 2017, 133, 245–261. [Google Scholar] [CrossRef] [Green Version]
- Simons, P.C.M.; Versteegh, H.A.J.; Jongbloed, A.W.; Kemme, P.A.; Slump, P.; Bos, K.D.; Wolters, M.G.E.; Beudeker, R.F.; Verschoor, G.J. Improvement of Phosphorus Availability by Microbial Phytase in Broilers and Pigs. Br. J. Nutr. 1990, 64, 525–540. [Google Scholar] [CrossRef] [PubMed] [Green Version]
- Conley, D.J.; Paerl, H.W.; Howarth, R.W.; Boesch, D.F.; Seitzinger, S.P.; Havens, K.E.; Lancelot, C.; Likens, G.E. Controlling Eutrophication: Nitrogen and Phosphorus. Science 2009, 323, 1014–1015. [Google Scholar] [CrossRef] [PubMed]
- Carpenter, S.R. Eutrophication of Aquatic Ecosystems: Bistability and Soil Phosphorus. Proc. Natl. Acad. Sci. USA 2005, 102, 10002–10005. [Google Scholar] [CrossRef] [PubMed] [Green Version]
- Salo, T.; Lemola, R.; Esala, M. National and Regional Net Nitrogen Balances in Finland in 1990–2005. Agric. Food Sci. 2007. [Google Scholar] [CrossRef] [Green Version]
- Grönroos, J.; Regina, K.; Nousiainen, J.; Perälä, P.; Kristina, S.; Mikkola-Pusa, J. Development of the Ammonia Emission Inventory in Finland, Revised Model for Agriculture; Finnish Environment Institute: Helsinki, Finland, 2009. [Google Scholar]
- Official Statistics of Finland (OSF). Agricultural statistics, Structure. Available online: https://stat.luke.fi/en/ (accessed on 5 January 2020).
Figure 1.
Simplified Finnish food system indicated with a dashed line, and the arrows indicate the most significant input and output flows. Atmospheric deposition and losses are omitted. Domestic consumption, indicated with gray, is shown, but it was not analyzed in this study.
Figure 1.
Simplified Finnish food system indicated with a dashed line, and the arrows indicate the most significant input and output flows. Atmospheric deposition and losses are omitted. Domestic consumption, indicated with gray, is shown, but it was not analyzed in this study.
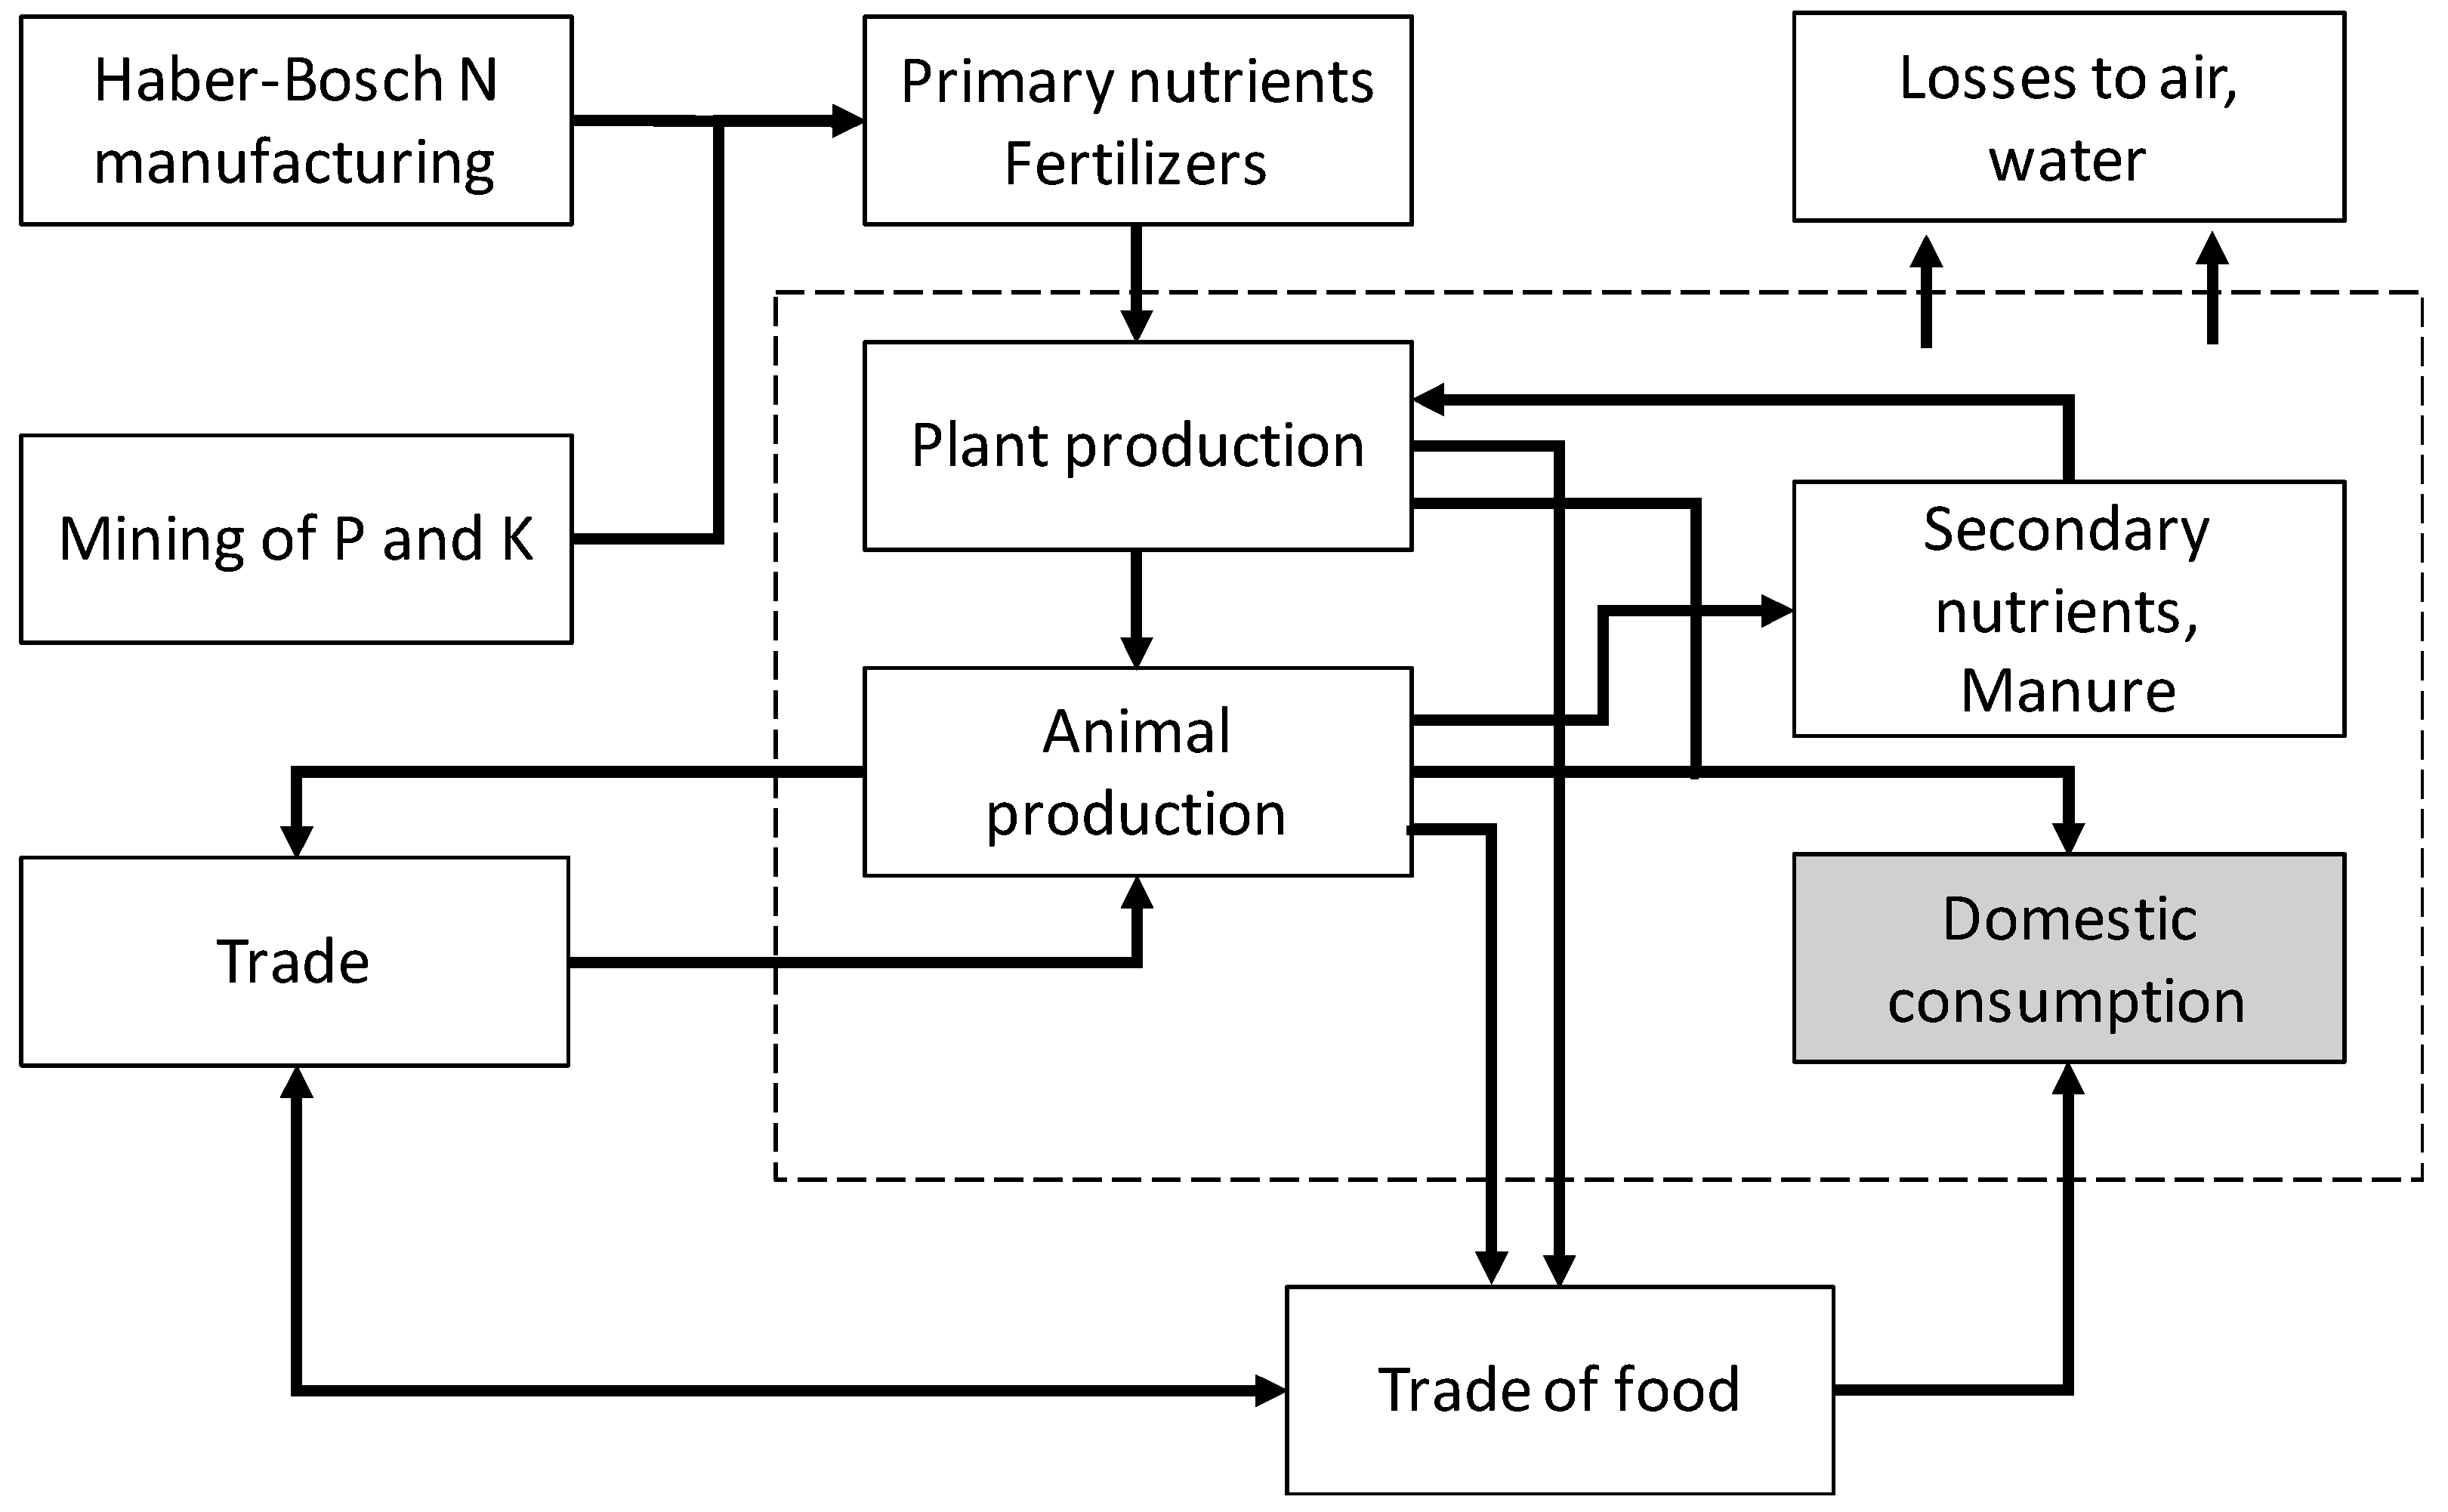
Figure 2.
Flow diagram of the data processing of the substance flow analysis (SFA) time-series calculation for nutrients in food and feed.
Figure 2.
Flow diagram of the data processing of the substance flow analysis (SFA) time-series calculation for nutrients in food and feed.
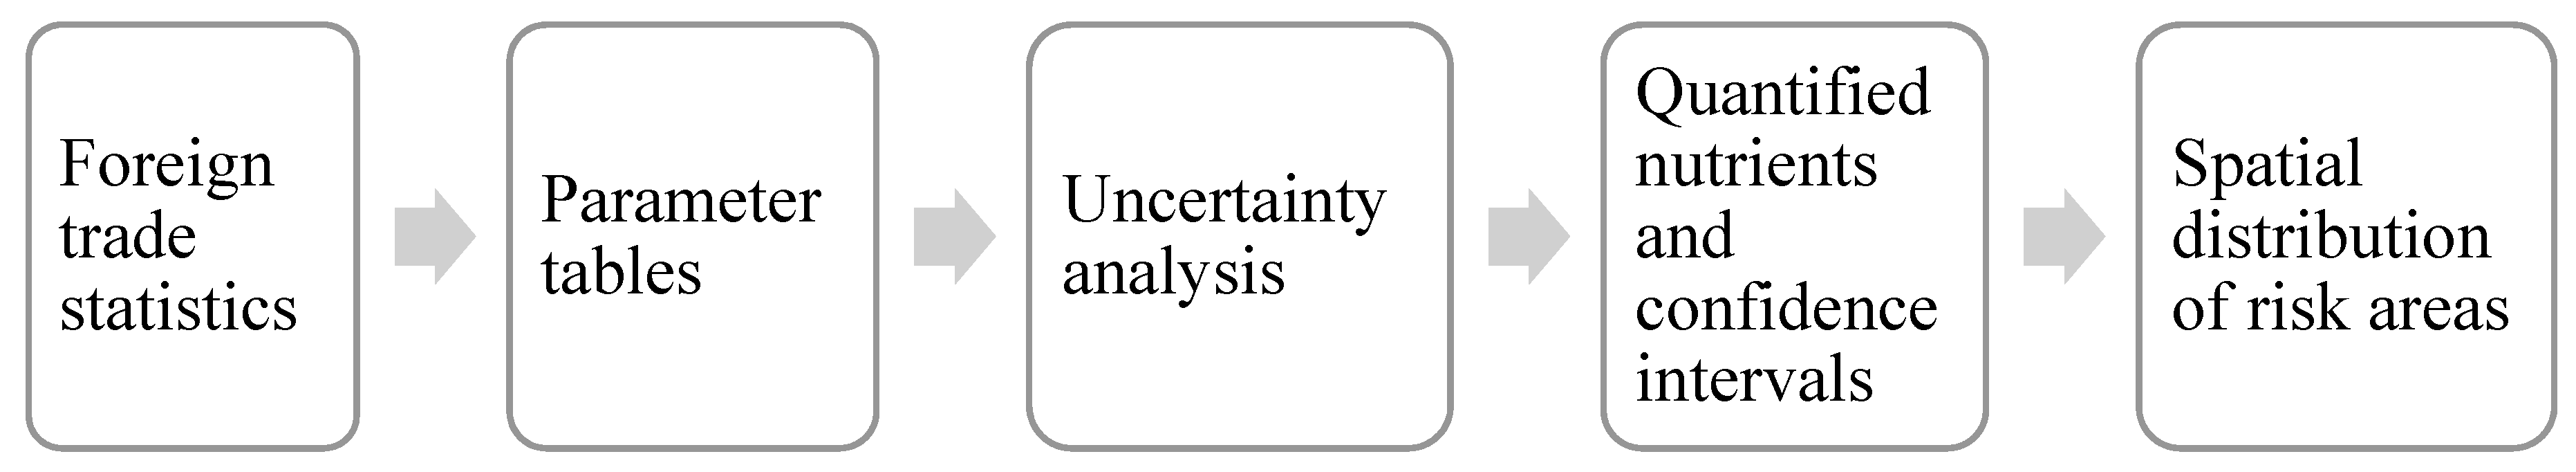
Figure 3.
Nutrient flows of nitrogen (N), phosphorus (P), and potassium (K) in trade, and trade balance as kg ha−1 year−1 in the Finnish agri-food system, 1996–2014. Left: exports. Center: imports. Right: net balance. The lower and upper bounds show the estimated 95% confidence intervals of the Theil-Sen trend line. Balances are calculated as inflows (imports) subtracted by outflows (exports). Import flows and export flows are statistically significant trends (p < 0.05). N, P, and K balances are not significant trends (p > 0.05). Theil-Sen’s slopes are drawn as f(t) = Q * t + B, where B is the constant for each slope and t is time step. The data are available in Supplementary Table S1 with Theil-Sen’s Q slopes, Mann-Kendall tests, and respective p-values.
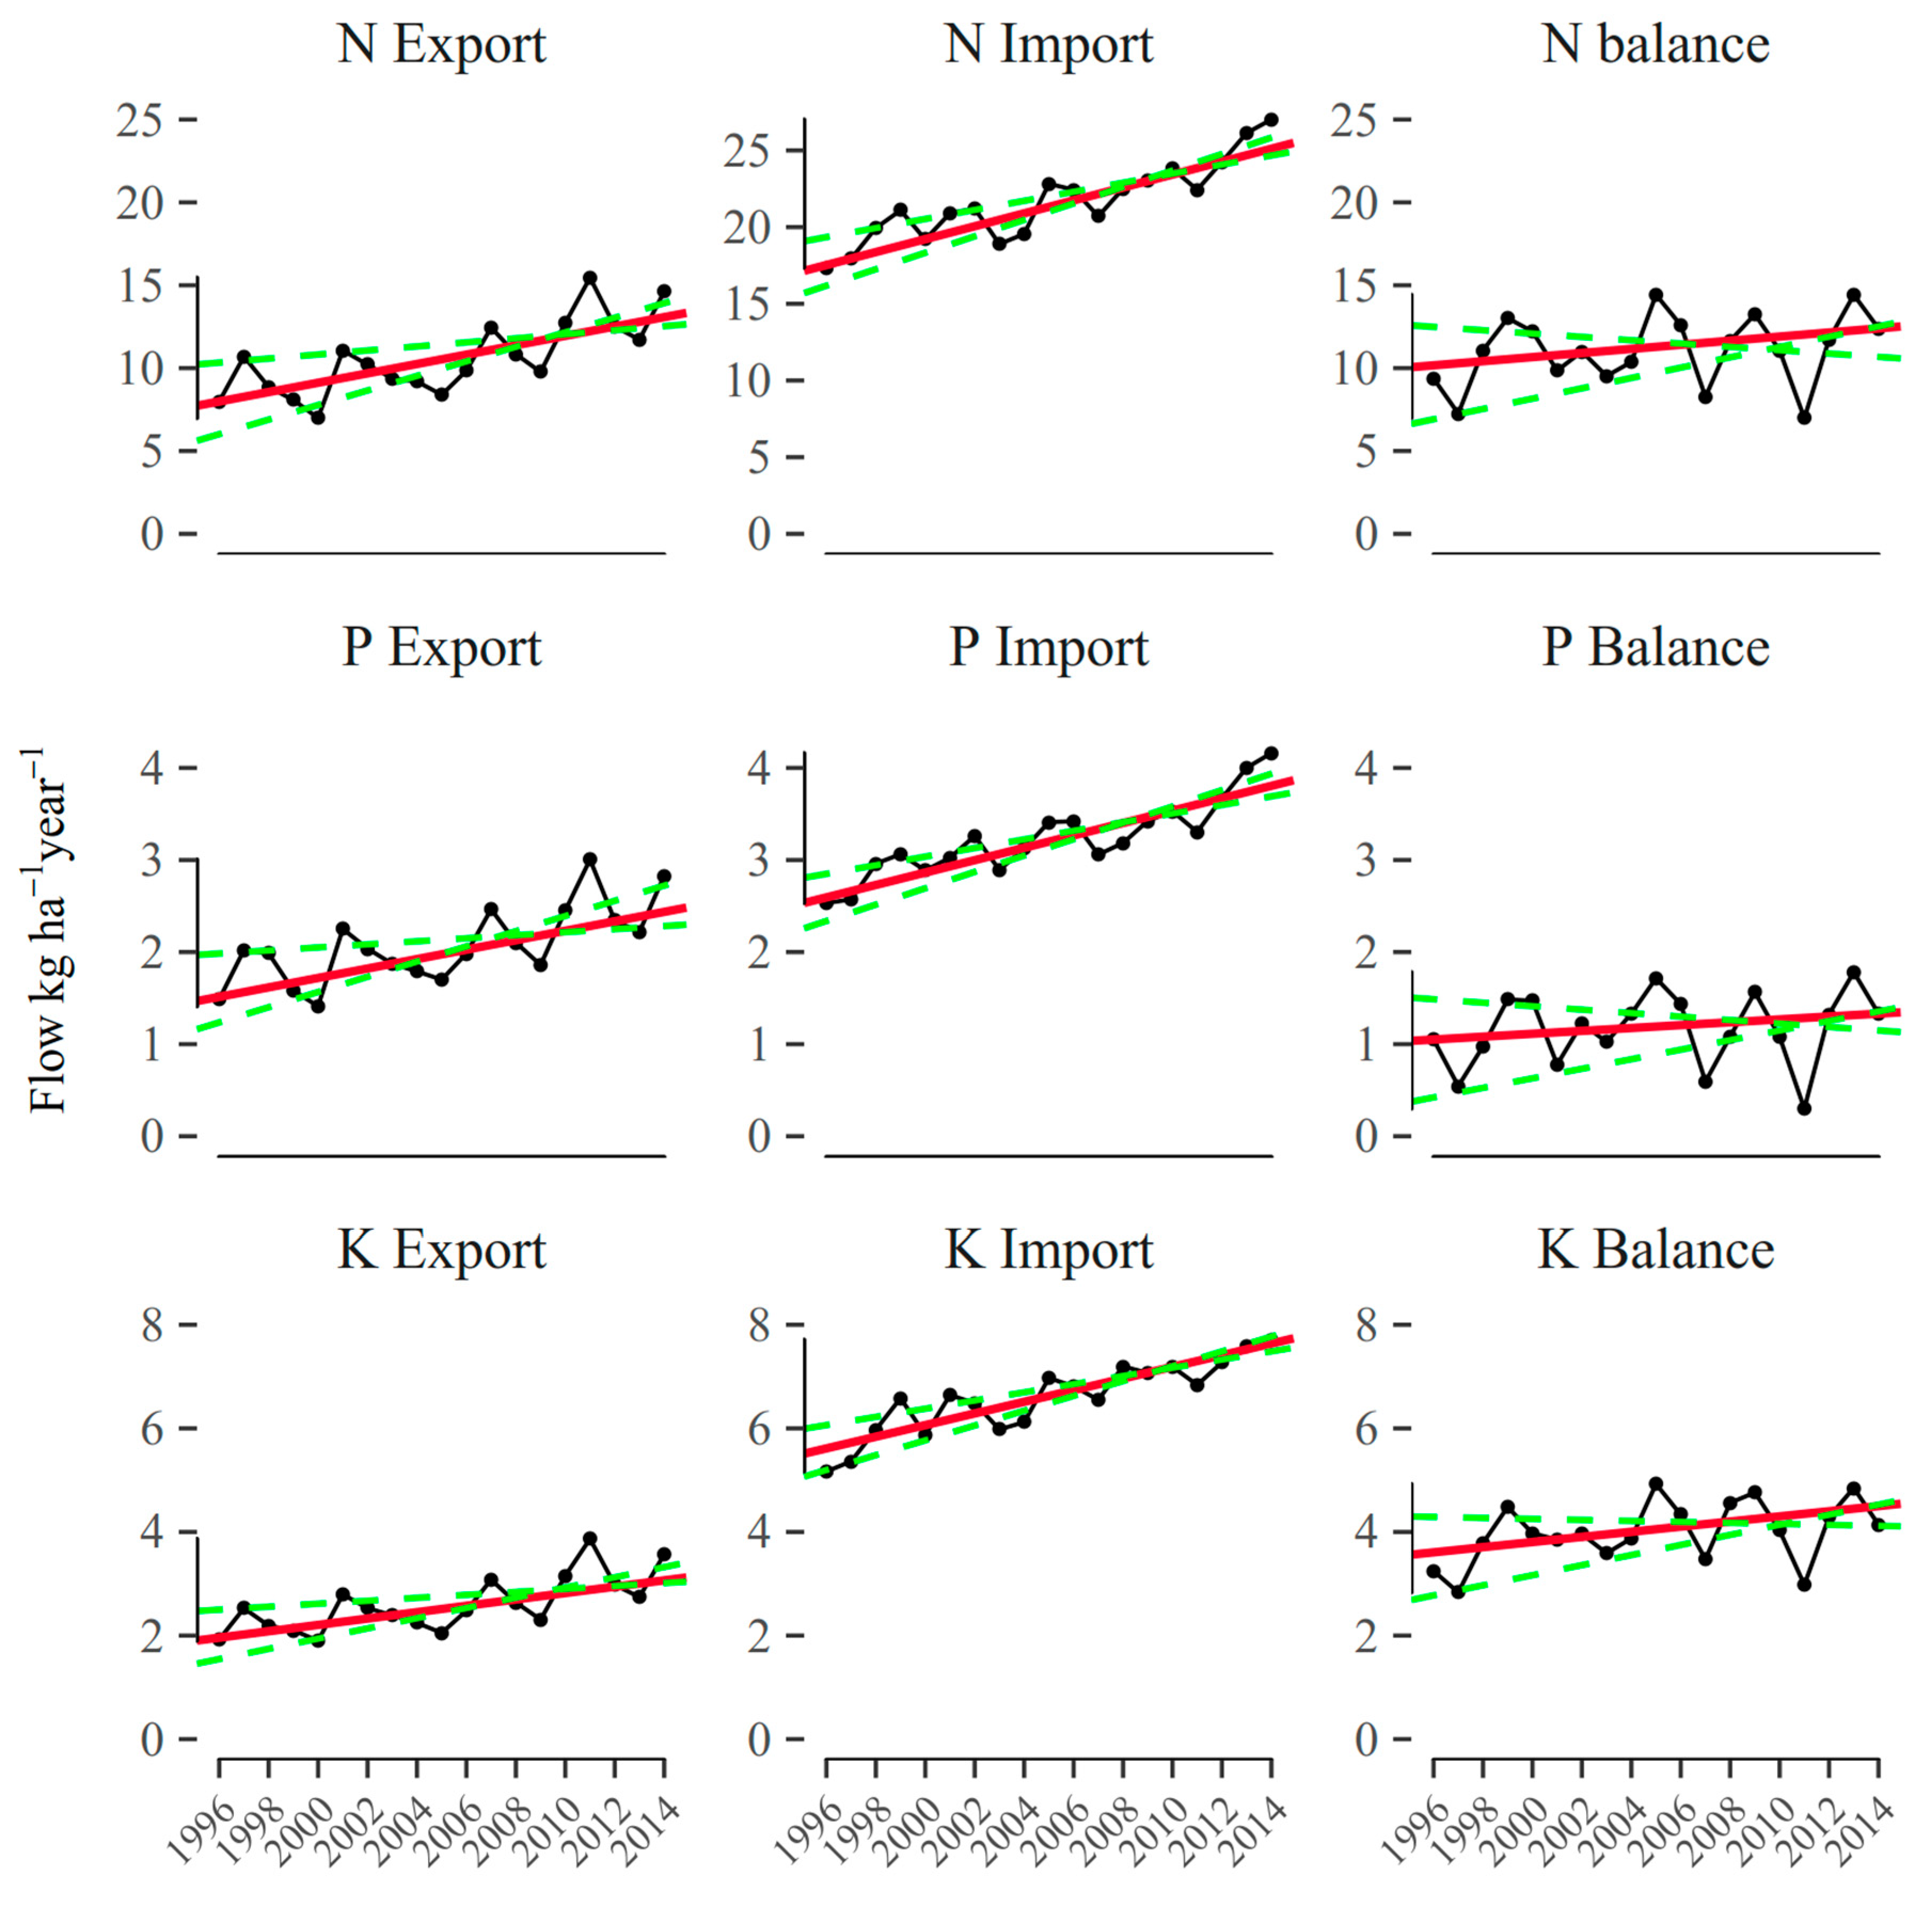
Figure 4.
Agricultural nutrient input use of nitrogen, phosphorus, and potassium in fertilizers [34], and calculated inflow as trade balance (imports-exports) in food and feed trade of these nutrients to the Finnish agri-food system in 1996–2014. The atmospheric deposition or biological nutrient fixation (BNF) of nutrients is not included. The nutrient masses are expressed as chemical element masses. Data is available in Supplementary Table S1.

Figure 5.
Treemap of N imports in 2014. An illustration of the heading level relative sizes by N volume basis. The total area size is 53.57 Gg N, and area is divided according to the flow volume, by heading, from largest to smallest. Only the largest basic headings are visible.
Figure 5.
Treemap of N imports in 2014. An illustration of the heading level relative sizes by N volume basis. The total area size is 53.57 Gg N, and area is divided according to the flow volume, by heading, from largest to smallest. Only the largest basic headings are visible.

Figure 6.
Manure N divided by the agricultural land area of municipalities in Finland in 2014 (N kg arable ha−1 y−1). The picture is based on farm animal numbers, including horses and fur animals, in each municipality [43], multiplied by corresponding nitrogen excretion rates [42]. The equivalent to approximately 35.9% of manure N and 14.7% of P content is estimated to originate from contained nutrients in imported feeds. The figure for P can be found in Appendix A.

Table 1.
Levels and used intervals of uncertainty analysis.
| Level | Uncertainty Interval | Reference: | Example: |
|---|---|---|---|
| 1 | 1.05 | Official statistics of Finland, Official feed database | Foreign trade statistics, composition of wheat |
| 2 | 1.1 | Foreign feed databases such as AGROSCOPE, FAO feed tables or USDA | The composition of soybean meal |
| 3 | 1.2 | Official statistics with a methodology based on national averages or other national studies | The composition of foodstuff preparations based on national consumption averages of the product group |
| 4 | 1.33 | Values from literature without reference, methodology, significantly scaled values or assumptions of contents of variable content based on interviews | Composition of composite feed by average composition of constituents |
Table 2.
Theil-Sen’s slope estimates and Mann-Kendall tests significance 1996–2014.
| (A) | Nitrogen (N) | Phosphorus (P) | Potassium (K) | (C) | ||||||
|---|---|---|---|---|---|---|---|---|---|---|
| Total flow | Trend | Q | Sig. | Trend | Q | Sig. | Trend | Q | Sig. | N |
| In flow | ↗ | 0.802 | *** | ↗ | 0.180 | *** | ↗ | 0.222 | *** | 53.57 ± 6.90 |
| Out flow | ↗ | 0.553 | ** | ↗ | 0.102 | ** | ↗ | 0.127 | ** | 28.99 ± 3.73 |
| Net flow | ↗ | 0.277 | ↗ | 0.120 | ↗ | 0.091 | 24.58 ± 3.16 | |||
| (B) Net flows by division (SITC statistical groups) | N | |||||||||
| 00–Live animals | ↗ | 0.0057 | *** | ↗ | 0.0004 | ** | ↗ | 0.0005 | *** | 0.091 ± 0.04 |
| 01–Meat | ↗ | 0.0260 | ↗ | 0.0015 | ↗ | 0.0037 | 0.351 ± 0.05 | |||
| 02–Dairy and eggs | ↗ | 0.0609 | ** | ↗ | 0.0004 | ↗ | −0.0200 | ** | 0.487 ± 0.07 | |
| 03–Fish | ↘ | −0.0265 | *** | ↘ | −0.0023 | + | ↘ | −0.0061 | *** | 0.395 ± 0.06 |
| 04–Cereals | ↘ | −0.5276 | ** | ↘ | −0.0861 | * | ↘ | −0.1242 | ** | −14.95 ± 1.78 |
| 05–Vegetables and fruit | ↗ | 0.0262 | *** | ↗ | 0.0044 | *** | ↗ | 0.0290 | *** | 1.344 ± 0.21 |
| 06–Sugars and honey | ↗ | 0.0028 | + | ↗ | 0.0015 | ** | ↗ | 0.0260 | ** | 0.711 ± 0.09 |
| 07–Coffee, tea, cocoa and spices | ↗ | 0.0118 | *** | ↗ | 0.0037 | ** | ↗ | 0.0164 | *** | 0.213 ± 0.03 |
| 08–Feeds | ↗ | 0.9313 | *** | ↗ | 0.1802 | *** | ↗ | 0.2795 | *** | 27.03 ± 3.39 |
| 09–Other foodstuffs | ↗ | 0.0083 | ↗ | 0.0009 | ↗ | 0.0047 | * | 0.236 ± 0.03 | ||
| 11–Beverages | ↗ | 0.0034 | *** | ↗ | 0.0010 | *** | ↗ | 0.0042 | *** | 0.027 ± 0.01 |
| 22–Oil-seeds | ↘ | −0.3802 | *** | ↘ | −0.0377 | *** | ↘ | −0.1128 | *** | 6.873 ± 0.60 |
| 291–Crude materials | ↘ | −0.0895 | + | ↘ | −0.0121 | ↘ | −0.0090 | + | 1.775 ± 0.41 | |
(A) In, out, and net flows of N, P, and K. (B) Divisions summary statistics of the net N flows. The last column on the right, shows flow volumes in Nitrogen Gg y−1 for 2014. Q is the linear Theil-Sen’s slope estimate. Value describes the direction and steepness of the slope, which is indicated with directional trend arrow. Sig. refers to the Mann-Kendall test significance at probability levels. The probability of the trend *** is α = 0.001, ** is α = 0.01, * is α = 0.05 and + is α = 0.1 level of significance. Column (C) nitrogen Gg y−1. In, out, and net flows, and upper and lower boundaries based on the average uncertainty of the division. Positive numbers mean net inflow and negative numbers net outflow within the division, and similarly, a negative Q means a slope towards increasing exports.
© 2020 by the authors. Licensee MDPI, Basel, Switzerland. This article is an open access article distributed under the terms and conditions of the Creative Commons Attribution (CC BY) license (http://creativecommons.org/licenses/by/4.0/).
Share and Cite
MDPI and ACS Style
Parviainen, T.; Helenius, J. Trade Imports Increasingly Contribute to Plant Nutrient Inputs: Case of the Finnish Food System 1996–2014. Sustainability 2020, 12, 702. https://doi.org/10.3390/su12020702
AMA Style
Parviainen T, Helenius J. Trade Imports Increasingly Contribute to Plant Nutrient Inputs: Case of the Finnish Food System 1996–2014. Sustainability. 2020; 12(2):702. https://doi.org/10.3390/su12020702
Chicago/Turabian StyleParviainen, Tuure, and Juha Helenius. 2020. "Trade Imports Increasingly Contribute to Plant Nutrient Inputs: Case of the Finnish Food System 1996–2014" Sustainability 12, no. 2: 702. https://doi.org/10.3390/su12020702
Note that from the first issue of 2016, this journal uses article numbers instead of page numbers. See further details here.