Article

A Quantitative Estimation of the Effects of Measures to Counter Climate Change on Well-Being: Focus on Non-Use of Air Conditioners as a Mitigation Measure in Japan

1
Department of Civil Engineering, The University of Tokyo, Kashiwa 277-8574, Japan
2
Institute of Industrial Science, The University of Tokyo, Tokyo 153-8505, Japan
3
Department of Health Risk Communication, Fukushima Medical University School of Medicine, Fukushima 960-1295, Japan
*
Author to whom correspondence should be addressed.
Sustainability 2020, 12(20), 8694; https://doi.org/10.3390/su12208694
Submission received: 28 August 2020 / Revised: 14 October 2020 / Accepted: 17 October 2020 / Published: 20 October 2020
(This article belongs to the Section Air, Climate Change and Sustainability)

Abstract

:
Measures to mitigate climate change are being considered all over the world. Reducing the use of air conditioners is one such measure. While it seems to be effective in mitigating climate change, it may also reduce individuals’ well-being and increase the risk of heatstroke. To compare the impact of reducing air conditioner use and the mortality risks, the indicator Loss of Happy Life Expectancy (LHpLE), which measures the reduction in the length of life that individuals can spend happily, was used. The reduction in well-being due to non-use of air conditioners was obtained by applying the propensity score matching method to the results of a questionnaire. We evaluated the impact of reducing air conditioner use in both the current and future situation in comparison to the mortality risk from flood and heatstroke, respectively. The increase in mortality risk due to flooding was estimated based on numerical simulation, and the increase in the risk of mortality due to heatstroke was estimated based on existing reports in Japan. Using these results, the magnitude of the impacts on LHpLE caused by the reduction in well-being due to the non-use of an air conditioner and the increase in the mortality risks were compared, both for the current situation and the future. The results show that LHpLE due to non-use of air conditioners was much greater than that due to the risk of mortality due to flood and heatstroke, and implied that reducing air conditioner use is not necessarily a good way as a mitigation measure. This result would be useful for creating and implementing measures to counter climate change and could also be applied in many other fields.

Graphical Abstract

1. Introduction

Climate change is a pressing issue in a variety of research fields today. It is estimated that climate change will have severe consequences on societies all over the world. For example, it is expected that warmer temperature would make extreme rainfall events heavier and more frequent and flood risk would increase in many regions all over the world [1,2,3]. Another paper indicated extreme precipitation with a return period of 20 years will occur more frequently over most mid-latitude and wet tropical regions in the future [4]. It is also mentioned that the occurrence of strong hurricane will increase in the future and that will affect our society negatively [5]. Thus, it can be concluded that flood events will happen more frequently in these areas. At the same time, heavier precipitation is likely to raise the risk of landslide [6]. In addition, changes in precipitation pattern might cause not only flood but also drought, which can cause severe damage to agriculture [7]. Thus, even if we focus on precipitation alone, the impact of climate change is significant. On the other hand, it is also expected that warm temperature extremes will increase in the future [8,9,10] and that this will increase the risk of mortality from cardiovascular disease, respiratory illnesses, heatstroke, infectious diseases, and other causes [11,12,13].
They have negative impacts on the economy, society, and the environment and hinder sustainable development [14,15,16]. Similarly, there is growing concern in Japan about the future impacts of climate change on food production, the economy, daily lives, and the environment [17,18,19,20]. In order to reduce these risks, various countermeasures are being discussed globally.
There are two types of climate change countermeasures: mitigation and adaptation [21,22,23]. A mitigation measure is an attempt to curb the progress of climate change. One example is the efforts to prevent the global temperature from increasing by reducing emissions of the greenhouse gas CO2. By contrast, an adaptation measure is a way of living in a society where climate change has advanced, such as the evaluation of the future flood risk and the implementation of flood control systems. In addition to these two measures, resilience is sometimes mentioned [24,25]. This is a measure to reinforce the vulnerability of a society so that it can recover quickly when something goes wrong. The cost-effectiveness of these measures varies from country to country [26]. Some countries aim to achieve net-zero carbon emissions or at least reduce their emissions [27]. However, their capacities to do so, including economic factors and technological capabilities, may differ so that excessive investment in mitigation can have potentially harmful effects [28]. On the other hand, if we gave up mitigation completely and prioritized adaptation, the risks would increase much faster and unexpected risks would emerge. Therefore, it is important to balance mitigation and adaptation.
The Paris Agreement was adopted at the 21st Conference of the Parties to the United Nations Convention on Climate Change (COP21) in 2015, and Japan has ratified it [29]. In this agreement, all countries are required to submit and update their targets on greenhouse gas emission reduction every five years. In 2016, Japan has set a target of reducing greenhouse gas emissions by 26.0% below 2013 levels by 2030 and by 80% by 2050 [30]. In Japan, in order to mitigate global warming, the government encourages citizens to weaken the temperature settings of air conditioners or turn off them in the workplace and to dress more lightly, since this activity can reduce CO2 emissions as mentioned in the official webpage of the ministry of environment [31]. In fact, 15.3% of Japan’s 1.311 billion tons of CO2 emissions in the fiscal year 2013 came from households [30]. Actually, CO2 emissions from households amounted to 166 million tons in 2018, down from 201 million tons in 2013 [32]. This is 14.6% of the total 1.138 billion tons, so the rate of decline is high. However, this measure also brings problems. First, reducing the air conditioner use on very hot days will make room temperatures higher, and, as noted in a previous study [12], excessively high temperatures increase the mortality risk. They also cause significant discomfort for citizens.
A risk comparison is necessary when making decisions. Many types of indicators have been suggested for quantitative evaluation, and policy makers should choose the most appropriate one from them depending on what kind of society they want. For example, there can be a concept that pursuing well-being should be a goal of mankind, especially in today’s world where our lives are highly civilized and we are living longer. Under the 2030 Agenda for Sustainable Development, which targets “good health and well-being” as one of 17 goals involving both developed and developing countries, importance of well-being is increasing [33]. However, useful indicators that have been suggested, such as quality-adjusted life years (QALY) [34] and disability-adjusted life years (DALYs) [35], did not explicitly consider the effect of well-being.
Traditionally, the idea of minimizing risk has been used to support decision-making. However, maximizing our subjective well-being represents a new perspective that has begun to attract attention. Happy life expectancy (HpLE), which indicates the expected length of time that a person of a certain age can live happily from that moment, is an example of that and we focused on it.
Three forms of happiness were identified in an existing paper: emotional happiness, life evaluation, and eudaimonia [36]. The first two, which are regarded as subjective well-being, have begun to be used for economic evaluation for policy making [37,38,39,40,41]. Subjective well-being has attracted attention because the indicator allows us to evaluate not only the economic impacts, but also many other conditions such as poverty and illness [37]. It is also reported that subjective well- being can be measured by answering simple questions. For example, emotional happiness, which is a type of subjective well-being, can be measured using a simple question about emotions he/she experienced a day ago [38,42]. Moreover, it has been shown that emotional happiness has strong correlation with other types of well-being [43].
Some indicators that take into account the risks to well-being have been developed recently [44,45]. These indicators enable us to compare risks related to well-being that are not limited to death or disability. One of the purposes of this study is to propose and test one such indicator.
This research aims to address the major global problem of climate change by assessing countermeasures using a recently developed indicator, loss of happy life expectancy (LHpLE) [46], which specifically considers well-being. It is based on the assumptions that achieving longer life expectancy is desirable and spending every day happily is also desirable.
For this study, we first analyzed the relationship between well-being and the use of air conditioners using a questionnaire. Then, considering the impacts of both climate change and measures to counter climate change, we quantitatively estimated and compared the decline in well- being due to non-use of air conditioners and the change in the mortality risk due to flood and heatstroke using LHpLE. Our results can be useful for policy makers’ decision-making at national and regional level since the method deals with the case of Japan, although the idea of LHpLE can be applied to other national and international cases.

2. Materials and Methods

2.1. Questionnaire

In order to estimate the effect of well-being, we used an online questionnaire conducted in Japan from 23 September 2016 to 27 September 2016 by Nikkei Research Incorporated. The number of responses was 5734. Those who met the criteria were selected as respondents from among the registrants. In cases where there were not enough responses, additional respondents were selected. Of the respondents, 50% were men and 50% were women. In age, 17% were in their 20s, 20% in their 30s, 20% in their 40s, 18% in their 50s, and 24% in their 60s. They lived in the regions Hokkaido (4%), Tohoku (7%), Kanto (32%), Chubu (17%), Kinki (18%), Chugoku (6%), Shikoku (4%), and Kyushu (11%). The population distributions reported by the Japanese government in 2015 were similar, with 50% men and 50% women. In age, 15% were in their 20s, 20% in their 30s, 23% in their 40s, 19% in their 50s, 23% in their 60s, with a regional distribution of 4% in Hokkaido, 7% in Tohoku, 34% in Kanto, 18% in Chubu, 16% in Kinki, 6% in Chugoku, 3% in Shikoku, and 11% in Kyushu [47]. Individuals who were younger than 20 years old and older than 69 years old and those who lived abroad were excluded in advance.
In order to improve the quality of the questionnaire results, 643 short-time responses were eliminated. This reduced the sample to 5091 of which 49% were men and 51% were women, and 15% were in their 20s, 19% in their 30s, 21% in their 40s, 19% in their 50s, and 26% in their 60s. The regional distribution was as follows: Hokkaido 4%, Tohoku 7%, Kanto 32%, Chubu 17%, Kinki 19%, Chugoku 6%, Shikoku 4%, and Kyushu 12%. A sampling was performed in a sufficient way and statistically verified to be significant. The validity and credibility of the answers were confirmed [43].
The questionnaire was aimed at revealing the relationship between the use of air conditioners and users’ emotional happiness. The important questions are presented in Table 1. Participants were asked to answer several questions, including “Did you use an air conditioner at your house yesterday [yes/no]?” and “Did you experience a feeling of happiness yesterday [yes/no]?”, which were also asked in a previous study [42]. With respect to the latter question, we used the yes/no questioning instead of the Likert scale to follow the previous study [42] and to estimate LHpLE based on four arithmetic operations [46]. In the present case, participants were also asked to answer whether they used an air conditioner the previous day at their workplace. These two situations were analyzed separately, and it was found that the use of air conditioners in the workplace had little influence on the subjective well-being of male and female participants. Therefore, the use of air conditioners in the workplace was ignored. To eliminate confounding effects, participants were also asked to provide further information, including their self-rated state of health, age, sex, region, and occupation. All questions were optional. The detailed method is described in Section 2.3.

2.2. Loss of Happy Life Expectancy

To compare the risk to well-being associated with not using air conditioners to the risks of flood and heatstroke, we used the indicator LHpLE [46]. This measure was used in a previous paper to compare the effects of the risk of cancer due to radiation exposure with psychological distress after the Fukushima disaster in 2011.
Briefly, life expectancy ex is the expected value duration that a person of age x can live from the current moment and is defined as follows:
T x = x l x d t
e x = T x l x
where lx is the number of surviving people at the start of an interval at age x. These were calculated using the surviving probabilities for Japanese men and women [48].
Happy life expectancy at age x (HPLEx) indicates the expected length of time that a person of a certain age can live happily from the age of x and is calculated in the same way as follows:
T H p x = x H p x × l x d t
H p L E x = T H p x l x
where Hpx is the degree of emotional happiness (0–1) at age x.
Hpx represents the number of people who answered “Yes” to the question, “Did you feel happy yesterday?” As mentioned in Section 2.2, the respondents also gave their age, but for this calculation, the average age of all respondents was used.
The value of HpLEx changes when an event that affects an individual’s happiness or probability of survival occurs. When such an event occurs, HpLEx is changed to HpLE’x, and the LHpLEx caused by that event is calculated as follows:
L H p L E x = H p L E x H p L E x
Thus, LHpLE quantitatively represents the negative influence of a disaster or risk. This indicator enables us to compare the impact of an increased mortality rate with the impact of a reduction in well-being.
Here, we focused on flood and heatstroke as mortality risks and changes in emotional happiness due to non-use of air conditioners as a factor that causes a decline in well-being.

2.3. Emotional Happiness

To estimate the extent to which well-being is reduced, we measured the reduction in emotional happiness due to non-use of air conditioners. As mentioned in Section 1, three forms of happiness were identified in an existing paper: emotional happiness, life evaluation, and eudaimonia [36]. In our research, we focused on emotional happiness because it represents and expresses current happiness and fits well with the concept of HpLE.
Emotional happiness was estimated using the results of the questionnaire described in Section 2.2. The responses of male and female participants were analyzed separately. In order to reveal the relationship between the use of air conditioners and users’ emotional happiness, participants were asked whether or not they had used an air conditioner the previous day and whether or not they had experienced a feeling of happiness the previous day. First, we tested the difference in well-being between those who had used an air conditioner and those who had not used an air conditioner using a two-sided chi-squared test.
However, the results may be confounded by factors such as increased use of air conditioners among those with higher incomes, as well as an increased likelihood of feeling happy among this group. To solve this problem, it was necessary to specify covariates. All questions other than “Did you use an air conditioner yesterday?” and “Did you experience a feeling of happiness yesterday?” were taken out of the results and those that correlated with both the use of air conditioners and emotional happiness were selected as covariates. To check the correlations, a chi-squared test was conducted. We found multiple collinearities in these covariates and calculated the variance inflation factors (VIF).
The questions that remained after this procedure are presented in Table A1 and Table A2. Covariates which showed a p-value of 0.1 or less were adopted. We confirmed that VIFs were <10. For males, age, existence of a grandchild and existence of an unemployed family member were used as covariates to estimate the impact of the use of air conditioners on well-being in the subsequent statistical analyses. As mentioned in Section 3.1, the difference in the level of well-being between those who used an air conditioner and who did not use was not significant for females. Therefore, the procedure was conducted only for males. Dummy variables were created for all variables.
To control for confounding effects, we then conducted propensity score matching [49]. Each response to the questionnaire was assigned a propensity score with reference to the selected covariates, which showed the estimated likelihood of a participant using an air conditioner based on the covariates. Each component of the group whose participants did not use an air conditioner on the day before was matched to a component of the other group (i.e., air conditioner users) so that the difference between their two scores was as little as possible. For this process, each component could not have two or more opponents and the difference in the two scores could not be greater than 0.1. Hence, not every component of the smaller group had an opponent.
This enabled us to choose two groups with the same number of elements. We then calculated the percentage of those who had experienced a feeling of happiness the previous day in each group. Using these values, we estimated the LHpLE from non-use of an air conditioner.
To test the difference in emotional happiness between those who used air conditioners and those who did not, we used a one-sided Wilcoxon signed-rank test.
These analyses were conducted using “Matching” [50,51] and “Car” [52]. modules of the free software package R [53]. The results of each calculation conducted using “Matching” varied, so the calculations were conducted 100 times and the median value of LHpLE was adopted.

2.4. Flood Risk

For this research, flood risk was defined as the product of hazard, exposure and vulnerability. Future climate was estimated using the general circulation models, HadGEM2-ES, GFDL-ESM2M, IPSL-CM5A-LR, MIROC-ESM-CHEM, and NorESM1-M. To estimate the areas that might be subject to flooding, which represents a hazard, a hydraulic model CaMa-Flood was used [54].
Considering the flooded area and the population distribution, the exposure population was calculated as follows:
E x p o ( y e a r ) = ( x , y ) J a p a n F l d f r c ( x , y , y e a r ) × P o p ( x , y , y e a r )
E x p o ¯ = y e a r = y s t a r t y e n d E x p o ( y e a r ) ( y e n d y s t a r t )
where Expo(year) is the total exposure population in Japan in a year and Pop(x, y, year) is the population of the mesh (x, y). Fldfrc(x, y, year) is the output value from CaMa-Flood, which represents the fraction of flooded area in the pixel. By this calculation, the average mortality risk from floods in Japan was estimated although the risks vary by regions.
The expected value of Expo(year) was then calculated. The calculation period was 1961–2006 for the historical run and 2010–2099 for the future run.
Vulnerability, which was defined as the ratio of deaths among the entire exposure population, was obtained from existing papers [55,56].
This enabled us to calculate the mortality rate, which was defined as the rate of deaths among the total population, as follows:
M R f l d = E x p o ¯ × V u l
where vul is the vulnerability value.
The value we calculated was different from the value recorded by the Ministry of Health, Labour and Welfare [57]. Therefore, we calculated the ratio of the estimated historical values to the recorded value, and multiplied this by the estimated historical and future values to eliminate bias.
The aim of this research was to estimate risks in the future. However, these are uncertain. Therefore, some future scenarios that had been suggested previously were used. To express changes in natural conditions, including air temperature, we used representative concentration pathways (RCPs) [58]. RCPs are scenarios designed to evaluate the future impact caused by climate change [59]. They describe trends in radiative forcing by setting pathways of changing concentrations of greenhouse gases. Here, RCP2.6 and RCP6.0 were used. RCP 2.6 is a scenario in which mitigation measures are undertaken properly and annual emissions of greenhouse gases decrease gradually. On the other hand, RCP6.0 is a scenario in which the current trend of emissions is unchanged. Of course, radiative forcing in RCP6.0 is 6.0 W/m2 and it is stronger than that in RCP2.6 which is 2.6 W/m2, and air temperature in RCP6.0 is higher than that in RCP2.6. To express changes in the population or society, we used shared socioeconomic pathways (SSPs) [60], specifically SSP1 and SSP3. SSP1 is a scenario in which measures to adopt and mitigate can be conducted properly and sustainable development is well achieved by succeeding in international cooperation. SSP3 is the opposite of SSP1, in which measures to adopt and mitigate are difficult to achieve, as countries are divided and wealth gaps are widening. Here, the flooded area is dependent on the RCP scenarios, and both population distribution and vulnerability are dependent on the SSP scenarios. RCP6.0 and SSP3 were combined as a baseline scenario and RCP2.6 and SSP1 were combined as a scenario in which mitigation measures had been implemented.

2.5. Heatstroke Risk

Heatstroke risk was defined as follows:
M R h e a t ( A g e ) = T R i n c i ( T , A g e ) × R f a t a l ( A g e ) × P r o b ( T ) × 365.25
where MRheat is the mortality rate from heatstroke, Rinci is the incidence rate, Rfatal is the case fatality rate and Prob is the probability that the temperature (T) will be reached. Two age groups (<65, ≥65) were calculated separately because their mortality rates differed significantly.
First, the incidence rate was obtained from the records of the National Institute for Environmental Studies [61,62]. This database shows the relationship between incidence rates and daily maximum temperatures according to the different age classes of those who suffered heatstroke. In this case, the number of incidences was defined as the number of consultations at medical institutions. However, this information was for dozens of large cities in Japan. We used only the case of Tokyo because there were no significant differences among these cities and Tokyo has the largest population. The fact that Tokyo is located in the center part of Japan was another reason for the decision. The incidences of elderly people and non-elderly people were considered separately.
The case fatality rate, which was defined as the number of deaths divided by the number of heatstroke patients, was obtained from the records of the Ministry of Health, Labour and Welfare [58]. This was also calculated separately for elderly and non-elderly people.
The expected probability that each temperature would be reached—Prob in Equation (9)—was estimated using the distribution of daily maximum temperatures in Tokyo because the city’s tempareture is not particularly extreme in Japan and its population is the largest in Japan, which may have a significant impact on mortality risk estimates for the entire region [63]. Using this Prob and the relationship between incidence rates and daily maximum temperatures—Rinci in Equation (9)—the expected annual incidence of heatstroke was estimated. The value obtained was 37,316, which is comparable to the average number of ambulance call-outs for heatstroke: 54,564, obtained from the records for 2011–2018 [58].
This expected probability was assumed to change due to climate change while the incidence rate and the case fatality rate were assumed to be stable. It was assumed that the temperature distribution would shift according to the RCP scenarios. We assumed that the temperature would rise by 1 °C in RCP2.6 and by 2 °C in RCP6.0 in the last 30 years of 21st century.

2.6. Contribution of Each Component to LHpLE in the Current Situation

Here, all the values estimated in the steps detailed in Section 2.3, Section 2.4 and Section 2.5 were used to calculate the contribution of each component to LHpLE in the current situation.
First, the rate of non-use of air conditioners was assumed to be 12.1% in accordance with a report from the Cabinet Office [64]. Therefore, it was assumed that 12.1% of the population did not have an air conditioner and could not use one even when it seemed necessary. Actually, there might be people who do not use air conditioners because they do not like them. However, since estimated ΔHp represents the difference between those who used an air conditioner and those who did not use it without distinguishing those who like it and those who do not like it, that does not seem to matter.
According to a report from the Japan Center for Climate Change Actions [65], air conditioners are used for roughly a quarter of the year in Japan because they are required only on summer days. Using the decline in emotional happiness per person, ΔHp, which can be estimated in Section 2.3, we estimated the annual expected decline in well-being due to not being able to use an air conditioner in the current situation as follows:
Δ H p ¯ = 0.121 × Δ H p × 1 4

2.7. LHpLE in the Future Situation

In the future, the contribution of both flood and heatstroke risk to LHpLE will change. But the contribution of not being able to use an air conditioner could not easily be estimated because customs and technology related to air conditioner use are expected to change dramatically. Therefore, a situation in which the entire population could not use an air conditioner for a single day per year was considered. For this situation, the decline in well-being due to not using an air conditioner was estimated as follows:
Δ H p ¯ = 1 × Δ H p × 1 365.25
This enabled us to compare the mortality risks and the decline in well-being due to not being able to use an air conditioner.

2.8. Ethical Approval

Ethical approval for this study was granted by the ethics committee of the Fukushima Medical University (authorization number 2950) following the guideline [66]

3. Results and Discussion

3.1. Emotional Happiness

The estimated decline in emotional happiness due to non-use of an air conditioner is presented in Table 2. The reduction in the rate of people experiencing a feeling of happiness due to non-use of an air conditioner was greater when the propensity score matching method was not used than when the method was used. This result was reasonable due to the presence of a confounding effect when propensity score matching was not conducted.
Since the reduction among women was not statistically significant in the absence of propensity score matching, only the reduction among men—who had been subjected to the propensity score matching method—was considered. The p-value was 0.03711. The LHpLE due to non-use of air conditioners was estimated for males, and then the half value was used in the later analysis as the gender average since the gender ratio in Japan is almost half and half. It is difficult to explain why gender makes a difference in the result, but a previous study found that there are differences in the factors that affect well-being between men and women [43]. There may be a difference in the way men and women perceive air conditioners or the effects of air conditioning for men and women.
We considered several questions that had been suggested to be significant in previous studies as covariates, but there is a limit to the assessment of causation as a nature of observational study. In this study, we were able to estimate the effect as accurately as possible by using propensity score matching method considering known covariates.

3.2. Flood and Heatstroke Risk

The estimated mortality risks due to flood and heatstroke are shown in Table 3 and Table 4, respectively. The results show that the mortality risk due to flood in the future was lower than that the historical case. This is because flood control structures are expected to be developed in the future, although the hazard would become more serious. As expected, the mortality rate for the RCP6.0 + SSP3 scenario was larger than that for the RCP2.6 + SSP1 scenario.
Regarding heatstroke risk, the mortality rate among elderly people was higher than among non- elderly people, which reflected the current situation. As expected, the risks became greater as the air temperature rose as expected.

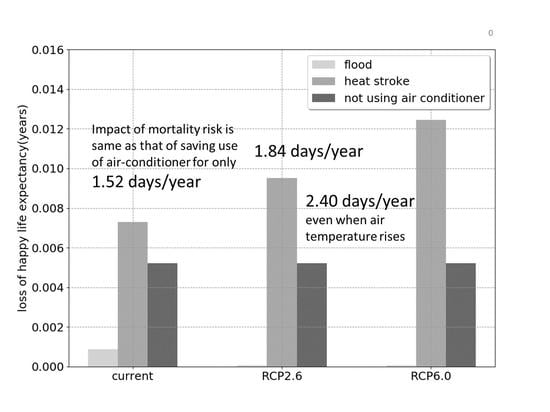
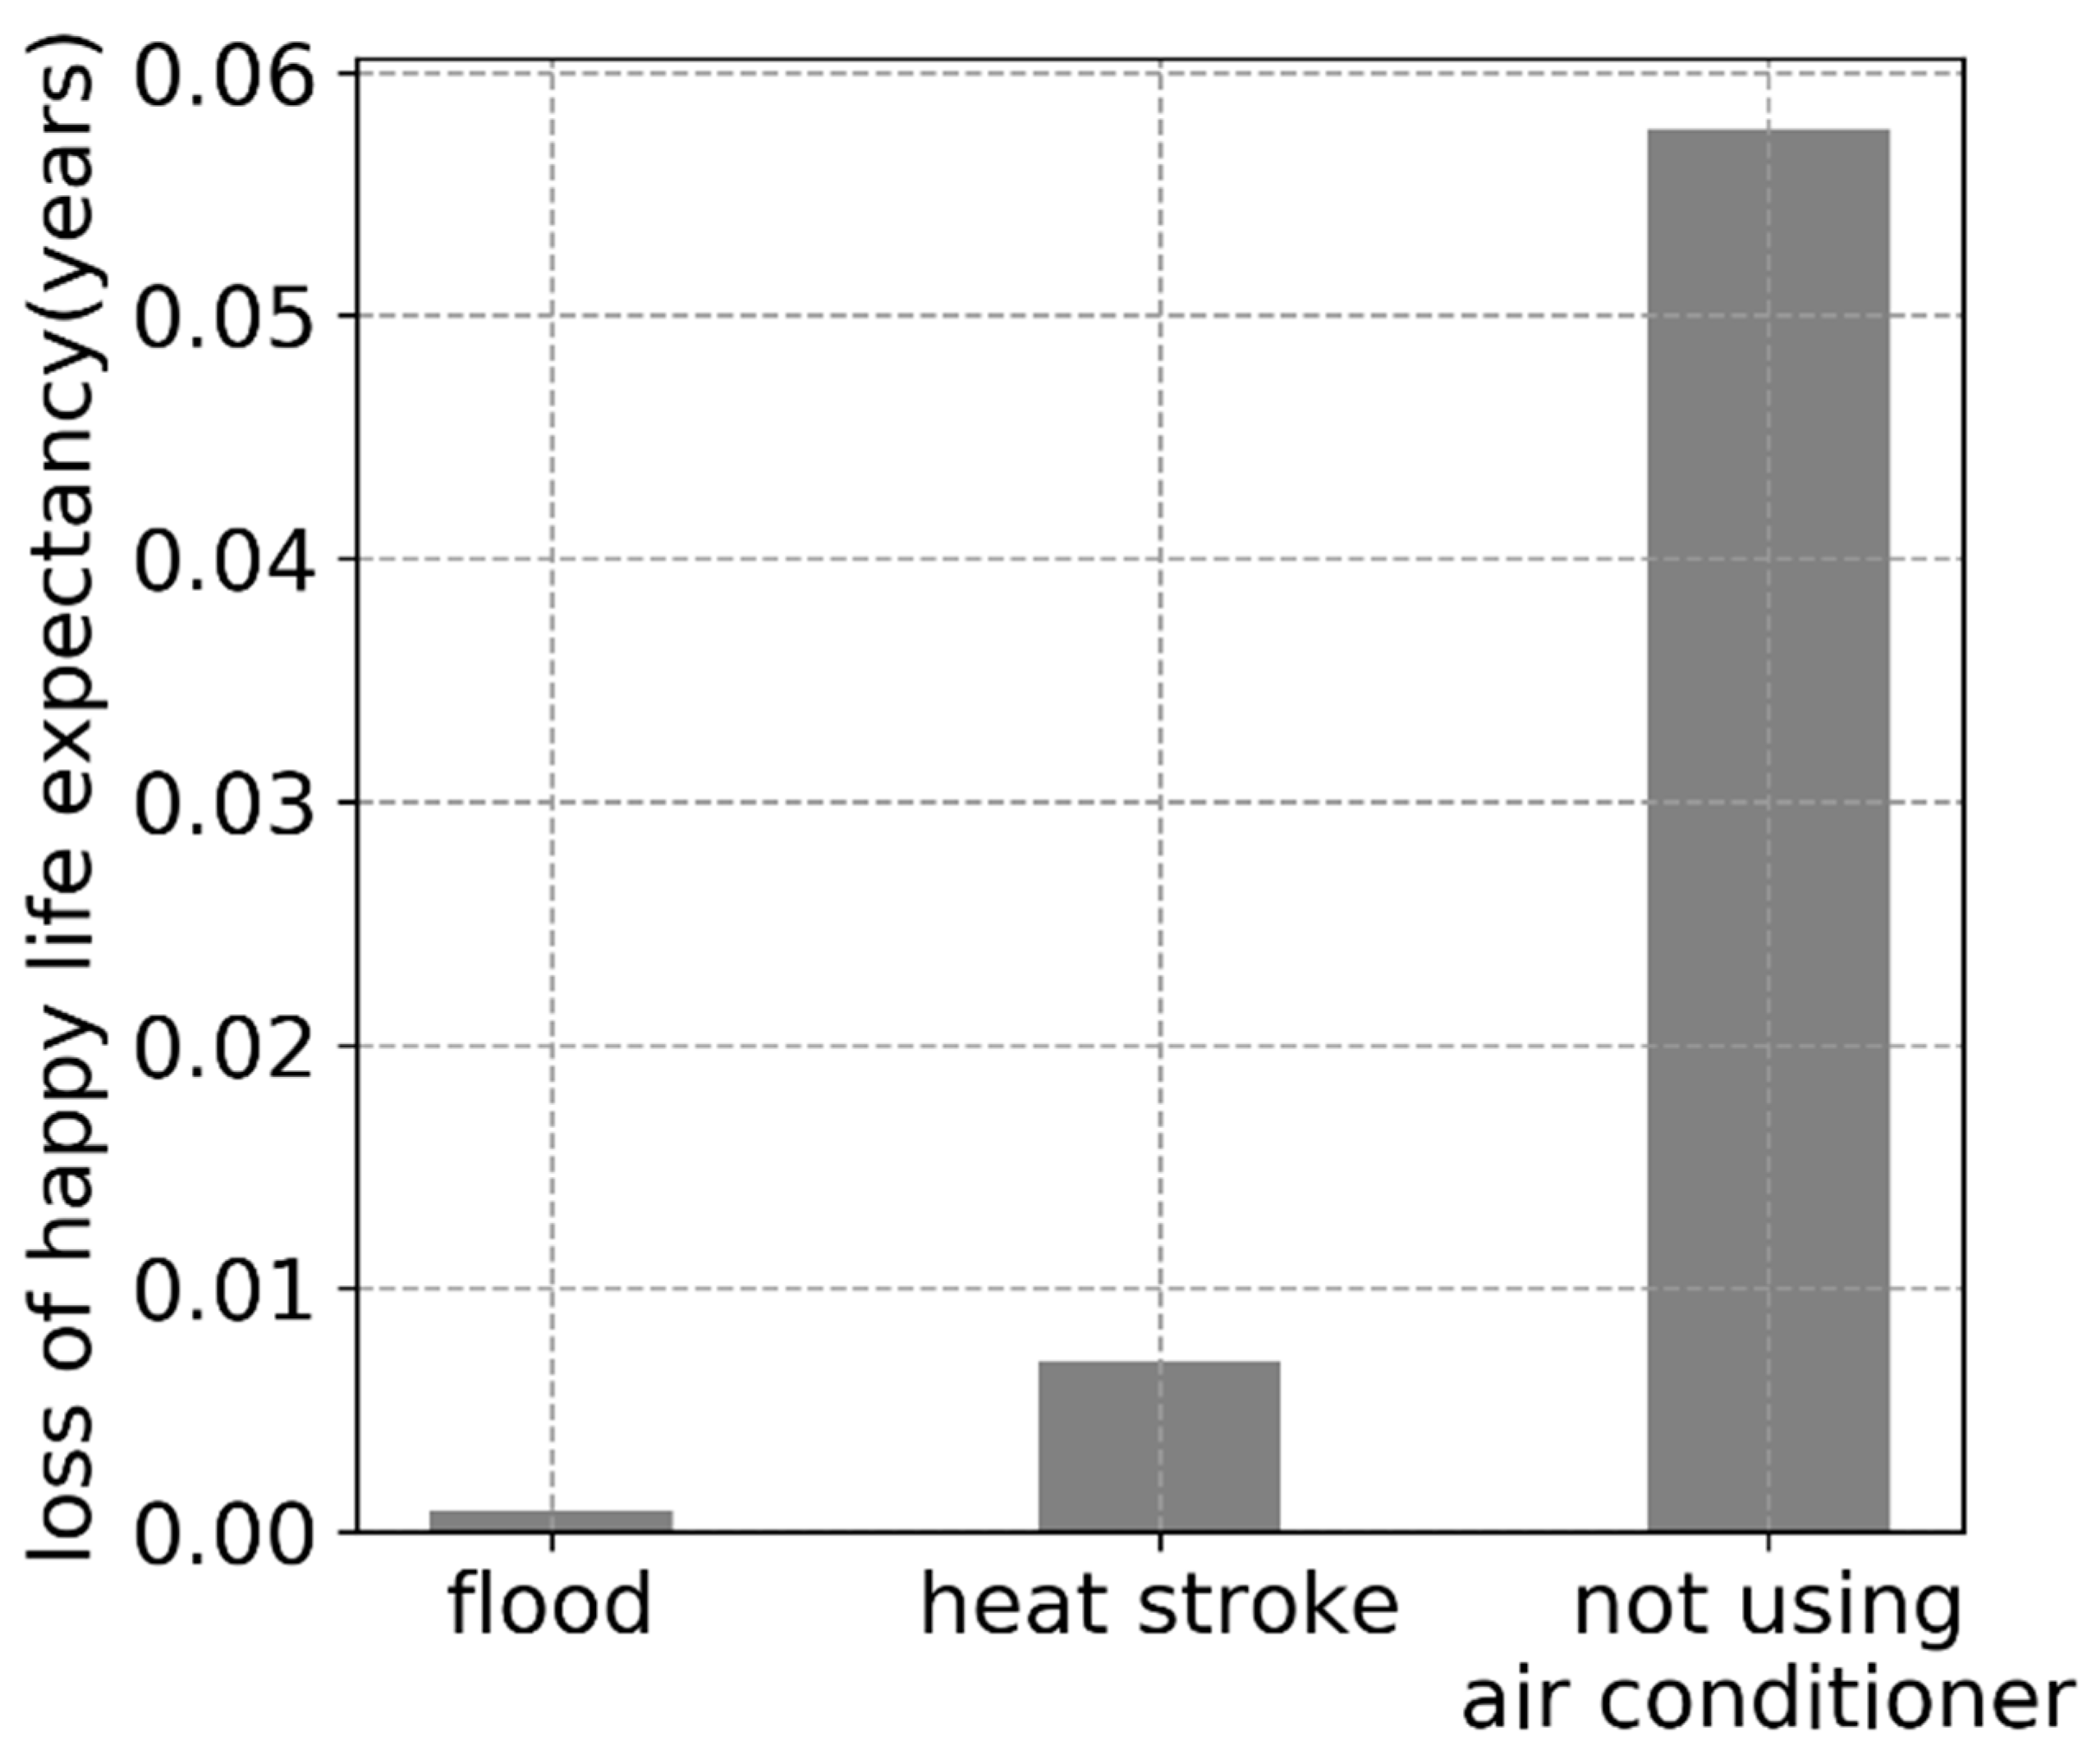
3.3. LHpLE in the Current Situation

From Equation (10), as well as the ΔHp value of 0.04794 obtained for men, the expected decline in well-being due to the inability to use an air conditioner in the current situation can be calculated.
This can be interpreted as the existing discomfort in the current situation. Using this value, the contributions of each of the three factors affecting LHpLE were estimated. These are presented in Figure 1.
The contribution of decline in emotional happiness due to not using an air conditioner to LHpLE was 7.29 times that of the mortality risks from flood and heatstroke combined.

3.4. LHpLE in the Future

The expected decline in emotional happiness in a situation where everyone could not use an air conditioner for a single day per year was estimated in accordance with the procedure described in Section 2.7. The result is shown in Figure 2. It was revealed that the contribution of heatstroke risk was 1.52 times that of not using an air conditioner one day per year in the current situation. This figure was 1.84 times in the RCP2.6 + SSP1 scenario and 2.40 times in the RCP6.0 + SSP3 scenario. This means that if a person did not use an air conditioner for 1.52 days per year, the impact on his or her reduction in well-being would be equal to that of heatstroke risk in the current situation.
In the future, the impact of heatstroke risk is expected to rise, and it can be concluded that this impact would be equal to not using an air conditioner for 2.40 days per year, even in the baseline scenario.

3.5. Required Amount of Saving to Mitigate Climate Change

At present, reducing air conditioner use is recommended as a mitigation measure in Japan. However, as seen the results above show, this could not only increase heatstroke but also reduce well-being. Therefore, it is necessary to calculate how much we should reduce air conditioner use based on this analysis. To tackle this issue, a question was established: “How much should we reduce the use of air conditioners to avoid RCP6.0 and to achieve RCP2.6?”
Here, it was assumed that RCP6.0 + SSP3 would represent the situation if no one refrained from using an air conditioner and RCP2.6 + SSP1 would represent the situation if everyone reduced their use of air conditioning for several days per year. By changing the number of these days, we can identify a point at which the contribution to the decline in well-being by not using an air conditioner and the mortality risk are balanced. The number of days at this point can act as a criterion for judging whether savings are reasonable or not.
The results are shown in Figure 3. The vertical axis shows the difference in LHpLE between the case of RCP6.0 and no saving and between RCP2.6 and some saving. The result bases on LHpLE meant that it would be a reasonable option if saving on air conditioner use for 0.6 days or less per year could help us to achieve RCP2.6. On the contrary, if saving for 0.6 days or more was required to achieve RCP2.6, that would not be a good option.

3.6. Implications

Several implications can be drawn from the results of this study. First, climate change will have an impact on many dimensions of life. Its impact on mortality risk has been well-studied. However, it has been revealed that the impact of climate change on our well-being is not so small that we can ignore it. Taking unbalanced measures might reduce our well-being. The fundamental contribution of this research is that it not only considers mortality or disability but also a reduction in well-being as a kind of risk. We also show that comprehensive indicators, such as LHpLE, can be used to discuss measures to counter climate change. The indicator LHpLE is particularly useful as it can account for factors that reduce quality of life other than mortality and disability. Second, this research compares the risk of a reduction in well-being due to reducing air conditioner use and the risk of mortality by both flood and heatstroke. In particular, the results in Section 3.4 and Section 3.5 show that the negative effects of saving on air conditioners use are not negligible compared to those due to mortality risks. It shows that excessive mitigation can increase the risk of a reduction in well-being. In the future, this dimension should be addressed when considering measures to combat climate change.

3.7. Limitations

The indicator LHpLE accounts for several different types of risks simultaneously and enables us to compare those risks. Thus, we were able to identify how effective refraining from using an air conditioner could be. However, the study has several limitations. First, this analysis focused only on Japan and ignored the impacts of climate change on other countries. Higher temperatures would have a negative influence on most of the world, and the impact of secondary damages such as infectious diseases cannot be ignored when the entire world is considered. Thus, this research may underestimate the risks associated with climate change, so more intense efforts to avoid using air conditioners might be required. Thinking globally seems crucial for establishing realistic countermeasures.
Second, deaths that were not related to heatstroke but that were, nevertheless, caused by high temperature were ignored. According to existing papers, relatively few deaths due to high temperature are caused by heatstroke [67,68]. If the influence of high temperatures on chronic diseases was considered, the mortality rate and the decline in well-being would be far greater. In addition, increased daily minimum temperatures due to climate change can lead to insomnia, which can cause discomfort, illness, and even death [69]. That should be considered as well.
Third, the increase in the mortality rate by avoiding the use of air conditioners was ignored. In fact, most deaths by heatstroke occur indoors and without air conditioning. If this effect was taken into account, the mortality rate would be higher.
Fourth, based on the results of the questionnaire, we estimated the reduction in emotional happiness if people did not use air conditioning, including both those who had and did not have air conditioners. However, in order to conservatively evaluate the reduction in emotional happiness in Section 2.6, we used the reduction in emotional happiness only if people did not have and did not use air conditioners. This seems to be an underestimate, as the reduction in emotional happiness should be much greater if we take into account even those who had air conditioners but did not use them.
In terms of the future situation, this study took into account the two effects of climate change: increased heat stroke risk due to higher temperatures and change of flood risk due to improved flood control and changes in rainfall patterns. However, long-term projections of the future are uncertain, and it is also expected that future air conditioner use will be perceived differently than it is today. In addition, higher temperature may affect subjective well-being by having citizens feel discomfort in the future. Actually, it is difficult to evaluate that effect in the far future using a questionnaire because it is difficult to simulate that situation. Therefore, it is a bit problematic to extrapolate the reduction in emotional happiness to the future situation, and the results must be understood in the light of that.
In addition, if changing the temperatures at which air conditioners are set was considered, the results might be different. In Japan, 28 °C is the recommended temperature for air conditioning. However, it has often been reported that this temperature makes workers uncomfortable. A reduction in individuals’ subjective well-being in the workplace might be detected if this effect was considered.
Finally, in this study, we used LHpLE as an indicator; however, indicators that have been suggested previously should only be used when they are suitable for the purpose in question. When these indicators are used as a means to make a decision to solve a problem, decision-makers must think carefully about which indicator is the most appropriate for the problem in question.

4. Conclusions

In this study, we used the indicator LHpLE to extend the concept of climate change risk. This indicator enabled us to quantitatively compare the effects of increasing mortality risk and a reduction in well-being due to non-use of air conditioners. This information would be useful for developing and evaluating measures to counter climate change. It could also be applied to other fields and other purposes to compare different types of risks.
As a result, the LHpLE due to non-use of an air conditioner was much greater than the LHpLE due to flood or heatstroke in the current situation. In addition, in the future situation, a saving of 1.84 days per year for RCP 2.6 and 2.40 days per year for RCP 6.0 would balance the impact of reduction in well-being with that of the mortality risks. It has been suggested that reducing air conditioner use is not necessarily a viable way of mitigating climate change. This research emphasizes the importance of considering not only the risks due to mortality or disability but also the risks due to a decline in well-being when considering measures to combat climate change. We conclude that comprehensive indicators, such as LHpLE, should be adopted to avoid unbalanced decisions.

Author Contributions

Conceptualization, M.M.; methodology, M.M.; software, R.A.; validation, R.A.; formal analysis, R.A.; investigation, R.A., M.K. and M.M.; resources, R.A. and M.K.; data curation, R.A. and M.K.; writing—original draft preparation, R.A.; writing—review and editing, M.K. and M.M.; visualization, R.A.; supervision, M.K.; project administration, M.K.; funding acquisition, M.K. All authors have read and agreed to the published version of the manuscript.

Funding

This research was funded by the Ministry of Environment, Japan, grant number S-14 (the Environment Research and Technology Development Fund).

Acknowledgments

I would like to thank Masahiro Tanoue (Shibaura Institute of Technology), Yasushi Honda (Tsukuba University), and Yuya Ono for their kind cooperation.

Conflicts of Interest

The authors declare no conflict of interest. The funders had no role in the design of the study; in the collection, analyses, or interpretation of data; in the writing of the manuscript, or in the decision to publish the results.

Appendix A

The result of chi-squared test is shown here.
Table A1. p values of chi-squared test.
Male Total N (%)Happy N (%)Not happy N (%)p
Self-rated healthGood2035 (81.5%)1256 (89.8%)779 (70.9%)<0.001
Bad462 (18.5%)142 (10.2%)320 (29.1%)
Age20s342 (13.7%)178 (12.7%)164 (14.9%)0.007
30s513 (20.5%)273 (19.5%)240 (21.8%)
40s549 (22.0%)309 (22.1%)240 (21.8%)
50s517 (20.7%)279 (20.0%)238 (21.7%)
60s576 (23.1%)359 (25.7%)217 (19.7%)
RegionHokkaido93 (3.7%)60 (4.3%)33 (3.0%)0.58
Tohoku166 (6.6%)90 (6.4%)76 (6.9%)
Kanto807 (32.3%)445 (31.8%)362 (32.9%)
Chubu439 (17.6%)246 (17.6%)193 (17.6%)
Kinki459 (18.4%)262 (18.7%)197 (17.9%)
Chugoku160 (6.4%)92 (6.6%)68 (6.2%)
Shikoku104 (4.2%)51 (3.6%)53 (4.8%)
Kyushu269 (10.8%)152 (10.9%)117 (10.6%)
JobEmployed1648 (66.0%)955 (68.3%)693 (63.1%)<0.001
Self employed278 (11.1%)163 (11.7%)115 (10.5%)
Others571 (22.9%)280 (20.0%)291 (26.5%)
MarriageMarried1469 (58.8%)958 (68.5%)511 (46.5%)<0.001
Unmarried845 (33.8%)351 (25.1%)494 (44.9%)
Others183 (7.3%)89 (6.4%)94 (8.6%)
ChildYes1142 (45.7%)528 (37.8%)614 (55.9%)<0.001
No1355 (54.3%)870 (62.2%)485 (44.1%)
GrandchildYes2208 (88.4%)1196 (85.6%)1012 (92.1%)<0.001
No289 (11.6%)202 (14.4%)87 (7.9%)
Educational backgroundUniversity, College1965 (78.7%)1133 (81.0%)832 (75.7%)0.001
High school, Junior high school532 (21.3%)265 (19.0%)267 (24.3%)
Unemployed familyExist2206 (88.3%)1271 (90.9%)935 (85.1%)<0.001
Not exist232 (9.3%)99 (7.1%)133 (12.1%)
Others59 (2.4%)28 (2.0%)31 (2.8%)
Income<3 million yen/year449 (18.8%)202 (14.4%)267 (24.3%)<0.001
3–6 million yen/year779 (31.2%)436 (31.2%)343 (31.2%)
>6 million yen/year1035 (41.4%)648 (46.4%)387 (35.2%)
Others214 (8.6%)112 (8.0%)102 (9.3%)
SmokingYes2001 (80.1%)1,150 (82.3%)851 (77.4%)0.003
No496 (19.9%)248 (17.7%)248 (22.6%)
Table A2. p values of chi-squared test.
Male Total N (%)Used A/C at house N (%)Not used A/C at house N (%)p
Self-rated healthGood2035 (81.5%)608 (80.6%)1427 (81.9%)0.47
Bad462 (18.5%)146 (19.4%)316 (18.1%)
Age20s342 (13.7%)129 (17.1%)213 (12.2%)<0.001
30s513 (20.5%)158 (21.0%)355 (20.4%)
40s549 (22.0%)168 (22.3%)381 (21.9%)
50s517 (20.7%)166 (22.0%)351 (20.1%)
60s576 (23.1%)133 (17.6%)443 (25.4%)
RegionHokkaido93 (3.7%)13 (1.7%)80 (4.6%)<0.001
Tohoku166 (6.6%)33 (4.4%)133 (7.6%)
Kanto807 (32.3%)219 (29.0%)588 (33.7%)
Chubu439 (17.6%)136 (18.0%)303 (17.4%)
Kinki459 (18.4%)154 (20.4%)305 (17.5%)
Chugoku160 (6.4%)44 (5.8%)116 (6.7%)
Shikoku104 (4.2%)36 (4.8%)68 (3.9%)
Kyushu269 (10.8%)119 (15.8%)150 (8.6%)
JobEmployed1648 (66.0%)508 (67.4%)1140 (65.4%)0.58
Self employed278 (11.1%)78 (10.3%)200 (11.5%)
Others571 (22.9%)168 (22.3%)403 (23.1%)
MarriageMarried1469 (58.8%)448 (59.4%)1021 (58.6%)0.23
Unmarried845 (33.8%)261 (34.6%)584 (33.5%)
Others183 (7.3%)45 (6.0%)138 (7.9%)
ChildYes1142 (45.7%)359 (47.6%)783 (44.9%)0.22
No1355 (54.3%)395 (52.4%)960 (55.1%)
GrandchildYes2208 (88.4%)684 (90.7%)1524 (87.4%)0.02
No289 (11.6%)70 (9.3%)219 (12.6%)
Educational backgroundUniversity, College1965 (78.7%)588 (78.0%)1377 (79.0%)0.57
High school, Junior high school532 (21.3%)166 (22.0%)366 (21.0%)
Unemployed familyExist2206 (88.3%)649 (86.1%)1557 (89.3%)0.03
Not exist232 (9.3%)80 (10.6%)152 (8.7%)
others59 (2.4%)25 (3.3%)34 (2.0%)
Income<3 million yen/year449 (18.8%)144 (19.1%)325 (18.6%)0.13
3–6 million yen/year779 (31.2%)211 (28.0%)568 (32.6%)
>6 million yen/year1035 (41.4%)328 (43.5%)707 (40.6%)
Others214 (8.6%)71 (9.4%)143 (8.2%
SmokingYes2001 (80.1%)596 (79.0%)1405 (80.6%)0.37
No496 (19.9%)158 (21.0%)338 (19.4%)
A/C: air conditioner.

References

  1. Hirabayashi, Y.; Mahendran, R.; Koirala, S.; Konoshima, L.; Yamazaki, D.; Watanabe, S.; Kim, H.; Kanae, S. Global flood risk under climate change. Nat. Clim. Chang. 2013, 3, 816–821. [Google Scholar] [CrossRef]
  2. Arnell, N.; Gosling, S. The impacts of climate change on river flood risk at the global scale. Clim. Chang. 2014, 134, 387–401. [Google Scholar] [CrossRef] [Green Version]
  3. Dastgerdi, A.S.; Sargolini, M.; Allred, S.B.; Chatrchyan, A.; De Luca, G. Climate Change and Sustaining Heritage Resources: A Framework for Boosting Cultural and Natural Heritage Conservation in Central Italy. Climate 2020, 8, 26. [Google Scholar] [CrossRef] [Green Version]
  4. Kharin, V.V.; Zwiers, F.W.; Zhang, X.; Wehner, M.F. Changes in temperature and precipitation extremes in the CMIP5 ensemble. Clim. Chang. 2013, 119, 345–357. [Google Scholar] [CrossRef]
  5. Lee, J.Y.; Ellingwood, B.R. A decision model for intergenerational life-cycle risk assessment of civil infrastructure exposed to hurricanes under climate change. Reliab. Eng. Syst. Saf. 2017, 159, 100–107. [Google Scholar] [CrossRef]
  6. Yoon, E.J.; Lee, D.K.; Kim, H.G.; Kim, H.R.; Jung, E.; Yoon, H. Multi-Objective Land-Use Allocation Considering Landslide Risk under Climate Change: Case Study in Pyeongchang-gun, Korea. Sustainability 2017, 9, 2306. [Google Scholar] [CrossRef] [Green Version]
  7. Wheaton, E.; Kulshreshtha, S. Environmental Sustainability of Agriculture Stressed by Changing Extremes of Drought and Excess Moisture: A Conceptual Review. Sustainability 2017, 9, 970. [Google Scholar] [CrossRef] [Green Version]
  8. Caesar, J.; Lowe, J.A. Comparing the impacts of mitigation versus non-intervention scenarios on future temperature and precipitation extremes in the HadGEM2 climate model. J. Geophys. Res. Space Phys. 2012, 117. [Google Scholar] [CrossRef]
  9. Orlowsky, B.; Seneviratne, S.I. Global changes in extreme events: Regional and seasonal dimension. Clim. Chang. 2011, 110, 669–696. [Google Scholar] [CrossRef] [Green Version]
  10. Sillmann, J.; Kharin, V.V.; Zwiers, F.W.; Zhang, X.; Bronaugh, D. Climate extremes indices in the CMIP5 multimodel ensemble: Part 2. Future climate projections. J. Geophys. Res. Atmos. 2013, 118, 2473–2493. [Google Scholar] [CrossRef]
  11. Honda, Y.; Kondo, M.; McGregor, G.; Kim, H.; Guo, Y.-L.; Hijioka, Y.; Yoshikawa, M.; Oka, K.; Takano, S.; Hales, S.; et al. Heat-related mortality risk model for climate change impact projection. Environ. Heal. Prev. Med. 2013, 19, 56–63. [Google Scholar] [CrossRef] [PubMed]
  12. Gasparrini, A.; Guo, Y.; Hashizume, M.; Lavigne, E.; Zanobetti, A.; Schwartz, J.; Tobias, A.; Tong, S.; Rocklöv, J.; Forsberg, B.; et al. Mortality risk attributable to high and low ambient temperature: A multicountry observational study. Lancet 2015, 386, 369–375. [Google Scholar] [CrossRef]
  13. Lafferty, K.D. The ecology of climate change and infectious diseases. Ecology 2009, 90, 888–900. [Google Scholar] [CrossRef]
  14. Zsarnoczky, M. The future of sustainable rural tourism development—The impacts of climate change. Roczniki (Annals) 2017, 2017, 3. [Google Scholar] [CrossRef] [Green Version]
  15. Shirvani-Dastgerdi, A.; Sargolini, M.; Pierantoni, I. Climate Change Challenges to Existing Cultural Heritage Policy. Sustainability 2019, 11, 5227. [Google Scholar] [CrossRef] [Green Version]
  16. Nobre, C.A.; Sampaio, G.; Borma, L.S.; Castilla-Rubio, J.C.; Silva, J.S.; Cardoso, M. Land-use and climate change risks in the Amazon and the need of a novel sustainable development paradigm. Proc. Natl. Acad. Sci. USA 2016, 113, 10759–10768. [Google Scholar] [CrossRef] [PubMed] [Green Version]
  17. Tezuka, S.; Takiguchi, H.; Kazama, S.; Sato, A.; Kawagoe, S.; Sarukkalige, P.R. Estimation of the effects of climate change on flood-triggered economic losses in Japan. Int. J. Disaster Risk Reduct. 2014, 9, 58–67. [Google Scholar] [CrossRef]
  18. Iizumi, T.; Yokozawa, M.; Nishimori, M. Probabilistic evaluation of climate change impacts on paddy rice productivity in Japan. Clim. Chang. 2010, 107, 391–415. [Google Scholar] [CrossRef] [Green Version]
  19. Nishijima, K.; Maruyama, T.; Graf, M. A preliminary impact assessment of typhoon wind risk of residential buildings in Japan under future climate change. Hydrol. Res. Lett. 2012, 6, 23–28. [Google Scholar] [CrossRef] [Green Version]
  20. Fan, M.; Shibata, H. Simulation of watershed hydrology and stream water quality under land use and climate change scenarios in Teshio River watershed, northern Japan. Ecol. Indic. 2015, 50, 79–89. [Google Scholar] [CrossRef]
  21. King, D.A. Climate Change Science: Adapt, Mitigate, or Ignore? Science 2004, 303, 176–177. [Google Scholar] [CrossRef] [PubMed] [Green Version]
  22. Tol, R.S.J. Adaptation and mitigation: Trade-offs in substance and methods. Environ. Sci. Policy 2005, 8, 572–578. [Google Scholar] [CrossRef]
  23. VijayaVenkataRaman, S.; Iniyan, S.; Goic, R. A review of climate change, mitigation and adaptation. Renew. Sustain. Energy Rev. 2012, 16, 878–897. [Google Scholar] [CrossRef]
  24. 23th Conference of the Parties to the United Nations Convention on Climate Change (COP23). Mitigation, Adaptation and Resilience: The Three Pillars of the Response to Global Warming. 2017. Available online: https://cop23.com.fj/mitigation-adaptation-resilience/ (accessed on 14 October 2020).
  25. McDaniels, T.; Chang, S.; Cole, D.; Mikawoz, J.; Longstaff, H. Fostering resilience to extreme events within infrastructure systems: Characterizing decision contexts for mitigation and adaptation. Glob. Environ. Chang. 2008, 18, 310–318. [Google Scholar] [CrossRef]
  26. OECD. Cost-effective Actions to Tackle Climate Change. 2009. Available online: https://www.oecd.org/env/Policy_Brief_Cost-effective_actions_to_tackle_climate_change.pdf (accessed on 15 January 2020).
  27. Rogelj, J.; Schaeffer, M.; Meinshausen, M.; Knutti, R.; Alcamo, J.; Riahi, K.; Hare, W. Zero emission targets as long-term global goals for climate protection. Environ. Res. Lett. 2015, 10, 105007. [Google Scholar] [CrossRef]
  28. Winkler, H.; Baumert, K.; Blanchard, O.; Burch, S.; Robinson, J. What factors influence mitigative capacity? Energy Policy 2007, 35, 692–703. [Google Scholar] [CrossRef] [Green Version]
  29. UNFCCC. Adoption of the Paris Agreement. 2015. Available online: http://unfccc.int/resource/docs/2015/cop21/eng/l09r01.pdf (accessed on 1 October 2020).
  30. Ministry of the Environment, Japan. Global Warming Prevention Plan. Japanese. 2016. Available online: https://www.env.go.jp/press/files/jp/102816.pdf (accessed on 1 October 2020).
  31. Ministry of the Environment, Japan. Cool Choice: Why 28oC? Japanese. 2020. Available online: https://ondankataisaku.env.go.jp/coolchoice/coolbiz/article/action_detail_004.html (accessed on 31 July 2020).
  32. Ministry of the Environment, Japan. Greenhouse Gas Emissions in 2018. Japanese. 2019. Available online: https://www.env.go.jp/earth/ondanka/ghg-mrv/emissions/results/material/yoin_2018_2_1.pdf (accessed on 14 October 2020).
  33. United Nations. General Assembly Resolution A/RES/70/1: Transforming Our World: The 2030 Agenda for Sustainable Development. 2015. Available online: https://sustainabledevelopment.un.org/post2015/transformingourworld (accessed on 27 August 2020).
  34. Zeckhauser, R.; Shepard, D. Where Now for Saving Lives? Law Contemp. Probl. 1976, 40, 5–45. [Google Scholar] [CrossRef]
  35. Murray, C.J.; Lopez, A.D.; Jamison, D.T. The global burden of disease in 1990: Summary results, sensitivity analysis and future directions. Bull. World Health Organ. 1994, 72, 495–509. [Google Scholar]
  36. Nettle, D. Happiness: The Science Behind Your Smile; Oxford University Press: Oxford, UK, 2005. [Google Scholar]
  37. Fukuda, S.; Murakami, M.; Noda, K.; Oki, T. How Achieving the Millennium Development Goals Increases Subjective Well-Being in Developing Nations. Sustainability 2016, 8, 189. [Google Scholar] [CrossRef] [Green Version]
  38. Graham, C.; Laffan, K.; Pinto, S. Well-being in metrics and policy. Science 2018, 362, 287–288. [Google Scholar] [CrossRef] [Green Version]
  39. Frey, B.S. Happiness: A Revolution in Economics; Massachusetts Institute of Technology Press: Cambridge, UK, 2008. [Google Scholar]
  40. Huang, L.; Frijters, P.; Dalziel, K.; Clarke, P. Life satisfaction, QALYs, and the monetary value of health. Soc. Sci. Med. 2018, 211, 131–136. [Google Scholar] [CrossRef]
  41. Engel, L.; Bryan, S.; Noonan, V.K.; Whitehurst, D.G. Using path analysis to investigate the relationships between standardized instruments that measure health-related quality of life, capability wellbeing and subjective wellbeing: An application in the context of spinal cord injury. Soc. Sci. Med. 2018, 213, 154–164. [Google Scholar] [CrossRef]
  42. Kahneman, D.; Deaton, A. High income improves evaluation of life but not emotional well-being. Proc. Natl. Acad. Sci. USA 2010, 107, 16489–16493. [Google Scholar] [CrossRef] [Green Version]
  43. Murakami, M.; Takebayashi, Y.; Ono, K.; Kubota, A.; Tsubokura, M. The decision to return home and wellbeing after the Fukushima disaster. Int. J. Disaster Risk Reduct. 2020, 47, 101538. [Google Scholar] [CrossRef]
  44. Brazier, J.E.; Rowen, N.; Lloyd, A.; Karimi, M. Future Directions in Valuing Benefits for Estimating QALYs: Is Time Up for the EQ-5D? Value Health 2019, 22, 62–68. [Google Scholar] [CrossRef] [PubMed] [Green Version]
  45. Johnson, R.; Jenkinson, D.; Stinton, C.; Philips, S.T.; Madan, J.; Stewart-Brown, S.; Clarke, A. Where’s WALY? A proof of concept study of the ’wellbeing adjusted life year’ using secondary analysis of cross-sectional survey data. Health Qual. Life Outcomes 2016, 14, 126. [Google Scholar] [CrossRef] [PubMed] [Green Version]
  46. Murakami, M.; Tsubokura, M.; Ono, K.; Maeda, M. New “loss of happy life expectancy” indicator and its use in risk comparison after Fukushima disaster. Sci. Total. Environ. 2018, 615, 1527–1534. [Google Scholar] [CrossRef] [PubMed]
  47. Statistics Bureau of Japan. Japanese Statistics. Japanese. 2017. Available online: http://www.stat.go.jp/data/nihon/02.html (accessed on 22 July 2019).
  48. Ministry of Health, Labour and Welfare, Japan. The 21st Life Tables. Japanese. 2017. Available online: http://www.mhlw.go.jp/toukei/saikin/hw/life/21th/index.html (accessed on 17 April 2018).
  49. Rosenbaum, P.R.; Rubin, D.B. The central role of the propensity score in observational studies for causal effects. Biometrika 1983, 70, 41–55. [Google Scholar] [CrossRef]
  50. Sekhon, J.S. Multivariate and Propensity Score Matching Software with Automated Balance Optimization: The Matching Package for R. J. Stat. Softw. 2011, 42, 1–52. [Google Scholar] [CrossRef] [Green Version]
  51. Diamond, A.; Sekhon, J.S. Genetic Matching for Estimating Causal Effects: A General Multivariate Matching Method for Achieving Balance in Observational Studies. Rev. Econ. Stat. 2013, 95, 932–945. [Google Scholar] [CrossRef] [Green Version]
  52. Fox, J.; Weisberg, S. An {R} Companion to Applied Regression, 3rd ed.; Sage: Thousand Oaks, CA, USA, 2019. [Google Scholar]
  53. R Core Team. R: A Language and Environment for Statistical Computing. 2018. Available online: https://www.r-project.org/ (accessed on 13 February 2012).
  54. Yamazaki, D.; Kanae, S.; Kim, H.; Oki, T. A physically based description of floodplain inundation dynamics in a global river routing model. Water Resour. Res. 2011, 47. [Google Scholar] [CrossRef]
  55. Tanoue, M.; Hirabayashi, Y.; Ikeuchi, H. Global-scale river flood vulnerability in the last 50 years. Sci. Rep. 2016, 6, 36021. [Google Scholar] [CrossRef]
  56. Kinoshita, Y.; Tanoue, M.; Watanabe, S.; Hirabayashi, Y. Quantifying the effect of autonomous adaptation to global river flood projections: Application to future flood risk assessments. Environ. Res. Lett. 2018, 13, 014006. [Google Scholar] [CrossRef] [Green Version]
  57. Ministry of Health, Labour and Welfare, Japan. Demographic Statistics. Japanese. 2018. Available online: https://www.mhlw.go.jp/toukei/list/81-1.html (accessed on 22 July 2019).
  58. IPCC. Climate Change 2014: Synthesis Report. Contribution of Working Groups I, II and III to the Fifth Assessment Report of the Intergovernmental Panel on Climate Change; Core Writing Team, Pachauri, R.K., Meyer, L.A., Eds.; IPCC: Geneva, Switzerland, 2014; p. 151. [Google Scholar]
  59. Van Vuuren, D.P.; Edmonds, J.; Kainuma, M.; Riahi, K.; Thomson, A.; Hibbard, K.; Hurtt, G.C.; Kram, T.; Krey, V.; Lamarque, J.-F.; et al. The representative concentration pathways: An overview. Clim. Chang. 2011, 109, 5–31. [Google Scholar] [CrossRef]
  60. Riahi, K.; Van Vuuren, D.P.; Kriegler, E.; Edmonds, J.; O’Neill, B.C.; Fujimori, S.; Bauer, N.; Calvin, K.V.; Dellink, R.; Fricko, O.; et al. The Shared Socioeconomic Pathways and their energy, land use, and greenhouse gas emissions implications: An overview. Glob. Environ. Chang. 2017, 42, 153–168. [Google Scholar] [CrossRef] [Green Version]
  61. National Institute for Environmental Studies. Occurrence of Heatstroke Patients and Its Future Prediction. Kankyogi 32. Japanese. 2009. Available online: https://www.nies.go.jp/kanko/kankyogi/32/32.pdf (accessed on 20 February 2020).
  62. National Institute for Environmental Studies. Flash Report of Heatstroke Patients. Japanese. 2015. Available online: http://www.nies.go.jp/gaiyo/archiv/risk8/2015/2015report.pdf (accessed on 22 July 2019).
  63. Japan Meteorological Agency. Past Weather. Japanese. Available online: http://www.data.jma.go.jp/gmd/risk/obsdl/index.php (accessed on 22 July 2019).
  64. Cabinet Office. Consumer Confidence Survey. Japanese. 2019. Available online: https://www.esri.cao.go.jp/jp/stat/shouhi/shouhi.html (accessed on 22 July 2019).
  65. Japan Center for Climate Change Actions. Survey of Greenhouse Gas Emissions: Annual Report. Japanese. 2017. Available online: https://www.jccca.org/home_section/images/index_data01_H28.pdf (accessed on 22 July 2019).
  66. The Ministry of Health, Labour and Welfare, Japan. Ethical Guidelines for Medical Research Involving Human Subjects. Japanese. 2017. Available online: https://www.mhlw.go.jp/file/06-Seisakujouhou-10600000-Daijinkanboukouseikagakuka/0000153339.pdf (accessed on 1 October 2020).
  67. Anderson, G.B.; Bell, M.L. Lights Out: Impact of the August 2003 power outage on mortality in New York, NY. Epidemiology 2012, 23, 189–193. [Google Scholar] [CrossRef] [PubMed] [Green Version]
  68. Honda, Y.; Ono, M.; Sasaki, A.; Uchiyama, I. Relationship between daily maximum temperature and death in Kyushu. Jpn. J. Public Health 1995, 42, 260–268. (In Japanese) [Google Scholar]
  69. Martín-Vide, J.; Moreno-Garcia, M.C. Probability values for the intensity of Barcelona’s urban heat island (Spain). Atmos. Res. 2020, 240, 104877. [Google Scholar] [CrossRef]
Figure 1. Contribution of each component to Loss of Happy Life Expectancy (LHpLE) in the current situation.
Sustainability 12 08694 g001
Figure 2. Contribution of each component to LHpLE in current and future situations on the condition that all people save use of an air conditioner by 1 day per year. RCP: Representative Concentration Pathways.
Sustainability 12 08694 g002
Figure 3. How long should we refrain from using air conditioners per year if RCP2.6 could be achieved instead of RCP6.0 just by doing so? RCP: Representative Concentration Pathways, A/C: air conditioner.
Sustainability 12 08694 g003
Table 1. Key questions in the questionnaire.
QuestionAnswer Options
Did you experience a feeling of happiness yesterday?Yes/No
Did you use an air conditioner at your house yesterday?Yes/No
Did you use an air conditioner at your workplace yesterday?Yes/No
Table 2. Decrease of emotional happiness in each case.
ΔHp (Use − Not Use)p-Value
Without MatchingMale0.043430.04963
Female0.0056030.8220
With MatchingMale0.047940.03711
Table 3. Mortality rate by flood in each scenario.
Mortality Rate (Death/Year/Population)
Historical3.83 × 10−7
RCP2.6 + SSP12.88 × 10−8
RCP6.0 + SSP33.31 × 10−8
RCP: Representative Concentration Pathways.
Table 4. Mortality rate by heatstroke in each scenario.
Mortality Rate
(Deaths/Year/Population)
~64 Years Old65 Years Old~
Current1.78 × 10−62.02 × 10⁻⁵
RCP2.62.23 × 10−62.98 × 10⁻⁵
RCP6.02.75 × 10−64.10 × 10⁻⁵
RCP: Representative Concentration Pathways.
Publisher’s Note: MDPI stays neutral with regard to jurisdictional claims in published maps and institutional affiliations.

